Embed Size (px)
Citation preview

ED 302 642
AUTHORTITLE
INSTITUTION
REPORT NOPUB DATENOTE
AVAILABLE FROM
PUB TYPE
EDRS PRICEDESCRIPTORS
DOCUMENT RESUME
CE 051 603
Asefa, Sisay, Ed.World Food and Agriculture. Economic Problems andIssues.Upjohn (W.E.) Inst. for Employment Research,Kalamazoo, Mich.ISBN-0-88099-066-X88148p.; Papers presented during the Annual EconomicsLecture Series (22nd, Kalamazoo, MI, 1986-1987).W. E. Upjohn Institute for Employment Research, 300South Westnedge Avenue, Kalamazoo, MI 49007 ($8.95paperback--ISBN-0-88099-066-X; $15.95hardcover--ISBN-0-88099-067-8).Collected Works - General (020) -- Reports -Research /Technical (143) -- Speeches/ConferencePapers (150)
MF01 Plus Postage. PC Not Available from EM.*Agricultural Education; *Agriculture; DevelopingNations; *Economic Development; Foreign Countries;*Hunger; Postsecondary Education; Poverty; RuralDevelopment; Rural Education; TechnologicalAdvancement; *world Problems
IDENTIFIERS Africa; *Foreign Aid
ABSTRACTThis book contains a series of essays based on public
lectures delivered by six agricultural economists during the1986-1987 academic year at Western Michigan University. Some of themain issues and problems addressed in the essays are the role oftechnical change in agricultural development, the value of learningfrom historical and comparative experience in tackling rural andagricultural development problems, the role of foreign assistance inagricultural and rural development, and the current problem of hungerin Africa. The following essays are included: "Technical Change andAgricultural Development" (Vernon W. Ruttan); "The Political Economyof Agricultural and Rural Development" (Bruce F. Johnston); "ForeignAssistance and Agricultural Development: Implications of the Past 25Years for Policy Conditionality, Capacity Building andSustainability" (Uma Lele); "United States Agriculture in the GlobalContext" (John W. Mellor); "Foreign Assistance and AmericanAgriculture" (C. Peter Timmer); and "Ending African Hunger: SixChallenges for Scientists, Policymakers and Politicians" (Carl K.Eicher). (MN)
Reproductions supplied by EDRS are the best that can be made* from the original document.
WorldFoodandAgricultureSome Problemsand Issues
Sisay AsefaEditor
1988
W. E. UPJOHN INSTITUTE for Employment Research
300 South Westnedge AvenueKalamazoo, Michigan 49007
3

Library of Congress Cataloging4n-Publication Data
World food and agriculture : economic problems and issues : paperspresented in a seminar series / conducted by the Department ofEconomics at Western Michigan University : Sissy Asefa, editor.
p. cm."Presented during the 22nd Annual Economics Lecture Series at
Western Michigan University"Acknowledgmmts.Contents: Introduction / Sissy Asefa - Ending African hunger /
Carl K. Eicher Foreign assistance and agriculture developmentimplications of the past 25 years for policy conditionality,capacity building, and sustainability / Uma Lele Technical changeand agricultural development / Vernon Ruttan The politicaleconomy of agricultural and rural development / Bruce F. JohnstonForeign assistance and American agriculture / C. Peter TimmerUnited States agriculture in the global context / John W. Mellor.
ISBN 0-88099 367-8. ISBN 0-88099-066-X (pbk.)1. Food supplyCongresses. 2. Agricultural assistance
Congresses. 3. Agricultural innovationsCongresses. I. SissyAsefa, 1950- . B. Western Michigan University. Dept. ofEconomics. M. Title: Economics lectare series at Western MichiganUniversity.HD9000.5.W566 1988338.1'9dc19 88-29044
CIPCO
Copyright © 1988 by W. E. Upjohn Institute for Employment Research
THE INSTITUTE, a nonprofit research organiv.tion, was established on July 1, 1945.It is an activity of the W. E. Upjohn Unemployment Trustee Corporation, which wasformed in 1932 to administer a fund set aside by the late Dr. W E. Upjohn for thepurpose of carrying on "research into the causes and effects of unemployment andmeasures for the alleviation of unemployment."
The facts presented in this study and the observations and viewpoints expressed arethe sole responsibility of the author. They do not necessarily represent positions ofthe W. E. Upjohn Institute for Employment Research.
4

The Board of Trusteesof the
W. E. UpjohnUnemployment Trustee Corporation
Preston S. Parish, ChairmanCharles C. Gibbons, Vice Chairman
James H. Duncan, Secretary-Treasurer
E. Gifford Upjohn, M.D.Mrs. Genevieve U. Gilmore
John T. BernhardPaul H. Todd
David W. Breneman
Ray T. Parfet, Jr.
The Staff of the Institute
Robert G. SpiegelmanExecutive Director
Judith K. GentryH. Allan Hunt
Timothy L. HuntLouis S. Jacobson
Christopher J. O'LearyRobert A. Straits
Stephen A. Woodbury
Jack R. Woods
iii
5

ACKNOWLEDGEMENTS
The papers in this volume were presented during the 22nd Annual EconomicsLecture Series at Western Michigan University. The series was made possi-ble through the financial support of the W. E. Upjohn Institute for Employ-ment Research and the College of Arts and Sciences of Western MichiganUniversity. I am grateful to my colleagues in the Department of Economics,who assisted and cooperated during the progress of the series. The editorialsuggestions and services of Judith Gentry and the staff of the W. E. UpjohnInstitute for Employment Research are highly appreciated.
I am, of course, most grateful to the authors of the papers, without whosecooperation the publication of this volume would not have been possible.
iv
CONTENTS
IntroductionSisay Asefa
Western Michigan University
Technical Change and Agricultural DevelopmentVernon W. Ruttan
University of Minnesota
1
9
The Political Economy of Agricultural and Rural Development 35Bruce F. Johnston
Stanford University
Foreign Assistance and Agricultural DevelopmentImplications of the Past 25 Years for Policy Conditionality,
Capacity Building and SustainabilityUma Le le
The World Bank
United States Agriculture in the Global ContextJohn W. Mellor
International Food Policy Research Institute
Foreign Assistance and American AgricultureC. Peter Timmer
Harvard University
Ending African HungerSix Challenges for Scientists, Policymalcers and Politicians
Carl K. EicherMichigan State University
v
47
67
87
123

Introduction
Sisay AsefaWestern Michigan University
The Department of Economics of Western Michigan University wasfortunate to attract six eminent agricultural economists to its 1986-87lecture-seminar series to address various dimersions of the problem ofworld food and agriculture. This book contains six essays based on thepublic lectures delivered by the guest scholars during the 1986-87academic year.
This introductory chapter will address and synthesize some of themain issues and problems of world food and agriculture and !eave thereader to pursue the detailed discussion and analysis of the issues bythe individual authors. The essays are presented in the order of thescholar's appearance i the lecture-seminar series.
Some of the main issues and problems addressed in the essays are;(1) the role of technical change in agricultural development; (2) the valueof learning from historical and comparative experience in tackling ruraland agricultural development problems; (3) the role of foreign assistancein agricultural and rural development; and (4) the current problc m ofhunger in Africa.
The Role of Technical Change in Agricultural Development
The issue of technical change in agricultural development is mostex-tensively explored in Vernon Ruttan's essay. In his model of "inducedtechnical change," Ruttan stresses the idea that technical change is in-digenous, that is, made possible by farmers' responses to differencesin availability and relative prices of resources.
1

He argues that differences in the economic environment and resourceendowment are critical in influencing the direction of technical change.He supports nis argument by presenting empirical evidence based onhistorical data on the experience of Japan and the United States inagricultural development. He points out that Japan adopted a biologicaland chemical agricultural technology that is land-substituting and labor-augmenting primarily as a response to the relative scarcity of arableland it faced during its historic agricultural development. On the otherhand, the United States adopted a mechanical agricultural technologythat is labor-substituting and land-using because it had relatively abun-dant arable land and scarce labour during its historic period of agriculturaldevelopment. Ruttan shows, using comparative data of the two coun-tries, that the difference in long-term trends in relative factor prices"induced" the different paths of technological change adopted by eachcountry.
Bruce Johnston extends the issue of technical change beyond the critical
role of relative factor prices and resource endowments by pointing outthat the promotion of technical change in agriculture is not automaticand self-generating. He argues that the promotion of technical changerequires active participation by both private and public institutions. Theprivate aspect of technical change is determined by what he calls "farm -level factors" that require investments in land improvement, equipment,fertilizer, improved crop and livestock varieties, working capital, andskills of farmers. Individual farmers are in the best position to under-take the decision about the proper acquisition and utilization of thesefactors, while government can play a supportive role. On the other hand,inappropriate government policies, such as unfavourable price policyto farmers, can impede the development of these farm-level factors.
Successful adoption of farm-level technologies also requires whatJohnston calls "socially determined facts" such as agricultural research,an extension system, and infrastructure, as well as appropriatemacroeconomic policy environment. The latter factors, which are com-plementary to the farm-level factors, are beyond the control of individualfarmers. They can best be provided by government.
The resource endowment situation of most developing countries ischaracterized by abundant rural labor that calls for effective utilization

Introduction 3
in the agricultural sector which in turn requires the adoption of labour-intensive chemical and biological technology as the most appropriateform of technical change. Chemical and biological technology that isyield-increasing is characterized by complementarity between inputs suchas fertilizer and water: This implies that in a tropical and semi-arid en-vironment, successful adoption of such technology requires adequatewater availability that can only be provided by irrigation in the absenceof reliable rainfall and the presence of recurrent drought.
Moreover, environmentally-specific chemical and biologicaltechnologies are not on the shelf for some tropical regions of the worldsuch as Sub-Saharan Africa. It is therefore important to take up thechallenge as stated by Ruttan: "Over the next few decades to developagricultural research capacity in each agro-climate region of the worldin order to take advantage of development in biological/chemicaltechnology."
The critical obstacle to generation and adoption of agriculturaltechnology in the future may not be the lack of scientific and technicalchange, but may arise from domestic economic policy and political bar-riers to technical progress in the agriculture of many developingcountries.
The Value of Learning from Historical and Comparative Experiencein Tackling Rural and Agricultural Development Problems
Lessons from historical experience of other countries are quite valuablein tackling problems of rural and agricultural development, providedthey are correctly understood and applied. The significance of past ex-perience in understanding the poverty problem in general is stated byT.W. Schultz in his inaugural lecture for winning the Nobel prize indevelopment economics as follows: "Understanding the experience ofpoor people over the ages can contribute much to understanding theproblems and possibilities of low-income countries today. That kindof understanding is far more important than the most detailed and ex-act knowledge about the surface of the earth, or of ecology, or of tomor-row's technology.",
1 0

The historical experience of Japan and the United States in choosingthe technological path appropriate to their relative resource endowmenthas already been pointed out. Further, as argued in Johnston's essay,the Japanese experience is perhaps the most relevant for today's develop-ing countries, since it involved increasing small farm productivity byadopting labor-intensive biological/chemical technology in the form offertilizer and improved crop varieties as well as the concurrent develop-ment of agriculture and industry which allowed positive interaction be-tween the two sectors and gradual absorption of labour by industry andother sectors of the economy. If agricultural productivity had not risento provide adequate food supplies, the terms of trade would have turn-ed against the industrial sector retarding the growth of the Japaneseeconomy. However, this was prevented by Japan's successful adop-tion of biological and chemi technology which increased food pro-duction as well as provided necessary employment during the historictransformation of the economy.
Comparative lesssons from a more recent experience of other develop-ing countries, such as India and China, also have some useful implica-tions for regions of the currently deficient agriculture and food pro-duction, such as Sub-Saharan Africa. The Indian case is presented byUma Lele who reminds us that, after the earlier policies that under-valued agriculture and contributed to the food crisis of the 1960s, Indialater carried out an economic reform which included the developmentof a strong agricultural research system and an effective fertilizerdistribution network, raised farm commodity prices, and provided in-centives to farmers to use fertilizer and new crop varieties. Lele pointsout further tht the food situation of India before and during the reform20 years ago was similar to the current food and agricultural situationin Ethiopia and Sub-Saharan Africa.
While the institutional context is different, China's simultaneous em-phasis on rural and agricultural development and rural industrializa-tion featured by small labor-intensive rural industries also provides avaluable lesson. Furthermore, China's experience with the organiza-tion of agriculture demonstrates a valuable lesson about the limitationof collectivized agriculture as a viable economic unit of agriculturaldevelopment. After a long experience with collective farming, China

it
Introduction 5
found that even small collective farms posed serious incentive andmanagerial problems and introauced, since 1981, reforms that haveessentially returned Chinese agriculture to a system of individualhousehold fanning units.
Valuable:lessons from comparative experience can be drawn not on-ly from similarities but from dissimiltaks, as stated by Lele. She pointsout that, while Africa and India are of about the same geographical size,Africa is much more diverse, constituting some 50 different nations,about one thousand ethnic groups, and several thousand languages. In-dia, on the other hand, is one country with less diversity than Africa.More significantly, Lele states that India's food production problemwas simplified by the fact that it was primarily a problem of increasingthe production of wheat and rice, for which technology was beingdeveloped by the international research centres in cooperation with In-dian agricultural scientists. The current food production problem inAfrica, on the other hand, is mare complex than the Indian case, sinceit means the development and adoption of techn )logies for a more com-plex and diverse food grain system, such as sorghum, millet, maize,cassava, root crops, for most of which environmentally-specific andlocally tested technologies have not been developed.
The Role of !Foreign Assistancein Agricultural and Rural Development
Foreign assistance can play an important rote in agricultural and ruraldevelopment provided that it is properly focused and utilized inalleviating rural poverty. Considerable experience with foreign assistanceIns been gained over the past few dec..ies to help dirtinguish betweenwhich types of assistance have been successful and unsuccessful. Foreignassistance has the greatest potential to succeed when it is focused onagricultural and rural development. As John Mellor notes, this is becauseof the employment- and income-generating implication of agriculturethat make increased food production and increased employment "twosides of the same coin." Increased food production can initiate multi-
6 Asefa
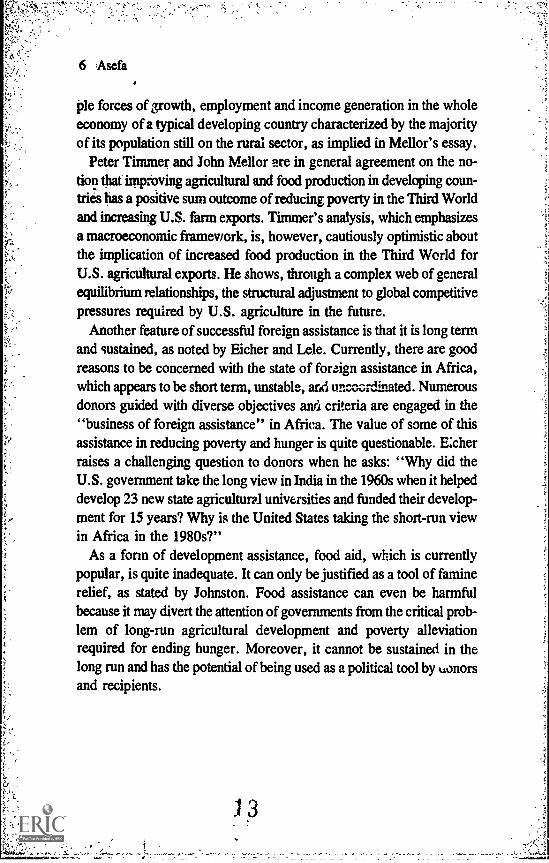
ple forces of growth, employment and income generation in the wholeeconomy of a typical developing country characterized by the majorityof its population still on the rural sector, as implied in Mellor's essay.
Peter Timmer and John Mellor axe in general agreement on the no-tion that improving agricultural and food production in developing coun-tries has a positive sum outcome of reducing poverty in the Third Worldand increasing U.S. farm exports. Timmer's analysis, which emphasizesa macroeconomic framework, is, however, cautiously optimistic aboutthe implication of increased food production in the Third World forU.S. agricultural exports. He shows, through a complex web of generalequilibrium relationships, the structural adjustment to global competitivepressures required by U.S. agriculture in the future.
Another feature of successful foreign assistance is that it is long termand sustained, as noted by Eicher and Lele. Currently, there are goodreasons to be concerned with the state of foreign assistance in Africa,which appears to be short term, unstable, and uncoonlinated. Numerousdonors guided with diverse objectives and criteria are engaged in the"business of foreign assistance" in Africa. The value of some of thisassistance in reducing poverty and hunger is quite questionable. Etcherraises a challenging question to donors when he asks: "Why did theU.S. government take the long view in India in the 1960s when it helpeddevelop 23 new state agricultural universities and funded their develop-ment for 15 years? Why is the United States taking the short-run viewin Africa in the 1980s?"
As a fonn of development assistance, food aid, which is currentlypopular, is quite inadequate. It can only be justified as a tool of faminerelief, as stated by Johnston. Food assistance can even be harmfulbecause it may divert the attention of governments from the critical prob-lem of long-run agricultural development and poverty alleviationrequired for ending hunger. Moreover, it cannot be sustained in thelong run and has the potential of being used as a political tool by uonorsand recipients.
Introduction 7
The Current Problem of Hunger in Africa
The cortemporary problem of hunger in Africa is most directly ad-dressed in Carl Eicher's essay, where he outlines six challenges thatmust be faced by scientists, policymakers and politicians in order toend hunger in Africa. I find three of these challenges especially crucial.One challenge posed by Eicher to African politicians and governmentsis to look back and learn from their own experience of recent historyand correct the mistaken economic policies that undervalued agricultureand food production, and to face up to the fundamental fact thatagricultural development is an evolutionary and complex process thatdoes not lend itself to rhetoric, ideology, or crash food production cam-paigns. Current and future generations of African policymakers mustlearn from the painful experience of some African nations that wasteda generation on revolutionary rhetoric and ideological entanglement inglobal power politics, and on hasty, ill-planned rural and agriculturalexperimentation that has contributed to increasing mass poverty andhunger.
Another challenge is the need to make a critical investment in humancapital development and carry out necessary educational reforms awayfrom the colonial elitist model that sets wrong curriculum priorities andundermines technical and agricultural education. For instance, theUniversity of Botswana, 22 years after independence, does not havea faculty of engineering or technology, and its faculty of agricultureis just being launched during the current academic year.
The final challenge posed by Eicher is the need for policymakers,both donors and recipients, to focus in what he calls "the prime movers"of agricultural development, such as new technology generation andadoption, human capital and managerial skill development, biologicaland physical capital development, institutional development and im-plementation, as well as development of an economic policy environ-ment favorable to agriculture and food production. It is important, aspointed out by Eicher, for donors and African governments to makelong-term and sustained investments simultaneously on all of these"prime movers" due to their complementary and lengthy gestation

8 Asefa
period. Emphasis on one factor, such as the one currently prescribedby the International Monetary Fund (IMF) and the World Bank for mak-ing domestic price policy reform in exchange for additional loans andgrants can be ineffective. In other words, policy initiatives such asdomestic currency devaluation, abolishing price controls, eliminatinggovernment grain boards and fertilizer subsidies, when carried out isisolation without any clear guidelines and assistance to manage thepolitical and economic consequences, will be unlikely to succeed, asEicher's essay implies.
In sum, African governments and policymakers must take the primaryresponsibility and effort in restructuring their domestic policy environ-ment. Donors can assist in complementing this effort by making anecessary long term and sustained investment in agricultural and rural
development.
NOTE
1. See the Nobel Lecture by T.W. Schultz "The Economics of Being Poor," Journal of PoliticalEconomy, 1980, 88, 4, p. 641.
15

Technical Changeand
Agricultural Development
Vernon W. RuttanUniversity of Minnesota
We are, in the closing years of the twentieth century, completing oneof the most remarkable transitions in the history of agriculture. Priorto this century, almost all increase in food production was obtained bybringing new land into production. There were only a few exceptionsto this generalizationin limited areas of East Asia, in the Middle East,and in Western Europe. By the end of this century, almost all of theincrease in world food production must come from higher yieldsfromincreased output per hectare. In most of the world, the transition froma resource-based to a science-based system of agriculture is occurringwithin a single century. In a few countries this transition began in thenineteenth century. In most of the presently developed countries it didnot begin until the first half of this century. Most of the countries ofthe developing world have been caught up in the transition only sincemid-century.
Models of Technical Change in Agriculture
The traditional literature on agricultural development can be classifiedunder five general headings. These are (1) the resource exploitation,(2) the conservation, (3) the location, (4) the diffusion, and (5) the high-payoff input models.
9

The Resource Exploitation Model
Throughout most of history, expansion of the area cultivated or grazedhas represented the dominant source of increase in agricultural produc-tion. The. Most dramatic example in western history was the openingup of the new continentsNorth and South America and AustraliatoEuropean settlement during the eighteenth and nineteenth centuries. Withthe advent of cheap transport during the latter half of the nineteenthcentury, the countries of the new continents became increasingly im-portant sources of food, and agricultural raw materials for themetropolitan countries of Western Europe.
Similar processes had occurred earlier, though at a less dramatic pace,in the peasant and village economies of Europe, Asia, and Africa. Theagrarian colonization of the Indus and Ganges river valleys occurredin the third millennium B.C. The first millennium A.D. saw theagricultural colonization of Europe north of the Alps, the Chinese set-tlement of the lands south of the Yangtze, and the Bantu occupationof Africa south of the tropical forest belts. Intensification of land usein existing villages was followed by pioneer settlemen:, the establish-ment of new villages, and the opening up of forest or jungle land tocultivation. In Western Europe there was a series of successive changesfrom neolithic forest fallow to systems of shifting cultivation of bushand grassland followed first by short fallow systems, and later by an-nual cropping.
Where soil conditions were favorable, as in the great river basins andplains, the new villages gradually intensified their system of cultiva-tion. Where soil resources were poor, as in many of the hill and uplandregions, new areas were opened up to shifting cultivation or nomadicgrazing. Under conditions of rapid population growth, the limits to theresource exploitation model were often quickly realized. Crop yieldswere typically lowmeasured in terms of output per unit of seed ratherthan per unit of crop area. Output per hectare and per man-hour tendedto declineexcept in the delta areas of Egypt and South Asia and inthe wet rice areas of East Asia. In many areas the result was increasingburden on the peasantry.
Technical Change 11
Agriculture carried on within the framework of the resource exploita-tkin model was, in most parts of the world, capable of supporting onlyvery limited urban concentrations,---trading centers and seats of govern-nient. MOst food was consumed in_the village in which it was produc-ed.'moth gthe surplus that did become available was extracted fromthe village by: the landlords in the form of rents, and by the church inthe-form of tithes. The !kited surplus that could be accumulated ex-eitedU decisive impact on political organizations. Charlemagne's cam-paigns against the Germans to extend his Frankish kingdom could notbe waged Until early summer. The great heavy horses that carried hisarmed knights had to be out on grass, after a winter on poor feed, longenough to get in Condition.
There are relatively few remaining areas of the world where develop-ment along the lines of the resource exploitation model will representan efficient source of growth during the last two decades of the twen-tieth century. The 1960s saw the "closing of the frontier" in most areasof Southeast Asia. In Latin American and Africa, the openirg up ofnew lands awaits development of technologies for the control of pestsand diSeases (such as the tsetse fly in Africa) or for the release andmaintenance cif productivity of problem sons. The decline in food pro-duction that has been experienced in many African countries over thelast several decades is an insistent reminder that agricultural growthalong the lines described by the resource exploitation model is no longera reliable source of growth in food production.
The Conservation Model
The conservation model .of agricultural development evolved fromthe advances in crop and livestock husbandry associated with the Englishagricultural revolution and the notions of soil exhaustion suggested bythe early Cennan chemists and soil scientists. It was reinforced by theapplication to land of the concept, developed in the English classicalschool of economics, of diminishing returns to labor and capital.
Until well into the twentieth century, the conservation model ofagricultural development was the only approach to intensification of

i2 *t!tra4
agriOultural production available to most of the world's farmers. Its ap-rptiCatioa is effectively illustrated by the development of the wet riceOulture.SySterns that emerged in East and Southeast Asia and by the labor-
andliiid4fitensive systems of integrated crop-livestock husbandry whichiniereasuigly:Characterited- European agriculture during the eighteenthand ifineteenth- centuries.
During the English agricultural revolution, more intensive crop rota-tion iysteMs replaced the open-three-field system in which arable landwas allocated between permanent cropland and permanent pasture. Thisinvolved the introduction and more intensive use anew forage and greenmanure crops and an increase in the availability and use of animalmanures. This "new husbandry" permitted the intensification of crop-livestock production through the recycling of plant nutrients, in the formof animal manures, to maintain soil fertility. The inputs used in thisconservation system of farmingthe plant nutrients, animal power, landimprovements, physical capital, and agricultural labor forcewere large-ly produced or supplied by the agricultural sector itself.
Agricultural development, within the framework of the conservationmodel, clearly was capable in many parts of the world of sustainingrates of growth in agricultural production in the range of 1.0 percentper year over relatively long periods of time. The most serious recenteffort to develop agriculture within this framework was made by thePeople's Republic of China in the late 1950s and early 1960s. It becamereadily apparent, however, that the feasible growth rates, even witha rigorous recycling effort, were not compatible with modern rates ofgrowth in the demand for agricultural outputwhich typically fall in-the 3-5 percent range in the less developed countries (LDCs). The con-servation model remains an important source of productivity growthin most poor countries and an inspiration to agrarian fundamentalistsand the organic fanning movement in the developed countries.
The Location Model
Initially, the location model was formulated in Germany by J.H. vonThiinen to explain geographic variations in the intensity of farmingsystems and the productivity of labor in an industralizing society. In
19

Technical Change 13
the United States, it was extended to explain the more effective perfor-mance of the input and product markets in regions of rapid urban-industrial development than in regions of slower urban-industrialdevelopMent. In the 1950s, interest in the location model reflected con-cern With.the failure of agricultural resource development and pricepolicies; adopted in the 1930s, to remove the persistent regionaldisparities in agricultural productivity and rural incomes in the UnitedStates.
The rationale for this model was developed in terms of more effec-tive input and product markets in areas of rapid urban-industrial develop-ment. industrial development stimulated agricultural development byexpanding the demand for farm products, supplying the industrial in-puts needed to improve agricultural productivity, and drawing awaysurplus labor from agriculture. The empirical tests of the loca ion modelhave confirmed repeatedly that a strong nonfarm labor market is a prere-quisite for labor productivity in agriculture and improve.' incomes forrural people.
The policy implications of the location model appear to be most rele-vant for less developed regions of highly industrialized countries or lag-ging regions of the more rapidly growing LDCs. Agricultural develop-ment policies based on this model appear to be particularly inappropriatein those countries where the "pathological" growth of urban centersis a result of population pressures in rural areas running ahead of employ-ment growth in urban areas.
The Diffusion Model
The diffusion of better husbandry practices was a major source ofproductivity growth even in premodem societies. The diffusion of cropsand animals from the new world to the oldpotatoes, maize, cassava,rubberand from the old world to the newsugar, wheat, and domesticlivestockwas an important by-product of the voyages of discoveryand trade from the fifteenth to the nineteenth centuries.
Diffusion of crops and animals had historically proceeded as a by-product of trade, discovery and migration. The diffusion of maize tothe Old World is an example. Within a decade after Columbus had first
20

14 Ruttan
displayed Indian Corn (maize) at the Spanish court, it was being grownin the Po Valley in Northern Italy. In that relatively short time it haddiffused from Spain and across North Africa to Turkey and was brought
to the Po Valley by Venetian traders.By the latter part of the nineteenth century, all major agricultural na-
tions were actively engaged in organized crop exploration and introduc-tion. The famous trip of Captain Bligh to the South Pacific, describedin the book and the film, Mutiny on the Bounty, was undertaken as acrop exploration mission. His assignment was to bring back breadfruit
seedlings and wild sugarcane cultivars.Botanical gardens were established by the great colonial powers
primarily to serve as crop introduction stations. The diffusion of rub-ber from Brazil to Southeast Asia illustrates their role. When the pro-cess of vulcanization was inventedmaking it possible to produce such
desirable products as rubber boots, raincoats and tyresthe price ofnatural rubber, produced from wild trees in the Amazon basin of Brazil,
skyrocketed. Brazil made it illegal to export either rubber seeds or rubberplants. The British sent a botanical expedition to Brazil with the osten-sible purpose of collecting plants that had medicinal value, but they alsobrought back rubber seeds. The seeds were first sprouted at the RoyalBotanical Garden at Kew. The seedlings were then transferred to thebotanical gardens at Kandy (Ceylon) and in Singapore. The Kandy seed-lings died but the Singapore seedlings lived and became the foundation
stock of the rubber industry in Southeast Asia.In the early post -World War II period, the diffusion model provided
the intellectual foundation for technical assistance to developing coun-tries. President Truman talked about American "know- how show-how." The naive diffusion approach drew on the empirical observa-tion of substantial differences in land and labor productivity amongfarmers and regions. The route to agricultural development in this view
was through more effective dissemination of technical knowledge and
the narrowing of productivity differences.The diffusion model has provided the major intellectual foundation
of much of the research and extension effort in farm management andproduction economics since the emergence, in the latter years of the

Technical Change 15
nineteenth century, of agricultural economics and rural sociology asseparate subdisciplines linking the agriculture, and the social sciences.Developments leading to the establishment of active progrias of farmmanagement research and extension occurred at a time when experi-ment station research was making only a m -.lest contribution toagricultural productivity growth. A further contribution to the effec-tive diffusion of known technology was provided by rural sociologists'research on the diffusionprocess. Models were leveloped emphasiz-ing the relationship between diffusion rates and the personalitycharacteristics and educational accomplishments of farm operators.
Insights into the dynamics of the diffusion process, when 0-vied withthe observation of wide agricultural productivity gaps among developedand less developed countries and a presumption of inefficient resourceallocation among "irrational, tradition-bound" peasants, produced anextension or diffusion bias in the choice of agricultural developmentstrategy in many LDCs during the 1950s. During the 1960s, the limita-tions of the diffusion on technology transfer model as a foundation forthe design of agricultural devc topment policies became increasingly ar.parent as technical assistance and rural development programsbasedexplicitly or implicitly on this modelfailed to generate either rapidmodernization of traditional farms and communities or rapid growthin agricultural output. There were very few opportunities to generatelarge productivity gains through the transfer of technology from oneagroclimatic zone to another, or even among regions in the sameagroclimatic zone. The pipeline was empty!
The High-Payoff Input Model
The inadequacy of policies based on the conservation, urban-industrialimpact, and diffusion models led, in the 1960s, to a new perspective:The key to transforming a traditional agricultural sector into a produc-tive source of economic growth is investment designed to make modem,high-payoff inputs available to farmers in poor countries. Peasants intraditional agricultural systems were viewed as rational, efficient resourceallocators.
16 Ruttan
In Transfotming Traditional Agriculture, T.W. Schultz insisted thatpeasants in traditional societies remained poor because there were onlylimited technical and economic opportunities to which they could re-spond. The new, high-payoff inputs were classified according to threecategoties: (1) the capacity of public and private sector research institu-tions to produce new technical knowledge; (2) the capacity of the in-dustiial sector to develop, produce, and market new technical inputs;and (3) the capacity of farmers to acquire new knowl)dge and newinputs effectively.
The enthusiasm with which the high-payoff input model has been ac-cepted and translated into economic doctrine has been due in part tothe proliferation of studies reporting high rates of return to public in-vestment in agricultural research (table 1). It was also due to the suc-cess of efforts to develop new, high - productivity grain varieties suitablefor the tropics. New, high-yield wheat varieties were developed in Mex-ico begi triillg in the 1950s, and new, f,h-yield rice varieties weredeveloped in the Phili,pines in the 1960s. These varieties were highlyresponsive to industrial inputs such as fertilizer and other chemicalsand to more effective sou and water management. The high returnsassociated with the adoption of the new varieties and the associatedtechnical inputs and management practices have led to rapid growthin investment in agricultural research and to the development and adop-tion of the new and more productive crop varieties among farmers ina number of countries in Asia, Aftica, and Latin America.
But the acceptance of the high-payoff input model has been incomplete.
Many countries have not yet freed their private sector to produce andmarket the new technical inputs that enhance productivity. Those arefunctions which the public sector typically performs poorly. The con-straints placed on market development continue to deprive farmers andconsumers of the gains from new technology that are becoming available.
There has been even greater reluctance, in a number of developingcountries, to accept the implication of the high-payoff input model forthe schooling of farm people. The intellectuals and planners in manydeveloping countries find it difficult to understand the importance, foragricultural development, of a literate and a numerate peasantry. Whenadvances in agricultural xlmology occurred slowly, the apprenticeship
.23

Technical Change 17
mode of learning, without formal schooling, from family and villageelders was,adequate. But when a continuous stream of new biologicalanctraechaniCal technology becomes available the returns to the acquisi-tionof new skills in'production and marketing are driven up. It becomesimPoitant,not only to accept but also to be able to, adapt or reject thenew "packages" 'of practices and-inputs being recommended by researchand extension services. Agricultural extension services themselves mustbe able-AO advance beyond simply recommendinga package of prac-tices or doliVering technological and managerial messages to farmers.They must advance from teaching practices to teaching principles!
It seems quite clear that Pakistan has not yet made the investmentin the schooling of rural people to enable it to take full advantage ofthe potentially high-payoff technology that is becoming available. Inspite of one of the world's great pieces of agricultural real estate-35million acres of irrigated land in the Indus basinyields remain lowby Asian standards. It is hard to avoid a conclusion that underinvest-ment in human capital has dampened the rate of return to investmentin land and water development and to agricultural research and extension.
Induced Technical Change in Agriculture
The high-payoff input model remains incomplete as a theory ofagricultural development. Typically, education and research are publicgoods not traded through the marketplace. The mechanism by whichresources are allocated among education, research, and other publicand private sector economic activities was not fully incorporated intothe model. It does not explain how economic conditions induce thedevelopment and adoption of an efficient set of technologies for a par-ticular society. Nor does it attempt to specify the processes by r nichinput and product price relationships induce investment in research ina direction consistent with a nation's particular resource endowments.
These limitations in the high-payoff input model led Yujiro Hayamiand Ito develop a model of agricultural development in which technicalchange is treated as an exogenous factor. This induced innovation
24

Table 1Summary Studies of Agricultural Research Productivity
Study
Annual intertid?--Time rate of retniia::,
Country Comtnodity period (%)
Index number:Griliches,- 1958 USA Hybrid corn 1940-1955 35-40
Chinches, 1958 USA Hybrid sorghum 1940-1957 20
Peterson, 1967 USA Poultry 1915-1960 21-25
Everson, 1969 South Africa Sugarcane 1945-1962 40
Barletta, 1970 Mexico Wheat 1943-1963 90
Birletta, 1970 Mexico Maim 1943-1963 35
Ayer, 1970 Brazil Cotton 1924-1967 77+
Schmitz and Seckler, 1970 USA Tomato harvester, with no compensation '958 -1969
to displaced workers 37-46
Tomato harvester, with compensation todisplaced work.tes for 50% of earnings loss 16-28
Ayer and Schuh, 1972 Brazil Cotton 1924-1967 77-110
Hines, 1972 Peru Maize 1954-1967 35.40*50-55b
Hayami and Akino, 1977 Japan Rice 1915-1950 5-
Hayami and Akino, 1977 Japan Rice 1930-1961
7234257
Hertford, Ardila, Rocha Colom5ia Rice 1957-1972 60-82
and Trujillo, 1977 Soybeans 1960-1971 79-96
Wheat 1953-1973 11-12
Pee, 1977 MalaysiaCotton 1953-1972 none
Rubber 1932-1973 24
Peterson and USA Aggregate 1937-1942 50
Fitzharris, 1977 1947-1952 51
r 1957-1962 491957-1972 34

*annasiir.an and Bolivia Sheep 1966-1975 44Whitaker, 1977,
Piny, 1978 PunjabWheatAgricultural resean± and extension
1966-1975 -48
(British India) h 6-1956 34-44Punjab Agricultural research and extension(Pakistan) 048-1963 23-37
'Scab le and Posada, 1918 Bolivia Rice 157-1964 79-96.Pray; 1980 Bangladesh Wheat and rice 1961-1977 30-35
,Aiirasslort analysis:'Tina; '1963 Japan Aggregate 1880-1938 35C.ilichas, 1964 USA Aggregate 1949-1959 35-40Liiiiner, 1964 USA Aggregate 1949-1959 not significant
- Peterson USA Poultry 1915-1960 21-Evanson, 1968 USA Aggregate 1949-1959 47:Evanson, 1969'311nrieita, 1970
South AfricaMexico
SugarcaneCrops
19-15-1958
1943-1963 45-940-Duncan, 1972 Australia Pasture improvement 1948-1969 58.68-Evanson and Jha, 1573'Cline, 1975 (revised by
IndiaUSA
AggregateAggregate
1953-19711939-1948 41-5040c
Knudson & Tweeten, 1979) Research and extension 1949-19581959-1968 339219'7:
1969-1972 28-35cBredahl and Peterson, 1976 USA Cash grains 1969 36d
Poultry 1969 37d
Dairy 1969 43dLivestock 1969 47d
ro

Study
Kahion, qal, Saxenand ba, 1977
Evenson and Flores, 1978
Flores and. Evenson,
..
Hayami, 1978,Nagy and Furtan, 1978-Davis, 1979
Evenson, 1979
,.,.
Table 1 (continued)
Annual internalTime rate of return
Country Commodity period (%)
::-:- India Aggregate 1960-1951 63a
Asia-National , Rice 1950-1965 32-391966-1975 73-78
Asia-International Rice 1966-1975 74-102Tropics Rice 1966-1975 46-71Philippines Rice 1966-1975 75Canada Rapeseed 1960-1975 95-110USA Aggregate 1949-1959 66-100
1964-1974 37USA Aggregate 1868-1926 65USA Technology oriented 1927-1950 95USA Science oriented 1927-1950 110USA Science oriented 1948-1971 45Southern USA Technology oriented 1948-1971 130Northern USA Technology oriented 1948-1971 93Western USA Technology oriented 1948-1971 95USA Farm management research and agricultural
extension 1948-1971 110
I%)0
SOURCE: Robert E. Evenson, Paul E. Waggoner, and Vernon W. Ruttan, "Economic Benefits from Research: An Example from Agriculture," Science,205 (September 14, 1979), pp. 1101-7. Copyright 1979 by the American Association for the Advancement of Science.a. Returns to maize research only.b. Returns to maize research plus cultivation "package."c. Lower estimate for 13-, and higher for 16-year time lag between beginning and end of output impact.d. Lagged marginal product of 1969 research on output discounted for an estimated mean lag of 5 years for cash grains, 6 years for poultry and dairy,and 7 years for livestock.
n4. i

Technical Change 21
perspective was stimulated by historical evidence that different coun-tries had followed alternative paths of technical change in the processof agricultural development. In the induced innovation model, changesor differences in the economic environment influence the direction oftechnical change.
In-discussing, the induced innovation Model, I will find it useful, atthe iisk of some oversimplification, to use the term mechanicaltechnology to refer to those technologies which substitute for labor andthe term biological technology to refer to those technologies whichgenerate increases in output per hectare.
Mechanical and Biological Processesin Agricultural Production
The mechanization of agricultural production cannot be treated assimply an adaptation of industrial methods of production to agriculture.The spatial nature of agricultural production results it significant dif-ferences between agriculture and industry in patterns of machine use.It imposes severe limits on the efficiency of large scale production inagriculture.
The spatial dimension of crop production requires that the machinessuitable for agricultural production must be mobilethey must moveacross or through materials that are immobile in contrast to movingmaterial through stationary machines as in most industrial processes.Furthermore, the seasonal or spatial characteristics of agricultural pro-duction require a series of specialized machinesfor land preparation,planting, weed control and harvestingspecifically designed for sequen-tial operations, each of which is carried out for only a few days or weeksin each season. This means that it is no more feasible for workers tospecialize in one operation in mechanized agriculture than inpremechanized agriculture. It also means that in a "fully mechanized"agricultural system, the capital-labor ratio tends to be much higher thanin the industrial sector in the same country.
In agriculture, biological and chemical processes are more fundamentalthan mechanization or machine proce. ses. This generalization was
equally true during the last century as it will be during the era of the"new biotechnology." Advances in biological and chemical technologyin Crop, production have typically involved one or more of the follow-ing Anee elements: (a) land and water resource development to pro-vide a more satisfactory environment for plant growth; (b) modifica-tion_ of the environment by the addition of organic and inorganic sourcesof plant nutrients to the soil to stimulate plant growth; (c) use ofbiological and chemical means to protect plants from pests and disease;and (d) selection and design of new biologically efficient crop varietiesspecifically adapted to respond to those elements in the environmentthat are subject to man's control. Similar processes can be observedin advances in animal agriculture.
The United States and Japan
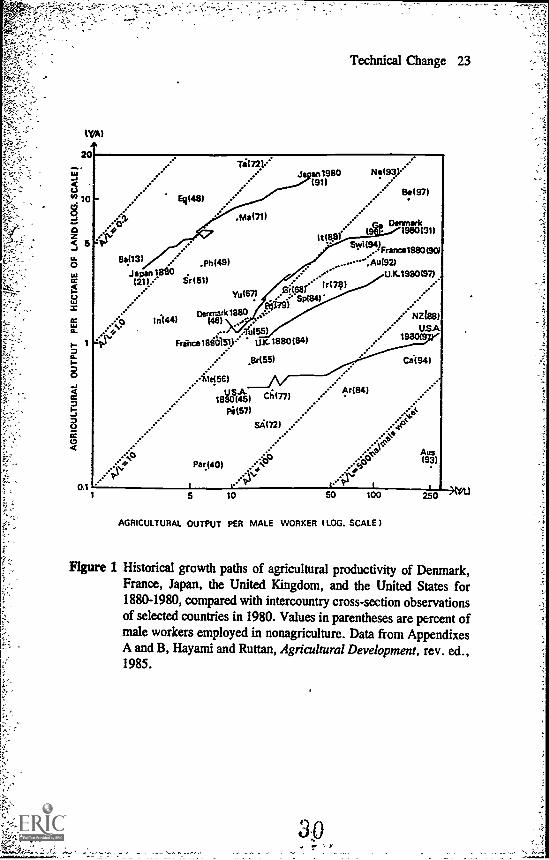
One implication of the discussion of mechanical and biological pro-cesses is that there are multiple paths of technical change in agricultureavailable to a society. The constraints imposed by an inelastic supplyof land may be offset by advances in biological technology. The con-straints imposed by an inelastic supply of labor may be offset by ad-vances in mechanical technology. These alternatives are illustrated infigure 1. The 1880-1980 land and labor productivity growth paths forJapan, Denmark, France, Germany, the United Kingdom and the UnitedStates are plotted, along with the 1980 productivity ratios for a numberof developing countries. The impression given by the several growthpaths is that nature is relatively "plastic."
In economics, it has generally been accepted, at least since the publica-tion of Theory of Wages by Sir John Hicks, that changes or differencesin the relative prices of factors of production could influence the direc-tion of invention or innovation. There has also been a second tradition,based on the work of Griliches and Sclunookler, that has focused at-tention on the influence of growth in product demand on the rate oftechnical change. We now turn to an illustration of the role of relativefactor endowments and prices in the evolution of alternative paths oftechnical change in agriculture in the United States and Japan.
-

'24 Ruttan
Japan and the United States are characterized by extreme differencesin relative endowments of land and labor (table 2). In 1880, totalagricultural land area per male worker was more than 60 times as largein the United States as, in Japan, and arable land area per worker wasabout 2Q fines as large in the United States as in Japan. The differenceshave Wideaed over time. By 1980, total agricultural land area per maleworker was more than 100 times as large and arable land area per maleworker about 50 times as large in the United States as in Japan.
The relative glees of land and labor also differed sharply in the twocountries. In 1880 in order to buy a hectare of arable land (comparerow 8 and row 16 in table 2), it would have been necessary for a Japanesehired farm worker to work eight times as many days as a U.S. farmworker. In the United States, the price of labor rose relative to the priceof land, particularly between 1880 and 1920. In Japan, the price of landrose sharply relative to the price of labor, particularly between 1880and 1900. By 1960 a Japanese farm worker would have had to work30 times as many days as a U.S. farm worker in order to buy one hec-tare of arable land. This gap was reduced after 1960, partly due to ex-tremely rapid increases in wage rates in Japan during the two decadesof "miraculous" economic growth. In the United States, land pricesrose sharply in the postwar period primarily because of the rising de-mand for land for nonagricultural use and the anticipation of continuedinflation. Yet, in 1980 a Japanese farm worker still would have hadto work 11 times as many days as a U.S. worker to buy one hectareof land.
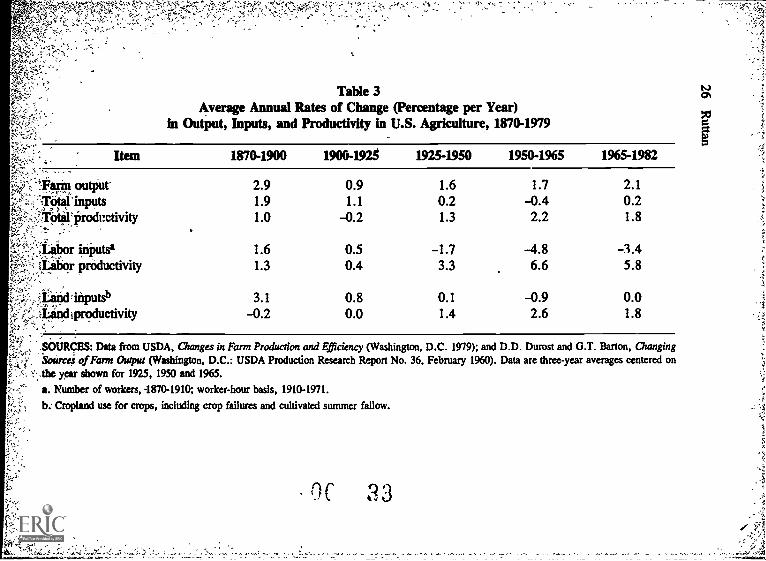
In spite of these substantial differences in land area per worker andin the relative prices of land and labor, both the United States and Japanexperienced relatively rapid rates of growth in production and produc-tivity in agriculture (tables 3 and 4). Overall agricultural growth per-formance for the entire 100-year period was very similar in the twocountries. In both countries, total agricultural output increased at anannual compound rate of 1.6 percent, while total inputs (aggregate ofconventional inputs) increased at a rate of 0.7 percent. Total factor pro-ductivity (total output divided by total input) increased at an annual rateof 0.9 percent in both countries. Meanwhile, labor productivity measuredby agricultural output per male worker increased at rates of 3.1 per-
rz

IS
Table 2Land-Labor Endowments and Relative Prices in Agriculture
United State S and Japan, Selected years
(1).Agiicaltural:lanci area (million ha.)le lakarea (Million ha.)
,0)1;NO.;ofiMa1e'farm.workers (thousand)
(4),(1)0):,(htiiwiiiker)(5).(2)/(3)!,41a:/workerI
'.Valite4iii.ableland ($/ha.)TaitilWagerate ($/day)
),(1191(0/0)'(days/ha.),., s,.
Japan- (9), Agricultural land area (thousand ha.)aAlOyAmble land-area.(thousand ha.)Iiiyrio. of male farm workers (thousand)
i:2)"(9)/(11)(ba./worker)-i3)'.(10)/(11) (ha./worker)(14) Value of_arable land (yen/ha.)OS). Farm wage rate (yen/day),(16) (14)1(15) (days/ha.)
1880 1900 1920 1940 1960 1980
327 465 458 452 440 42793 157 194 189 185 191
7,959 9,880 10,221 8,487 3,973 1,79241 47 45 50 111 23812 16 19 22 47 107
109 106 341 178 696 3,3930.90 1.00 3.30 1.60 6.60 25.31
188 106 103 111 105 134
5,509 6,032 6,958 7,102 7,042 5,7294,749 5,200 5,99R 6,122 6,071 5,4618,336 8,483 7,577 6,362 6,230 2,6740.66 0.71 0.92 1.12 1.13 2.140.57 0.61 039 0.96 0.97 2.04 A343 917 3,882 4,709 1,415,000 7,642,000
0.22 0.31 1.39 1.90 440 5,054 a1,559 2,958 2,793 2,478 3,216 1,512
iOURCI.... Data from Appendix Tables C-2 and C-3 in Yujiro Hayami and Vernon W. Ruttan, Agricultural Development; An International Perspective,it'ev. . ed. (Baltimore: Johns Hopkins University Press, 1985).
a. Agricultural land areas in Japan for 1880-1960 are estimated by multiplying arable land areas by 1.16, the ratio of agricultural land area to arableland area in the 1960 Census of Agriculture; this conversion factor changed to 1.05 for 1980 based on the 1980 Census of Agriculture..
32
:;
. ,
, vzi
Table 3 ts.)cr% '
Average Annual Rates of Change (Percentage per Year)in Output, Inputs, and Productivity in U.S. Agriculture, 1870-1979 g il
.,4
81:111 output'
:71:060inPits'FroigOrodimtivity
L4ti?orprOductivity
,,3,:tandtinputsb 3.1 0.80.0
2.91.91.0
0.91.1
-0.2
1.6 0.51.3 0.4
-0.2
1.60.21.3
-1.73.3
0.11.4
1.74.42.2
-4.86.6
-0.92.6
2.10.21.8
-3.45.8
0.01.8
:,.,.
1
;..i;
ChangingSOURCES: Data from USDA, Changes in Farm Production and Efficiency (Washington, D.C. 1979); and D.D. Durost and G.T. Barton,...-:
'Sairce,i D.C.: USDA Production Research Report No. 36, February 1960). Data are three-year averages centered onof Farm Output (Washington,,-.. ,the year shown for 1925, 1950 and 1965.
Number of workers, -1870-1910; worker-hour basis, 1910-1971.
b. Cropland use for crops, including crop failures and cultivated summer fallow.
C 33
I

Table 4Average Annual Change in Total Output, Inputs, and Productivity in Japanese Agriculture, 1880-1980
Item 1880-1920 1920-1935 1935-1955 1955-1980 1965-1982
larm output 1.8 0.9 0.6 3.5 1.2Total inputs 0.5 0.5 1.2 1.3 0.7'Total productivity 1.3 0.4 -0.6 2.2 0.5
LAbor inputs -0.3 -0.2 0.6 -2.5 -3.7Labor productivity 2.1 1.1 0.0 6.0 4.9
Land inputs 0.6 0.1 -0.1 0.1 -0.6Land productivity 1.2 0.8 0.7 3.4 1.8
SOURCES: Data from Saburo. Yamada and Yujiro Hayami, "Agricultural Growth in Japan, 1880-1970," in Agricultural Growth in Japan, Taiwan,Korea and the Philippines, Yujiro Hayami, Vernon W. Ruttan and Herman Southworth, eds. (Honolulu: University Press of Hawaii, 1979), pp. 33-58;
=Saburo Yamada, "The Secular Trends in Input-Output Relations of Agricultural Production in Japan, 1878-1978," a paper presented at the Conference"otAgriCultural Development in China, Japan, and Korea, Academics Sinica, Taipei, December 17-20, 1980; Saburo Yamada, Country Study on Agricultural
Productivity Measurement and Analysis - Japan (Tokyo: University of Tokyo Institute of Oriental Culture, October 1984, mimeo).
34

28 'Ruttan
cent per year in the United States and 2.7 percent in Japan. It isremarkable that the overall growth rates in output and productivity wereso similar, despite the extremely different factor proportions thatcharaCterize the two countries.
Although there is a resemblance in the overall rates of growth in pro-duction and productivity, the time sequences of the relatively fast-growing phases and the relatively stagnant phases differ between thetwo countries. In the United States, agricultural output grew rapidlyup to 1900; then the growth rate decelerated. From the 1900s to the1930s there was little gain in total productivity. This stagnation phasewas succeeded by a dramatic rise in production and productivity in the1940s and 1950s. Japan experienced rapid increases in agricultural pro-duction and productivity from 1880 to the 1910s, then entered into astagnation phase, which lasted until the mid-1930s. Another rapid ex-pansion phase commenced during the period of recovery from thedevastation of World War II. Roughly speaking, the United States ex-perienced a stagnation phase two decades earlier than Japan and alsoshifted to the second development phase two decade,' earlier.
The effect of relative prices on the development and choice oftechnology is illustrated with remarkable clarity for biological technologyin figure 2. In figure 2, U.S. and Japanese data on the relationship be-tween fertilizer input per hectare of arable land and the fertilizer/landprice ratio are plotted for the period 1880 to 1980. In both 1880 and1980, U.S. farmers were using less fertilizer than Japanese farmers.Despite enormous differences in both physical and institutional resources,however, the relationship between these variables has been almost iden-tical in the two countries. As the price of fertilizer declined relativeto other factors, scientists in both countries responded by inventing cropvarieties that were more responsive to the lower prices of fertilizer.American scientists, however, always lagged behind the Japanese byseveral decades because the lower prices of land relative to the priceof fertilizer in the United States resulted in a lower priority being plac-ed on yield - increasing technology.
The effect of changes in the relative prices of mechanical power andlabor in the United States and Japan for 1880-1980 is illustrated in figure
35

Technical Change 29
Japan00
0
oo 0
00 0
0* *0*
* 0
*00000*
*
United States
Fertilizer-Arable Land Price Ratio (Log.)
Figure 2 Relation between fertilizer input per hectare of arable land andfertilizer-arable land price tad° (=hectares of arable land which canbe purchased by one ton of N+P205+K20 contained in commer-cial fertilizers), the United Sates and Japan, quinquennial observa-tions for 1880-1980. Data from Appendix C, Hayami and Ruttan,Agricultural Development, rev. ed. (Baltimore: Johns HopkinsUniversity Press, 1985).
111010111.1101,
36

RuAan
3. In both 1880 and 1980, U.S. farmers were using more mechanicalpower than Japanese farmers. The relationship between the power-laborprice, ratio and the use of power per worker is almost identical in thetwo countries, but because labor was always less expensive in Japan,the JaPairese suppliers of mechanical technology always lagged behindU.S. SUppliersty several, decades. These same relationships that holdfor Japan and the United States have now been demonstrated for theperiod 1880-1960 for a number of European countries in the book byHans P. Binswanger and Vernon W. Ruaan, Induced Innovation:Technology, Institutions and Development.
The effect of a rise in the price of fertilizer relative to the price ofland or in the price of labor relative to the price of machinery has beento induce advances in biological and mechanical technology. The ef-fect of the introduction of lower cost and more productive biologicaland mechanical technology has been to induce farmers to substitute fer-tilizer for land and mechanical power for labor. These responses to dif-ferences in resource endowments among countries and to c%anges inresource endowments over time by icultural research institutions,by the farm supply industries, and by farmers, has been remarkablysimilar in spite of differences in cultures and traditions.
The results of our comparative analyses can be summarized as follows:Agricultural growth in the United States and Japan during the period1880-1980 can best be understood when viewed as a dynamic factorsubstitution process. Factors have been substituted for each other alonga metaproduction function in response to long-run trends in relative factorprices. Each point on the metaproduction surface is characterized bya technology which can be described in terms of specific sources ofpower, types of machinery, crop varieties, and animal breeds.Movements aiong this metaproduction surface involve technical changes.These technical changes have been induced to a significant extent bythe loug-term trends in relative factor prices.
37

0
0
0
Technical Change 31
Japan
0
United States
*
0
0O 0 0
0 00 0 o 0 0
Power-Labor Price Ratio (Log.)
Figure 3 Relation between farm draft power per male worker and power-laborprice ratio (=hectares of work days which can be purchased by onehorsepower of tractor or draft animal), the United States and Japan,quinquennial observations for 1880-1980. Data from Appendix C,Hayami and Ruttan, Agricultural Development, rev. ed. Numberof male workers =U3 and J3, Power =U7 +U8 and J7 +J8, Landprice =U19 and J19, Power price =average retail price of tractorper horsepower extrapolated by U21 from the 1976-80 average of$216 for the United States, and extrapolated by 321 from the averageof 65,170 yen for Japan

4ttin,
Perspective
In the closing decades of the twentieth century we are approaching,
the end of the' most remarkable transitions in the history of agriculture.Prior to the beginning of this century, almost all increases in
agricultural production occurred as a result of increases inarea cultivated.The major exceptions were in Western Europe, where livestock-basedConaira'ation systems of farming had developed, and in East Asia, whereWet rice cultiittion systems had developed.
but by the end of this century there will be few significant areas whereagricultural production can be expanded by simply adding more landto production. Expansion of agricultural output will have to b obtain-ed almOst entirely from more intensive cultivation of the areas alreadybeing used for agricultural production. Increases in food and fiberpro-duction will depend, in large measure, on continuous advances inagricultural technology.
The task before us is clear. It is imperative, over the next severaldecades, that we complete the establishment of agricultural researchcapacity for each commodity of economic significance in eachagroclimaiic region of the world.
A developing country which fails to evolve a capacity for technicaland institutional innovation in agriculture consistent with its resourceand cultural endowments suffers two major constraints on its attemptsto develop a productive agriculture. It is unable to take advantage ofadvances in biological and chemical technologies suited to labor-intensive
agricultural systems. And the mechanical technology it does import frommore developed countries will be productive only under conditions oflarge-scale agricultural organization. It will contribute to the emergenceof a "bimodal" rather than a "unimodal" organiwition structure.
During the last two decades a number of developing countries havebegun to establish the institutional capacity to generate technical changesadapted to national and regional resource endowments. More recently,these emerging national systems have been buttressed by a new systemof international crop and animal research institutes. These new instituteshave become both important soures of new knowledge and technology
39I

Technical Change 33
ancl'increasu: igly effective communication links among the developingnational research systems
The lag in shifting from a natural resource-based to a science-basedSysten;cnt 4ciftnife Continues to be a source of national differences-inlar4iii*-11hefspioductiVity. Lags in the development and applica-itiOn,of knowledge are also important sources of regional productivitydifference:s within coimtries. In countries such as Mexico and Pakistan,differential rates of technical change have been an important source ofthe widening disparities in the rate of growth of total agricultural out-put, in labor and land productivity, and in incomes and wage iges amongregions.
Productivity differences in agriculture are increasingly a function ofinvestments in scientific and industrial capacity and in the educationof rural people rather than of natural resource endowments. The ef-fects of education on productivity are particularly important duringperiods in which a nation's agricultural research system begins to in-troduce new technology. In an agricultural system characterized by statictechnology, there are few gains to be realized from education in ruralareas. Rural people who have lived for generations with essentially thesame resources and the same technology have learned from long ex-perience what their efforts can get out of the resources available to them.Children acquire from their parents the skills that are worthwhile. For-mal schooling has little economic value in agricultund production.
As soon as new technical opportunities become available, this situa-tion changes. Technical change requires the acquisition of new husbandryskEls; acquisition from nontraditional sources of additional resourcessuch as new seeds, new chemicals, and new equipment; and develop-ment of new skills in dealing with both natural resources and with theinput and product market institutions that link agriculture with thenonagricultural sector.
The processes by which new knowledge can be applied to alter therate and direction of technical change in agriculture, are, however,substantially greater than our knowledge of the processes by whichresources are brought to bear on the process of institutional innovationand transfer. Yet the need for viable institutions capable of supportingmore rapid agricultural growth and rural development is even more com-pelling today than a decade ago.

The Political Economyof
Agricultural and Rural Development
Bruce F. JohnstonStanfoid University
The term political economy went out of fashion decades ago becauseeconomists wanted to concentrate on rigorous analysis of the strictlyeconomic aspects of problems. The term has come back in favor,however, for many of us concerned with problems of development. Werecognize that we simply cannot afford to ignore the political dimen-sion that is so important to our understanding of the real worldproblemsand opportunities. Lasswell's classic definition of politicswho gets what, when, and how?is also a fine definition of the politicaleconomy of development. In brief, political constraints are as impor-tant as the scarcity of economic resources in determining those thingsthat are feasible and not merely desirable.
In addressing this large topic, I want to deal in summary fashion withthree key questions.
My first question is, simply, why focus on agricultural and ruraldevelopment?
Second, why should we in this country be cot :emed about the develop-ment problems of Kenya, India, and other third world countries?
Third, what have economists in generaland this particularagricultural economist- learned in the last 40 years about the criticalelements or ingredients of successful strategies for agricultural and ruraldevelopment?
I can deal quickly with the first question: Why the focus on agriculturaland rural development?
35
.41

For the less-developed countries that still have very low incomes'the Indias, Kenyas, or Indonesias in contrast with middle-income coun-tries such as South Korea, Brazil, or Taiwan, some 60 to 80 percentof the population and labor force still depend on agriculture for theirlivelihoodfor employment and income.' And it is not necessary todwell on the fact that food is one of the most basic of "Basic HumanNeeds." (See Mellor and Johnston 1984.)
On my second question, as to why we as Americans should be con-cerned about the development problems of third world countries, thereare many answers. Let me mention two that I find persuasive.
The first answer boils down to this: We are part of the problem andtherefore have a moral, a human obligation to try to be part of the solu-tion. The most obvious way in which we are part of the problem isthat wethe U.S., the countries of Western Europe, and the WorldHealth Organization and other international institutions (including theKellogg, Rockefeller, and Ford Foundations)are mainly responsiblefor the explosive growth rates of population that became universal amongthe less-developed countries during the decade. following World WarIL I am referring, of course, to the opening up of access to immuniza-tion programs and other modern public health technologies and to modernmedical knowledge. This lowering of death ratesabove all by reduc-ing infant and child mortalit. has been a blessing for the families thehave been spared the wastage of human life when, as was often the case,one out of three infants died before the age of five. Like many transfersof modern technology, however, it has been a two-edged sword. Wehave learned that it is much easier for external interventions to bringabout a rapid reduction in death rates than in birth rates. Clearly, itis the dramatic decline in death ratesfrom crude death rates of 40 to50 per thousand to current levels of 10 to 25 per thousand - -that hasgiven rise to the explosive growth of population of the past 35 years.(Johnston and Clark 1982, pp. 47-60.)
Again, this is i problem that applies particularly to the low-incomecountries. It also applies with special force to the countries of tropicalAfricaand not only because so many of the low-income countries arein the region. In fact, tropical Africa is the one region in the world where
4
z
Political Economy 37
rates of population growth are continuing to increase because death ratesare continuing to fall and birth rates are virtually unchanged.
The situation in Kenya epitomizes the way in which the task of rais-ing per capita incomes has been made exceedingly difficult because ofthe emergence and persistence of very high rates of population growth.During the demographic transition in Western Europe and Japan, theperiod of rapid population growth was charaterized by rates of increaseof about 1.5 percent, compared to an estimated rate of 4 percent inKenya. It is the nature of population growth to proceed at a compoundrate. An upsurge in infant and child survival this year means an up-surge in the rate of increase in women of child-bearing age beginning15 to 20 years from now. Hence the momentum of population growththat demographers emphasize. A growth rate of 4 percent means thata population will double in just over 17 yearsand will increase seventimes in 50 years. At first glance, a population growth rate of 2 percentdoesn't seem all that differenta population doubling time of 35 yearsinstead of 17. But continuation of a 2 percent compound rate for 50years implies an increase of "only" 2.7 times compared to a sevenfoldincrease with a 4 percent growth rate.
Demographic projections for Kenya offer a strikilig example. For the55-year period 1969 to 2024, the "most likely" set of assumptions pointto an increase in Kenya's population from 11 million to 64 million. Thoseprojections also considered the prospective change in the urban-ruralcomposition of the country's labor force. Assuming continued rapidgrowth of the urban workforce, the rural workforce is projected todecline from 87 percent of the total in 1969 to 65 percent in 2024. Inspite of the projected sixteenfold increase in the population of workingage in urban areas, however, the rural workforce would still increasefourfold over that 55-year period (Shah and Willekens 1978). Thoseprojections emphasize an important structural characteristic of coun-tries with rapid population growth and where the share of the popula-tion dependent on agriculture is still very high.
But before I turn to the 'inplications of these structural /demographiccharacteristics on the choice of an agricultural strategy, let me mention
43

38 Johnston
another fundamental reason why I believe that it is important for theU.S. to continue to play an important role in providing economic andtechnical assistance for the contemporary low-income countries.Throughout most of human history poverty was widespread, but it wasnot perceived as a problem in the way it is today. Instead, it was seenas part of the natural order. "The poor are always with us." Their plightshould be alleviated by charity, but poverty was not viewed as a condi-tion that could and should be eliminated by well-designed and vigorously
implemented development efforts. However, with the remarkable ad-vances that have been made in science and technology, the develop-ment goal of eliminating poverty has become a real possibility, not mere-ly a utopian dream. (See Simon 1984.)
I turn now to the question of what economistsand this agriculturaleconomisthave learned about the development process during the past40 years. And that will bring me back to the implications of those struc-tural/demographic characteristics of today's low-income developingcountries.
But first I want to draw on my work in Japan in the years immediate-ly after World War H. With the benefit of a lot of hindsight, I see thatI am very fortunate to have been influenced so strongly by Japan's ex-perience as my implicit "model" of agricultural development. Duringthe critically formative period of the late 19th century and the earlydecades of the 20th century, increases in agricultural productivity con-tributed in some very important ways to the overall economic develop-ment of Japan. (See Ohkawa, Johnston, and Kaneda 1969; Johnstonand Kilby 1975, chap. 5.) Three features of that experience wereespecially significant.
1. Agricultural production was increased within the unchangedorganizational framework of Japan's existing small-scale farming system.Between 1880 and 1960, Japan's agricultural production increased about3-1/2 times, slightly more than the increase in the U.S. over the same80-year period. Because of technolo3ical change, specifically increasesin the productivity of the existing on-farm resources of land and labor,this was achieved with remarkably small demands on the critically scarceresources of capital and foreign exchange.

Political Economy 39
2. Most of the nation's farmers were involved in increases inagricultural productivity associated with the use of improved crop
varieties, fertilizers and other types of working capitalbut remarkably
little investment in farm machinery or other types of long-term capital
investment. Technological, change related to high-yield, fertilizer-
responsive crop varieties was the driving force in increasing agricultural
productivity. And the technical innovations and new purchased inputs
were divisible. Therefore they could be used efficiently by small farmers
subject to a severe purchasing power constraint. And the typical farmer
unavoidably faced a purchasing power constraint. The cash income ac-
cruing to the agricultural sector was limited because of the struc-tural/demographic characteristics emphasized earlier. When the number
of farm households is still large relative to the domesticpopulation depen-
dent on purchased food, the cash income accruing to the average farm
unit is inevitably small. When a country's pattern of agricultural develop-
ment is dualistic, so that a relatively small number of atypically large
and capital-intensive farm enterprises account for the lion's share ofcommercial production, those large farms escape the purchasing power
constraint. But that is at the expense of intensifying the cash income
and purchasing power constraint for the great majority of small farm
units.3. Agricultural and industrial growth went forward together in a pro-
cess of concurrent growth. As the overwhelmingly agrarian character
of the Japanese economy was gradually transformed by the process of
economic growth, there were positive h. eractions between agriculture
and industry. Moreover, the concurrent progress in agriculture and in-
dustry led to decentralized industrial development of a "semi-modern"
industrial sector that relied upon relatively simple, capital-saving, labor-
using technologies, which made possible more rapid growth of output
in both sectors.I want to dwell particularly on the first and second factors and the
importance of technological change. All of the speakers in this seminar
series are, I believe, in agreement on the great importance of
technological change. This potential importance of technological change
as a source of agricultural growth has some very important implica-
tions for the design of development strategies.

40 Johnston
One terribly important implication is that we need to be as concern-ed with investments in human and institutional resources as in physicalinvestments such as construction of irrigation systems or building fac-tories for manufacturing farm equipment James Bonnen, a distinguishedprofessor of agricultural economics at Michigan State University, hasemphasized that agricnNiral progress in the U.S. has been the resultof interactions within a system of developmental institutions: farmersand their ganizations, the United States Department of Agricultureand the land-grant colleges and universities, the Federal-StateAgricultural ResearCh and Extension programs, private sector firmsengaged in the marketing and processing of farm products and themanufacture and distribution of farm inputs, and the federal and statepolitical institutions involved in the formulation of agricultural policy.(See Bonnen 1987.) Experience in the U.S., Japan, Taiwan, and manyother countries has demonstrated that efficient agricultural progressdepends on the interacting effects of farm-level factors and what, forlack of a better term, I refer to as socially determined factors. The farm-level factors include the responsiveness of farmers to incentives andtheir investments of time and money in land improvement, in equip-ment, in fertilizers and other forms of working capital, and in acquir-ing knowledge and skills. The socially determined factors include educa-tional institutions, investments in agricultural research, extension, andinfrastructure, macroeconomic policies (e.g., monetary policy and iii-terest rates), and a host of factors affecting the marketing of farm prod-ucts and the distribution of inputs.
The twofold implication of recognizing the great potential importanceof technologicat change concerns the need for investments in thevariousforms of capitalphysical, human, and institutionalto be reasonablywell-balanced. It is easy to state the economic principle. The rate ofreturn on the last dollar invested in each type of capital should be ap-proximately equal. But to realize that ideal in practice is enormouslydifficult. The emphasis by Hayami and Ruttan (1985) on "induced in-novation" and the importance of avoiding price distortions is an im-portant part of the answer. However, the decisions to make the long-term investment in building supporting institutions, including educa-tional institutions to train agricultural scientists and administrators, re-
48:

Political Economy 41
quires a vision, even a faith, that goes beyond perceiving trends inrelative prices. Lessons of past I.jstorial experience can be enormouslyhelpfulprovided that they are well understood and properly interpreted.I believe that I have, been very fortunate to have had an opportunityto learn about Japan's experience when I was still very young and im-pressionable. Every country confronts a unique set of problems. ButI am persuaded that Japan's past experience is of much greater relevanceto today's developing countries than the historical experience of theUnited States.
Another important lesson of past experience concerns the relative ad-vantages of the public and private sectors in achieving successfulagricultural development. The first proposition that I would stress isthat we have to move beyond a doctrinaire faith in either governmentplanning and direct action by government, or the equally blind faithin the private sector and "the magic of the market place." Experiencein the U.S., in Japan and in many other countries demonstrates thatsuccessful agricultural development depends on an interacting systemof public and private institutions.
There are good theoretical reasons and much evidence to support theview that independent private firms have a comparative advantage overpublic agencies in carrying out essentially commercial functions suchas production or marketing farm products or distributing farm inputs.This is essentially because the hierarctical techniques of decisionmak-ing and operating within a bureaucracy are at a disadvantage as com-pared to the greater flexibility and the capacity and motivation for cost-minimization that characterize private firms responding to price andprofit signals within a market system. It is equally important to stress,however, that a number of the socially determined factors that are ofcritical importance depend upon the public sector. This is because publicagencies are needed to make available critical public goods such as educa-
tion, agricultural research, extension, and family planning services. Itis a defining characteristic of public goods and services that tney willbe provided in less than the socially optimal amount if their availabilitydepends on private firms responding to private demands. Even froma strictly economic point of view, society's benefits from investing in
4.7

education, for example, exceed the private returns accruing to thosewho receive the education.
Finally, I want to make a few comments about the role of food aid.This is a complex and controversiai epic. Some people who stress thatthe woo'd's food problems are "merely a matter of distribution" con-clude that sending our "surplus food" is a neat and simple answer.Food aid shipments are essential for famine relief. They are not theanswer to the fundamental problems of poverty. And it is their povertythat makes poor countries so vulnerable to famine.
I sympathize with the prime minister who wanted to find a one-handedeconomist because he (or was it she?) was fed up with "on the onehand, on the other hand" answers. But there's no getting away fromthe complexity that characterizes food aid. Food aid can be used to pro-mote development. It can and, I believe, often does have adverse ef-fects on incentives to increase food production in a low-income, develop-
ing country. But rather than spend a lot of time trying to sr.'' )ut theconditions that have to be fulfilled in order for food aid to have a positiveimpact, let me give you, as an illustration, my view on th !. food aidbalance sheet for India. it seems to me that for the 1950s and up tothe mid-1960s, it is difficult to say whether food aid yielded significantnet benefits for India. Its greatest value was probably in saving foreignexchange that could be used to finance other imports including, for ex-ample, equipment: for fertilizer factories and for irrigation facilities.But its availability undoubtedly had an adverse effect on farm pricesand farmers' incentives. In addition, it probably weakened the resolveof the government to face up to the country's agricultural problems.There is no doubt in my mind that dollar-for-dollar the food aid wasless valuable than, say, the investments that enabled some of our land-grant universities to assist in establishing a network of agricultural univer-sities in India and in creating a more effective national agriculturalresearch system. But that ignores two important political economy dimen-sions of the issue.
First, there is no doubt that to some extent the food aid was addi-tional to other forms of aid. As long as agricultural "surpluses" arecreated as a by-product of our agricultural price support programs,
4 8 ,

y
II.
Political Economy 43
there is bound to be pressure in Congress to convert those "costly andburdensome surpluses" into a "valuable food resource." Second, I amconvinced that the blunt way in which Lyndon B. Johnson carried outhis "short tether" policy in making aid available to India during theacute famine in 1966 and 1967 resulting from two successive years ofdrought had poweliul and positive consequences. There was great resent-ment among Indian politicians, policymakers, and officials at many levels
at being treated in that way, e.g., in imposing many harsh "conditionsprecedent." Indeed the Indians involved were so infuriated that theepisode created a resolve to never again be so dependent on food reliefshipments. And fortunately the prior investments in strengthening In-dia's human and institutional resources as well as U.S. and World Bankinvestments in expanding irrigation facilities and fertilizer manufacturingcapacity meant that India's interacting system of developmental institu-tions could meet the challenge of virtually ending India's dependenceon imported food.
In recent years, there has been a very substantial increase in foodaid to countries in sub-Saharan Africa (Johnston et al. 1987, chap. 2).2Because of the tight budget situation in the U.S., together with currentconcern over the financial difficulties of American farmers as a resultof the recent decline in agricultural exports and in farm prices, thereis pressure to further expand food aid shipments; and exaggerated claimsare being made about the benefits to be realized from such shipments.(See, for example, Reutlinger and Katona-Apte 1987.) Providing foodaid as a substitute for commercial imports would help to ease the seriousbalance-of-payments problems faced by countries in Sub-Saharan Africa.As noted by Timmer in his chapter, however, using food aid to replacecommercial imports is contrary to the intent and the regulations thatare supposed to govern food aid programs of the U.S. and other coun-tries. Moreover, sustained solutions to Africa's serious food andagricultural problems require economic and technical assistance to sup-port the strengthening of national agricultural research systems andpostsecondary educational institutions for training agricultural scien-tists and administrators, together with investments in expanding,rehabilitating, and maintaining rural transport networks and other rural.
49

44 Johnston
infrastructure. Use of a certain amount of food aid for rural workspro-jects could have a positive developmental impact, although such pro-jects make substantial demands on scarce administrative and planningcapacity. It is essential to recognize that food aid cannot be a substitutefor supporting the long-term institutioi -building that is so desperaktlyneeded in Sub-Saharan Africa.
NOTES
1. The distinctive problems of such "late-developing" countries are examined in Johnston andKilby (1975) and Johnston and Clark (1982).
2. For historical reasons, Africa has not bin the focus of U.S. econE'mic assistance. Since 1978,U.S. assistance to Africa has amounted to a little over 10 percent of the country's foreign aidto all regions; but prior to 1978, Africa received only about 5 percent of the total. For the sixcountriesSenegal,Nigeria, Camel ten, Kenya, Tanzania, and Malawiincluded in the WorldBank's study of Managing Agricultural Development in Africa (MADIA), AID's bilateral assistancefor projects and programs during the period 1963-84 amounted to $905 million in constant 1983dollars or only a little more than the $836 million provided as food aid (Johnston et al. 1987,chap. 2, table 3).
50

Political Economy 45
REFERENCES
Bonnen, James T. "U.S. Agricultural Development: Transforming HumanCapital, Technology, and Institutions" in U.S.-Mexico Relations:Agriculture and Rural Development, edited by Bruce Johnston, et al. (Stan-ford University Press, 1987).
Hayami, Yujiro and Vernon W. Ruttan, Agricultural Development: AnInternational Perspective, rev. ed. (Johns Hopkins University Press,Baltimore, 1985).
Johnston, Bruce F. and William C. Clark, Redesigning Rural Development:A Strate,dc Perspective. (Johns Hopkins University Press, Baltimore, 1982).
Johnston, Lrum r., Alan Hoben, Dirk W. Dijkerman, William K. Jaeger, AnAssessment of A. LD. Acdvities to Promote Agricultural and Rural Develop-ment in Sub-Saharan Africa. (World Bank, Development Strategies Divi-sion, Development Research Department, 1987).
Johnston, Bruce F, and Peter Kilby, Agriculture and Structural Transformation:Econtunic Strategies in Late-- eveloping Countries. (Oxford UniversityPress, N. v York, 1975).
Mellor, John 1. and Bruce F. Johnston, "The World Food Equation: Inter-relations 1. .nong Development, Employment, and Food Consumption,"Journal of Economic Literature 22(2), June 1984, pp. 531-574.
Ohkawa, Kazuchi and B.F. Johnston, Hiromitsu Kaneda, eds., Agricultureand Economic Growth: Japan's Experience (University of Tokyo Press,Tokyo, 1969).
Reutlinger, S. and J. Katona -Apte, "The Nutritional Impact of Food Aid:Criteria for the Selection of Cost-Effective Foods," in Food Policy: In-tegrating Supply, Distribution, and Consumption, edited by J. PriceGittinger, Joanne Leslie and Caroline Hoisiager. (Johns Hopkins Univer-sity Press, Baltimore, 1987).
Shah, M.M. and F. Willekens, Rural-Urban Population Projections for Kenyaand Implications for Development. (International Institute for AppliedSyrtems Analysis, Laxenburg, Austria, 1978).
Simon, Arthur, Bread for the World. (Paulist Press, New York, 1984).
World Bank, "A Summary Report of World Bank/World Food ProgrammeConsultation of Food Aid for Structural and Sectoral Adjustment." (WorldBank, December 15-17, 1986.)

Foreign Assistanceand Agricultural Development
Implications of the Past 25 Yearsfor Policy Conditionality, Capacity Building
and Sustainability
Uma Le leThe World Bank
Why should we be interested in understanding the interactions offoreign assistance with the agricultural development of developing coun-tries? First, because foreign assistance plays a major role in the expen-ditures of low-income developing countries. In Africa currently, from30 percent to 60 percent of government expenditures in many coun-tries come from foreign aid, and the share of government expendituresin the Gross Domestic Product (GDP) of African countries ranges from25 percent to 35 percent. Even in a large country such as India, at itspeak foreign assistance constituted close to a quarter of the gross domesticinvestment.
Second, development of the agricultural sector plays an importantrole in the overall economic development of countries at early stagesof development, and governments need to play an important role indeveloping agriculture due to the "public goods" nature of many in-vestments such as agricultural research, extension and physical in-frastructure. These investnents require lumpy capital and skills for theirdevelopment. Small farmers with low incomes cannot mobilize resourceson their own on a scale needed to establish such infrastructure, especiallyas the benefits derived from such investments have long gestation lags.Besides, they are not easily captured and recovered through direct costrecovery, hence the important role for government at early stages ofdevelopment.
I am grateful to Paul Fishstein for research assistance and to Kim Tran for typing the paper.
47
52

Third, the contribution of foreign assistance to government activityconsists not simply of financial transfers, but also of the transfer of ideasin the form of policy advice, skills provided through technical assistancewhich accompanies investment decisions, and institutional developmentthrough such means as the transfer of western "models," as for in-stance the U.S.-type land-grant colleges for agricultural research andextension. These various nonfinancial transfers can have a profoundeffect on the efficiency with which financial resources are utilized bythe recipient countries and thus on the pace of growth of productionand productivity. The level, stability and content of foreign assistanceare strongly influenced by the international economic and political en-vironment. It is important to explore the important dimensions of thisenvironment to see its impact on the nature of foreign assistance as wellas on its effectiveness.
The process of agricultural development is, however, in large measuredetermined by the resource endowments, policies, institutions andtechnological possibilities in the recipient countries. The extent to whichan environment conducive to agricultural development exists dependslargely on the way policymakers in developing countries perceive therole of the agricultural sector, and the extent to which they put in placethe means to foster development.
The African situation offers a good example of the interaction be-tween domestic and international factors. The problems of African coun-tries' agricultural sectors have been at the center of international atten-tion since the late 1970s because of the broadly shared internationalview that domestic policy failures largely explain their slow pace ofdevelopment. Much "aid weariness" has developed because of theperceived failure of foreign aid to solve the problems of agriculturaldevelopment in Africa. In the 1950s and 1960s, countries in Asia wentthrough similar periods of balance-of-payments crises resulting fromthe failures of their agricultural exports and increased food (and in-dustrial) imports. They too were seen to be increasing their dependenceon food and financial aid from developed countries and there did notseem to be any hope of their ever being able to reach the stage of foodself-sufficiency and sustained agricultural growth. Many of them, such
53
Foreign Assistance 49
as India, Pakistan, Indonesia and even Bangladesh, have now reacheda position of food self-sufficiency, and some (e.g., India, Pakistan andIndonesia) have become modest exporters of food. Important insightscan tederived from the experience of Asia regarding the content offoreign aid, and especially the way it affected domestic policies, resourceendowments and institutions, which in turn enabled Asian countries todevelop agriculture. It is interesting to consider whether parallelpossibilitiei exist in Africa.
There' has been reluctance to indulge in such comparative analysison grounds that few useful lessons can be learned from Asian countrieswhich had far superior initial endovments in the form of trained man-power and inUitutional capacity. These may :ot be reproduceable inthe African countries. A great deal of foreign aid to Africa, on the otherhand, has already involved a relatively simplistic application of far moreadvanced western technologies, institutions and changing conceptionsof development. The effects of aid from OECD countries to Africanagriculture over the last quarter-century constitute the subject of a ma-jor research project under my direction. Also, in providing such aid,frequently the wrong lessons have been learned from the Asian ex-perience and applied to the African continent. For instance, the Indiantype of complex, centralized, multisectoral planning models were trendyin the 1960s and were applied in Nigeria's early plans by western ad-visors. Concern about increased inequalities following the Green Revolu-tion in Asia resulted in donors in the 1970s placing an excessive em-phasis in Africa on integrated agricultural development of the regionsand populations with few resources and growth possibilities in the shortrun. Such investment in agricultural and rural development resulted ina large number of failed projects leading neither to growth nor equity.Similarly, the concerns about the growing ranks of the educatedunemployed derived from the Asian experience in the 1970s lead theinternational development community to underrate the fundamental im-portance of investment in education and training in African countriesin the advice and investments they offered.
Since the technolog' -al, institutional, skilled manpower and physicalrescurce endowments of many Asian countries are closer to those of
54

50 Le le
Africa in some respects than the solutions derived directly either fromthe West or from these various western perceptions of the relevanceof the Asian experience to Africa, it might be fruitful to make directcomparisons between the two continents to determine more preciselywhere lessons are transferable and where they are not. For instance,semi-aridness is a major reason for Africa's poor agricultural perfor-mance. India has two-thirds of the world's cultivable area that is classified
as semi-arid and Africa has one-third. It is instructive, therefore, toexamine where growth in agricultural production occurred in India andwhy, and to examine the implications for Africa's prospects in semi-arid agriculture. Similarly, small-scale irrigation and low-levelagricultural technology used extensively in Asia can benefit Africa inplace of the tractorized schemes and large-scale irrigation dams financed
by foreign aid to date. As a prototype of the Asian case, I will explorethe sources of growth in India's agriculture, the causes of that growth,and the role that foreign aid has played in that process to derive in-sights for the development of African agriculture. To do so, I first reviewthe international economic environment which currently determines thelevel, size and sources of foreign aid to Africa and which influencedthese levels in India. I then outline briefly the motivations of aid as theydetermine the type and certainty of aid. This in turn influences the ex-tent to which recipient country policymakers feel that they can rely onexternal financing as a source of government expenditures. I then ex-amine the role of agriculture in economic development. Afterwards,by reviewing India's agricultural development experience and the roleof foreign assistance in the process, I identify the sources of India'sagricultural growth and the causes of that growth. I then examine thesimilarities and differences in the domestic policy environments andaid between the African countries and India to draw implications fromthe comparative experience for future agricultural development in Africa.
The International Environment for Aid
The rapid growth in agricultural production in North America, Europeand Japan since the mid-1970s has greatly increased the world surplus
55
.

Foreign Assistance 51
stocks of grain in the 1980s. This situation is radically different from
the period in the 19f:Ds when India was the major beneficiary of con-
cessional aid. Then the United States was the only major source of
surplus food and foreign aid and thus the dominant source of advice,
institutional innovations and new technological possibilities introduc-
ed in the agricultural sector in India. The sources of aid to the develop-
ing world have greatly diversified since then, as has the prosperity among
western nations. For instance, a large number of Western European
countries and Japan as well as Eastern Bloc countries are giving con-
cessional assistance to Africa. Consequently, ideas in theform of policy
advice, investments, and institutional and technological possibilities and
skills introduced through foreign aid into African agriculture are highly
diverse, frequently creating much confusion on the African scene. This
is especially the case as the ability of African governments to distinguish
between the quality of advice and assistance is greatly limited due to
their own limited capacity in terms cf trained manpower and institutions.
While the souxces and levels of food and financial aid have increased
steadily until the early 1980s, they also contain the danger of providing
a false sense of security to the recipients, reducing the urgency of deal-
ing with domestic policies which often inhibit the development of
agriculture. Concessional aid levels to Africa have declined from 1984
levels as a result of concern about aid effectiveness and also the reces-
sionary trends in OECD countries. Willingness of the African govern-
ments to adjust their domestic policies has in turn been influenced by
their concern about the decline in aid level and also by the need for
increased national ,,elf-reliance. The differing views of the diverse donors
adds to the confusion on policy adjustments in Africa.
While the broad general directions of policy reforms areclear enough,
there is much disagreement as to the speed with which such reforms
can be implemented, the size of beneLts that will ensue from the reforms
and the speed with which the benefits will accrue. The :arge agricultural
surpluses of the OECD countries have changed the international markets
and prices by causing a downward pressure on world agricultural prices;
this has been reinforced by the countries in Asia becoming exporters,
a situation which did not exist in the 1960s. Developing countries of
5 6

52 Le le
Africa on the one hand face lower real prices for their agricultural ex-ports due to these surpluses of commodities such as sugar, edible oil,etc., and on the other hand suffer from thecompetition of low-cost im-ported cereals. Meanwhile, their own domestic food production con-stitutes the major source of employment and income for a great ma-jority of their populations, with over 60 percentof their cultivated areaunder cereal production. Cheap food imports can increase the real in-comes of urban populations, but by depressing internal terms of tradethey can reduce the incomes of agricultural producers in developingcountries, especially if there is no growth in the productivity of theiragriculture to compensate for these price declines. If African countries,in addition, face large deficits in their balance of payments resultingfrom a combination of their own failed import-substituting industrializa-tion policies of the 1970s and also therecessionary world market forcesreferred to above which have reduced tie prices of their exports, thisexplains the need for macroeconomic reform in their countries to ad-just to the changing world market. An increase in the domesticagricultural factor productivity which will reduce the cost of Africanproduction and make it more competitive with cheap agricultural im-ports or exports ofcompetitors is thus the most important way co avertrurther decline in the real incomes of African countries.
Motivations of Aid
Aid is prompted by many reasons. Recipients have preferred to thinkof aid much in the way that Senator Fulbright considered it, namely,as a form of progressive international taxation in which a small shareof the income of high-income countries is mobilized and transferredto their low-income counterparts for the latter's development. Sincedeveloping countries are dependent on primary commodity exports, theprices of which fluctuate more than those of manufactured goods andservices exported by developed countries, these countries have arguedfor aid so as to stabilize their export income. The concept of aid as
a form of income transfer, however, has not had a broad appeal in the
5 7

Foreign Assistance 53
United States, although a large majority tends to be in favour of emergen-cy aid on humanitarian grounds. Public opinion surveys show, for in-stance, that while 79 percent of those interviewed in the U.S. approv-ed of emergency aid oni" 19 percent supported long-term developmentassistance.
Aid, is course, also given by developed countries to meet theirstrategic, military or foreign policy concerns. In the case of aid pro-grams of the United States, this has often resulted in assistance beinghighly concentrated on a few countries of the world, regardless of theirdevelopmental needs. U.S. aid levels to specific countries have alsobeen quite unstable, depending on changes in those foreign policy orstrategic considerations. Aid given to create long-term markets for thegoods and services produced in the developed countries has more recentlysimply resulted in the disposal of surpluses existing in the OECD coun-tries in the form of commodities, trained manpower or underutilizedindustrial capacity. Such desire for surplus disposal frequently results intying of financial aid to the supply of equipment or trained manpowerof the donor country, which may not be the most desirable for thedevelopment of recipient countries.
Motivations for aid may thus greatly affect the size, as well as theform and stability, of aid. Aid-giving countries may also refuse m sharethe secrets of their success so as to avoid future competition from reci-pients. Aid may thus increase dependence of recipients in the short runwithout the possibility of its leading to self-reliance in the long run.This is, c ' course, a greater problem with bilateral than multilateralaid such as that of the World Bank, which is not tied to a particularsource and is not related to strategic and military interests of individualcountries.
Interaction of Foreign Aid with Domestic Policies
We now move on to consider the interaction of the level, form andstability of aid with the motivations for aid and its effects on the domesticpolicies of recipient countries by taking the example of India. Nearly60 percent of the $10 billion of U.S. aid received by India between 1949
58

54 Le le
and 1982 was given in the form of food aid, another 20 percent in theform of nonproject aid, and only 17 percent in the form of project loans.Bilateral assistance by the U.S. to India was relatively low until about1958, accelerated sharply to a peak in about 1968, and then declinedsharply, especially from about 1972, to the point of becoming insignifi-cant. Given its large size (750 million population), aid levels to India,on a per capita basis, have been very lcwat their peak in 1965-66being $2.6 compared to $20 to $50 per capita in many African coun-tries currently. Only about 12 percent of these expenditures was onagricultural projects, most of a small-scale nature.' This situation isin contrast to that of many African countries in several ways. First,in Africa not only is the overall level of aid much higher, but thedependence on food aid is very small in comparison with India's. Foodaid constitutes only about 10 percent of total aid to Africa, comparedto over 50 percent of U.S. assistance to India. Much of the aid is inthe form of financial aid and also in the form of projects. In contrast,much of the U.S. assistance to India was in the form of commodityor program aid and only a small amount in project aid. Project aid inAfrica has tended to tax the limited planning and implementation capacity
of the countries, as the resources devoted to developing such capacityfiirther have been relatively limited, unlike in India. Also, quite a signifi-cant amount of technical assistance has been provided to help in theimplementation of projects. It is estimated that close to $4 billion werecommitted by OECD countries in the form of technical assistance toAfrica during the 1970s.
Relatively little of this technical assistance has been allocated to im-proving domestic policy, planning and implementation capacity. Indeed,much of the "learning by doing" has involved the technical assistancestaff and, due to their short tenures, there has been much loss of learn-ing by doing. This is an especially serious problem given that Africancountries start from a poorer initial base of trained manpower and in-stitutional development that did India. In India, only about 1,400 U.S.agricultural advisors are estimated to have resided on a long-term basisfrom 1952 to 1973, and never more than 150 advisors at any given pointin time. Only about 3,200 Indians were trained in agricultural and natural
59

Foreign Assistance 55
resource issues during this period. These numbers do not seem largein relation to India's size and needs. Yet there is a general belief thatthe U.S. made an important contribution to India's agriculturaldevelopment.
I argue in this paper that it is the quality and the form of assistancewhich was the basis of this contribution and it is the nature of the in-teraction of aid with domestic agricultural and overall policy which ex-plains the success. The contributions appear to be in the form of:(1) developing of indigenous human and institutional capacity foragricultural research, policy, planning and evaluation, and (2) input intothe formation and implementation of an overall agricultural policy whichwould be conducive to growth. We will stress that the initiative for im-proved policy and planning ultimately came from India. The successivedroughts, increased dependence on foreign aid and external interferencein domestic policy affairs from about 1958, when foreign aid accelerated,until about 1965 when it reached a crescendo for India to reform itsagricultural policies and to put in place a package of internally consis-tent reforms which would increase production led to this initiative. Good*luck also played a part. Apart from India's obviously better institutionaland trained manpower base, the existence of technologies it could im-port as well as the institutional models for technology generation it couldborrow and install at home made a difference to its prospects. Finallyand of considerable importance, India had been experimenting with dif-ferent policies since the early 1950s and there was much accumulatedlearning through this process; when the crisis arose in the mid-1960s,India was able to utilize tits valuable learning experience. We will showthat these preconditions are nit enjoyed by Africa to the same extent.
Until about 1963, India pursued a growth strategy which stressed animport-substituting industrialization policy in which agriculture had arelatively small role. During the first three plan periods the proportionof investments going to the agricultural sector ranged between 6 per-cent to 10 percent. India has been broadly criticized for keeping itsagricultural price:, low prior to 1967.2 Our analysis indicates that In-dian prices were well above world market prices for wheat between1957 to 1972, however, even when measured in real effective exchange
00

56 Le le
rates (see Figure 3). Only in the case of rice were prices below interna-tional prices prior to 1967.
Programs for the development of agriculture, however, tended to focuson community development and extension programs airied at convinc-ing farmers to adopt modem technology. But the most important factorto be emphasized is that the physical response of production to fertilizerswas relatively low for the traditional varief es of wheat and rice (Desaihad estimated fertilizer response coefficients of 12kg per lkg of nutrientfor irrigated wheat under local conditions, the equivalent coefficientsbeing 10kgs for rice). It is noteworthy that despite the impressive an-nual growth rate of nutrient use of 19.8 percent annually, the averageannual rate of growth for foodgrain output was about 3 percent per yearduring this period and there were substantial year-to-year fluctuationsin overall production that tended to be influenced largely by weather.Dependence on imports had increased to meet domestic food re-quirements. Figure 1 shows the domestic availability of food grains in-cluding the rising imports in the mid-1960s. Figures 2 and 3 show therelationship of domestic to international prices of rice and wheat in In-dia and illustrate the less favorable treatment of rice in terms of inter-national prices as well as relative to wheat. Figure 4 shows the growthof fertilizer use in India. While India's dependence on financial assistancehad increased by 1958 as a result of a foreign exchange gap createdby an ambitious second plan and aggravated by the persistent need forcommercial food imports, by 1966 net food imports had grown to over10 million tons.
The role of price policy reform vis-a-vis other agricultural policiesis worth considering in the context of India's agricultural growth since1967. President Johnson believed that India was not serious about anagricultural policy reform. Further support for India's development bythe U.S. and the World Bank, which had begun to emerge as a majordonor, was contingent on India's devaluating its currency as well asa package of policies for the agricultural sector including increased pro-ducer prices for rice and wheat, increased imports of fertilizers and pro-motion of their role for the private sector and concentration among theprogressive farmers in high potential areas, and support of prices for
61.

Foreign Assistance 57
Figure 1Availability of Foodgrains in India
Million metric tons (thousands)140
120
MO
80
60
40
S/mt600
500
400
300
200
t951
Year
1971
Figure 2Domestic and International Price of Rice
1960
11111.11.1111Year
1970 1080
62
Gross Production
Total Availability
Own /realeff rate
Ow. price. off. rate
International Price

58 Le le
the agricultural sector by a newly established food corporation of Indiabecoming the buyer and seller of last resort. Many of these policiesare similar to those now being advocated in African countries. It hasgenerally been the U.S. belief that the imposition of these conditionson India in the mid-1960s as a prerequisite for receiving financialassistance from the U.S. and the World Bank, codified in the "Treatyof Rome" between the Indian minister of agriculture and the U.S.secretary of agriculture, had a profound impact on India's food situation.
Indeed, frequently the 1965 episode in India is cited in the contextof the current discussion on policy reform in Africa, suggesting thatachievement of the same policy reform in Africa, if necessary throughthe same type of conditionality, might solve Africa's problems.
There are, however, several important differences between the In-dian and African cases which are worth highlighting.3 First, much ofthe productivity growth in India occurred under irrigated conditions.In contrast, only 6 percent of the area under cultivation in Africa isirrigated. Not only was India's initial base of irrigated agriculture larger(18 percent of the area under cultivation being irrigated), but the newhigh-yielding technologies induced further investment in irrigation. Sec-ond, the high-yielding rice and wheat varieties used in India were theresult of major technological breakthroughs which had occurred in theinternational agricultural research institutes. In the case of wheat, thisresulted in a Nobel Peace prize for its discoverer. Estimated responsecoefficients of high-yielding wheat under irrigated conditions are 20kgsper kg of nutrient, or 66 percent larger than under traditional varietiesand of rice 15kgs, or 50 percent higher than traditional varieties.
Even then, the political decision to concentrate the use of fertilizerin limited areas of high potential was a difficult decision for the Indiangovernment. I have documented elsewhere that there was internal op-position to this approach from almost every important Indian lobby,including the intellectuals, the communists, the state governments, whowould not gain from such concentration, the planning commission,because it would require increased foreign exchange, etc. Nevertheless,subsequent fertilizer use in India was highly concentrated in high potentialareas.
63
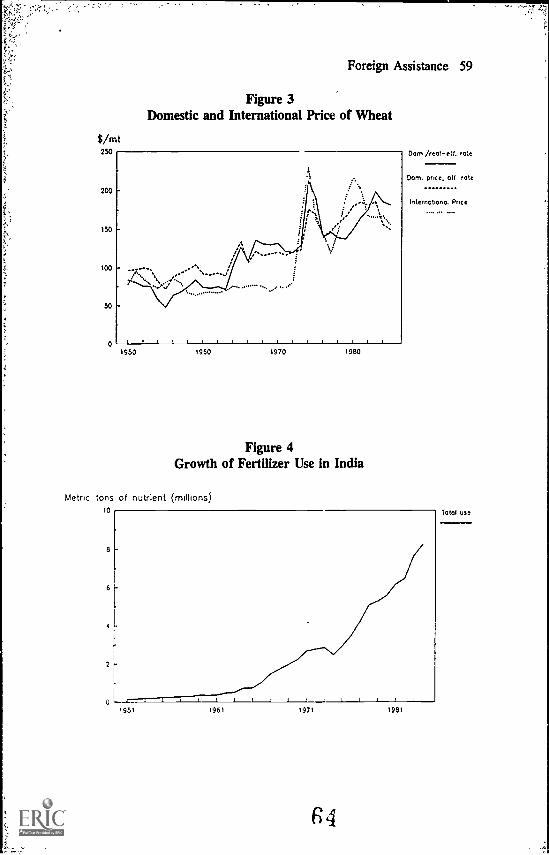
8/Mt250
Foreign Assistance 59
Figure 3Domestic and International Price of Wheat
0 I ll II 111111111111.1950 1960 1970 1980
Figure 4Growth of Fertilizer Use in India
Metric tons of nutrient (millions)10
Dorn /reofe11. rote
Dorn. price, off rote
Internotiono. Price
6 ..-
4
2 r
0
1951 1961 1971
6 4
1981
Totol use

60 Le le
Most important, with the assistance of the Rockefeller and Ford Foun-dations and the U.S. government, India had been attempting to buildup its agrkultural research system starting as early as the late 1940s.The food crisis, however, provided the basis for pushing through dif-ficult policy decisions with regard to the research system's reorganiza-tion that had been stalled for nearly 20 years due to the internal resistanceto reform. Therefore with the advent of the food crisis, India was ableto put into operati6n an effective research system. This made the subse-quent adjustirmts to continue to maintain its productivity gains possi-ble. Such an adaptive research capability is particularly important inthe case of crops which encounter highly diverse growing conditionsand which therefore require a high degree of local adaptation. This wasthe case with regard to rice. The Indian research system was ultimatelyable to issue 221 varieties of rice to address the many diverse adoptionproblems faced in the promotion of new rice varieties.
Table 1 shows that irrigated wheat alone accounted for an astonishing99 percent of the increase in productivity during the 1968-69 to 1981-82period. Rice contributed another 15 percent. During the earlier 1956-57to 1968-69 period, wheat and rice had contributed 89 and 79 percentrespectively to increased productivity. Because the contribution of otherrainfed crops to the overall growth in production such as millet, sorghum,
maize, etc., which are the dominant crops in Africa as well, was nilor n :;ative (meaning the area under cultivation of these crops declineddue to competition of higher productivity crops), the combined con-tribution of wheat and rice accounted for over 100 percent of aggregateproductivity growth. There was a complex input substitution with thenew technology. In the rainfed areas, the new technology increased pro-ductivity from irrigation more and the spread of minor irrigation, par-ticularly from tubewells, was very rapid. Whereas tubewells accountedfor only about 6 percent of irrigated area in 1960-61, they accountedfor about 14 percent by 1970-71 and 20 percent in the mid-1970s. Inthe irrigated areas, use of fertilizer accelerated as the marginal produc-tivity of fertilizer curve shifted urwards and flattened out at a muchgreater input level. But because use of fertilizer on rainfed areas grewslowly, total fertilizer use increased at an annual rate of about 12 per-cent, slower than before. It is noteworthy that the foodgrain produc-
65

Table 1Crop-Wise Contributions of Individual Effects to the Change
in Aggregate Productivity by Period(Rupees per hectare)
1956/57 to 1968/69
Crop
Pureyieldeffect
Purelocationeffect
Locationinteraction
effect
Purecroppingpatterneffect
Croppingpattern
interactioneffect
Sum ofeffects
Bajra 3.53 -0.23 -0.03 -2.09 0.14 1.37 (0.78)Barley 1.54 -0.06 0.20 -10.03 -0.97 -9.32 (-5.33)Cotton 2.81 0.05 -0.07 -33.44 0.55 -30.10 (-17.20)Groundnuts -1.36 0.16 0.18 14.48 -2.57 10.89 (6.22)Jowar -0.16 0.18 0.01 -4.15 -0.17 -4.29 (-2.45)Maize 1.17 0.09 0.19 19.39 2.29 23.1; (13.22)Pulses 2.11 1.40 -.068 -15.87 0.20 -12.83 (-7.33)Ragi 0.03 -0.01 0.01 -3.68 0.10 -3.54 (-2.02)Rice 25.45 0.88 0.00 16.24 7.71 50.09 (28.62)Sugarcane 0.77 0.37 0.00 -1.03 0.15 0.25 (0.14)Small millets -0.09 -0.01 0.02 -6.49 0.09 -6.48 (-3.70)Wheat 20.05 1.23 1.42 95.12 38.00 155.82 (89.05)
Total 55.86 4.04 1.12 68.45 45.52 174.99 (100.00)(31.92) (2.31) (0.64) (39.12) (26.01) (100.00)
68

1968/69 to 1981/82
Crop
Pureyieldeffect
Purelocationeffect
Locationinteraction
effect
Pure0.-uppingpatterneffect
Croppingpattern
interactioneffect
Sum ofeffects
Bajra 0.72 -0.24 -0.45 -6.65 -0.17 -6.80 (-2.57)Barley 1.10 0.21 -0.14 -15.37 -2.45 -16.66 (-6.29)Cotton 3.77 1.08 0.20 -4.64 -2.65 -2.23 (-0.84)Groundnuts 2.66 -0.06 0.83 -9.50 -0.39 -6.46 (-2.44)Jowar 6.69 -0.31 -0.11 -7.46 -1.66 -2.86 (-1.08)Maize 0.07 0.20 0.20 -9.31 0.09 -8.74 (-3.30)Pulses -1.15 -1.88 0.69 6.23 0.44 4.33 (1.64)Ragi 2.05 -0.09 -0.03 -1.61 -0.20 0.11 (0.04)Rice 20.41 3.51 1.50 10.88 3.01 39.30 (14.84)Sugarcane 0.56 0.17 -0.01 12.33 0.51 13.57 (5.12)Small millets 0.30 -0.22 0.08 -10.25 -0.16 -10.25 (-3.87)Wheat 32.07 2.93 0.40 206.01 20.11 261.51 (98.75)Total 69.24 5.28 3.15 170.65 16.49 264.83 (100.00)
(26.15) (1.99) (1.19) (64.44) (6.23) (100.00)
SOURCE: Bindlish (forthcoming).
( ) Indicates percent of the sum of the effects for the period.
67

Foreign Assistance 63
tion growth rate accelerated to 3.5 percent annually during 1965-66 to1976-77, despite the deceleration in fertilizer growth rate by over 40percent to 12 percent annually. This would suggest an improved effi-ciency of fertilizer use brought about by two related factors: technicalchange in the form of the new grain varieties with higher fertilizerresponse coefficients and an acceleration in the rate of growth of ir-rigation (table 2) induced by the enhanced profitability of the newvarieties.
Table 2Growth Rates for Foodgrain Production, Fertilizer Use
and Irrigated Area
Foodgrains Fertilizer Irrigated area
Annual 3-yr. avg. Annual Gross NetPeriod
1951/52 - 64/65 3.03 2.97 19.84 2.14 1.951965/66 76/77 3.83 3.54 11.78 3.11 2.711977/78 - 84/85 2.65 2.32 9.06 2.64 1.88
1951 52 - 84/85 2.89 2.86 16.06 2.74 2.22
SOURCES: "Area and Production of Principal Crops in India," Gow.rrunent of India, "Fer-tilizer Statistics," The Fertilizer Association of Inca.
NOTES: Information on foodgrain production was available onl, through 1983-84. Informationon irrigated area was availably only through 1981-82. "Annual" refers to a simple yearly series,while "3-yr. avg." refers to a three-year moving average series. Irrigated area rates use an an-nual series.
Finally, since the U.S. was the only supplier of food and since itsreserves were declining rapidly, India realized that, should a deficit arise,increased reliance on the U.S. for food imports was likely to be un-wise, as it would result in increased world food prices given India'slarge food import requirements. It was also injurious to national pride,as it would compromise India's pursuit of an independent foreign policybecause of the dependence on scarce U.S. stocks. Thus Indianpolicymakers were able to overcome a number of formidable domestic
68

64 Le le
obstacles to reform, although the individuals involved in the reform paida substantial cost. (Mr. Subramaniam, the minister of agriculture, forinstance, lost the election in 1967 because of a perception that he hadbecome too pro-American.)
The current discussion of macroeconomic and sectoral policy condi-tionality tied to financial aid of donors in Africa, as well as the increas-ed food imports, are reminiscent of India's situation for those involvedin such assistance earlier. Nevertheless, many differences exist, althoughmany African countries have devaluated, revised their food prices andliberalized fertilizer imports and distribution as did India. There havebeen relatively few technological breakthroughs in the case of cropsgrown in the semi-arid areas of either Africa-or India, however. Theexception is hybrid maize, which has shown impressive growth in manyparts of Africa where similar effective services in the form of timelyfertilizer supply, extension and output marketing facilities have beenavailable. Some technological possibilities exist, but require effectiveadaptation of varieties and practices to local conditions such as that doneby the Indian research system in the case of rice earlier. The nationalresearch systems of most African countries, v ith the exception of Zim-babwe and Kenya, have not shown the capacity to organize adaptiveresearch programs which would lead to the production of more suitableplanting material.
Unlike in India, donors who have focused on project aid until recentlyhave neglected the development of national research systems; contraryto much conventional wisdom on the subject, they have assumed thatborrowing technology from the international research systems and con-ducting on-farm adoptive research without building the national researchsystem which will carry out effective on-statit. n research will addressthe problem. They have therefore not invested in either the develop-ment of national research systems or in the training of nationals on thescale necessary. Now that national research systems have been recogniz-ed to be a critical bottleneck, however, all donors, who often have con-flicting ideas as to what research to conduct and how, have begun tofocus on the systems, creating much competition and confusion in theAfrican countries, especially given the limited resources they can bringto bear.
69

is
Foreign Assistance 65
The implications of food surplus in the world must also be consideredhere in their effect on .aotivation to address policy problems in Africa.Food aid is relatively easily available to African governments, whosefood import requirements are small. Therefore, they have not yet at-tached the degree of priority to the long-run development of their ownscience and technology capacity and to the improvement of theiragricultural delivery systems to experience sustained growth in produc-tion and productivity. Although some are experimenting with policyreform, attempts at policy reform are by themselves unlikely to solvethe problem. Even in encouraging policy reform, however, the donorshave not yet begun to program their assistance to create the long-runpolicy planning capacity in African governments. Such emphasis oncapacity building is needed, given the fact that African countries startwith a poorer initial base.
The contrast between India and Africa shows that the nature and theseverity of external shocks can make a difference in the extent to whichpolicymakers in developing countries are willing to undertake reform.In India's case, however, both good planning and good luck played amuch more impottant role than is generally acknowledged. India's oK ntrained manpower and domestic economic planning ability could beharnessed in a period of crisis. The small number of donors helpingIndia placed emphasis on strengthening India's policymaking, implemen-tation and technological capacity.
These comparisons reinforce the point frequently made in the caseof African agriculture, namely, that the sources of stagnation of rain-fed agriculture are quite complex and will require a much longer timehorizon to overcome. They will require a much more sustained effortthan either donors or African governments are yet fully ready toundertake.
NOTES
1. 'These data are assembled in Arthur A. Goldsmith, "Amencan Foreign Assistance andAgricultural Development in India," background paper prepared for the World Bank Develop-ment Strategy Division, 1985.

66 Le le
2. See Michael Lipton, Why Poor People Stay Poor: Urban Bias in World Development. Cam-bridge Harvard University Press, 1977; T.W. Schultz, Development and Change in TraditionalAgriculture: Focus on South Asia. East Lansing:Asian Studies Center, Michigan State Universi-ty, 1968; and Paul Streeter and Michael Lipton, eds., Crisis of Indian Planning. London: OxfordUniversity cress, 1968.
3. The discussion in the succeeding paragraphs draws from Uma Lele and Arthur A. Goldsmith,Building Agricultural Research Capaci7: India's Experience wit,: the Rockefeller Foundation andits Significance for Africa, DRD Discussion Paper *213, December 1985.
71
United States Agriculturein the
Global Context
John W. MellorInternational Food Policy Research Institute
United States agriculture is in a global context. On the order of halfthe farm land in the United States is used to produce for export. Withoutoverseas markets, the amount of adjustment American agriculture wouldrequire to bring domestic supply and demand into balance is almost im-possible to conceive. That adjustment would involve the movement outof agriculture, of about half of the resources of American agriculturalproduction. If comparative advantage was at work without overseasmarkets, the bulk of farmers would leave agriculture and well over halfof all the land which is now in agriculture would convert to other uses.American farmers must think in a global context, must recognize thattheir future depends on export markets and must recognize where thoseexport markets are. This hardly seemed a problem a decade ago, butit is very much a problem now.
Before I proceed, I would like to state a simple message and a broadthought. We should all be thankful for the bountiful harvests occur-ring in much of the world. We should be concerned that if we are com-placent about those harvests, they will diminish in the future. We shouldbe apprehensive that the extreme complexity of the task of using thesebountiful harvests to banish hunger and to bring prosperity to those whoproduce them will turn us away from the policies needed to sustain anduse that abundance.
I am grateful to Leonardo Paulin and J.S. Sarnia for stimulating interaction on these importantissues, David Chesser for developing much of the data, and especially to Tom Harrington forhis efforts in developing data and drafting the paper.
67
72

68 Mellor
The Current Situation
Today there appears to be an abundance and even a glut of food. Insharp contrast, a little more than a decade ago the World Food Con-ference was called to recommend immediate action to deal with scarci-ty and even famine in Asia and Africa. Global cereal stocks in themid-1980s have been more than twice as large as in the mid-1970s.Real world cereal prices in 1985 were 30 percent lower than in 1981,compared to an almost twofold increase from 1972 to 1974. Real fer-tilizer prices have fallen to eoual the lows of the late 1960s, after hav-ing more than quadrupled in real terms from 1971 to 1974. A lack ofnatural feedstock is now much less worrying than inadequate invest-ment in fertilizer production. The focus of food shortage has switchedfrom Asia to Africa.
In the early 1970s, not only was food scarce, but so were the inputsfor producing it. If a low-income country had a crop failure, it wasdifficult for them to command the foreign exchangeto import necessaryfood, food aid was greately diminished, and it was difficult to purchasefertilizer on the open market even if the countries had the necessaryfinancial resources. That was an extremely difficult time for all fooddeficit countries and particularly the low-income ones.
Finally, many developing countries were diverted from long-termdevelopment efforts by overwhelming debt problems and the need formajor adjustments in foreign exchange rates and their national budgets.'
In comparing the 1980s with the i970s, it is worth making note ofthe switch in emphasis of food problems from Asia to Africa. In Asiain the late 1960s famine was widespread and the scarcity of food wasacute. People like the Paddock brothers, in Famine 1975, were writingin favor of triage. The Paddock brothers argued that the food situatiunwas so hopeless in Asia that close to a billion people should be writtenoff as having no hope for survival. Although that idea was foolish eventhen, it is well to note how bad the situation looked at that time. Africa,however, seemed to be a continent abundant with land and with amplesupplies of food.
The Green Revolution in Asia accelerated the rate of growth offood production considerably in the late 1960s and the 1970s. That,
'?3

is
The Global Context 69
combined with the generally more favorable food situation in the worldand growing incomes in many Asian countrieswhich allow them toincrease food imports when in needhas switched the world food prob-lem away from Asia. In Africa, however, per capita food productionhas been declining rapid!), for a decade or two. Per capita consumptionhas also fallen. That has occurred in the midst of a miserable economicperformance in most African countries that has resulted in acute foodscarcity even in the face of the present global abundance.
Underlying Trends,
Food production and consumption data for many developing coun-tries are notoriously poor. Thus in examining the data and drawing con-clusions about past trends and certainly for extrapclations into the future,one must be cautious. For some commodities, such as cassava in Africa,different sources show trends going in opposite directions, not just dif-ferences in magnitude. Thus we will be particularly careful with theroot crop data, and we will be careful to deal only with large aggregates,which, one can hope, average out discrepancies in the data.
It is also worth adding that analysis of these trends is useful for get-ting an indication of the forces affecting supply and demand. Given thatthese forces tend to be stable and powerful, it gives us a basis for look-ing into the future. Despite the statistical difficulties, the policy con-clusions which follow from the analysis are significant. They, of course,may lead inexorably to policy actions unacceptable to important interestgroups. Thus, even analysis of past trends becomes a controversial mat-ter. The facts of the global food situation are as contentious as theextrapolations.
As we discuss these underlyir trends, we will see that the dynamicglobal food supply/demand bat .ice links the interests of developed anddeveloping countries and ha.. important implications for foreignassistance, agricultural research policy, and the domestic agriculturalpolicy of the United States.
For the period 1961-80, developing countries' cereal production grewat an annual rate of 2.9 percent per year; consumption grew at the
74
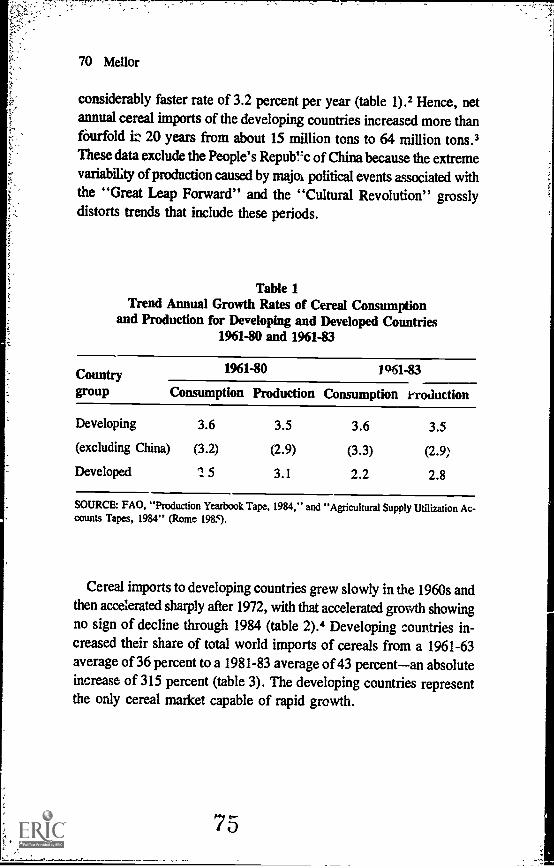
70 Mellor
considerably faster rate of 3.2 percent per year (table 1).2 Hence, netannual cereal imports of the developing countries increased more thanfourfold is 20 years from about 15 million tons to 64 million tons.3These data exclude the People's Repurc of China because the extremevariability of production caused by major political events associated withthe "Great Leap Forward" and the "Cultural Revolution" grosslydistorts trends that include these periods.
Table 1Trend Annual Growth Rates of Cereal Consumption
and Production for Developing and Developed Countries1961-80 and 1961-83
Countrygroup
1961-80 1961-83
Consumption Production Consumption eroduction
Developing 3.6 3.5 3.6 3.5
(excluding China) (3.2) (2.9) (3.3) (2.9)
Developed ':5 3.1 2.2 2.8
SOURCE: FAO, "Production Yearbook Tape, 1984," and "Agricultural Supply UtilizationAc-counts Tapes, 1984" (Rome 1980.
Cereal imports to developing countries grew slowly in the 1960s andthen accelerated sharply after 1972, with that accelerated growth showingno sign of decline through 1984 (table 2).4 Developing countries in-creased their share of total world imports of cereals from a 1961-63average of 36 percent to a 1981-83 average of 43 percentan absoluteincrease of 315 percent (table 3). The developing countries representthe only cereal market capable of rapid growth.
'7 5

The Global Context 71
Table 2Growth Rates and Relative Shares in Cereal Trade
1961 to 1983
Countrygroup
Average annual growth rate* Relative shares
1961-83 1961-72 197243 1961-65 1970-74 198143(percent) (percent)
ImportsDeveloping 6.0 3.0 8.1 36 35 43Developed 4.6 4.0 3.3 64 65 57
ExportsDeveloping 3.4 2.7 6.2 19 15 15Developed 5.5 3.9 4.8 81 85 85
*Based on trended FAO data.
Table 3
Distribution of World Cereal Imports by Country Groupings1961-63 and 1981-83
1961-63 1981-83
Countrygroup
Millionmetric tons Percent
Millionmetric tons Percent
Developed countries
Developing countries
All countries
54.9
30.9
85.8
64
3G
100
130.8
97.5
228.3
57
43
100
SOURCE: FAO, "Agricultural Supply Utilization f.,....ounts Tape, 1984" (Rome 1985).
From 1961 to 1980, cereal production in the developed countriesgrew3.1 percent per year. Consumption grew at a much slower pace, 2.5percent per year, with the difference representing a rapidly growingexportable surplus.5 Developed country imports and exports droppedsharply from 1981 to 1984, with a substantial recovery in 1985.6
7

The Futr.,es.: Projections to 2000
Projections of past trends for food supply and demand, though anuncertain indicator of the future, have three features that recommendthem: they smooth the effects of short-term influences such as weather;they illuminate the effects of cumulative forces; and they show poten-tial changes in a country's position from net importer to net expoi/erand vice versa, arising from given supply and demand changes. Suchprojections are particularly revealing for food, for which underlyingstructural forces of supply and demand only change slowly.
A standard projection from 1980 to 2000 for developing countries,assuming that trends in output and income from the 1960s to 1980s con-tinue, shows an increase in the shortfall (or imports) of staple food cropsof 40 million tons. Actual net imports in 1984 were on the projectedtrend line.?
Growth in the demand for livestock products is an important sourceof growth in the demand for basic food staples. While in developingcountries waste and by-products initially sustain livestock production,accelerated growth of livestock output quickly surpasses the inelasticsupply of such feed. Further increments to production are made large-ly on concentrate feeds, particularly cereals. The projections cited aboveassume constant feeding rates in livestock production.
If, however, we project the trend growth of feed use during the baseperiod and further assume market relationships for livestock productsat constant relative prices, the production shortfall in developing coun-tries increases by another 40 million tons.8 It must be emphasized thatthis projection of feed ut -equires a return to the per capita incomegrowth of the 1966-80 period. The debt and structural adjustment crisesmust be met and passed beyond.
Developing countries have been expanding livestock product importsrapidly. Since livestock production is generally labor intensive, it islogical for developing countries to displace projected imports withdomestic production. Success in such an effort would, conservatively,add another 40 million tons to food crop imports.
These favorable circumstances in essence mean that developing coun-tries would improve their development strategy and return to the growth

The Global Context 73
rates of the 1960s and 1970s. If they did this, developing country im-ports would grow at a rate similar to or higher than in the past twodecades.
Three caveats must be noted about such projections. First, one musttake these numbers in aggregated form and not look at individual coun-tries. That is because so many of the unpredictable events in the worldbenefit some countries and not others. For example, in the 1970s growthin most of the oil-producing countries surged ahead, it is said, at theexpense of many oil-importing developing countries; perhaps the reversewill happen in the 1990s. Countries differ in their natural resourcebases:Argentina and Thailand have very different ratios of people toagricultural nroduction resources from Taiwan or Bangladesh. On al'_these matters, grouping countries helps us see central tendenciesattimes vie do want to see the forest and not the trees.
Second, and very important, when we look at food gaps and tradefigures, we are looking at small residuals from large estimates of con-sumption and productionsmall differences in production and consump-tion data give large differences in "trade." It is rash indeed to predicttrade volumes and their effects on global prices.
Third, we are poorly placed to judge the effects of pure sciencebreakthroughs in biology on agricultural production. Keep in mind thatwhile such breakthroughs add to demand as well as supply in develop-ing countries, they add only to supply in developed countries.
Theory
Before (1-awing conclusions, it is useful to briefly outline the theorythat lies behind the trends and relationships just presented, a theory thatgives credibility to such projections. I abstract grossly for brevity .9
In developed countries, food demand is virtually satiated and hencedoes not increase with income. In contrast, food output grows con-tinuously through research and various complementary institutions.Without export growth, the benefit of technological change can onlybe realized by undertaking the socially difficult task of rapidly withdraw-ing resources (land and people) from agriculture.
7
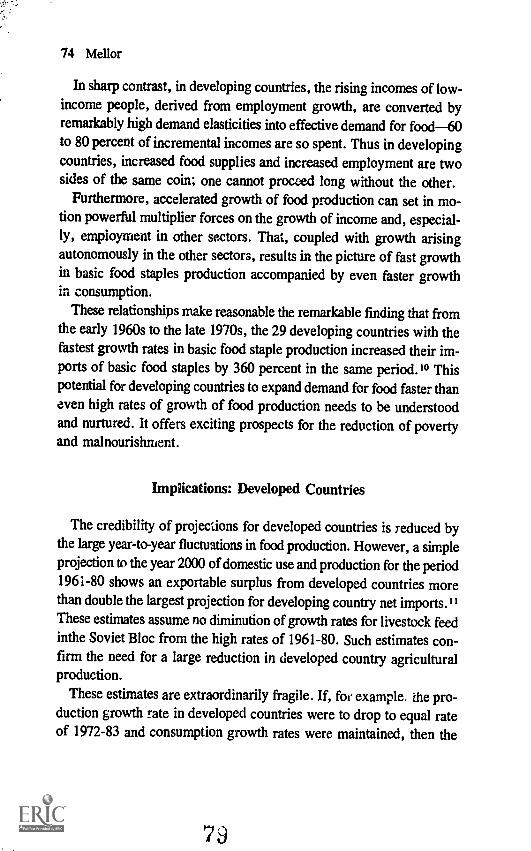
74 Mellor
In sharp contrast, in developing countries, the rising incomes of low-income people, derived from employment growth, are converted byremarkably high demand elasticities into effective demand for food-60to 80 percent of incremental incomes are so spent. Thus in developingcountries, increased food supplies and increased employment are twosides of the same coin; one cannot proceed long without the other.
Furthermore, accelerated growth of food production can set in mo-tion powerful multiplier forces on the growth of income and, especial-ly, employment in other sectors. That, coupled with growth arisingautonomously in the other sectors, results in the picture of fast growthin basic food staples production accompanied by even faster growthin consumption.
These relationships make reasonable the remarkable finding that fromthe early 1960s to the late 1970s, the 29 developing countries with thefastest growth rates in basic food staple production increased their im-ports of basic food staples by 360 percent in the same period.10 Thispotential for developing countries to expand demand for food faster thaneven high rates of growth of food production needs to be understoodand nurtured. It offers exciting prospects for the reduction of povertyand malnourishment.
Implications: Developed Countries
The credibility of projections for developed countries is reduced bythe large year-to-year fluctuations in food production. However, a simpleprojection to the year 2000 of domestic use and production for the period1961-80 shows an exportable surplus from developed countries morethan double the largest projection for developing country net imports."These estimates assume no diminution of growth rates for livestock feedinthe Soviet Bloc from the high rates of 1961-80. Such estimates con-firm the need for a large reduction in developed country agriculturalproduction.
These estimates are extraordinarily fragile. If, for example. the pro-duction growth rate in developed countries were to drop to equal rateof 1972-83 and consumption growth rates were maintained, then the
79

The Global Context 75
developed countries would actually become net importers.12 Unfortunate-
ly, while prediction of developed country exports is highly uncertain,it matters immensely to the choice of development strategy in develop-ing countries.
Since the production trends in developed countries are very muchsubject to policy, it is well to keep in mind the following points.
First, developing countries as a group will prosper more if they donot face rapidly rising food prices driven by their own demand. Con-versely, they will be harmed by intermittent dumping on internationalmarkets and the consequent unpredictable periods of sharply depress-ed prices.
Second, demand is much more responsive to price in developing coun-tries than in developed countries, while supply is more responsive indeveloped countries than developing countries. Thus, rising global foodprices foster surpluses in developed countries and reduce demand indeveloping countries, primarily through effects on the poor.
Third, however, the pace at which export surpluses are generatedin developed countries now appears to be rapid enough to depress in-ternational prices severely, suggesting a need for stuctural adjustmentsin develop-xi countries despite the rapidly growing Third World market.
Fourth, given the social costs in developed countries of dras .rallyreduced food production and the potential to raise food demand indeveloping countries through food aid-based employment growth, it islogical to develop such programs on a much larger scale than at present.
Implications: Developing Country Exporters
There are now few developing country net exporters of cereals. Twocountri's, Argentina and Thailand, with their favorable land-to-personratios, accounted for 68 percent of total developing country cereal ex-ports in 1979-83 and will export considerably larger amounts by 2000."There are probably one or two other developing countries with similarland resources and export potential but with unfavorable policies thathold back their agricultural potentials. These few countries are severe-ly injured by food dumping by high-income countries.

76 Mellor
It is important for American farmers to recognize that while theirmarkets lie in developing countries, there are very few developing coun-tries that have a potential to be major exporters. They have in the pastsupplied about a quarter of the increment to developing country com-mercial food imports; three-quarters has been left for the developedcountries, including the United States.
In sharp contrast to Thailand and Argentina, the bulk of the coun-tries projected to export food in the future are poor countries with high-population pressure. That is a quite different story.
In projections to 2000, countries with per capita incomes less than$500, strikingly, provide 83 percent of developing country net exportsof major staple foods other than those of Thailand and Argentina. Inparticular, four countriesChina, India, Indonesia, and Pakistanaccount for 71 percent of projected developing country net exports, ex-cluding Argentina and Thailand (table 4).''S
Table 4Relative ;Jams of Projected Developing Country Net Production Surpluses
by Level of Per Capita GNP (1980), 2000
Net production surplus PercentageProjected net surplus 2000 of totalcountries by level of production
per capita GNP (Million 20001980 metric tons) (Percent) (Percent)
Less than $500 50.1 43 61
(China, India,Indonesia, Pakistan) (42.9) (37) (58)
Greater than $500 66.3 57 11
(Argentina, Thailand) (56.2) (48) (6)
SOURCE: Data set used in preparing IFPRI Research Report 52, Food Trends in the Third World:Past Trends and Projections to 2000. Projections based on FAO "Production" and "AgriculturalSupply Utilization Accounts" tapes according to methodology described in Appendix I of ResearchReport.
Si

The Global Context 77
Exports of food clearly represent a failure in employment generationand poverty alleviation for countries with per capita incomes less than$500. Half or more of their populations are deficient in food ir"'The countries in the low-income group projected to becometend to be large and populous, to have a substantial percentagetotal GNP in nonagricultural sectors, but a large percentage of tot it lat orforce in agriculturethe former typically twice the latter." Their lowper capita GNPs are, in general, increasing slowly. These characteristicssuggest that they have capital-intensive investment policies causing lowgrowth in employment, to the detriment of their low-ircome people.A change in investment strategy would foster faster and more equitablegrowth, accelerate the food production growth rate and change thesecountries from food .exporters to food importers.
We now see an interesting question. Is the tendency of some low-income countries with large, hungry populations to export a result ofbad policy or is it a passing structural problem? One could argue thatsince the problem is concentrated in the under $500 per capita incomecountries, and seems to resolve itself when income exceeds that level,that we should just wait. But there are difficulties in getting a countrywell enough organized so that the small and medium scale service andmanufacturing sectors, which are so employment intensive, can expandrapidly. The argument would run that as the development process -to-ceeds, the infrastructure is built, the trained personnel are developed,and the institutional structures necessary for rapid growth in employ-ment are created. The lower-income countries simply have not yet finish-
ed these complex tasks, but they will.Alternatively, one might argue that countries such as Indonesia, In-
dia, Pakistan and the People's Republic of Chira, the principal coun-tries in this category projected to have large exports despite widespreadhunger, have simply followed wrong development policies, that theyhave concentrated their capital on a few, large-scale, highly capital-intensive industries that create little employment. This leaves little capitalto spread over most of their population, meaning that activities that areemployment-intensive are starved for capital. In this argument, a changein the policies these countries have for prices, the allocation of capital,
P4

78 Mellor
and public sector investment would bring about much more rapid growthin employment and the demand for food. Those countries would thencease to be exporters and would move on to the import market as doso many other developing countries wit.' a similar economic situation.I will return to this issue later under the question of policy for foreignassistance and for American agriculture.
Implications: Developing Country Importers
It is notable that, virtually without exception, developing countrieswith per capita incomes greater than $500 are able to generate demandfor food more rapidly than domestic production growth. Developingcountry importers with per capita incomes less than $500 also manageto increase employment Id hence effective demand more rapidly thanproduction. Of course the least developed countries with the lowest in-comes simply have low growth rates in food production. They are ableto use foreign assistance and food aid to keep consumption somewhathigher than would otherwise be possible.
The number one policy need for net food importing countries is aninternational environment in which food supplies are reliable. If theyare to expand employment more rapidly than food production, they mustbelieve, first, that the shortfalls generated by these divergent trends canbe met without steadily rising prices. That means there must be a reliableinternational market. Secon ', and perhaps even more important, theyneed to be protected from radical fluctuations in domestic and interna-tional supplies. For the latter, one needs a source of international financesuch as a well-operating International Monetary Fund cereal facility.Whether enlarged stocks are needed as well is a moot point.
In order for employment growth to increase demand for food morerapidly than domestic supply, there must be wide participation in thedevelopment process. This, in turn, requires a rural infrastructure thatbrings most people into close contact with the improved markets andtechnology necessary for the modernization of agriculture. There is alsoa need for the development of employment linkages between agriculture

The Global Context 79
and the rest of the economy so that growing agricultural incomes willproduce expenditure patterns and responses to those patterns favorableto the growth of rural industry and employment. Agricultural growththrough cost-decreasing technological change is the basic engine forsuch growth.
A Note on Foreign Assistance Policy
Foreign assistance policies that support a strategy of growth orientedtoward increasing agricultural production and employment are favorableboth to growth and to poverty alleviation in developing ,.:ountries andto increased markets for food exporters. What are the broad policyoutlines of such a strategy?
First and foremost is investment in agricultural reseaich and its supprtservices to start the engine of growth. Agriculture is a difficult sectorto move because of the c )nstraints on the land area. Thus the growthof agricultural production is subject to rapidly diminishing returns andhence increasing cos' unless agricultural research is performed, as hasbeen so dram. successful in the United States, effectively so asto come up with new technologies that increase yields per acre. Thosesame technologies, which are essential in land-limited Asia, also raiselabor productivity under the conditions in Africa where labor produc-tivity is a more serious problem than land productivity.
Second is assistance to growth of infrastructure to ensure '3readth ofparticipation in growth. In a world of food surpluses, hungry people,and inadequate rural employment, investment in infrastructure offersimmense potential for the effective use of food aid, particularly in thelow-income countries. It is puzzling that hunger and lack of labor forbuilding infrastructure, can coexist wiL huge food surpluses.
Third is increasing food security nationally and internationally. Thatis needed because a strategy relying on food and employment growthis terribly vulnerable to the effects of normal fluctuations in foodproduction.

80 Mellor
Behind all these processes is a rapid expansion of trained peopleahigh-employment strategy of growth is accompanied by extraordinari-ly rapid growth in demand for educated people at all levels. Foreignassistance is most efir,ctive when helping meet that demand.
Agricultural Research Policy
I want to comment specifically on agricultural research policy fordeveloning countries in the current glObal food context because of thecen,..d role of research to agricultural progress. The onset of the GreenRevolution in Asia was very much a product of American foreignassistance. in part from the foundations, particularly the RockefellerFoundation and the Ford Foundation, and in part from U.S. govern-ment foreign assistance. Assistance to agricultural research develop-ment in Asia, and now in Africa, continues to be an important elementof foreign assistance.
At the same time that agricultural research forms such an importantelement of foreign assistance, we find farmers in the United States whoare concerned at loss of export markets, wondering whether helpingdeveloping countries to do _gricultural research that firings about in-creasAl production is going to provide competition in the domesticmarkets of those countries and even from exports. As we can see froma few countries such as Argentina and Thailand, and looking into thefuture, even more from some of the poorer countries, that is a legitimateconcern. I have tried to emphasize how foreign assistance may be con-structive in helping demand to increase more rapidly than the supplyof food in the low-income countries characierizkd by great poverty, shor-tage of food, anu malnutrition.
The new environment of apparent global abundance of food bringssomewhat differing requirements for food production reset..: !-:
First, there must be an even greater emphasis than in the past on 'educ-ing the costs of production and hence raising incomes. In Asia, costreductions occur by raising yields per acre. In Africa, the problem is
85

1.
The Global Context 81
more complex. Labor productivity is the greatest limitation to produc-tion in Afiica. We can already substantiate that, in general, the ap-propriate way to raise labor productivity in Africa is through yield-increasing technology.
In Asia, since the International Rice Research Institute's pioneeringwork, which generated the variety IR8, we have not seen a major in-crease in rice .eld potential or reduction in the cost of producing rise.In fact, the reap .ost of production has been slowly rising over the pastdecade. Recent efforts have been dedicated largely to maintainingthe yieiis produced by IR8 and widening the benefits of such varietiesby increasing their adaptability and improving their resistance to diseasesand pests. In this context, one can truly talk about saturation of the ricearea with these high-yielding varieties. How will the growth rates ofthe recent past be maintained into the next decade or so? That is a seriousproblem in Asia. Our impression of food abundance will disappea- withina decade or two without another research brealaktough.
Second, with a more bountiful food supply in the world, we havethe opportunity to take more meaningful steps towards sustainabi. z. r-titin agriculture. On the one hand, we must increasingly shift higher-yielding, more productive farming systems into environments wli:-,eecosystems can sustain such increased intensity. That shoulc' allow agradual increase in the proportion of population in areas more able tosustain it, while reducing population pressures in areas that cannot sus-tain arable agriculture. We must ask ourselves what the implicationsare of this to two related research questions: (1) Under what cir-cumstances and by what mechanisms can we use the increased abun-dance of food in the world to reduce population pressures more rapidlyin areas that cannot support arable agriculture? (2) Should that then pushour research resources more towards the perennial gasses and tree cropsthat can be sustained in such areas?
Third, when the abundance of food increases, we must maximize thelinkages between agricultural growth and employment growth innonagricultural sectors. That too requires research. Increasingly, lackof effective demand for food is proving to he a constraint for develop-ing countries with per capita incomes less than $500, in spite of
8 6

82 Mo lor
progress in agricultural production. We have done a good job ofdocumenting the existence of linkages between agricultural growth andemployment in other sectors, but we have not gone far in producingthe policy prescriptions for maximizing the size of those linkages.
Fourth, where food is more abundant, we can turn more vigorouslyto increasing employment by developing smallholder livestock produc-tion. Here we face elastic demand for the product and hence a substan-tial increase in demand from a small decline in prices. There are,however, clear technical problems, not only in production but alsoin marketing. Because of the Inelasticity of waste and by-product feedsupplies, research must have a twofold emphasis on increasing theproductivity of grasslands and improving our krowltdge about the pro-ductive use of concentrate feeds. Any enhancement of livestock pro-duction will also help to solve the difficult problem of inferior grains,such as millets and sorghums, and even maize. They are well-suitedto large areas and there are good possibilities for increasing their yields.Yet the demand for them is highly inelastic except as livestock feed.
Fifth, with an increasing abundance of food, we need to focus ourattention more on the problems of the poorest countries and the poorestpeople within those countries. However, these tvo sets of problemscall for different treatment.
There undoubtedly needs to be an emphasis on the better areas withinthe poorest countries in order to increase the returns to investment inagriculture and to generz.re the funds for tackling the much more dif-ficult problems of the more backward areas.
VV e must differentiate clearly between short-term needs to mitigatethe problems of the poorest people in the poorest regions, and longer-term adjustments that can be made as populatior densities in those areasare gradually reduced through more intensive and sustainable develop-ment elsewhere.
Conclusion
Two things seem clear from the foregoing analysis, the first somewhatmore than the second. The future of American agriculture lies with the
67

The Global Context 83
development of developing countries. They must raise their incomes,not just generally but among the lower-income half of their populationspecifically, so that those people have the purchasing power to increasetheir expeaditures on food and to improve their diets. Thus it is in theinterest of American agriculture to see development move quickly indeveloping countries. Because those countries are largely agricultural,that can only happen by developing their agriculture. Because they haveeither a shortage of land or extremely low labor productivity, incomesin agriculture can only be increased through research-based technological
advance. Thus we find the anomalous situation that it is good forAmerican agriculture to vigorously support agricultural research indeveloping countries so that they can increase the productivity of theiragriculture. That proves not to be an anomaly because, af, irtromes inthose countries rise, people spend a high percentage of their increasedincome on food. That is in sharp contrast to the developed countrieswhere rising incomes of even quite low-income people essentially donot increase demand for food.
The second conclusion is that, at their rate of grov th of food pro-duction over the last two decades, the developed countries will pro-duce far more than is necessary to meet the import heeds of developingcountries. Thus there will undoubtedly have to be structural adjustmentin the agricultures of the developed countries. This is not just the UnitedStates and Canada, but also Western Europe. That structural adjust-ment need not necessarily come from reduced prices, but our experienceis that without lower prices the fiscal cost to governments is far morethan they are willing to bear for long, although one cannot help butnote that the willingness to bear high fiscal costs to support agricultureseems to be quite great. In both Western Europe and the United States,we are shouldering subsidies to agriculture that are multiples of whatwas thought the 'Irgest possible a decade or so ago.
If we put the first point and the second point together, we 1 ye a caveat:that if we expect developing countries to emphasize both increasing theirdemand for food and increasing production of food in their countries,we are asking them to throw themselves or n to the vagaries of weatherto a much larger extent than with alternative strategies. If they are todo that, they will want to believe and will want to know thin food security
88

84 Mellor
is assured to them. That can be done through the financing facilitiesof the International Monetary Fuld so that poor people in poor coun-tries can bid food away from livestock during periods of scarcity. Italso means that the developed countries, while making adjustments totheir agricultures, must be careful not to go too far and bring back thefood scarcities of the 1570s.
Let us hope that the present abundance of food is not an illusion ora quickly passing aberration. Let us recognize abundance for the bless-ing it is. Let us respond by raising incomes in developing countries withnew, cost-effective food production technology; by using food surplusesto back labor-intensive investment in the infrastrinture that so broadensparticipation in growth; by providing food security measures that reducethe risks governments face; by caring about poverty and acting to reduceit; e.nd most important, by learning now how to bring the lower-incomecountries to the stage of development where effective demand for foodoutruns effective agricultural development policies.
NOTES
1. As cited in "Commentary: The Changing Global Food SceneOpportunities for Developmentand Poverty /Alleviation," IFPN Report, Vol. 8 (3) (Washington, D.C.. International Food PolicyResearch Institute, October :986).
2. Food and Agriculture Organization of the United Nations, "Production Yeabook Tape, 191)4"and "Agricultural Supply Utilization Accounts Tape, 1984" (Rome: FAO, 1985).
3. Food and Agriculture Organization of the United Nations, "Agrcultural Supply UtilizationAccounts Tape, 1984" (Rome: FAO, 1985). "Developing Countries" includes China, the twenty-year period referring to 1961-65 to 1979-83 averages of net annual cereal imports.
4. Food and Agriculture Organization of the United Nations, "Agricultural Supply UtilizationAccounts Tape, 1984" (RDme: FAO, 1985). The annual growth tate of cereal imports w developingcountries changed from 3.0 perceist (1961-72) to 8.1 percent (1972-83).
5. Food and Agriculture Organization of the United Nations, "Production Yearbook Tape, 1984"and "Agricultt al Supply Utilization Accounts Tape, 1984" (Rome: FAO, 1985).
6. Food and Agriculture Organization of the United Nations, "Agricultural Supply UtilizationAccounts Tape, 1984" (Rome: FAO, 1985).
7. As cited in L.A Paulin, Food in the Third World. Past Trends and Projections to 2000, ResearchReport 52 (Was'iington, D.C.: International Food Policy Research Institute, 1986), Table 12,p. 42. The praection excludes China, and assumes trend growth in production (1961-80) andconsumption (I iced op per capita Income growth trends 1966-80 and FAO elasticities for foodand meat consu...rtion).

The Global Context 85
8. Pauline, Food in the Third World, Table 15, p. 62.
9. This argument is developed fully in John W. Mei'or and B.F. Johnston, "The World FocdEquation: Interrelations Among Development, Employment, and Food Consumption," Journalof Economic Literature, 22 (June 1984).
10. Twenty-nine rapid agricultural growth developing countries increased their food imports from2.37 (1966-70) to 8.57 (1976-80) million metric tons, ail increase of almost fourfold.
11. Projections were done for developed countries as a group and compared production and totaldomestic use by a methodology similar to but simpler that that of Paulinoi.e., based on notincome elasticities of demand but trend comsumption patterns. Feed was projected on a trend;food was projected to remain c.astant at 1966-80 per capita consumption levels times the ex-pected increased ixipulation.
Different base years chosen for production yielded varied outcomes, ranging from a high netsurplus of production of 400 million metric tons (1961-80) production trend to a low net deficitof production of 57 million metric tons (1972-83) production trend. When developed countrieswere projected by regi,:nal groupings, the net surplus was 136 million metric tons. reflecting ahigh rate of feed consumption in Eastern European countries.
12. See footnote 11.
13. Food and Agriculture Organization of the United Nations, "Production Yearbook Tape, 1984,"and "Agricultural Supply Utilization Accounts Tape, 1984;; (Rome: FAO, 1985), and projec-tions in Paulin, Research Report 52. Argentina is a net exporter of 17 million metric tons andThailand of 6 million metric tons (1979-83 averages), and they are projected to have net surplusesof 26 and 30 million inlric tons respectively, in 2003, or 50 percent of the total projected net surplus.
14. From data set on individual countries used in Paulina, Food in the Third World. Assumptionsof projections are the same as described in footnote 1.
15. Da , from World Bank, World Tables, Volumes 1 and 2 (1983).
80

8b Mellor
Additional Readings and References
Bachman, Kenneth L. and Leonardo Pau lino. Rapid Food Production Growthin Selected Developing Countries: A Comparative Analysis of Underly-ing Trends, 1961-76. Research Report 11. Washington, D.C.: Interna-tional Food Policy Research Institute (October 1979).
Mollor, John W. The New Economics of Growth: A Strategy for India andthe Developing World. A Twentieth Century Fund Study. Ithaca, NY:Cornell University Press (1976).
Mellor, John W., Christopher L. Delgado, Malcolm J. Blackie (eds.).Accelerating Food Production Growth in Sub-Saharan Africa. Baltimore,MD: The Johns Hopkins University Press (1987).
Mellor, John W. and Gunvant M. Desai (eds.). Agricultural Change and RuralPoverty: Variations on a Theme by Dharm Narain. Baltimore, MD: TheJohns Hopkins University Press (1985).
Mellor, John W. and B.F. Johnston. "The World Food Equation: Inter-relations Among Develonment, Employment, and Food Consumption."Journal of Economic Literature, 22 (June 1984).
Paulino, Leonardo A. Food in the Third World: Past Trends and Projectionsto 2000. Research Report 52. Washington, D.C.: International FoodPolicy Research Institute (June 1986).
Sanna, J.S. and Patrick Yeung. Livestock Products in the Third World: PastTrends and Projections to 1990 and 2000. Research Report 49.Washington, D.C.: International Food Policy Research Institute (April1985).
Sarma, J.S. Cereal Feed Use in the Third World: Past Trends and Projectionsto 20010. Washington, D.C.: International Food °olicy Research Institute(forthcoming).

Foreign Assistanceand
American Agriculture
C. Peter TimmerHarvard University
A major policy confrontation is brewing over United States technicalassistance to agricultural development efforts in developing countries.The longer U.S. farming remains in a financial depression due to com-petitive pressures on its agricultural exports, the more vehement is thecriticism that U.S. bilateral and multilateral aid to developing coun-tries, especially to their agricultural sectors, is stabbing American farmersinthe back. Directors of international agricultural programs in the na-tion's land grant universities feel this heat most directly, as their budgetsare subject to review by state legislatures. Most of the faculty involvedin these programs also have speaking and extension responsibilities thatput them in day-to-day contact with farmers. United States Departmentof Agriculture and USAID officials are grilled on this topic during theirtestimony to Congress.
The response to these pressures has been a careful and documentedappeal to the empirical record based on a growing volume of acad-,,micanalysis of the relationship between agricultural growth in developingcountries and trends in agricultural imports, especially from the UnitedStates. There now seems to be a rough consensus in the agriculturaldevelopment profession that a positive connection exists between thesetwo dimensions of the development process. The best summary of thisview is from Earl Kellogg, an agricultural economist who serves asassociate director of the International Agriculture Program for theUniversity of Illinois, in a state that feels very keenly the competitivepressures on exports:
Developing countries continue to be the best potential growthmarkets for U.S. agrict !tura) exports. To realize this poten-
87
92

88 Timmer
tial, they must achieve economic growth that results in in-creased per capita incomes and foreign exchange availabili-ty. Because of the size and economic importance of theagricultural sector in developing countries, it must contributeto this economic growth. In addition, developing countriesmust be able to export products in which they have a com-parative advantage. To accomplish this growth in income andexports will require that developing countries obtain capitaland technical assistance for agriculture and other economicsectors. If growth and development are achieved, develop-ing countries can continue to be important customers for U.S.agricultural exports.
For a number of reasons, then. improving agricultural andfood production in developing countries is important to U.S.interests. These efforts benefit people living in poverty, im-prove the chances for world peace and stability and also con-tribute to the long-term prosperity of American agriculture.'
Most of us in the economic development profession hope that thisviewthat development assistance benefits both recipient and donoristrue. The historical record is reassuring. A study of the 1961 to 1976period by Bachman and Pau lino for the International Food PolicyResearch Institute (IFPRI) noted a positive relationship betweenagricultural production and staple food imports.
The data suggest that staple food exporters have little causeto worry about the rapid growth of food production in thedeveloping countries. Staple food imports in the rapid-growthcountries increased much faster than exports, and, conse-quently, net imports continued to grow. Although thz, in-creases in food production in the study countries are im-pressive, it is evident that i most of these countries foodproduction growth rates lice ! to be maintained or furtheraugmented to ir eet the increasing demand for staple foods.
The expansi in of both staple food exports and importsreflects on one hand the increased production capacity in par-ticular crops in these countries and, on the other, the rapid-ly increasing demand generated by population growth andrising income levels. Income-induced increases in demandappear to arise from the growing demands fora "reater varie-ty of foods as consumption patterns change. Data from anumber of rapid-growth countries indicate that part of the
93

Ame. n Agriculture 89
increased demand for staple foods arose from the expandinguse of staple foods for conversion into livestock and poultryproducts.2
Kellogg cites analysis carried out at USDA that also supports thishypothesis.' Lee and Shane present Malaysia as an example of a coun-try that is becoming a consistent and growing importer of U.S.agricultural commodities, especially feedstuffs, while rapidly developingboth domestic and export-oriented agriculture.4 A masters thesis at theUniversity of Illinois conducted statistical analysis of 77 countries andfound that in "no estimated equation were results obtained that show-ed a negative coefficient significantly different from zero for the cor-relation between per capita agricultural production in developing coun-tries and their per capita imports of agricultural products."5 Case studyanalysis of Brazil and South Korea as rapidly-growing countries andof Sierra Leone as a slowly-growing country further substantiated thesestatistical results.6
Thomas Morrison of the IMF Research Department has investigatedthe long-term and short-term factors affecting cereal imports in 1979/80.On t! basis of a regression model for 48 countries which incorporatedsuch long-run factors as GNP per capita, population density on arableland, average annual cereals production per capita (for the years1977-79), and share of population living in urban areas, as well as short-run factors such as cereal production in 1979 as a percentage of theaverage, food aid (cereals) per capita, and gross international reservesavailable at the end of January 1979, relative to the average for the1977-78 period, Morrison concluded as follows:
Of the long-term determinants, level of economic develop-ment is the most significant in explaining cereal imports. Thecoefficient . . . is positive and significant at the 99 percentconfidence level. This result is consistent with the hypothesisthat level of economic development, through its relation to'onsumption demand . . . positively influences per capitacereal imports. The urbanization variable . . . without theGNP variable, has the expected positive coefficient, but thecoefficient is not significant.
Of the variables indicating domestic production capacity,only population density is significant. The coefficient is

90 Timmer
positive and significant at the 95 percent confidwicelevel. . . . This variable, indicating population pressure onarable land, is the most reliable variable representing totaldomestic food production capacity.
Cereal production per capita [average] has the expectednegative coefficient, but is not significant. One reason whythe coefficient is not significant is probably . . . that in manycountries non-cereal crops represent significant shares of totalfood production.
. . . The regression equations explained between 41 and82 percent of the variation in per capita cereal imports acrosscountries. Since government policies can have a significantinfluence on the level of cereal imports regardless of coun-try characteristics ar circumstances, one cannot expect suchregression equations to have greater explanatory power. Thefact that the equations have as much explanatory power asthey do probably reflects the strong influence the countrycharacteristics and circumstances have on government policiestoward cereal imports.
. . . The empirical results yield certain implications forthe future of cereal imports by developing countries. It ap-pears that the rapid growth of cereal imports by developingcountries during the 1970s, particularly by the middle-incomecountries, will continue to the extent that these, countries e%-perience economic growth and pass into ;Agher stages ofeconomic development. Although popui.aion growth in thedeveloping countries has declined from its peak of about 2.4percent in the mid-1960s to about 2.2 percent currently, in-creasing population pressure on arable land will continue tobe a significant factor affecting cereal imports in theforeseeable future. While food aid as a share of the cerealimports of developing countries has declined considerablyover the 1970s, it will continue perhaps in a more limitedway to provide cereals to those who could otherwise not af-ford them. Thus, the same factors that caused the rapid growthof cereal imports by the developing countries during the 1970swill continue to exert their influence in the 1980s.7
This line of argument is reasonable and comforting, but it is nowdemonstrably wrong for the 1980s. Why? The world debt crisis, theovervalued U.S. dollar, and U.S. farm policy are usually cited as reasons
93

American Agriculture 91
why erc,rts of U.S. agricultural products to the developing countrieshave not grown since 1980. Kellogg, for example, drawing on the workat ERS by Longmire and Mory on exchange rate problem and by Shaneand Stallings on the debt crisis, offers the following ..,Immary andobservations:
Although agricultural exports to developing countries haveincreased in the past several years, total U.S. agriculturalexports have recently decreased from $43.8 billion in 1981to $38.0 billion in 1984. There are three major reasons whythis has happened.
(1) The exchange rate of foreign currencies for U.S. dollarshas increased. For example, it now takes 32 percent moreGerman marks to buy one U.S. dollar's worth of U.S. goodsthan in 1981. A recent USDA study [Longm' ' 'Rnd Mory]concluded that the stronger dollar cost the Unita. States about$6 billion in lost farm exports over the two-year period1981-83.
(2) Some U.S. domestic agricultural policies tend to resultin U.S. agricultural commodities being priced above worldprices. This is obviously not good policy if one wants to en-courage agricultural exports in a competitive world economy.
(3) Total world agricultural trade has decreased since 1980because of reduced economic growth in many countries andincreased indebtedness of many developing countries. Shaneand Stallings have estimated that the debt problem alone haslead to a loss in potential export sales to developing coun-tries of up to 20 percent.
None of these major reasons for declining U.S. agriculturalexports has to do with increasing agricultural production indeveloping countries which is one of the objectives of U.S.universities and AID collabo:-ation. From 1981 to 1984,developing country per capita agricultural production hasessentially remained constant. Therefore, in the aggregate,increases in agricultural production within developing coun-tries has not caused the decline in U.S. agricultural exportssince 1981.8
This paper argues that all of these factorsthe overvalued dollar, U.S.agricultural policy, and the mounting debt in developing countriesare connected and in turn are related to changing agricultural produ --
98_. .....

92 Timmer
Lion in developing countries. Although a focus on any speciYic factorresults in a positive relationship between U.S. assistance for agriculturaldevelopment and subsequent value of U.S. farm exports, the pictureis not so positive when all the factors are considered together. In otherworlds, a global general equilibrium perspective has different conclu-sions from those of a partial equilibrium one and has important implica-tions for the role and impact of U.S. foreign assistance. The ultimateconclusions in this paper remain positive, but they contain potentiallyunhappy messages for American agriculture and the need for it to ad-just to new competitive pressures in world markets.
Explaining Import Demand for Grain
Why do countries import grain? To ask the question in such a baldway raises several possibilities other than trade patterns determined byshort-run costs as reflected in the comparative advantage of trading part-nets. Recent emphasis on the food price dilemma faced by many develop-ing countries suggests that grain imports might equally be treated asa policy instrument of governments attemrting to reach an implicit orexplicit set of objectives for their food sectors. These objectives canrange from maintaining a price level (frequently "low") for a prefer-red foodgrain, assuring price stability, providing "control" overfoodgrain markets through a government food agency, provisioning alivestock-feeding industry that produces meat for urban consumers, oreven gaining the benefits of free trade.9
If the volume of grain imports is determined simultaneously with other
important government policy actions, models designed to predict im-port levels must come to grips with the basic dynamics of each coun-try's political economy. In those countries where foodgrain prices arean important ingredient in those dynamics, as they are in most coun-tries of the world, a complex relationship exists among microeconomic
demand patterns, macroeconomic policies, including basic foodgrainprices, and conditions in the world market for food and feedgrains. Itis as wrong to think that grain imports are determined by relative costsand comparative advantage as it is that they are determined solely by
97
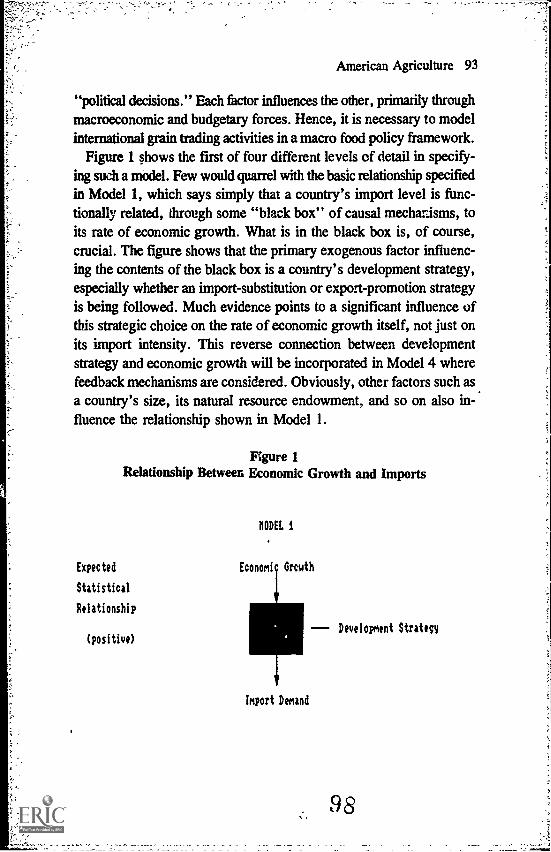
"political decisions." Each factor influences the other, primarily throughmacroeconomic and budgetary forces. Hence, it is necessary to modelinternational grain trading activities in a macro food policy framework.
Figure 1 shows the first of four different levels of detail in specify-ing such a model. Few would quarrel with the basic relationship specifiedin Model 1, which says simply that a country's import level is func-tionally related, through some "black box" of causal mechanisms, toits rate of economic growth. What is in the black box is, of course,crucial. The figure shows that the primary exogenous factor influenc-ing the contents of the black box is a country's development strategy,especially whether an import-substitution or export-promotion strategyis being followed. Much evidence points to a significant influence ofthis strategic choice on the rate of economic growth itself, not just onits import intensity. This reverse connection between developmentstrategy and economic growth will be incorporated in Model 4 wherefeedback mechanisms are considered. Obviously, other factors such asa country's size, its natural resource endowment, and so on also in-fluence the relationship shown in Model 1.
Figure 1Relationship Between Economic Growth and Imports
Expected
Statistical
Relationship
(positive)
MODEL i
Economic Grcwth
Import Demand
Development Strategy
98

Although Model 1 says nothing at all about demand for agriculturalimports from the United States, its trade balance is strongly influencedby the connections in Model 1. In fact, one of the arguments here isthat, from the point of view of promoting U.S. exports, iar more isat stake in the overall growth process reflected in Model 1 than inagricultural imports per se.
Agricultural imports are the focus of Models 2 and 3. Figure 2 presentsa rough summary of the structural relationships posited implicitly Prexplicitly in the work cited by Kellogg and summarized in a recent reportfrom the Curry Foundation, authored by Paarlberg.10 The chain of causa-tion is still fairly simple. Agricultural development, including risingstaple food production per capita, positively influences the overalleconomic growth process through another black box mechanism. Thisgrowth translates into import demand through the same factors as inModel 1. Overall import demand leads to growing demand foragricultural imports, again through a set of complex causal relation-ships contained in a black box. In Model 2 the black box connectingagricultural development with overall economic growth is mediated bya country's food policy." The mechanisms that connect overall levelof imports with agricultural imports includes a system of supply anddemand relationships for individual commodities as well as the influencesof income distribution, urbanization, other demographic factors, andchanging tastes. As stressed above, these mechanisms also include theset of food policy objectives; instruments, and interventions.
The expected sign of the statistical relationship between factors con-nected by black boxes is also shown in figure 2. Normally, each of thethree relationships should be positive. Agricultural development leadsto economic growth; economic growth leads to larger import demand;and larger overall import demand also leads to larger agricultural im-ports. The last relationship is the least certain in terms of economiclogic and rests primarily on empirical evidence. Since the relationshipbetween rapid income growth and food consumption provides a keypiece of that evidence, a review of this nexus is a majc,: part of thispaper. Whatever the historical record, however, it is easy to postulatemechanisms that would lead to reduced agricultural imports even in theface of economic growth and rising nonagricultural imports.
99

American Agriculture 95
Model 2 provides a rough vehicle for understanding the positive rela-tionship that exists in the historical record betweza a country'sagricultural development and its resulting agricultural imports. Eachof the black boxes, however, contains important economic and politicalrelationships which are subject to change compared with the historicalrecord. In addition, Model 2 is incomplete in terms of explaining the"stabbed in the back" phenomenon because the role of technicalassistance is not yet connected to agricultural development in develop-ing countries, nor are agricultural imports into a particular countrytranslated into the value of U.S. agricultural exports.
Figure 2Relationship Between Agricultural Development
and Agricultural Imports
Expected MODEL 2
Statistical
Relationship Agricultural Development
%positive) Food Policy
Economic Growth
(positive) Development Strategy
(positive)
11111.....
Import Demand
Structure of demand and
supply, income distribution,
food policy
Agricultural Imports
1.00

96 Timmer
Model 3 attempts to specify these additional relationships. Great con-troversy exists over the efficacy of technical assistance in helping low-income countries develop their agricultural sectors. Some would arguethat the record is mostly negative; inappropriate technologies and com-modities are stressed at the expense of village-level knowledge and foodsof the poor.'2 At the other end of the spectrum is a "science solvesall food problems" approach which sees a strong positive link betweenforeign assistance and agricultural development.13 The black box con-necting these two components of Model 3 reflects these controversiesby linking technical assistance and agricultural development throughthe choice of an aid strategy. Perhaps the critical strategic choice iswhether the aid focuses on project or policy assistance, a topic whichis now receiving much attention in the donor community, with resultsthat are beginning to show in world markets.
Model 3 shows two additional components relative to the simple struc-ture of Model 2. A connection between a country's agricultural importsand the volume of U.S. agricultural exports is mediated by factors deter-mining the competitiveness of U.S. commodities in international markets,especially exchange rates and domestic pricing policies, as well as bymarket development efforts by the United States, including the role ofthe PL-480 program. But the United States is concerned with not onlythe volume of agricultural exports but their value as well. To connectvolume with value, it is necessary to determine the price received forthe exported commodity. This connection is shown in Model 3 by theblack box that contains the mechanisms of price formation in interna-tional commodity markets. This particular black box contains many ofthe global general equilibrium mechanisms that provide cause for con-cern that the historical record of the 1960s and 1970s will not play outso nicely for American farmers in the 1980s and 1990s.
Just as in Model 2, all of the expected statistical relationships con-tained in the black boxes in Model 3 are positive in sign. Considerabledebate exists, however, over the two relationships at the bottom. Thereis no doubt that the total volume of U.S. grain exports, for example,is positively related to the volume of world trade in grain. But figure4 shows that the structure of that relationship depends critically on the
101

American Agriculture 97
Fil;ure 3Relationship Between Technical Assistance ana the Value
of United States Agricultural Exports
Expected
Statistical
Rel*.tionshiP
(positive)
(positive)
(positive)
(positive)
(positive)
(positive)
DUEL 3
Technical Assistance
Aid strategy (project
versus policy assistant)
Agricultural DeveloPmcnt
---- Fold Policy
Economic Growth
Development Strategy
Import Demand
Structure of demand and supply,
income distribution, food policy
Agricultural Imports
Voiwne of U.S.
Agricultural Exports
Market Development-FL-480
U.S. competitiveness-farm policy-exchange rate
Price formation in world
cormodity markets
Value of U.S.
Agricultural Exports
1 02

98 Timmer
Figure 4Relationship Between Percentage Change in World Grain Trade
and Percentage Change in United States Grain Exports
X Change U.S. Groin Trod.
Expected RektfonshIp. US. Suppfrer of ()Jet Resort
Statistical Relationship:% change in U.S. grain trade=-0.0311+1.861 x % change in world grain :rade
(1960-1984) (1.4) (8.2) R2=0.743 D-W=2.16
1 3
X Chaps World
Oren Trade
American Agriculture 99
role of the United States in world grain markets. If, as many analystshave argued, the United States has become the de facto "supplier oflast resort," the slope of the line that relates percentage changes in thevolume of world grain trade to percentage changes in U.S. grain ex-ports will be significantly greater than one. If the U.S. were a largebut fully competitive country, the slope should be approximately one.If the United States were a small country in world grain trade, the slopeshould not be significantly different from zero. For the 25 years be-tween 1960 and 1984 the coefficient was 1.86 and the t-statistic 8.2.
An additional issue concerns the strength of the relationship betweenthe volume of U.S. agricultural exports and the value of those exports.If there were a fixed and known elasticity of demand for those exports,the sign could be determined unambiguously. But that elasticity is anoutcome rather than a cause of the relationship. Again, three relation-ships are plausible, depending on the role of the United States in worldgrain markets and the size and competitiveness of those markets. Asfigure 5 illustrates, if the United States acts as a supplier of last resort,there should be a positive relationship between changes in the price itreceives for grain exports and changes in the volume of those exports,which thus guarantees a positive overall relationship between exportvolume and export value.
If the United States is merely a regular competitor in world grainmarkets, there should be no significant relationship between its exportvolume and price received. If the United States acts as a large com-petitor in pursuit of market share in world grain markets, howc.ver, asignificant negative relationship should exist between its export volumeand price. This is the critical elasticity of demand for U.S. exports thatis needed to determine whether export volume and value are positivelyrelated under this trade strategy, but it is precisely the elasticity thatis unobservable from historic data if previous policy has not pursuedthis strategy. The statistical record for the same 25 years shows no signifi-cant relationship between percentage changes in either nominal ordeflated world grain prices and percentage changes in U.S. grain ex-ports, with or without a one-year lag, although the sign is always negativein the estimated functions.
1 o 4

Figure 5Relationship Between Percentage Change in United States
Grain Exports and Export Price of Grain
X Chong.
U.S. Croln Trod.
Relationship:
Smolt Country
\r x
Statistical Relationship:% change in U.S. grain trade=0.065
(1960-1984) (1.7)=0.065(1.6)
Relottonshlp:
Longo County
Stoking to
UoInteln Llorktt Shore
Supplier of
Lost Resort
- 0.188 x % change in real price
( 1.6) R2=0.063 D-W =1.86- 0.041 x % change in lagged real price
(0.3) R2=-0.045 D-W =2.35
1 0 5
X Cnongo World
Export Price
for Groin

American Agriculture 101
The question can now be put directly: what is known from Model3 about the relationship between technical assistance and agriculturaldevelopment h developing countries at the one end and the volume andvalue of U.S. agricultural exports at the other? The historical recordsuggests that each black box is likely to encompass a set of mechanismsthat generate a net positive relationship between the input factor andthe resulting output. If all the black boxes have positive signs, the overallrelationship between agricultural development and U.S. agricultural ex-ports should also be positive. This is exactly the result that Kellogg andhis colleagues have found. So we have some confidence that Model 3captures the short-run and partial equilibrium mechanisms connectingthese two factors.
Two potentially important elements are missing in Model 3. First,the short-run links treated in Model 3 may be superimposed on morepowerful, but lagged, connections that operate in the opposite direc-tion. Some of these lagged relationships are economic but some workprimarily through political choices made in the face of pressuresemanating from the outcomes in Model 3. Second, price formation inworld commodity markets cannot be treated in a partial equilibriumframework. The potential commodity substitutions and impact offinan-cial variables such as debt and exchange rates have a powerful influenceon these prices, which in turn enter the economic and political feed-back mechanisms just noted. When these concerns axe added to the linearformat of Model 3, a much more complex set of relationships emerges,as is shown in Model 4 in figure 6.
The unidirectional causation of Model 3 gives way in Model 4 toseveral circular feedback mechanisms. Two have already been noted:the impact of inward- or outward-looking development strategies onthe rate of economic growth and import demand; and the impact of foodpolicy on agricultural development and its mediating role between thatdevelopment and overall economic growth.'4
The broader feedback mechanisms incorporate connections from bothmarkets and political economy dynamics. On the left side of figure 6,signals from world commodity markets influence both agriculturaldevelopment and economic growth, although with various lags. To theextent that market prices are communicated directly to farmers, the
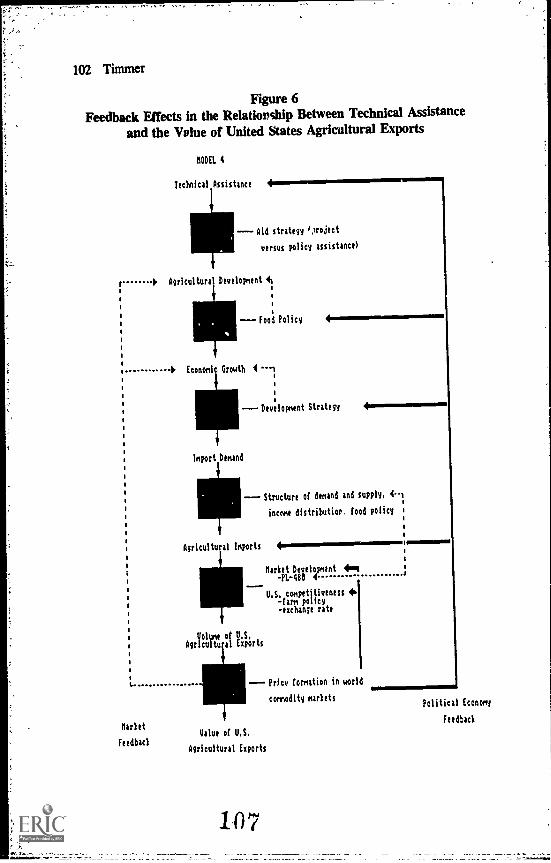
Figure 6Feedback Effects in the Relationship Between Technical Assistance
and the Value of United States Agricultural Exports
MODEL 4
Technical Assistance
----Aid strategy /iroject
versus policy assistance)
Agricultural Development 41
---- Food Policy
Economl Growth 4 ---1
----Dev;lopmtnt Strategy
Import Demand
401Ner
---- Structure of demand and supply, +-
income distribution, food Poling
Agricultural Imports
AgrVoul*turoflVExpo
rts
Witt
feedback
Market Development 404-PL -4 4
U.S. competitiveness 4b-farm policy-exchange rate
---- Price formation in world
coinodity markets
Value of U.S.
Agricultural Exports
1 i1
J
Political Economy
feedback

American Agriculture 103
crucial issue is the supply responsiveness of a nation's farmers to priceincentives. This responsivener is obviously a function of time and ofpublic sector responsiveness as well. At the farm level, farmers mightshift the area devoted to various commodities in the short run, or changefertilizer applications. In the longer run they can invest in water con-trol, better production technology, and ,treater specialization if the marketwill take away their output and provide ample supplies of neededhousehold consumption items in return.
The influence of world commodity markets on economic growth isthrough different mechanisms. By determining the amount of foreignexchange earned for a given volume of commodity exports, these marketsdirectly influence how binding the foreign exchange constraint is. Atthe same time, the signals provide incentives to local entrepreneurs tosupply export markets as opposed to domestic markets. Depressed worldcommodity markets tend to lead to depressed domestic markets throughlocal price competition. Consequently, in those countries that permitrelatively free transmission of world market prices into their domesticeconomies, a strong link exists between those markets and performancein agricultural development and overall economic growth. If one con-sequence of previous rapid agricultural development (and other factorsinfluencing commodity prices) is to push down those prices on worldcommodity markets, then at least one market mechanism is establishedthat will dampen further agricultural development and economic grcwthand thereby lead to a reduction in demand from develr countriesfor commodities from these markets.
The right side of figure 6 shows that th-re are important politicaleconomy mechanisms that establish this connection as well. Growingagricultural imports, especially at high prices, induce countries to devotemore attention to their agricultural sectors to reduce their political ex-posure to unstable world markets. This wariness must be one of themajor outcomes of the world food crisis in the mid-1970s. Some ofthe high prices of that period were felt directly by farmers as countriessimply lost control of their domestic price stabilization programs. Moreimportant for the long run, however, was the signal to governmentsthat it would be both expensive and politicially dangerous to rely on
1 8

fi
104 Timmer
world markets for basic grains, a lesson that was reinforced by the soy-bean etribargo and Soviet grain embargo attempted by the United States.The result was implementation of price policies with better incentivesfor farmers, more investment in rural infrastructure such as roads andirrigation, and far rno-e serious attention to the development of an in-digenous agricultural research and extension capacity (all of which arenow the ingiedients of "good" policy advice).
All of these changes take time to manifest themselves in terms of in-,creased output, but when it arrives on domestic markets, a double-edgedeffect is felt on import demand from world commodity markets. Higherreal prices in domestic markets induce both greater production and reduc-ed demand. The result is sharply reduced import demand or even a switchto exports of important food and feed grains, as in the case of Indonesia,China, and India. If related factors such as falling petroleum prices andhigh debt levels are contributing to sio wed economic growth in low-and middle-income countries, the added market supplies meet very slug-gish growth in demand and thus exacerbr,te the downward price pressureson agricultural commodity markets. In a rather perverse twist, the fall-ing petroleum prices and attempts to earn foreign exchange to meet debtrepayment schedules reinforce these dynamics because agricultural ex-ports have a shorter lead time and learning curve than industrial ex-ports and face less protection in developed countries (until now). A rathervicious downward spiral is set in motion, which was initiated by anapparently healthy response to the world food crisis of the 1970s andthe recycling of petrodollars.
How does the United States respond in such a situation? With surplusagricultural commodities on hand and a stark picture of hunger televis-ed on the evening news, one temptation is to renew the market develop-ment thrust of the PL-480 program, to feed the hungry with America'sbounty. But the potential dangers to agricultural development effortsof dumping our surpluses in substantial quantities into a country'sdomestic food markets are now well recognized." Most countries wouldaccept such food aid only if it directly offset commercial imports other-wise planned. Since this is contrary to both the letter and intent of thelaw, sharply expanded PL-480 shipments do not seem possible.
1O9

American Agriculture 105
The commercial competitiveness of U.S. commodities is determin-ed primarily by the value of the dollar in eoreign currency markets andby domestic farm policy. Both of these factors are affected by pricesin world markets and, in turn, have feedback effects on the outcomeof each of the relationsnips shown in Model 4. Just as the devaluationof the dollatin the early 1970s for reasons unconnected to agriculturestimulated'U.S. agricultural exports and farm earnings, so did its pro-gressive revaluation during the early 1980s dampen those exports andearnings. The U.S. Congress does not legislate much positive agriculturaltrade policy; it does, however, set domestic agricultural price policyto protect farm incomes. The effect until the 1985 Farm Bill was toset the prices of many U.S. export commodities above those of the com-petition and thus lose market share, which resulted in higher prices forour competitors than would prevail with open competition.
The political economy dynamics of this approach are now becomingclear. Large budget deficits forced Congress to design a more com-petitive farm price policy even in the face of existing low incomes inthe American farm sector (but large deficit costs remained because ofcontinued target price support). Additional commodities will move on-to world markets and drive prices down even further, at least temporarily.The lower prices make imports even more attractive to those countriesopen to international grain trade, but they simultaneously threaten fur-ther those countries that maintain active price policies on behalf of theirfarmers. Providing better price incentives to farmers in developing coun-tries has become a main theme of policy advice that accompaniestechnical and financial assistance. A major contradiction is emergingbetween market signals and important elements in the agriculturaldevelopment process. As American farmers watch more andmore coun-tries protect themselves from the pressures of low-priced U.S.agricultural commodities, the political pressures will increase on theland grant universities, USAID, and USDA to stop their assistance toagricultural developme..: programs. Slowing the pace of agriculturaldevelopment, however, will in fact slow the pace of economic growthin the developing countries. They will then serve as less dynamic marketsfor U.S. exports of all goods and services, including, in the short run,exports of agricultural commodities.
11 0

106 Timmer
The Historical Record and Income-Led Growth
Despite the perilous and complicated feedback mechanisms that seemto be operating in-Model 4, the long-run growth of agricultural imports
in developing countries has been a stimulus to U.S. agricultural exports.Figure shows the shares of U.S. agricultural exports to various destina-tiOnS,for:fiscid year 1976-77 and projected-for 1984-85. The share ofdeveloping countries, including China, rose from 35.5 percent in i976-77
to 40.4 percent in 1984-85. The nominal value of total exports roseroughly 60 percent during that time while the consumer price indexrose about 80 percent. After inflation, the real purchases of U.S.agricultural commodities by developing countries remained almost con-stant, helping to offset a decline in the real value of purchases from
Western and Eastern Europe, Canada, and Oceania. Real purchases from
Japan and the U.S.S.R. increased significantly.Two quite separate forces seem to be at work in generating the in-
creased demand for agricultural imports in developing countries. Thefirst, and the smaller in absolute terms, is the failure of domesticagricultural production to keep pace with population growth and fooddemand in urban areas. This is primarily an African phenomenon. Table1 shows that African imports of grain have increased from a total of5.9 million metric tons in 1970 to an average of 24.9 million metrictons for the 1980-83 period, or by 13.3 percent per year. During the
same period, production of corn, rice, and wheat increased 2.2 per-cent per year, substantially behind the 2.9 percent per year increase
in population. Real per capita incomes have also been falling duringthis time, although certain regions and countries have shown signifi-cant increases.16
The great bulk of increased demand for U.S. agricultural exports overthe past two decades has come from income-induced patterns of foodconsumption. This is most readily apparent from table 2, which isreproduced from Monke's paper on international grain trade for theWorld Bank." Total growth in import demand for cereals between1948-52 and 1979-81 was over 170 million metric tons, of which Monkeattributes about 30 million metric tons to declines in per capita grainproduction and about 33.5 million metric tons to population growth.
Ii1.

American Agriculture 107
Figure 7U.S. Agricultural Export Percentage Shares to Selected Destinations
1976-77 and Projected 1984-85 Fiscal Years
Fiscal Year 1976-77
Latin America--8.9
Canada-6.6
Africa-6.6
Middle East-4.6
,Western Europ.-36.5
USSR-4. 4Eastern Europe--2.7
Oceania--0.6Others-7.5
Japan- -13.6
Taiwan
RepXorea 8.9
People's Rep. chinaO.003
Fiscal Year 1984-85
Canada--4.6
1irica--7.2
Middle East-4.8
USSR-10.2
Eastern Europa-2.O
Oceenia--0.7
Othersi.9
Latin America --13.9
Western
Europe-24.5
Taiwan C
Japan - -17.6
Rep. Korea --11.6
People's Rep. China --1.0
SOURCE: U.S. Department of Agriculture, Economic Research Service, Foreign AgriculturalTrod, of the United Suites (Washington, D.C.), March-April 1985 and various other issues.

108 'Timmer
The remainder, 107 million metric tons, is a residual that must be ac-counted for by rising per capita incomes, changing tastes, urbaniza-tion, and so on.
Table 1African Grain Imports by Region in Millions of Metric Tons
1970 and Yearly Average 1980-83
Grain/Region 1970 1980-83Percent change1970 to 1980-83
CornN. Africa .10 2.03 +1930S. Africa .20 .37 +85Sub-Saharan Africa .41 1.46 +256
Total .71 3.87 +445
RiceN. Africa .05 .25 +400S. Africa .08 .16 +100Sub-Saharan Africa .65 2.43 +274
Total .78 2.84 +264
Wheat and Wheat Flour,Wheat Equivalent
N. Africa 2.79 14.54 +421S. Africa .18 .14 -22Sub-Saharan Africa 1.44 3.52 +144
Total 4.41 18.19 +312
SOURCE: Fo. and Agriculture Organization of the United Nations, Trade Yearbook (Rome,Italy), various issues.
Totals may not add up due to rounding.
The patterns of food demand generated by rising incomes have beenstudied for well over a century, and Engels Lawthe declining shareof food expenditures in total household expenditures as per capita in-comes risehas been well-documented from both time series and cross
113
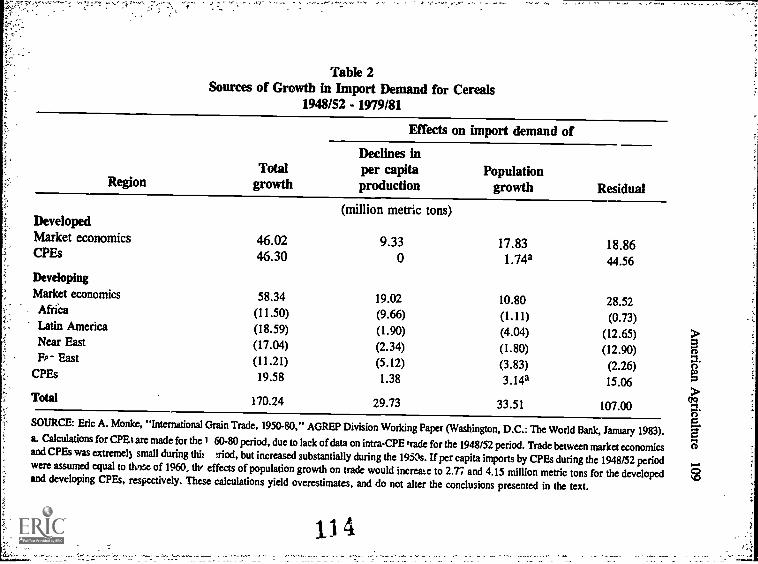
Table 2Sources of Growth in Import Demand for Cereals
1948/52 - 1979/81
RegionTotal
growth
Effects on import demand of
Declines inper capitaproduction
Populationgrowth Residual
Developed(million metric tons)
Market economics 46.02 9.33 17.83 18.86CPEs 46.30 0 1.74a 44.56DevelopingMarket economics 58.34 19.02 10.80 28.52AfriCa (11.50) (9.66) (1.11) (0.73)Latin America (18.59) (1.90) (4.04) (12.65)Near East (17.04) (2.34) (1.80) (12.90)Fe- East (11.21) (5.12) (3.83) (2.26)
CPEs 19.58 1.38 3.14° 15.06
Total 170.24 29.73 33.51 107.00
SOURCE: Eric A. Monke, "International Grain Trade, 1950-80," AGREP Division Working Paper (Washington, D.C.: The World Bank, January 1983).a. Calculations for CPEt are made for the r 60-80 period, due to lack of data on intra-CPE trade for the 1948/52 period. Trade between market economicsand CPEs was extreme!) small during this tiod, but increased substantially during the 1950s. If per capita imports by CPEs during the 1948/52 periodwere assumed equal to thane of 1960, di, effects of population growth on trade would increase to 2.77 and 4.15 million metric tons for the developedand developing CPEs, respectively. These calculations yield overestimates, and do not alter the conclusions presented in the text.
li 4

110 Timmer
section data. The changing composition of the diet with rising incomeshas also been scrutinized as agricultural ministries search for com-modifies with bright prospects for consumer demand in order to max-imize the payoff to their research and extension efforts."
Relatively less attention has been given to the indirect demand forcommodities generated by the food consumption patterns of the moreaffluent. In 1974, Lester Brown presented a striking table showing theindirect demand for grain at income levels at which grain -fed livestockproducts became affordable. Grain demand per capita in the United Statesand Canada, for example, totaled five times the amount in India orChina."' In times of grain shortages and pessimism over future sup-plies, this large indirect demand for grain was interpreted as a threatto the world's capacity to feed its poorer population. In times of surplus,indirect demand for grain is seen as an important source of exportmarkets for U.S. farmers, and so it is worth examining the relation-ship between income and grain demand more closely.
The relationship depends heavily on the distinction between quantityand quality of the diet. Both of these attributes change as incomes in-crease, but the quality dimension is much more income-elastic afterminimum caloric intake levels are reached. Tables 3 and 4 report theresults of a systematic attempt to quantify these different trends; Ap-pendix 1 shows the sources of data for the 34 countries in the sampleand the composition of the 117 cases drawn from those countries. Theincome variable is measured in purchasing power parity as determinedby Kravis and his colleagues. Prices are measured with similar ad-justments to market or official exchange rates; consequently much ofthe real income effect of different price levels between poor and richcountries has already been captured in the income variable. Anysignificance of the variable measuring food prices relative to nonfoodprices is thus capturing a pure substitution effect rather than an overallmarket effect, which includes both the real income effect of price changesas well as the substitution effect.
The first seven equations have log of caloric intake as the dependentvariable. For the total sample, per capita income has a very high ex-planatoiy power, and the income elasticity is equal to 0.20 when in-come is entered alone in Equation C1. It remains as high as 0.15 in
115.

Table 3Elasticity Coefficients from Calorie Intake Regression Analysis
Using Double Logarithmic Functions(t-statistics in parentheses)
EquationPer capita
income
Food pricesCalorie
requirementConstant
termsNumber R2 Sample Overall Low incomeCalorie intake
Cl 0.75 Total 0.20 7.24(18.77)
C2 0.76 Total 0.19 -0.10(16.04) (1.37)
C3 0.77 Total 0.18 -0.20 7.32(13.77) (2.44)
C4 0.78 Total 0.15 0.81 1.08(9.07) (3.58)
C5 0.78 Total 0.15 -0.12 0.70 1.96(8.58) (1.46) (2.96)
C6 0.04 DC 0.06 -0.05 7.84(1.30) (0.30)
C7 0.60 LDC 0.15 -0.10 7.38 A.
(8.67) (1.48) a
6

112 Timmer
Table 4Elasticity Coefficients for Various Aspects of Diet Quality
Using Double Logarithmic Regression Functions(t. statistics in parentheses)
Equation Per capita income Constant terms
MiscellandousvariablesNumber R2 Sample Overall
Lowincome Overall
Lowincome
Starchy staple ratioQ1 0.74 Total -0.39 5.07
(18.25)Q2 0.75 Total -0.35 0.03 4.92
(11.50) (1.57)Q3 0.80 Total -0.67 0.45 6.22 -1.56
(10.13) (5.57) (5.31)Q4 0.80 Total -0.67 0.45 6.22 -1.60 0.245
(10.19) (5.58) (5.46) (1.50)Q5 0.56 DC -0.64 6.09
(8.25)Q6 0.41 LDC -0.23 4.69
(6.39)
ProteinQ7 0.64 Total 0.25 3.46
(14.32)Q8 0.01 DC 0.04 4.36
(0.85)Q9 0.22 LDC 0.15 3.69
(4.11)
Animal ProteinQ10 0.81 Total 0.77 0.72
(22.39)Q11 0.41 DC 0.47 2.00
(6.19)Q12 0.52 LDC 0.65 0.97
(8.03)

American Agriculture 113
Equation C5 when variabl..Is are included for calorie requirements (whichreflect average body size, activity levels, and climate) and for priceresponse in"low-income countries.
When the price variable is added in Equation C2, the income elasticitydrops only slightly; the price elasticity is -0.1 and significant only atthe 10,percent level. Prices and incomes are negatively correk ted afterthe Kravis adjustments, and so the income variable captures some ofthe price effect. With prices alone in the equation the estimated elasticityrises in absolute value from -0.10 to -0.66.
The elasticities for developing countries are expected to be larger thanthose for developed countries. The income elasticity should be higherbecause caloric intake has physical limits"the narrow confines of thehuman stomach." The price elasticity estimated here, which is closeto a pure substitution effect, should be higher because of the "Timmereffect," which states that "the pure substitution elasticity tends to declinein absolute size as incomes rise at about half the rate of decline in in-come elasticities "20
These issues are tested in Equations C6 and C7, which report separueequations for subsamples of the developed and less-developed nations.The income and price elasticities for developed countries are much lowerthan those for the developing countries and were not statistically signifi-cant. The Timmer effect was roughly confirmed. The decline in incomeeizsticity from 0.15 for low-income countries to 0.06 for the high-incomecountries represents a decline of 60 percent. The decline in the substitu-tion elasticity should therefore be about 30 percent. The actual declineis 50 percent, but a 30 percent decline is well within the likely marginor error.
The estimates of the "calorie requirement elasticity" in EquationsC4 and C5 have little operational meaning other than the obvious: a1 percent increase in "requirements" does not automatically lead toa 1 percent increase in caloric intake. Per capita incomes and food pricesplay a critical role in determining whether requirements can actuallybe satisfied.
Three measures of dietary quality are analyzed in table 4. EquationQ1 shows the starchy staple ratio regressed against income. The elasticity
1 .1 8

114 Timmer
of -0.39 is highly significant and has substantial predictive power, asthe simple equation has an R2 of 0.74. Even the introduction of low-income slope and intercept shifters, along with a price term, raises theR2 only to 0.80. Per capita incomes are clearly the dominant factor ex-plaining this measure of dietary quality. To the extent a difference islikely to exist in income elasticities for the starchy staple ratio, theelasticity for developed countries should be larger in absolute terms.This would happen partly because the population of poor countries would
exhibit a certain inertia in behaviormany wealthy individuals in Asiado not feel they have "eaten" without rice at a meal. In addition, signifi-cant scope exists for upgrading the diets of low-income populations
within the context of starchy staples. Wheat can thus substitute forsorghum, or maize for cassava, and then rice for maize. Only whendiets begin to diversify dramatically in quantitative terms to meat, sugar,fish, milk, and other high-quality and expensive calories does thestarchy staple ratio decline rapidly.
This hypothesis is borne out in Equations Q5 and Q6. Separate equa-tions for developed and developing countries show that the incomeelasticity of the starchy staple ratio is -0.64 and -0.23, respectively.Both coefficients are highly significant. A different formulation in Equa-
tion Q3 -g dummy variables for low per capita incomes found vir-
tually identical results.The three equations for protein illustrate a characteristic of this par-
ticular sample and a behavioral relationship of some significance. Equa-tion Q7 shows a protein-income elasticity of 0.25 when the total sam-ple is combined. When the sample is split, the elasticity for developedcountries is 0.04 and the low-income elasticity is 0.15. Neither elasticityfrom the split sample is as high as from the combined sample. Normal-ly, the elasticity for the total sample should be a weighted average ofthe two subsamples. That is not true here for two reasons. First, thedeveloped country sample represents a different population from thatof the developing country sample due to different calorie requirementsas well as to a host of other "modern" traits that do not come immediate-
ly with higner incomes. Second, patterns of behavior take considerabletime to adjust to changed income levels. The elasticities for each sam-
1 1 9

American Agriculture 115
ple separately can be thougtrt of as representing short-run adjustmentsto income change, whereas the elasticity for the combined samplerepresents a long-run adjustment.
Equations Q10 to Q12 examine the relationship between animal pro-tein and incomes. The income elasticity for animal protein is 0.77 forall countries but only 0.65 and 0.47 for developing and developed coun-tries, respectively, which again shows the potential importance of short-run versus long-run dietary adaptations to income change. The implica-tions of these large income elasticities for animal protein can be seenin table 5, which is patterned after Brown and reports both direct con-sumption of grain per capita and indirect consumption through livestockfeeding, for a variety of countries from the United States to India.2'Despite direct intake of grain in the United States of almost exactly one-half the Indian level, total grain consumed is 4.5 times as large as In-dia's total grain consumption per capita-646 kilograms per years asopposed to 143 kilograms. The level was even higher before U.S.livestock feeders sharply reduced their feeding of grain in the wake ofhigh grain prices in the mid-1970s.
A significant impact will be felt on world grain markets if "follower"countries adopt American-style diets and the indirect demand for grainimplicit in them. If all the countries from Japan and below in table 5were to reach the average level of grain consumed in the United Kingdomand Germany (340 kilograms per capita per year, a figure only slightlymore than half the United States level), more than 300 million metrictons of additional grain would be needed, a figure equal to one-sixthof global production of grain. Excluding both India and China fromthe calculation leaves an added grain demand of more than 60 millionmetric tons, more than one-quarter of world grain trade in recent years.
If income growth procedes rapidly in these countries, the derived de-mand for grain through increased meat consumption will be a majorfactor determining the balance between supply and demand in worldgrain markets. Failure of incomes to grow as rapidly as in the past,however, will depress demand and could lead to significant grainsurpluses in years of good harvests. If, in addition, there has been astructural change in the interaction of developing countries with worldgrain markets, as was argued previously, the outlook for American
120

116 Timmer
grain farmers is bleak indeed. This bleak outlook stems not from "sur-prises" in the black boxes, that is, in fundamentally different mechanisms
connecting each level of a developing cour try's food system with thenext. Rather, the changed outlook comes through the relatively greaterimportance of feedback mechanisms as income growth slows down. Themore that income growth is stimulated through assistance to agriculturaldevelopment, the more powerful will the feedback effects become. Inaddition, a set of largely external factors are impinging to make the pros-pects for U.S. grain exports in the 1980s less favorable than they werein the 1970s or even the 1960s.22
Table 5Annual Per Capita Grain Consumption in Selected Countries
1975 -'1977 Average
Grainconsumeddirectly
(kgs)
Grainconsumedindirectly
. (kgs)
Total grainconsumed
(kgs)
'Total grainconsumedas multipleof India's
consumption
USA 63 583 646 4.5USSR 141 444 585 4.1Argentina 100 275 375 2.6Germany 67 288 355 2.5U.K. 71 254 325 2.3Japan 132 144 276 1.9Korea 199 54 253 1.8Brazil 91 124 215 1.5China 156 52 208 1.5Philippines 131 35 166 1.2Indonesia 142 10 152 1.1India 128 15 143 1.0
SOURCE: FAO, Food Balance Sheets, 1975-1977.
NOTE: Grain consumed indirect! is not corrected for imports and exports of meat and poultry.
1 21
...
American Agriculture 117
The first of these factors is the unusual pattern of economic growthin the 1970s. The especially successful examples of agriculturally-ledeconomic growth spilling over into rising agricultural imports have beet,in East AsiaJapan, South Korea, and Taiwan. All three countries havevery low ratios of land to population, and all have relied heavily onindustrial exports to the United States and Western Europe to fuel theirgrowth, which has been extraordinarily rapid by either historic or con-temporary comparative standards. While further gains in U.S.agricultural exports to these markets are possible, the largest increaseshave already been achieved. In addition, the United States faces sharpcompetition for these markets from other Asian countries whose ex-port sectors have bee.. stimulated by market-oriented food policies andthe new structure of world commodity markets. Thailand, China, andIndonesia have the capacity to meet much of the rising demand forfeedgrains in South Korea, Taiwan, and Japan. If Burma and Indo-Chinaever adopt market- oriented food policies that provide better farm in-centives and public infrastructure for improved agricultural productivity,Asia could be awash in surplus grain.
The opportunities to reproduce the East Asian pattern of the 1960sand 1970s are practically nil. The lucrative markets of the OECD coun-tries are increasingly closed to exports from newly industrializing coun-tries. To earn the foreign exchange needed to import capital goods andto pay existing debt, most countries will be forced to export agriculturalrather than industrial goods. The result will be added competition inworld commodity markets, either directly as with rice, corn, soybeans,or cotton, or indirectly as with palm oil, rubber, or jute. As more coun-tries seek sources of growth in agriculture, these competitive pressureswill increase, and commodity prices will rtmain depressed.
Second, the technological basis for agricultural development in the1980s and 1990s is likely to be significantly different from that in the1970s. The Green Revolution of the 1970s was primarily based on wheatand rice systems with good water control. Much of the increase in U.S.agricultural exports in the 1970s was in coarse grains and soybeans,crops for which little new technology was applicable to the tropics.Because of significant progress in breeding and cultivation techniques,
In

;118.
substantially highe yields for most of the coarse grains are now possi-l!le,-.* the, hitinid tropics, and similar progress may be in sight for
third:factor depressing the outlook for U.S. agricultural exportsis the erosion of its advantage in producing higher value-added prod-
:nets .,suak as broilers,- soymeal and oil, and textiles. When the basic com-Moditiesthat provide the= raw materials for these products cost morefor domestic producers than they do for international competitors suchas Thailand, Braid; or China, it is impossible to retain markets previous-ly established or to gain new ones. Between 1980-81 and 1983-84, theexport of Oilseed meals and poultry dropped by 34.4 percent, whereasoverall US. agricultural exports fell by "only" 10.8 percent.
In total; three general sets of factors seem destined to make the 1980sa very different decade from the 1970s for American farmers: reducedglobal rates of growth in incomes; general equilibrium feedback effectson world commodity markets; and several specific features with respectto countries, technologies, and cost structures. There is only a limitedresponse that U.S. policy can make in this new environment. Reduc-ing the value of the dollar by bringing government expenditures in closerbalance with revenues may raise the dollar price of commodities in worldmarkets and help make American farmers more competitive, but it willmake exports from developing countries less competitive and slow theirrate of growth. The net effect on commodity markets is not clearlypositive, and the dollar's decline since February 1985 has not helpedvery much by early 1987.
A more competitive pricing structure for U.S. farm products will helpregain market share and also lower input costs for value-added prod-ucts. But it will also drive down prices in world markets, at least inthe short run, leaving basic commodity producers worse off.
United States technical assistance can focus on raising agriculturalproductivity in developing countries and rely on historical relationshipsto speed their economic growth and demand for agricultural imports.But if the lagged feedback mechanisms from both the market and political
economy continue to push countries toward mailer food imports andincreased emphasis on agricultural exports, the general equilibrium con-
12340.4.

American Agriculture 119
sequences of this, strategy mean it will backfire as a vehicle for assisting
fanners..;Ope'amOniy.,ccinclude that no solution exists to the problem of low
=inCOineS:OfAMeriCtinfarmers if the policy intends for present farmers
.tto 0.000 more output at higher prices. A competition-oriented policy
that drives down: world may eventually force somehigh-cost com-
PetitOrS; especially = smaller farms in Europe, out of the market, but it
will lead to a significant shake-out of American producers as well. From
the comfort of a university it is easy to say that this is inevitable, even
good for farmers, because they will earn higher incomes in the industrial
or service sector. Jobs in those sectors, however, depend on the general
health of the United States economy, and this in turn depends on overall
American competitiveness and capacity to sell abroad. And this returns
the story to thevery simple relationship in figure 1, in which economic
growth in developing countries leads to increased import demand in
general Finding ways to help these countries speed their general develop-
ment process is the critical task for the United States if it wants a healthy
economy at home. The evidence and logic point to rapid agricultural
development as the key to this process, even if it increases competitive
pressures on American agriculture through a complicated web of feed-
back and general equilibrium processes. Policies that help farmers cope
with these pressures by easing the pain of structural change are the
only appropriate response.
NOTES
1. Earl Kellogg, "University Involvement in International Agricultural Development Activities:
Important Issues for Public Education," paper given at the 1985 annual meeting of the Associa-
tion of U.S. University Directors of International Agricultural Programs (AUSUDIAP), Athens,
Georgia, May 31, 1985; processed, p. 19.
2. Kenneth L. Bachman and Leonardo A. Paulino, Rapid Food Production Growth in Selected
Developing Cotawies: A Comparative Analysis of Underlying Trends, 1961-76, IFPRI Research
Report no. 11 (Washington, D.C.: International Food Policy Research Institute, October 1979),
p. 35.
3. Kellogg, op. cit.
4. John Lee and Matthew Shane, "United States Agricultural Interests and Growth in the Developing
Economies: The Critical Linkage," paper press' ,ecl at the National Planning Association Food
and Agriculture Committee Meeting (USDA, Eanomic Research Service), Denver, May 1985.
124,

Timmer
5.1Cellogg, op: & r p. 14.
"6 :-,The analysis is mashie in a thesis being written by Richard Kodl at the University of Illinois.
7:,Thonsii L'Morrison, "An Analysis of Recent Trends and Determinants of Cereal Importslrypeveleopiag Countries" (Washington, D.C.: Research Department, International Monetary
; 1981). pp. 20-24,
P. 8-
'9 See erei4tinimer, Walter P. Falcon, and Scott R. Pearson, Food Policy Analysis (Baltimore:johkiHatticii* Univereity Press for the World Bank, 1983).
'10.:Sealiabert pariiiberg, "U.S. Agriculture and the Developing World: Partners or Corn-itatidall B. PuiCell and Elizabeth Morrison, eds., U.S. Agriculture and Third World
Development: Critical linkage, a policy study by the Curry Foundation, Lynne RimierPubiishitia; Boilder and Landon, 1987.
11;:iiislood policy also has feedback effects on the agricultural development effort itself, inanalogous fashion to the feedback effects of development strategy on overall economic growthnoted in Model 1. These effects are incorporated in Model 4.
12. Francis Moore Lappe and Joseph Collins, Food First: Beyond the Myth of Scarcity, rev. ed.(New York: Ballantine, 1979).
13. Julian Simon, The Ultimate Resource (P.:nceloa. Princeton University Press, 1981); and MarilynChou and David P. Harmon, Jr., Critical Food Issues of the Eighties, Pergamon Policy Studies-39(New York: Pergamon Press, 1979).
14. For the former, see Bela Belassa, "Outward Orientation"; in Hollis B. Cheney and T.N.Srinivasan, eds., Handbook of Development Economics (Amsterdam: North-Holland, Forthcom-ing); for the latter, Timmer, et al., op. cit.
15. See Raymond F. Hopkins, "The Evolution of Food Aid: Towards a Development FirstRegime," Food Policy, vol. 9, no. 4 (November 1984), pp. 345-62.
16. The World Food Institute, World Food Trade and U.S. Agriculture, 1960-1984 (Ames, IA:Iowa State University, October 1985).
17. Eric A. Monke, "International Grain Trade, 1950-80," AGREP Division Working Paper(Washington, D.C.: The World Bank, January 1983).18. See John W. Mellor, The Economics of Agricultural Development (Ithaca: Cornell Universi-ty Press, 1966) for an early review of this topic, and Rajiv Chaudhri and C. Peter Timmer, "TheImpact of Changing Affluence on Diets and Demand Patterns for Agricultural Commodities,"AGREP Division Working Paper (Washington, D.C.: The World Bank, 1911) fora recent survey.
19. Lester R. Brown, with Erik P. Eckholm, By Bread Alone (New York: Praeger, 1974),p. 40.20. C. Peter Timmer, "Is There 'Curvature' in the Slutsky Matrix?" Review of Economics andStatistics, 62, 3 (August 1981), pp. 395-402.
21 Brown, op. cit., p. 40.
22. The following discussion has benefited from ongoing conversations with Wally Falcon aboutthese topics.
23. For factors responsible for raising corn yields in Indonesia and the resulting impact on thedomestic and export economies, see C. Peter Tunmer, ed., The Corn Economy of Indonesia (Ithaca:Cornell University Press, 1987).

American Agriculture 121
Appendix 1
Sources of Data
World Product and Income (1982) for real gross domestic income per capitafor 34 countries for the years 1965, 1970, 1975, and 1977 as well as for pur-chasing power parities for 1975.
FAO, Food Balance Sheets, 1972-1974 and 1975-1977 for data on nutrientavailability.
FAO, Fourth World Food Survey, 1977, for data on calorie requirements.
U.N., Yearbook of National Accounts Statistics, Volume II, 1979, for realGDP per capita growth rates.
ILO, Yearbook of Labor Statistics, 1979, for general and food price indices.
The 34 countries in the sample, with the number of observations for each,are as follows:
Austria (3)Hungary (2)Luxembourg (4)Spain (4)Germany (4)
17 countriss; 56 cases
Developed countries
Belgium (4) Denmark (4) France (4)Ireland (4) Italy (4) Japan (4)Netherlands (4) Poland (1) Romania (1)United Kingdom (4) United States (4) Yugoslavia (1)
Less-developed countries
Brazil (3) Colombia (4) India (3) Iran (4)Jamaica (3) Kenya (4) Korea (4) Malawi (3)Malaysia (4) Mexico (4) Pakistan (4) Philippines (3)Sri Lanka (4) Syria (3) Thailand (4) Uruguay (4)Zambia (3)
17 countries; 61 cases
TOTAL SAMPLE: 34 countries; 117 cases
126

Ending African HungerSix Challenges for Scientists,Policymakers and Politiciars
Carl K. EicherMichigan State University
Nineteen-sixty is usually referred to as the beginning of Africa's in-dependence movement because 16 African colonies won their in-dependence in that year. Over the 1960 to 1985 period, however, atleast 40 of the 45 countries in Sub-Saharan Africa wasted a generationin failing to develop their agriculture as an engine of growth of theirnational economies. After several decades of independence, Africa isstill the poorest part of the world's economy and seven of every tenAfricans live in rural areas. The dreams of African leaders of skippingstages of development and catching up with the rich countries in oneor two generations have all but vanished, as despair, frustration anddisappointment have become the code words in African political circles.
When African countries started to reclaim their independence in the1960s, Sub-Saharan Africa was a modest net exporter of foodmostlygroundnuts (peanuts) and palm oil to Europe. But Africa slowly lostits capacity to feed itself dunng the sixties. The situation deterioratedfurther in the seventies with the drought and famine in the Sahelian region
of West Africa. During the 15-year period from 1970 to 1984, Africa'spopulation grew at twice the rate of growth of food production. In 1985,25 years after independence, 22 African states appealed to the interna-tional conununity for emergency food aid and 300,000 people died in ,
the Great Ethiopian Famine.In Africa's first 25 years of independence, only four or five of the
forty-five countries in Sub-Saharan Africa gave priority to agricultureand to feeding their people. The remaining countries paid lip service
The mearch supporting this chapter was financed by the U.S. Agency for International Develop-ment, Bureau for Scien:e and Technology and Bureau for Africa, under a "Food Security inAfrica" cooperative agreement with the Department of Agricultural Economics, Michigan StateUniversity.
123
127
124 Eicher
to agriculture while emphasizing industrialization, state control and thetaxation of agriculture. In this essay, I shall look back 25 years andexamine why Africa wasted a generation in developing its agriculturalbase. I shall then look ahead and examine what can be done to end hungerin Africa over the next 25 years. I have taken the long view, i.e., thelong pullbecause there is little that can be done over the next fiveto ten years to slow population growth and end hunger in Africa.
Hunger can be defined as the inability of households to produce, pur-chase or acquire a calorie-adequate diet throughout the year. I shallfocus on calories rather than protein because recent research has shownthat, with the exception of pregnant women and nursing mothers, theprotein needs of most people can be met if enough calories are con-sumed from multiple sources.
Although there are currently more hungry people in Asia than in Africabecause of the sheer size of Asia's population relative to Africa, themost challenging and intractable problems of hunger and famine arein Sub-Saharan Aaica: an immense land area of 45 countries, 7 col-onial histories, and more than 1,000 different ethnic groups., Moreover,most Asian countries have made enormous progress over the past fewdecades in controlling famine before it becomes a local or nationaldisaster. For example, the last major famine in Asia occurred inBangladesh in 1974 when 1.5 million people perished. In Africa,however, famine has not been brought under control. Famine in theSahelian zone of West Africa in the early 1970s was followed by theGreat African Famine in Ethiopia and Somalia of 1985.
Since Africa is an integral part of the international food equation,I shall examine the goal to end hunger in Africa in an international con-text, including the use of donor assistance and food aid in increasingfood production and access to food. The hallmark of the world foodequation of the late 1980s is underproduction of food in many Africancountries, overproduction in industrial nations such as the United States,Canada, Europe, Japan and Australia, and emerging overproductionof food in some Third World nations such as Brazil and India. For ex-ample, India recently joined the ranks of food aid donors when itdelivered 100,000 tons of food aid to Africa in 1985. India plans to

Ending African Hunger 125
donate 35,000 tons of grain to Africa in 1987. Although India's achieve-ment of food self-sufficiency and its generosity to Africa are to be ad-mired, it should, be pointed out that roughly 200 million or one-fourthof India's population are hungry and unable to acquire a calorie-adequatediet. The hungry in India are the landless, jobless, poor, and the destitutewho are unable to produce, purchase or acquire enough calories to leada normal life. Under these circumstances, why should India ship foodaid to Africa except to gain political capital? Th lesson that emergesfrom India's experience for Africa is that the expansion of food pro-duction and the achievement of national food self-sufficiency will notautomatically end hunger.
It is important to debate African hunger in the United States becausethere is a great deal of misinformation and facile slogans being peddl-ed on the need for Africans to producemore food and fewer cash crops,the belief that hunger can be ended simply by increasing food produc-tion and the belief in some circles that hunger in Africa is caused bymultinational firms and international capitalism.
I have chosen to discuss six challenges for en4ing hunger in Africa:1. The challenge of learning why the Nst generation of African
political leaders, policymakers, and their foreign advisors under-valued agriculture and food production over the 1960-84 period,
2. The challenge of slowing rapid population growth,3. The human capital challenge,4. The challenge of focusing on the prime movers of increasing food
and agricultural production,5. The challenge of reducing poverty and increasing access to food,6. The challenge of reordering foreign aid priorities.
The Challenge of Learning from the Mistakesof the First Generation of African Leadersand Their Foreign Advisors: 1960 to 1985
Two essential questions must be addressed in an analysis of the poorperformance of agriculture in the postindependence period. First, what
129

'126 Eicher-
role did African states assign to agriculture and the industrial sectorsin national development strategies in the 1960s and 1976s? Second, what
Strategies were used by African states to increase food and agriculturalprodnetiOn?
The postindependence experience provides a clear answer to the firstquestion. Most western economic advisors to African governments inthe 1960s promoted industrialization, rural to urban migration, and thetaxation of agriculture. With the exception of a few countries such asthe Ivory Coast, Cameroon, Rwanda, Kenya and Malawi, Africanpolitical leaders undervalued agriculture and gave priority to industrialdevelopment at the same time the agriculture sector was usually heavi-ly taxed to finance industrial projects and the urban symbols of moder-nization such as a soccer stadium, a new House of Parliament and afour-lane highway from the international airport to independence square
in the capital city.In the 1960s, most African heads of state did not believe in investing
in the agricultural sector because of die view that industrialization of-fered the most rapid avenue to change the structure of African economiesfrom traditional agrarian/export-dominated economies to modern in-dustrial economies. But in practice, industrialization has proven to bemore complex than imagined. Throughout Africa, industrial plants arenow standing idle because of inefficiency, mismanagement, corruptionand lack of markets. For example, while visiting Tanzania in Octoberof 1985, I observed that the government-owned shoe factory in Morogorothat was financed by a World Bank loan was operating at 4.5 percentof capacity. I also observed that the cashew nut processing plants werestanding idle because it was cheaper to ship raw cashew nuts to Indiafor hand shelling because the unskilled wage in India was substantiallylower than in Tanzania.
Why did most African heads of state impose such heavy taxes onagriculture for financing large-scale industrial projects? There is con-sistent evidence that African heads of state in anglophone and fran-cophone states associated poverty and underdevelopment with colonialstrategies of producing agricultural exportssisal, cocoa, oil palm, rub-ber and coffeefor European markets. Whether the head of state was

Ending African Hunger 127
espousing capitalism or socialism, there was a view that continued in-vestment in export crops for overseas markets would be risky and wouldcontinue Africa's dependence on western markets. This point of viewis reflected in the late Walter Rodney's immensely popular book inAfrican universities How Europe Underdeveloped Africa (1974).
Hoaphet-Boignythe President of the Ivory Coast and Hastings Ban-da, Life President of Malawi, are shining examples of veteran politi-cians who promoted agricultural development over the past 25 years.Blessed with a rich natural resource base, adequate rainfall and an open-door policy to immigrants from neighboring countries, today the IvoryCoast is a middle-income nation with a per capita income several timeshigher than that of Ghana even though Ghana was by far the richestcountry in West Africa at independence in 1958. Malawi, a landlockedcountry with a poor natural resource base, is not only self-sufficientin maize, the staple food, but it has exported maize for seven of thepast ten years.
Over the past three to five years there has been a growing awarenessamong new African leaders such as Prime Minister K)i)c*ct Mugabe ofZimbabwe, President Diouf of Senegal, and President Mwinyi of Tan-zania, that an agriculture-led development strategy should be pursuedin economies where 70 to 90 percent of the people live in rural areasand petroleum and minerals are not available to generate adequate foreignexchange. However, because of the diversity of Africa's naturalresourcebase and opportunities for development, there is no single agriculturaldevelopment model that can be advocated for Africa. The relative em-phasis that a national development strategy gives to industry, miningand/or agriculture must be sorted out on a country-to-country basis.But we can conclude after 25 years of independence that most Africanstates are starting to give greater priority to investment in agricultureand less to industry than they did five to ten years ago.
The second questionhow to develop agriculturewas answered inmost African states in the 1960s by narrow assumptions about Africanfarmers and herders and a belief in the ease of importing agriculturaltechnology and models of production (e.g., large-scale farms andranches) from industrial countries. In Africa, in the 1960sas in Asia and
131
128 Eicher
Latin America in the 1950sfarmers and livestock owners were assumedto be irrational, inefficient and bound to a culture of tradition and poverty.It was also assumed by many African leaders and their foreign advisorsthat large-scale farms, plantations and ranches were more efficient thansmall farms. Throughout most of the 1960s and 1970s, African govern-nients,, dcincirs and foreign advisors assumed that food crop technologywas "on the shelf" or that it could be imported from temperate climatesin Europe and North America. It was further assumed that the adop-tion of improved technology could be speeded up by increasing thenumber of extension agents to "educate" farmers on the need to spendless time on feasts, festivals and sorghum beer parties and more timeon increasing food production. Many African governments followedthis advice and from 1959 to 1980, the 45 countries in Africa hiredan additional 50,000 extension agents under the mistaken assumptionthat extension agents, rather than technical packages,2 were the miss-ing link in developing African agriculture.
With few exceptions, the first generation of African leaders, whetherthey were the leaders of civilian, military, radical or conservativeregimeswere consistent in giving priority to industrial/urban develop-ment, exploiting farmers and rural people by imposing harsh taxes onexport crops and giving rural people little voice in setting nationalagriculture policies and development priorities. The first generation alsofailed to understand that agricultural development is a slow, evolutionaryand complex process that does not lend itself to rhetoric, ideology orto crash food production campaigns. Since most countries wasted ageneration in developing their agriculture, the challenge for the secondgeneration of African leaders is to learn from the mistakes of the pastin addressing the challenge of developing African agriculture and end-ing hunger. But the bottom line is that many older African leaders mustbe replaced with a new generation who realize that Africa's povertyand underdevelopment is, to a large extent, the result of misguided na-tional development strategies that gave priority to industrialization ratherthan strengthening the agricultural base as a precondition for industrialdevelopment.

Ending African Hunger 129
The Challenge of Slowing Rapid Population Growth
Africa's 3.2 percent annual rate of population growth is the highestin the world. In fact, the total population in the region is estimated toincrease from 460 million in 1985 to 730 million in year 2000, an in-crease of almost 300 million in just 15 years. The total fertility ratethe average number of children born during a woman's lifetimeis 6.9in Africa, the highest in the world.3
Looking ahead, most population experts are of the opinion that fer-tility rates will remain high for the next 10 to 20 years because of thefollowing reasons:
1. Erosion of the Custom of Abstinence. In many countries, the customof abstaining from sex after a child is born ranges from 40 daysin some Islamic groups to two years for some ethnic groups inCentral and West Africa. When abstinence exceeds a year, it isusually continued until the child is weaned from the breast. Thiscan lead to a spacing as much as four years between children. Butthe custom of abstinence is eroding, thus raising fertility.
2 . From Breast to Bottle Feeding. The biological process of breast-feeding suppresses ovulation up to two years for the most pro-longed breast feeders. But the aggressive advertising of powderedmilk and baby formula is leading to a shift from breast to bottlefeeding, thus contributing to higher fertility rates.
3 . Slow Adoption of Contraceptives. Knowledge about contraceptivesis low in Africa. Two-thirds of women in Cameroon have neverheard of them. Among the women in Kenya exposed to contracep-tives, only 12 percent use them. Fewer than 5 percent of womenexposed to contraceptives in Senegala Moslem countryuse them(13onr-arts, Odele and Lesthaeghe 1984).
African attitudes toward rapid population growth are changing,however. In 1984, 40 African nations met in Kenya and adopted theKilimanjaro Program of Action for Population that calls for family plan-ning services to be made available to all coupleseither free or at sub-sidized prices. Zimbabwe has recently become the first African nationto achieve a statistically verified reduction in fertility levels. More than35 percent of urban women now use contraceptives in Zimbabwe.

130 Eicher
Two demographic lessons emerge from the historical experience ofthe past 25 years. First, African heads of stave, donor agencies and scien-tists have underestimated the acceleration of the annual rate of popula-tion growth from 2.6 percent in th early 1960s to an Africa averageof 3.2 percent today. Second, political leaders and population expertshave underestimated the valid economic reasons why rural families wantmore children and the length of time and resources that would be re-quired to slow population growth rates. Under conditions of surplusland and the lack of a state social security service, children can makea positive economic contribution to their families by fetching firewood,cutting grass for animals, as well as providing support for their parentsin their old age.
Western science currently has no proven technology to slow Africa'srapid population growth. For Americans obsessed with technologicalfixes, it is difficult to realize that flooding Africa with contraceptivesis not the answer. The high fertility and population growth rates canonly be slowed gradually through more improvements in health,women's schooling, and the reducion of poverty and infant mortality.
In summary, rapid population growth will exert pressure on the naturalresource base throughout the continent. Africa's current 3.2 percentrate of population growth is roughly triple the rate of growth of popula-tion in presently industrial countries like Denmark and the Netherlandsat a comparable stage in their economic history from 1850 to 1900,and in Japan from 1878 to 1912. Because of Africa's rapid rate of popula-tion growth, policies for increasing food production and slowing popula-tion growth must be conceptualized as long-term efforts because fer-tility rates are simply not going to plummet over the next five to tenyears. The agonizing lesson that flows from the historical experiencesince 1960 is that slowing the population growth ratelike increasingfood productionis a slow, evolutionary, stepwise process.
The Human Capital Challenge
When African nations started to reclaim their independence in theearly 1960s, illiteracy rates exceeded 90 percent in many countries and
134-77

Ending African Hunger 131
drop-out rates were high. Moreover, the stock of university graduateswas exceedingly lowaround 100 in Zambiaat independence and theenrollment ratio of students enrolled in post-high school and univer-sities was less than 1 percent. Moreover, Sub-Saharan African coun-tries had one-fourth the number of skilled manpower per million peo-ple in 1970 that Asian countries had in 1960.
.Looking back over the past 25 years, Africa has madeenormous gainsin education at all levels, especially up to around 1980. For example,the number of students enrolled in all levelsprimary, secondary andpost-secondary (includes technical schools and universities), increasedfivefold over the 1970 to 1983 period. Despite these impressiveachievements, however, there is growing.evidence that 198C was a turn-ing point for education in Africa. Although total African expenditureon all levels of education grew from $3.8 billion in 1970 to $10.0 billionin 1980, total expenditure fell by 11 percent between 1980 and 1983.Moreover, the 8.4 percent annual rate of growth of primary schoolingbetween 1970 and 1980 fell to 2.9 percent from 1980 to 1983. If therate of primary school enrollment (2.9 percent) does not keep up withAfrica's population growth of 3.2 percent, Africa's educational basewill be eroded.
Africa's educational problems have been studied by a World Banktask force over the past two years. The core recommendation of thetask force is to reduce the share of public investment on university-level education and to increase expenditures on primary and secondaryeducation. This recommendation will be hotly criticized by leaders ofAfrican universities because they believe that shifting the relative mixof resources to primary and secondary schooling will make it difficultfor Africa tc develop its scientific capacity and reduce the number ofexpatriate teachers and researchers.
The development of higher education in Africa should be examinedin historical perspective. When African nations became independent inthe early 1960s, they were encouraged to import technology from in-dustrial countries, to send Africans overseas for agricultural training7.nd to rely on of thousands of teachers and technical advisors(technical -:,mstance) to fill manpower gaps until students returned from
1-3 5

132 Eicher
overseas training. The desire for overseas training was reinforced byAfrican leaders such as President Senghor of Senegal, a distinguishedpoet and leader of Senegal from independence in 1960 until hevolunteer xi to retire in December 1980. Although Senghor personallyencouraged Senegalese students to study business administration in theUnited States, one can legitimately pose the question: Why did Presi-dent Senghor wait until 1979-19 years after independenceto startundergraduate training in agriculture is Senegal? This is a puzzle thatmerits closer examination because Senegal is a profoundly agrarian coun-try with 70 percent of its people engaged in agriculture. The 19-yeartime gap cannot be blamed on French colonial policies. It is a reflec-tion of the ambivalent attitude that Senghor and most first generationAfrican leaders had for developing indigenous scientific capacity in foodand agriculture.
After 25 years of independence, Africa is still heavily dependent oninternational advisors in most scientific and technical fields. For ex-ample, in the early 1980s, about $4 billion or half of the annual officialforeign aid (public) to Africa was used to pay the salaries, and "careand feeding" of approximately 80,000 western experts (about 40,000school teachers, and 40,000 expatriate advisors, managers, teachers andscientists). But the provision of Western (and to a lesser extent EasternBloc) technical assistance to Africa is coming under heavy attack becauseof its high cost ($100,000 to $150,000 per person per year), its rapidturnover, and its uneven quality. Overseas training is also under heavyattack because of the growing awareness among Africans that is is astop gap measure ftz the inevitable decision that will have to be madeto strengthen Africa's capacity to train its students at home.Sending foreign advisors to Africa and training Africans in the UnitedStates are politically popular to American taxpayers. Both activities con-tribute to the 75 percent of all American foreign aid that is currentlyreturned to the United States in the form of tuition payments, salariespaid to American advisors, and income derived from the sale of U.S.productsfertilizer, wheat, rice and tractorsfor African states. Butthere is a puzzle in the human capital equation that should be criticallyexamined. Why did the U.S. government take the long view in India
126
Ending African Hunger 133
in the 1960s when it helped develop 23 new state agricultural univer-sities and fund their development for the next 15 years? Why is theUnited' States takilig the short-run view in Africa in the 1980s?
Unfortunately little leadership is coming from Africa on educationalreion:fi African universities are notorior sly overstaffed, inefficient andexpensive. Fr. example, in 1980-81, Nigerian universities employed52,000 staff (teat.fiers, cooks, guards, servants) for a student popula-tion of 69,000. By contrast, 8,300 employees care for 67,000 studentsin thel6 public colleges and universities in the state of West Virginiain 1987 (New York Tunes 1987). Since virtually the total cost of a univer-sity education in Africa is paid for by the government, it is privatelyprofitable for African families to send their children to universities. Butthe returns to society for university-level education are low under thepresent cost structure and priorities where students are trained in fieldssuch as law, history, geography and political science instead of fieldsdominated by western advisors such as computer science, business ad-ministration, engineering and plant science.
Africa has inherited an elitist model of higher education from theBritish, French, German and Portuguese. Because of the bleak finan-cial position of many African countries, higher education is now understress and the quality of education is falling in many universities. Afew countries are starting to introduce long overdue structural innova-tions, including the development of new university models that are rele-vant to the agrarian dominated continent. For example, Tanzania recentlystarted a new agricultural universitySokoine University ofAgriculturethat is modeled after the Punjab state agricultural univer-sity in India, a university established in the 1960s with the assistanceof U.S. foreign aid and technical support from Ohio State University.Ethiopia recently launched the Alemaya University of Agriculture atAlemaya.
The 25 major foreign aid donors in Africa, including the flagshipdonorthe World Bankdo not have a strategic plan on how to breakthe "iron grip" of fellowships for overseas training and providingtechnical experts to Africa. The time is ripe for a fundamental re-examination of human capital strategies in Africa. Most donors haveretreated from investment in human capital. For example, Uma Lele
1 3 7
,Z I
: 51
4

of the World Bank reports that World Bank lending to education in Africadeclined from 10.6 percent of African allocation in the 1960s, to 7.5
ent during the 1970s, and 4.1 percent over the 1980-84 period (Lele1987,..p. 326). In fact, in fiscal year 1984, the World Bank allocatedonly two educational loans to Africa totaling $25 million. The majorwestern donors are standing on the sidelines supplying fellowships foroverseas training and short-term technical assistance while studiouslyavoiding making the long-term commitment of funds and teachers forlong-term human capital institution building projects that were routinelyoffered to Columbia, Brazil and Argentina in the 1950s and 1960s andto India and other Asian nations in the 1960s and 1970s.
In a continent with large amounts of idle land and energetic people,what strikes one most about Africa's underdevelopment is the dispropor-tionate stock of skilled people between Africa and the rich countriesand between Africa and Latin America and Asia. The challenge nowis to assess the experience of the first 25 years of independence andto lay the groundwork for helping African nations develop new modelsof education that are more cost-effective, relevant and sustainable.
The Challenge of Focusing Policy Attention on the Prime Moversof Increasing Food and Agricultural Production
Because of favorable rainfall throughout most of Africa in 1985-87,the short-term food outlook for Africa is good. In fact, 12 African coun-tries had grain surpluses in 1987. However, because of rapid popula-tion growth, Africa faces a major agricultural production challenge.Food supplies will have to be doubled every 17 to 25 years to keepup with rapid population growth. The agricultural sector of African na-tions will also have to generate jobs, new income streams for coral peopleand foreign exchange to enable national economies to import capitalgoods such as tractors, construction material, and mining equipment.However, African heads of state are being inundated with fragmentedadvice from Western donors and their advisors on how to increase andsustain annual food production gre wth rates of 3 to 5 percent over thenext generation.

Ending African Hunger 135
Over the past 25 years of working on African development problems,I have noted that planning for increasing food and agricultural produc-tion in Africa is heavily biased by the faddish and narrow views of theseveral:dozen major donors, private-voluntary agencies and legions ofWestern academic specialists who typically play up the role of a singlefactor of agricultural change such as new technology or pricing policy.Many of these academic specialists are zealously promoting the cur-rent fad of donors or their discipline. For example, many plant breedersare preoccupied with a technological fix to Africa's foodprobleriis and in placing more emphasis on regenerative agriculture.Anthropologists are rightly concerned with the cultural barriers to ex-panded livestock offtake rates. Agricultural economists typically focuson one issue such as: credit, land reform or raising farm prices, whilegeneral economists are concerned with overvalued exchange rates andmeasures to speed market liberalization.
In a world of increasing specialization and a concern for quick fixes,there is an urgent need to move beyond single factors of agriculturaldevelopment and focus on what I call the five prime movers ofagricultural development as a policy package over the long pu11.4 Thesefive prime movers of increasing food and agricultural production are:
1. New technology produced by public and private investments inagricultural research.
2. Human capital and managerial skills produced by investments inschools, training centers, and on-the-job experience.
3. Biological capital investments (e.g., improving livestock herds)and physical capital investment in infrastructure such as dams, ir-rigation, and roads.
4. Improvement in the performance of institutions such as market-ing, credit and national agricultural research and extension services.
5. Favorable economic policy environment.A significant characteristic of the first four prime movers is their long
gestation period (10 to 25 years). For example, experience has shownthat it takes ten years of research, on the average, to produce a newplant variety, and another five to eight years to gain widespread fanneradoption. It takes 10 to 15 years of research on the average to develop

136 Eicher
new technology for increasing livestock production. It takes 10 to 15years of graduate study and on-the-job training for an agriculturalresearch scientist to be productive. Unfortunately this time span is notbeing reflected in African development plans or in Western foreign aidprograms that too often move from one short-term fad to another.
The second characteristic of the prime movers of agricultural develop-ment is their complementary nature and the need to develop an integratedinvestment plan for research, extension, training, etc. The payoff toinvestment to produce new food, cash crop and livestock and technologywill be low unless there is an effective extension service to diffuse thenew technology. Likewise, the payoff to investing in agricultural ex-tension services in Africa has generally been low because many nationalagricultu1 research services have had little to offer to extension agents.For example, the decision of African states to hire 50,000 additionalextension agents over the 1959 to 1980 period was a mistake in myjudgment because there was little proven food crop technology availablefor the extension agents to extend with a few exceptions, such as cornin eastern and southern Africa. For example, although the French startedresearch on milleta crop that does well in low rainfall (300 to 450mm)in Senegal in 1931, there is still no breakthrough in millet researchin Africa after five decades of research.
Let us now examine what can be done to step up food and ag,..:ulturalproduction in Africa by concentrating on the five prime movers.
Technology Generation. There is growing support for the proposi-tion that expanded rural income from multiple sources is a strategicvariable in addressing the hunger and poverty in Africa. In short, com-bating hunger is a more complex process than merely increasing foodproduction. Hunger can be combated by expanding the production andsale of food crops, export crops, livestock, food and income earnedfrom rural off farm employment. Agricultural research that generatesnew production technology for food crops, export crops, and livestock,can be important sources of income generation for farmers and a meansfor families to produce food or the income to purchase an improved diet.There is lack of agreement in the scientific community on the extentof the backlog of improved food crop varieties that are "on the shelf"waiting for extension agents to diffuse them to farmers. For example,

Ending African Hunger 137
Dunstan Spencer, an authority on African agriculture from Sierra Leonefieently reported that probably less than 2 percent of total sorghum,millet and upland rice area in West Africa is sown with cultivars(varieties) through modern genetic research (Spencer 1986, p. 224).On the other hand, the Food and Agriculture Organization (FAO), ofthe United Nations, recently asserted that in Africa "except in arid andsemi-arid areas without irrigation, food production can be roughly -,:oubl-ed with existing technology. Thus, the immediate need is to provideadequate supplies of fertilizer, improved seeds, tools. . . ."(FAO 1986,p. 61).
I am of the opinion that the FAO and many other agencies haveoverstated the amount of underutilized technology that is on the shelfwaiting for farmers to adopt. The stock of on-shelf improved, farmer-tested food crop technology is limited today in Africa. The few notableexceptions include corn in eastern and southern Africa, hybrid sorghumin the Sudan, potatoes in Rwanda, cassava in West Africa, and wheatfor the cool highlands of Ethiopia, Kenya, northern Tanzania and inZimbabwe where it can be grown in the cool winter months (May-September) under irrigation. There is a growing realization that manyof the national research services in Africa do not have the scientificcapacity to borrow, screen, test and adapt agricultural technology fromneighboring countries, regional institutes, the International AgriculturalResearch Centers (IARCs) and the global research system.
The strategic importance of an efficient national agricultural researchcapacity to develop new crop and liv.stock technology is illustrated byZimbabwe's overflowing grain silos. Currently, Zimbabwe has cornin storage equivalent to two years of normal domestic consumption.Corn contributes about 50 percent of the calories in the average dietin Zimbabwe and it is the smile food in diets in most eastern and southern
Africa. Zimbabwe's corn revolution is of special interest to Africancounties because the production of corn by small farmers (smallholders)tripled from independence in 1980 to 1986. The highlights of Zim-babwe's corn revolution are as follows:
Zimbabwe's corn revolution has its origins in research on hybridvarieties that was launched in Zimbabwe (formerly Southern
1. 4 1
138 Eicher
Rhodesia) in the 1930s. Zimbabwe became the first cc;t:ntry afterthe U.S. to introduce hybrid corn in 1950 after carrying out localresearch from 1932 to 1950. Subsequent research in the 1950sled to the development of a high yielding hybrid variety (SR-52)that was released in 1960 to commercial (large scale) farmers. The28 years of lcal research (1932 to 1960) to develop the famousSR-52 hybrid corn variety (the Green Revolution crop of SouthernArica) makes a mockery of the three to five year agriculturalresearch projects that am being currently peddled by foreign donors(Eicher 1984).Research from 1960 to 1975 developed shorter season varietiesfor small farmers in low rainfall areas. At independence in 1980,Zimbabwe had a backlog of cr.' rn varieties ready for delivery tosmall farmers. Today, 100 percent of the commercial farmers androughly 85 percent of the small farmers use hybrid corn varieties,the highest of any African country (Rohrbach 1987).Public investments in roads, credit, extension and supporting ser-vices facilitated the expansion of hybrid maize production bysmallholders from 1980 to 1986.Corn prices to farmers were raised from 1980 to 1986 but theinflation-adjusted prices have fallen since 1984. Hence, maize pric-ing policy by itself does not shed much light on Zimbabwe's maizerevolution.
The message that emerges from Zimbabwe's corn revolution is thatno single prime mover such as favorable corn prices was responsiblefor tripling of production by smallholders over the past six years. Zim-babwe con, 'ntrated on the five prime movers as a policy package overa period of decades and developed the preconditions for the "takeoff"in maize production starting at independence 'n 1980. This is the cen-tral finding that emerges from Zimbabwe's corn revolutiona messagethat is important for other African states, the U.S. Congress and foreignaid donors.
Human Capital and Managerial Skills. I have already commentedon the great uncertainty on how to strengthen human capital in Africa.A major challenge facing educators and professional agriculturalists in
1 4 2

Ending African Hunger 139
African and donor agencies is figuring out how foreign assistance canmost effectiyely assist in strengthening Africa'_s indigenous scientific,technical and managerial capacity in food and agriculture. Starting withgreat. onfidence in the 1960s, the major donors and the U.S. founda-tions have retreated from investment in numan capital in the 1970s and1980s. For example, the World Bank only extended two educationalloans to Africa in 1984.
Rural Capital Formation. Agricultural development in industrial coun-tries has been fueled by the mobilization of family labor for clearingland, picking stones and building fences, an accretionary type of capitalformation whereby family labor improves land productivity and the pro-ductivity of livestock herds over generations. Security of tenure playsa strategic role in converting family labor into capital formation because,with security, farmers can be assured that farm improvements can bepassed on to the next generation. Unfortunately, in Africa there is atendency for donors and private voluntary agencies to dole subsidized
credit instead of pressuring African governments to raise interest ratesin post office savings banks, rural credit banks, etc., in orthr that farmerswill have some incentive to saN e and fmance their own farm im-provements. There is a need for African planning to develop policiesand institutions for African farm families to finance their own farm in-vestments as the primary source of rural capital formation.
Rural Institutions. The fourth prime mover is strengthening the per-formance of rural institutions ranging from farmer irrigation associa-tions to fertilizer, credit and seed companies. But there is a paucity ofproven strategies on how to strengthen rural institutions such asnational agricultural research, credit and extension services. GunnarMyrdal, the Nobel Laureate in Economics from Sweden, recentlyobserved that unfortunately most "ordinary" economists assume awayinstitutions in their studies of Third World development (Myrdal 1984).
Favorable Economic Policy Environment. The fifth prime moverfavorable economic policy environmentis crucially ir.....portant infacilitating the implementation of the first four prime movers. Cur; ntlyin Africa, the major donorsled by the IMF and the World Bankarepressing African states for policy reforms in exchange for additional
143

loans and grants. But there are few solid guidelines on the difficult artOf falikfiring institutions such as phasing out or abolishing govern-ment grain boards, abolishing fertilizer subsidies and increasing the roleof private traders in delivering farm inputs and in marketing f arm pro-ducts. In Zambia, President Kaunda's regime came close to being toppledin November of 1986 when 15 people were killed in food riots follow-ing the government's decision to double the retail price of cornmealthe staple food of the countryon the advice of the IMF and severalinfluential western donors.
In summary, there is a need for African governments and donors tofocus on the five prime movers of agricultural developmentas a policypackage to strengthen the productive capacity of African agricultureover the long pull. Food aid can be used to buy time until investmentin these prime movers pays off. But donors need to come to grips withlong gestation investments by making an explicit, up-front commitmentto financing human capital and institution building projects for 10 to20 years in Africa, just as they did in Asia in the 1960s and 1970s.
The Challenge of Reducing Povertyand Increasing Access to Food
A comparati 'e study of the causes of hunger in the United States,India and Zimbabwe would reveal that hunger is not simply caused bythe insufficiency of national food production, but poverty, unemploy-ment, landlessness, sickness and other factors. We have questioned In-dia's motives in sending food aid to Africa when about one-fourth (200million) of its population is hungry. Since each of these three countrieshas achieved national food self-sufficiency, one has to look beyond lag-ging food production as the cause of hunger and food insecurity. Sincepoverty is a major cause of hunger in both rich and poor countries, raisingper capita incomes is a powerful instrument for helping reduce hungerin the long run. But the long run may take 20 to 30 years or longerto raise per capita incomes sufficiently to enable people to purchasean adequate diet. Therefore, the central policy question is: Do govern-
Ending African Hunger 141
ments have an obligation to intervene in the short run to reduce hungerin rich and poor countries, including both food deficit and food surpluscountries?
In the United States it took several decades of political debate beforea consensus was reached on the need for the federal government tofinance food stamps to enable the poor, sick, and the unemployed toacquire a calorie-adequate diet. Over the past 15 years under bothRepublican and Democratic administrations, the United States has in-vested $9 to 20 billion per year in food transfer programs. But foodstamps and other public food transfer programs require careful economicanalysis in the Third World. This is especially the case in Africa wherethe annual per capita income of one-fourth the countries is below $4005and the national economies are strapped to maintainlet aloneincreasepublic expenditures on health, education and other basic ser-vices. For example, in Senegal the per capita income is lower todaythan it was at independence in 1960. In Zambia the average per capitaincome is now almost one -third lower than it was when President Kaunda
took over from the British at independence (Economist 1987).In 1987, one-fourth of the African countries (12) had food surpluses
and three-fourths (33) had food deficits. The challenge in food deficitcountries is to help increase food production especially among subsistence
farmers. Increasing food production under conditions of rapid popula-tion growth requires attention to the prime movers of agriculturaldevelopment over the long pull.
In 1987, 12 African countries had achieved national food self-sufficiency and had grain for sale to neighboring countries. But in mostof these countries, malnutrition is still a major problem because the poorlack the means (e.g., jobs, income, and credit) to produce and/or pur-chase a calorie-adequate diet. There is growing awareness in Africanpolicy circles and among donors that expanded food production andthe achievement of national food self-sufficiency will not automatical-ly end hunger and that poverty must be addressed in a policy packageto increase food intake among the malnourished.
Fortunately the rhetoric of national food self-sufficiency in manyAfrican countries is diminishing and more countries are starting to focus
145
.......,,..-----.-
Ending African Hunger 143
subsidies. But there is a basic inconsistency in IMF and World Bankappeals to African countries to reduce the level of subsidies in lightof the heavy role that subsidies play in contributing to food surplusesin rich countries such as the United States, Japan and in Western Europe.
Since there are many recent book length treatments of foreign aid(Cassen and Associates 1986) the best t)ne can do here in the limitedspace is to point up the complexity of aid and the difficulty of generalizingabout the efficiency of aid across 45 countries in Africa. The most im-portant lesson that donors should learn from the postindependence foreignaid experience is that Africa is an agrarian continent today as it wasat indep endence in 1960. Donors should put their assistance behind thefive pri ne movers of agricultural development over the long pull.
Summing Up
Cutting across the 45 cov-ries in Sub-Saharan Africa is the extraor-dinary diversity of African people, their cultures, natural resource en-dowments, stage of development and opportunities for development.The more experience one gains in Africa, the more one avoids the facilePan African generalizations such as Africa is a land surplus continent.From the past 25 years of Africa's struggle to develop nation-states,to forge national identities and to improve the welfare of African peo-ple, the following generalization flow about food and agriculture.
There is a need to grasp the immensity and diversity of the Africancontinent and to seek insights into development problems and solutionson a subregional basis such as southern Africa, East Africa, Sahel, Cen-tral Africa, etc. For example, because of a backlog of proven varietiesof its staple foodcornthe food outlook in southern Africa isreasonably optimistic over the coming five to ten years. On the otherhand, in semi-arid regions such as the Sahel, the food outlook ispessimistic because of the lack of a proven technical package for thetwo staple foods consumed by rural peoplesorghum and milletandthe lack of proven technology for the two urban crops, rice and wheat.
Rapid population growth will not slow down in the medium term ofsix to ten years. Flooding Africa with contraceptives will not bring about
147
144 Eicher
a quick reduction in fertility rates. Rapid population growth of 3 to 4percent per year requires food supplies to grow at 3 to 5 percent peryearan extraordinary difficult task judging from historical experience.Despite favorable weather in most of Africa in 1985 and 1986,Africa faces an enormous food production challenge until populationgrowth rates slow down over the next 10 to 20 years.
There is a need for stepping up investment in scientific training inAfrica, in reducing the number of fellowships for overseas training,and for strengthening Africa's research and teaching institutions overa time span of the next three to four decades.
Expanding food production in and of itself cannot end hunger in Africa.since hunger exists in food surplus nations such as India and the UnitedStates, it follows that vigorous income and employment generation pro-grams are critical in helping people increase their access to food. Present-ly there is little debate on food access in Africa because of the legacyof the drought, the preoccupation of Ministries of Agriculture in in-creasing production and the prevailing view that a food production short-fall rather than poverty is the main cause of hunger. A vigorous educa-tional program should be launched to move policy debate beyond foodself-sufficiency to include both sides of the food security equationfood availability through domestic production, storage and trade andaccess to food through home production, employment, purchase in themarket and food transfers such as food aid.
NOTES
1. Africa will be used in the balance of this chapter to mean Sub-Saharan Africa.
2. A technical package contains two or more components (e.g., new seed, fertilizer) that afarmer/herder can adopt to increase crop or livestock production.
3. The total fertility rate in many industrial countries is 1.8 to 2.2.
4. See Eicher (1985) for an expanded discussion of the five prime movers.
5. The World Bank defines a poor country as one with an average per capita income of less than$400.
148