Embed Size (px)
Citation preview
Issued by:
Mary Ann Kornexl, CPA, MiCPT Finance Director/City Treasurer
Comprehensive Annual Financial Report Introductory Section Table of Contents Letter of Transmittal 1-5 GFOA Certificate of Achievement For Excellence in Financial Reporting 6 List of Principal Officials 7 Table of Organization 8 Financial Section Independent Auditors’ Report 9-10 Management Discussion and Analysis 11-26 Basic Financial Statements Government-wide Financial Statements Statement of Net Position 28-29 Statement of Activities 30-31 Fund Financial Statements Governmental Funds Balance Sheet 32-35 Reconciliation of Balance Sheet - Governmental Funds to the Government-wide Statement of Net Position 37 Statement of Revenue, Expenditures, and Changes in Fund Balance 38-41 Reconciliation of Statement of Revenue, Expenditures, and Changes in Fund Balance - Governmental Funds to the Government-wide Statement of Activities 42-43 Proprietary Funds Statement of Net Position 44-47 Statement of Revenue, Expenses, and Changes in Net Position 48-51 Statement of Cash Flows 52-55 Fiduciary Funds Statement of Fiduciary Net Position 56 Statement of Changes in Fiduciary Net Position 57
Comprehensive Annual Financial Report Financial Section (Continued) Table of Contents Basic Financial Statements (Continued) Component Units Statement of Net Position 58-59 Statement of Activities 60-61 Notes to Financial Statements 63-112 Required Supplementary Information Budgetary Comparison Schedule – General Fund Excluding Component Funds 114-115 Reconciliation Statement of Revenue, Expenditures, and Changes in Fund Balance – General Fund to General Fund Budgetary Schedule 116-119 Budgetary Comparison Schedule – Major Street Fund 120-121 Budgetary Comparison Schedule – Local Street Fund 122-123 Schedule of Funding Progress and Schedule of Investment Returns – Fire and Police Pension Plan 124 Schedule of Changes in Net Pension Liability and Related Ratios – Fire and Police Pension Plan Schedule of Employer Contributions – Fire and Police Pension Plan
125
126
Schedule of Changes in Net Pension Liability and Related Ratios – MERS – Defined Benefit Plan 127 Schedule of Contributions – MERS – Defined Benefit Plan 128 Schedule of Funding Progress and Schedule of Employer Contributions – Other Post Employment Benefits 129 Notes to Required Schedules 130
Comprehensive Annual Financial Report Financial Section (Continued) Table of Contents Other Financial and Supplemental Information Budgetary Comparison Schedule – Parks & Recreation Fund, a Component Fund of the General Fund 132-133 Budgetary Comparison Schedule – Special Assessment Fund, a Component Fund of the General Fund 134-135 Budgetary Comparison Schedule – Community Development Block Grant Fund, a Component Fund of the General Fund 136-137 Combining Balance Sheet – Nonmajor Governmental Funds 138-139 Combining Statement of Revenue, Expenditures and Changes in Fund Balance – Nonmajor Governmental Funds 140-143 Budgetary Comparison Schedule – Downtown Parking & Improvement Fund 144-145 Budgetary Comparison Schedule – Cemetery Perpetual Care Fund 146-147 Budgetary Comparison Schedule – Building Authority Fund 148-149 Combining Statement of Net position – Nonmajor Enterprise Funds 150-153 Combining Statement of Revenue, Expenses, and Changes in Net position – Nonmajor Enterprise Funds 154-155 Combining Statement of Cash Flows – Nonmajor Enterprise Funds 156-159 Combining Statement of Net Position – Internal Service Funds 160-163 Combining Statement of Revenue, Expenses and Changes in Net Position – Internal Service Funds 164-165 Combining Statement of Cash Flows – Internal Service Funds 166-169 Combining Statement of Net Position – Trust Funds
170
Comprehensive Annual Financial Report Financial Section (Continued) Table of Contents Other Financial and Supplemental Information (Continued) Combining Statement of Changes in Net Position – Trust Funds
171
Combining Statement of Changes in Assets and Liabilities – Agency Funds 172-173 Statistical Section Financial Trends Net Position by Component 176-177 Changes in Net Position 178-181 Fund Balances of Governmental Funds 182-183 Changes in Fund Balances of Governmental Funds 184-185 Revenue Capacity Taxable Value 186 Assessments and Taxes Property Tax Millage Rates - All Direct and Overlapping Governments 187 Ten Largest Taxpayers - 2015 Taxable Value 188 Property Tax Valuations, Tax Rates, Tax Levies, and Collections 189 Debt Capacity Ratio of Annual Debt Service Expenditures for General Obligation Bonded Debt to Total General Fund Expenditures 190 Ratio of Net General Obligation Bonded Debt to Taxable Value and Net Bonded Debt Per Capita 191 Ratio of Outstanding Debt by Type 192 Computation of Direct and Overlapping Debt 193 Computation of Legal Debt Margin For General Obligation Bonds 194 Revenue Bond Coverage 195 Demographic and Economic Information Demographic Statistics 196 Principal Employers
197
Comprehensive Annual Financial Report Statistical Section (Continued) Table of Contents Operating Information Full-time Equivalent Employees by Function
198
Operating Indicators by Function 199 Capital Asset Statistics by Function 200 Internal Control and Compliance Section Independent Auditors’ Report on Internal Control over Financial Reporting and on Compliance and Other Matters Based on an Audit of Financial Statements Performed in Accordance with Government Auditing Standards 201-202
Management’s discussion and analysis (MD&A) is presented immediately following the independent auditor’s report and provides a narrative introduction, overview, and analysis of the basic financial statements. MD&A complement this letter of transmittal and should be read in conjunction with it. Profile of the Government The City of Mt. Pleasant, incorporated in 1889, is located in the central part of the State of Michigan at the intersection of US127 and M20. The City currently occupies 7.8 square miles and serves a population of 26,016. The City is governed by a charter that was last amended in 2015. A City’s charter is like a local constitution, which spells out the basic form of government and lists the authority and responsibilities of all the players. The City of Mt. Pleasant is empowered to levy a property tax on both real and personal property located within the City. Mt. Pleasant has a “commission/manager” form of government. Policy-making and legislative authority are vested in the commission consisting of the mayor, vice-mayor and five other members. The commission is responsible, among other things, for passing ordinances, adopting the budget, appointing committees, and hiring the City’s manager, clerk, assessor, treasurer and attorney. The commission is elected at large on a non-partisan basis. Commission members serve three-year overlapping terms. The manager is responsible for carrying out the policies and ordinances of the commission, for overseeing the day-to-day operations of the city, and for appointing the heads of the various departments. The commission adopts an annual budget. The annual budget serves as a foundation for the City of Mt. Pleasant’s financial planning and control. For a narrative on the budget process see Note 2 in the Notes to Financial Statements section of this report. Reporting Entity and Services - As required by generally accepted accounting principles, these financial statements present the City of Mt. Pleasant and related component units. The individual component units are included in the City’s reporting entity because of their operational or financial relationships with the City. The City provides a full range of municipal services. These services include parks; police and fire protection; water, sewer, and sanitation services; the construction and maintenance of highways, streets, and infrastructure; and recreational activities and cultural events. In addition to general government activities, because of the significance of their operational and financial relationship, Tax Increment Finance Authority (TIFA), Economic Development Corporation (EDC), Mission Street Downtown Development Authority (DDA), Local Development Finance Authority (LDFA) and Brownfield Redevelopment Authority (BRDA) are included in the City’s reporting entity. Factors Affecting Economic Condition Local Economy - The geographical location of the City of Mt. Pleasant allows easy access to major highways, which provides several advantages to the community and being the home to Central Michigan University leads to stability for the local economy. The tourism industry continues to prosper in and around Mt. Pleasant. It has become a leading tourist destination in the state for both its’ park system and also the attractions in the surrounding areas such a regional shopping opportunities, premier golf and the Soaring Eagle Casino.
2
Factors Affecting Economic Condition (Continued) Central Michigan University is the fourth largest University in the State of Michigan. During 2016 CMU completed the $95 million state of the art BioSciences Building, the largest capital project ever in CMU’s 120 plus year history. In 2013 CMU opened the nation’s 137th medical school. One hundred percent of the inaugural classes of 62 students were able to secure residency this spring. Half of the residencies are in Michigan. CMU is the City’s largest utility customer and keeping enrollment stable is vital to the City’s utility funds. State of Michigan Budget - The State’s 2015-16 budget changed the nature of the revenue stream of a portion of the State Shared Revenue (sales tax) distribution to local units of government for City, Village and Township Revenue Sharing (CVTRS). The portion of the sales tax that was distributed to local units of government as part of the statutory process and driven by a formula was drastically changed in 2011. In order to receive CVTRS, the City must demonstrate compliance with the State’s requirements for accountability and transparency. These requirements consist of five categories of reporting. The City has met all five categories. In addition to the changes in the formula for distribution the State has allocated less funds to the State Shared Revenue program since 2002. According to SaveMICity.org the City’s revenue sharing has decreased $11,549,822 from 2002-2015. During 2016 an information campaign was initiated by Michigan Municipal League to increase awareness of the impact of these losses on municipalities in Michigan. This presentation will occur in Mt. Pleasant in early May. In addition, in December 2012 the Legislature approved laws to eliminate portions of the personal property tax in 2014 and identified mechanisms for partial revenue replacement. In 2014 the Legislature passed bills to replace local property tax revenue lost with the elimination of personal property taxes. In 2016 the phase in of exemption of eligible manufacturing personal property began. The Legislature has created a State-wide essential services tax on this property that will be paid to local units of government to replace the tax lost that would have been used for police, fire and ambulance service. The City received reimbursement for a portion of the lost revenue but is expecting an adjustment in the next allocation in November for an error in the original calculation. During 2015 the Legislature approved supplemental funding for the State’s failing roads. According to projections provided by the State, it is anticipated the City will receive an additional $2.7 million over the 5 years beginning in State fiscal year 2017. The additional State funding is expected to be $390,000 in 2017 increasing to $1.1 million in 2021. These funds will be used to repair major and local streets in the city. Capital Improvement Planning - The City Charter requires the preparation of a five-year Capital Improvement Plan. This plan is approved by the City Commission in the month of June preceding the upcoming five years so that adequate time exists for the Planning Commission and the public to have input into the plan prior to the operational budgeting process being started. Such strategic thinking allows infrastructure needs to be properly integrated and adequately financed.
3
Factors Affecting Economic Condition (Continued) In 1996 the City took a proactive approach in levying a separate capital improvement millage. The revenues generated from this millage are used for ongoing repairs and maintenance to roads, parks, sidewalks, and non-enterprise fund capital infrastructure. The City Commission approved increasing the millage to 2.0 mills in 2014 and it generates approximately $800,000 annually. In addition to this dedicated millage, other funds support annual capital projects including the Water and Sewer Enterprise Funds, tax capture districts, Act 51 street funds, and grants and donations throughout the entire organization. In March of 2014 the City received notice of award of a $2 million Michigan Department of Environmental Quality Stormwater Asset Management and Wastewater (SAW) grant. The grant provides for full evaluations of the condition of the City’s wastewater and storm water systems, including such assets as sewer lines, manholes, and lift stations that are underground and out of site. All of the grant work was completed in 2016 and an implementation plan for the results is being developed. The five-year capital improvement plan estimates funding availability compared to needs over the next five years and ensures that projects are coordinated and planned to maximize the use of the resources and minimize any disruptive impact within areas of the City. In recent years the focus of the use of funds has been more on maintaining existing infrastructure and less on expanding or creating new infrastructure. Economic Initiatives - In 2016 a new Marriot Hotel was completed on the campus of Central Michigan University. An economic incentive was given to the hotel to construct an access road from Mission Street to the new hotel. Taxable value from the hotel and personal property increased $10.7 million in 2017. In addition it is expected that the hotel will be a significant user of the water and sewer systems. Previous City Commission action calls for an allocation of the increased tax revenue to the Economic Initiatives Fund to replenish the amount that was contributed for the construction of the access road. The City will continue to invest in our own economic turnaround by aggressively supporting the re-development of the Mission Street corridor and encouraging start-up businesses that are willing to add to the quality, livability and vitality of our community. The City is positioned to provide financing assistance for demolition and site clearance, Mission/Pickard corridor site amenities and cross street connections; and Rental Rehab in the Central Business District. In 2016 funds were allocated to provide no interest facade improvement loans in the Central Business District. To balance the operating budget, the City continues to invest in growth and regularly evaluates the expenditure side of the budget. In 2014 the City Commission approved a .5 mill increase in the millage rate to invest in keeping the public infrastructure well maintained. This continued in 2016. Mt. Pleasant Center Land - In April, 2011 the City took ownership of the 300 acres from the State of Michigan which was previously used as a center for the developmentally disabled. The City purchase was based on a primary focus on the re-development to be used for increased tax base and/or jobs within the City as the market is ready. The City hired a project management team comprised of Spicer Engineering, AKT Peerless and CBRE to oversee the planning and redevelopment of this land and thus far has been awarded almost $2.1 million in grants and loans to assist with the demolition and environmental abatement of the existing infrastructure on the site.
4
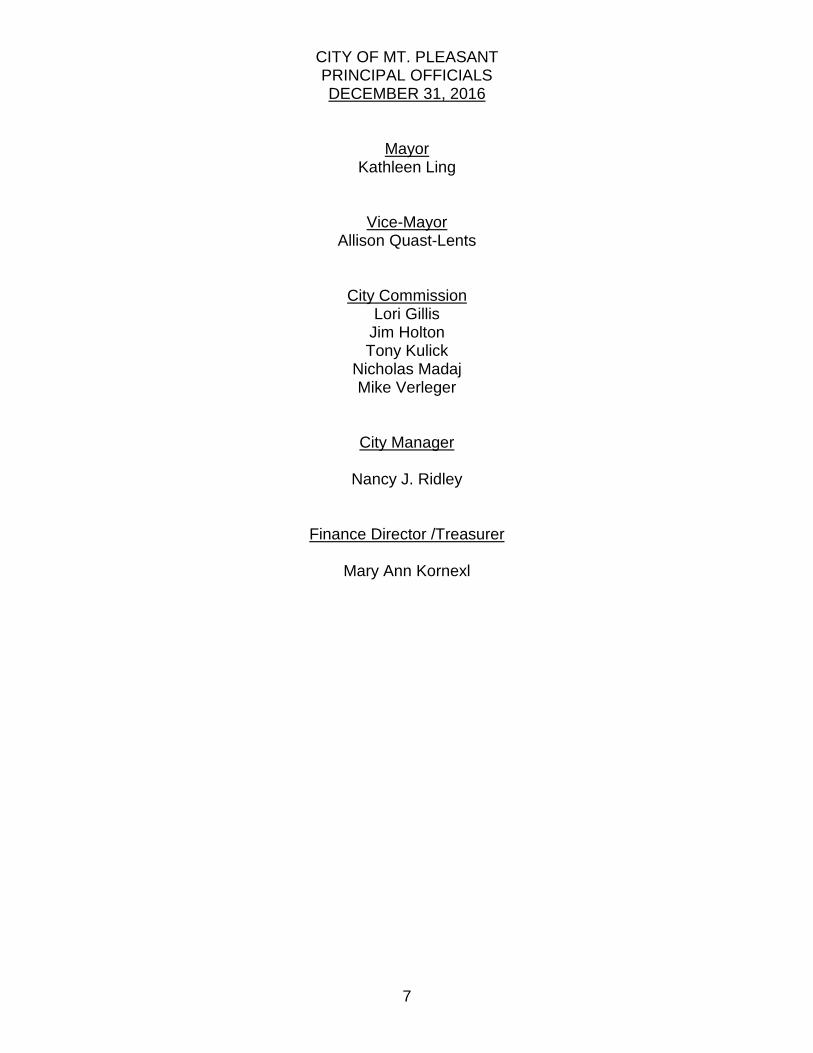
CITY OF MT. PLEASANT PRINCIPAL OFFICIALS DECEMBER 31, 2016
Mayor Kathleen Ling
Vice-Mayor Allison Quast-Lents
City Commission Lori Gillis
Jim Holton Tony Kulick
Nicholas Madaj Mike Verleger
City Manager
Nancy J. Ridley
Finance Director /Treasurer
Mary Ann Kornexl
7
Vredeveld Haefner LLC CPA’s and Consultants
4001 Granada Ct.
Grand Rapids, MI 49534
FAX (616) 828-0307
Specializing in services to governmental and nonprofit entities
INDEPENDENT AUDITORS’ REPORT
May 16, 2017
Honorable Mayor and Members of the City Commission City of Mt. Pleasant Mt. Pleasant, Michigan
Report on the Financial Statements
We have audited the accompanying financial statements of the governmental activities, the business-type activities, the aggregate discretely presented component units, each major fund, and the aggregate remaining fund information of the City of Mt. Pleasant (the City), as of and for the year ended December 31, 2016, and the related notes to the financial statements, which collectively comprise the City’s basic financial statements as listed in the table of contents.
Management’s Responsibility for the Financial Statements Management is responsible for the preparation and fair presentation of these financial statements in accordance with accounting principles generally accepted in the United States of America; this includes the design, implementation, and maintenance of internal control relevant to the preparation and fair presentation of financial statements that are free from material misstatement, whether due to fraud or error. Auditor’s Responsibility Our responsibility is to express opinions on these financial statements based on our audit. We conducted our audit in accordance with auditing standards generally accepted in the United States of America. Those standards require that we plan and perform the audit to obtain reasonable assurance about whether the financial statements are free from material misstatement.
An audit involves performing procedures to obtain audit evidence about the amounts and disclosures in the financial statements. The procedures selected depend on the auditor’s judgment, including the assessment of the risks of material misstatement of the financial statements, whether due to fraud or error. In making those risk assessments, the auditor considers internal control relevant to the entity’s preparation and fair presentation of the financial statements in order to design audit procedures that are appropriate in the circumstances, but not for the purpose of expressing an opinion on the effectiveness of the entity’s internal control. Accordingly, we express no such opinion. An audit also includes evaluating the appropriateness of accounting policies used and the reasonableness of significant accounting estimates made by management, as well as evaluating the overall presentation of the financial statements.
We believe that the audit evidence we have obtained is sufficient and appropriate to provide a basis for our audit opinions.
Opinions In our opinion, the financial statements referred to above present fairly, in all material respects, the respective financial position of the governmental activities, the business-type activities, the aggregate discretely presented component units, each major fund, and the aggregate remaining fund information of the City of Mt. Pleasant, Michigan, as of December 31, 2016, and the respective changes in financial position and, where applicable, cash flows thereof for the year then ended in accordance with accounting principles generally accepted in the United States of America.
9
Other Matters
Required Supplementary Information Accounting principles generally accepted in the United States of America require that the management’s discussion and analysis on pages 11–26 and the information on pages 110–126 be presented to supplement the basic financial statements. Such information, although not a part of the basic financial statements, is required by the Governmental Accounting Standards Board who considers it to be an essential part of financial reporting for placing the basic financial statements in an appropriate operational, economic, or historical context. We have applied certain limited procedures to the required supplementary information in accordance with auditing standards generally accepted in the United States of America, which consisted of inquiries of management about the methods of preparing the information and comparing the information for consistency with management’s responses to our inquiries, the basic financial statements, and other knowledge we obtained during our audit of the basic financial statements. We do not express an opinion or provide any assurance on the information because the limited procedures do not provide us with sufficient evidence to express an opinion or provide any assurance. Other Information Our audit was conducted for the purpose of forming opinions on the financial statements that collectively comprise the City’s basic financial statements. The introductory section, combining and individual fund financial statements and schedules, and statistical section are presented for purposes of additional analysis and are not a required part of the basic financial statements.
The combining and individual fund financial statements and schedules are the responsibility of management and were derived from and relate directly to the underlying accounting and other records used to prepare the basic financial statements. Such information has been subjected to the auditing procedures applied in the audit of the basic financial statements and certain additional procedures, including comparing and reconciling such information directly to the underlying accounting and other records used to prepare the basic financial statements or to the basic financial statements themselves, and other additional procedures in accordance with auditing standards generally accepted in the United States of America. In our opinion, the combining and individual fund financial statements and schedules are fairly stated, in all material respects, in relation to the basic financial statements as a whole.
The introductory section and statistical tables have not been subjected to the auditing procedures applied in the audit of the basic financial statements and, accordingly, we do not express an opinion or provide any assurance on them.
Other Reporting Required by Government Auditing Standards
In accordance with Government Auditing Standards, we have also issued our report dated May 16, 2017, on our consideration of the City's internal control over financial reporting and on our tests of its compliance with certain provisions of laws, regulations, contracts, and grant agreements and other matters. The purpose of that report is to describe the scope of our testing of internal control over financial reporting and compliance and the results of that testing, and not to provide an opinion on internal control over financial reporting or on compliance. That report is an integral part of an audit performed in accordance with Government Auditing Standards in considering the City’s internal control over financial reporting and compliance.
10
Management’s Discussion and Analysis
This section of the City of Mt. Pleasant’s financial report presents our discussion and analysis of the City’s financial performance during the fiscal year ended December 31, 2016. We encourage readers to consider the information presented here in conjunction with additional information that we have furnished in our letter of transmittal, which can be found on pages 1- 5 of this report. Financial Highlights The assets of the City of Mt. Pleasant exceeded its liabilities at December 31, 2016 by
$43.7 million. Of this amount $4.9 million is unrestricted and available for ongoing operations for citizens and obligations to creditors. Starting in 2015, this is significantly less than previous years due to recording the Net Pension Obligation of $15.2 million.
The City’s total net position decreased by $.2 million. As of December 31, 2016, the City of Mt. Pleasant’s governmental funds reported
combined ending fund balances of $9.1 million, a decrease of $2.0 million in comparison with prior year. The decrease was primarily due to the transfer from the General Fund to the Land Development Fund for financing the MP Center project.
As of December 31, 2016, unassigned fund balance for the General Fund was
$2,525,213 or 19% of the 2017 operating budget. Assigned fund balance for the General Fund was $1,738,705 or 13.1% of the 2017 operating budget.
Overview of the Financial Statements This discussion and analysis is intended to serve as an introduction to the City of Mt. Pleasant’s basic financial statements. The City of Mt. Pleasant’s basic financial statements comprise three components: 1) government-wide financial statements, 2) fund financial statements, and 3) notes to the financial statements. This report also contains other supplementary information in addition to the basic financial statements themselves.
11
Management’s Discussion and Analysis
Overview of the Financial Statements (Continued) Government-wide Financial Statements - The government-wide financial statements are designed to provide readers with a broad overview of the City of Mt. Pleasant’s finances, in a manner similar to a private-sector business. The statement of net position presents information on all of the City of Mt. Pleasant’s assets and liabilities, with the difference between the two reported as net position. Over time, increases or decreases in net position may serve as a useful indicator of whether the financial position of the City of Mt. Pleasant is improving or deteriorating. The statement of activities presents information showing how the government’s net position changed during the most recent fiscal year. All changes in net position are reported as soon as the underlying event giving rise to the change occurs, regardless of the timing of related cash flows. Thus, revenue and expenses are reported in this statement for some items that will only result in cash flows in future fiscal periods (e.g., uncollected taxes and earned but unused vacation leave). Both of the government-wide financial statements distinguish functions of the City of Mt. Pleasant that are principally supported by taxes and intergovernmental revenues (governmental activities) from other functions that are intended to recover all or a significant portion of their costs through user fees and charges (business-type activities). The governmental activities of the City of Mt. Pleasant include general government, public safety, public works, highways, streets and bridges and community development. The business-type activities of the City of Mt. Pleasant include Water, Sewer, Solid Waste, Land Development and Airport operations. The government-wide financial statements include not only the City of Mt. Pleasant itself (known as the primary government), but also legally separate entities for which the City of Mt. Pleasant is financially accountable. Financial information for these component units is reported separately from the financial information presented for the primary government itself. They are the Tax Increment Financing Authorities (TIFA), Downtown Development Authority (DDA), Local Development Finance Authority (LDFA), Economic Development Corporation (EDC) and Brownfield Redevelopment Authority (BRDA). The Building Authority, although also legally separate, functions for all practical purposes as a department of the City of Mt. Pleasant, and therefore has been included as an integral part of the primary government. The government-wide financial statements can be found on pages 28-31of this report.
12
Management’s Discussion and Analysis
Overview of the Financial Statements (Continued) Fund Financial Statements - A fund is a grouping of related accounts that are used to maintain control over resources that have been segregated for specific activities or objectives. The City of Mt. Pleasant, like other state and local governments, uses fund accounting to ensure and demonstrate compliance with finance-related legal requirements. All of the funds of the City of Mt. Pleasant can be divided into three categories: governmental funds, proprietary funds, and fiduciary funds. Governmental Funds - Governmental funds are used to account for essentially the same functions reported as governmental activities in the government-wide financial statements. However, unlike the government-wide financial statements, governmental fund financial statements focus on near-term inflows and outflows of spendable resources, as well as on balances of spendable resources available at the end of the fiscal year. Such information may be useful in evaluating a government’s near-term financial requirements. Because the focus of governmental funds is narrower than that of the government-wide financial statements, it is useful to compare the information presented for governmental funds with similar information presented for governmental activities in the government-wide financial statements. By doing so, readers may better understand the long-term impact of the government’s near-term financing decisions. Both the governmental fund balance sheet and the governmental fund statement of revenue, expenditures, and changes in fund balances provide a reconciliation to facilitate this comparison between governmental funds and governmental activities. The City of Mt. Pleasant maintains eleven individual governmental funds for budgetary purposes. Three of these funds don’t meet the GASB #54 criteria for separate financial reporting as a fund and are combined with the General Fund for financial reporting. Information is presented separately in the governmental fund balance sheet and in the governmental fund statement of revenue, expenditures, and changes in fund balances for the General fund, Major and Local Street funds. The General fund is considered to be a major fund and the Major and Local Street funds have significant reporting value to the City and have been displayed as major funds. Data from the other five governmental funds are combined into a single, aggregated presentation. Individual fund data for each of these nonmajor governmental funds is provided in the form of combining statements elsewhere in this report. The City of Mt. Pleasant adopts annual appropriated budgets for its general fund and special revenue funds. Budgetary comparison schedules have been provided for these funds to demonstrate compliance with these budgets. The basic governmental fund financial statements can be found on pages 28-112 of this report.
13
Management’s Discussion and Analysis
Overview of the Financial Statements (Continued) Proprietary Funds - The City of Mt. Pleasant maintains two different types of proprietary funds. Enterprise funds are used to report the same functions presented as business-type activities in the government-wide financial statements. The City of Mt. Pleasant uses enterprise funds to account for its Water, Sewer, Solid Waste, Land Development and Airport operations. Internal service funds are an accounting device used to accumulate and allocate costs internally among the City of Mt. Pleasant’s various functions. The City of Mt. Pleasant uses internal service funds to account for its self-insurance, central stores and for its motor pool operations. The central stores was closed out in 2016. All of these services predominantly benefit governmental rather than business-type functions; they have been included within governmental activities in the government-wide financial statements. Proprietary funds provide the same type of information as the government-wide financial statements, only in more detail. The proprietary fund financial statements provide separate information for the Sewer, Water and Land Development funds, all of which are considered to be major funds of the City of Mt. Pleasant. Data from the other two proprietary funds are combined into a single, aggregated presentation. Individual fund data for each of these nonmajor proprietary funds is provided in the form of combining statements elsewhere in this report. The internal service funds are combined into a single, aggregated presentation in the proprietary fund financial statements. Individual fund data for the internal service funds is provided in the form of combining statements elsewhere in this report. The proprietary fund financial statements can be found on pages 44-55. Fiduciary Funds - Fiduciary funds are used to account for resources held for the benefit of parties outside the government. Fiduciary funds are not reflected in the government-wide financial statement because the resources of those funds are not available to support the City of Mt. Pleasant’s own programs. The accounting used for fiduciary funds is much like that used for proprietary funds. The basic fiduciary fund financial statements can be found on pages 56-57 of this report. Notes to the Financial Statements - The notes provide additional information that is essential to a full understanding of the data provided in the government-wide and fund financial statements. The notes to the financial statements can be found on pages 63-112 of this report. Other Information - In addition to the basic financial statements and accompanying notes, this report also presents certain required supplementary information concerning the City of Mt. Pleasant’s progress in funding its obligation to provide post retirement benefits to its employees and budget to actual presentation for the general fund and major special revenue funds. Required supplementary information can be found on pages 114-130 of this report.
14
Management’s Discussion and Analysis
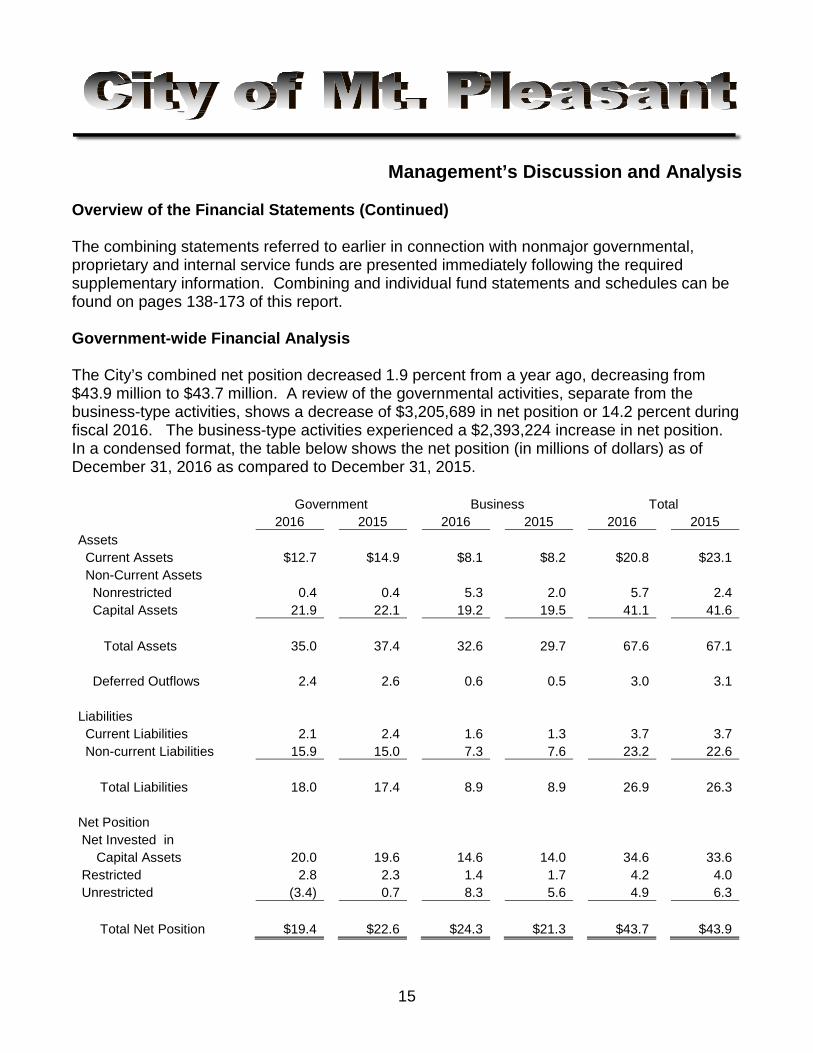
Overview of the Financial Statements (Continued) The combining statements referred to earlier in connection with nonmajor governmental, proprietary and internal service funds are presented immediately following the required supplementary information. Combining and individual fund statements and schedules can be found on pages 138-173 of this report. Government-wide Financial Analysis The City’s combined net position decreased 1.9 percent from a year ago, decreasing from $43.9 million to $43.7 million. A review of the governmental activities, separate from the business-type activities, shows a decrease of $3,205,689 in net position or 14.2 percent during fiscal 2016. The business-type activities experienced a $2,393,224 increase in net position. In a condensed format, the table below shows the net position (in millions of dollars) as of December 31, 2016 as compared to December 31, 2015.
Government
Business
Total
2016
2015
2016
2015
2016
2015
Assets Current Assets $12.7
$14.9
$8.1
$8.2
$20.8
$23.1
Non-Current Assets
Nonrestricted 0.4
0.4
5.3
2.0
5.7
2.4
Capital Assets 21.9
22.1
19.2
19.5
41.1
41.6 Total Assets 35.0 37.4 32.6 29.7 67.6 67.1 Deferred Outflows 2.4
2.6
0.6
0.5
3.0
3.1
Liabilities
Current Liabilities 2.1
2.4
1.6
1.3
3.7
3.7
Non-current Liabilities 15.9
15.0
7.3
7.6
23.2
22.6
Total Liabilities 18.0
17.4
8.9
8.9
26.9
26.3
Net Position
Net Invested in
Capital Assets 20.0
19.6
14.6
14.0
34.6
33.6 Restricted 2.8
2.3
1.4
1.7
4.2
4.0
Unrestricted (3.4)
0.7
8.3
5.6
4.9
6.3
Total Net Position $19.4
$22.6
$24.3
$21.3
$43.7
$43.9
15
Management’s Discussion and Analysis
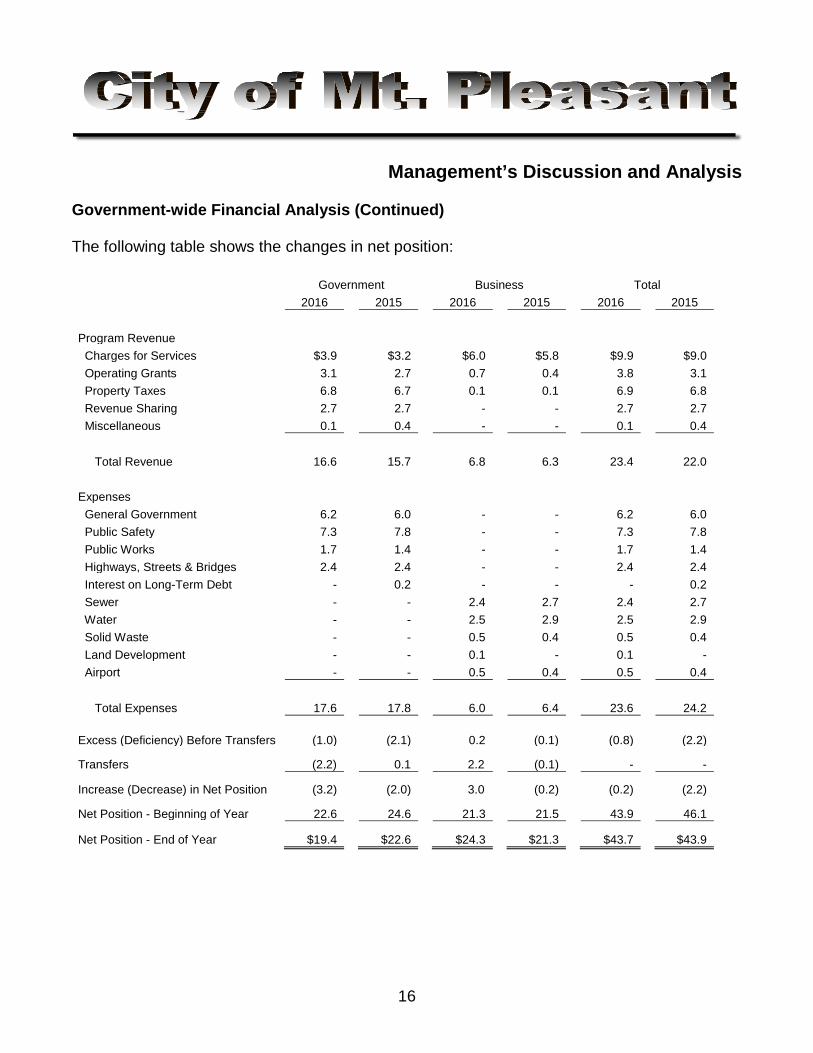
Government-wide Financial Analysis (Continued) The following table shows the changes in net position:
Government
Business
Total
2016
2015
2016
2015
2016
2015
Program Revenue Charges for Services $3.9
$3.2
$6.0
$5.8
$9.9
$9.0
Operating Grants 3.1
2.7
0.7
0.4
3.8
3.1 Property Taxes 6.8
6.7
0.1
0.1
6.9
6.8
Revenue Sharing 2.7
2.7
-
-
2.7
2.7 Miscellaneous 0.1
0.4
-
-
0.1
0.4
Total Revenue 16.6
15.7
6.8
6.3
23.4
22.0
Expenses General Government 6.2
6.0
-
-
6.2
6.0
Public Safety 7.3
7.8
-
-
7.3
7.8 Public Works 1.7
1.4
-
-
1.7
1.4
Highways, Streets & Bridges 2.4
2.4
-
-
2.4
2.4 Interest on Long-Term Debt -
0.2
-
-
-
0.2
Sewer -
-
2.4
2.7
2.4
2.7 Water -
-
2.5
2.9
2.5
2.9
Solid Waste -
-
0.5
0.4
0.5
0.4 Land Development -
-
0.1
-
0.1
-
Airport -
-
0.5
0.4
0.5
0.4
Total Expenses 17.6
17.8
6.0
6.4
23.6
24.2
Excess (Deficiency) Before Transfers (1.0)
(2.1)
0.2
(0.1)
(0.8)
(2.2)
Transfers (2.2)
0.1
2.2
(0.1)
-
-
Increase (Decrease) in Net Position (3.2)
(2.0)
3.0
(0.2)
(0.2)
(2.2)
Net Position - Beginning of Year 22.6
24.6
21.3
21.5
43.9
46.1
Net Position - End of Year $19.4
$22.6
$24.3
$21.3
$43.7
$43.9
16
Management’s Discussion and Analysis
Government-wide Financial Analysis (Continued) Governmental Activities - The City’s total governmental revenue increased by approximately $.9 million. Expenses decreased by about $.2 million. During the year, the City continued meeting the actuarial required contributions for both of the defined benefit pension systems and the retiree health care benefits trust. Business-type Activities - The City’s business-type activities consist of the Water, Sewer, Solid Waste, Airport and Land Development. The City provides water, sewer and solid waste disposal to all residents of the City. The number of customers remained steady. The usage for water and sewer remained steady. The water and sewer rates for demand increased based on meter size, for most customers $.92 and $.80 per month, respectively. The bag/tag rates for solid waste decreased $.25 for bags and increased $.05 for tags. The Airport saw a decrease in fuel sales revenue due to the decrease in the volume of fuel sold. The Land Development Fund includes the Project 2000 and Center property acreage. All the remaining lots in Project 2000 are sold on land contract. Land formerly known as the Mt. Pleasant Center was purchased during 2011. Demolition of some of the buildings on the Center property began in 2013 and was completed in 2014. $350,000 in grant funding was awarded, state loan and internal financing for the remaining costs allowed all the remaining buildings and infrastructure to be demolished in 2016. Now that the land is free of the hazardous buildings, future plans for the development of the site can be considered. Business-type activities increase in net position of $3.0 million includes depreciation expense of $1.6 million. Most of the increase was due to the grant/internal financing for the $3.4 of increase in land value in the Land Development fund from the demolition activities. Financial Analysis of the Government’s Funds The City’s major fund’s presentations begin on page 32, following the government-wide financial statements. The fund financial statements provide detailed information about the most significant funds, not the City as a whole. The City Commission creates funds to help manage money for specific purposes as well as to show accountability for certain activities, such as State of Michigan Act 51 major and local street revenue sharing and the debt retirement.
17
Management’s Discussion and Analysis
Financial Analysis of the Government’s Funds (Continued) General Fund - The General Fund receives all City revenue not designated for specific use by statutes or the City Charter and accounts for most of the services provided to residents. A comparison to the budget is on pages 114-115. Information relative to the General Fund’s revenue, expenditures and fund balance is shown below:
2016
Increase
2016
Percent
(Decrease)
Amount
of Total
2015
REVENUE Taxes $5,739,623
42.0%
$52,103
Licenses and Permits 436,665
3.2%
(1,305) Intergovernmental 2,927,514
21.3%
81,461
Charges for Services and Sales 2,503,058
18.2%
397,514 Fines 265,646
1.9%
93,986
Interest 18,767
0.1%
(8,549) Miscellaneous 1,075,965
7.8%
484,256
Subtotal 12,967,238
94.5%
1,099,466
Transfers from Other Funds 751,382
5.5%
(105,351)
Total $13,718,620
100.0%
$994,115 The increase in Charges for Services is due to the contribution from Mission Street DDA for construction of Central Drive for which the contract with developer was with the City. The increase in Miscellaneous is due to an increase in 2% Tribal allocation received for various projects and Parks donation for the Timbertown 2.0 project.
18
Management’s Discussion and Analysis
Financial Analysis of the Government’s Funds (Continued)
2016
Increase
2016
Percent
(Decrease)
EXPENDITURES Amount
of Total
2015 Current Operations
General Government $5,891,457
36.3%
$ 705,590 Public Safety 6,674,308
41.2%
460,450
Public Works 905,994
5.6%
157,323 Community Development 2,554
0.0%
(15,316)
Subtotal 13,474,313
83.1%
1,308,047
Transfers to Other Funds 2,737,914
16.9%
2,299,025
Total $16,212,227
100.0%
$ 3,607,072 The increase in General Government is due to the construction of Central Drive and Timbertown 2.0. The increase in Public Safety is due to the transfer of Code Enforcement from General Government to Public Safety in 2016 and small increases in each program in Public Safety. The increase in Public Works is due to the Pedestrian Lighting project in 2016. The increase in transfers is due to internal financing of the Mt. Pleasant Center demolition.
2016
Increase
2016
Percent
(Decrease)
FUND BALANCE Amount
of Total
2015 Nonspendable
Prepaid Expenditures $ 129,970
2.37%
$ (47,420) Long-term Advance 265,360
4.84%
(7,020)
Restricted for Donations 542,173
9.88%
329,071 Committed for Special Assessments 286,202
5.22%
(82,887)
Assigned for Fire Truck Replacement 101,937
1.86%
(549,570)
Fund Balance Policy - 0.00% (1,700,000) Economic Development 312,772
5.70%
(356,903)
Subsequent Year's Expenditures 442,551
8.06%
(346,154) Borden Building Capital -
0.00%
(127,810)
Appropriated Next Year's Budget 26,730
0.49%
(532,170) Parks & Recreation 509,483
9.28%
(144,203)
CDBG Eligible Expenditures 345,232
6.29%
(119,327) Unassigned 2,525,213
46.02%
1,190,786
Total $ 5,487,623
100.0%
$(2,493,607)
19
Management’s Discussion and Analysis
Financial Analysis of the Government’s Funds (Continued) Special Revenue Funds - Special Revenue Funds are used to account for the proceeds of specific revenue sources or to finance specified activities as required by law or administrative regulation. A comparison to the budget for nonmajor special revenue funds begins on page 144. The Special Revenue Funds of the City include: Major and Local Street Funds - These are used to account for the receipt and expenditure of state shared gas and weight taxes under Act 51, P.A. 1951, as amended. Gas and weight taxes are distributed to cities and villages in Michigan on the basis of population and the number of miles of streets. Revenue in the Local Street fund increased due to Tribal 2% allocation received in 2016. Downtown Parking & Improvement Fund - This fund is used to record the revenue from parking fines for parking violations that is used to fund some maintenance and promotions in the central business district. In late 1977, the City Commission approved the removal of parking meters from streets and lots in the central business district. In 2003 a special assessment paid by property owners in the benefited area was established. This special assessment and a transfer from the General Fund, fund the activities of the fund. The General Fund contribution funds events held downtown. Revenue and expenditures increased due to additional special assessments and appropriation from the General Fund. Cemetery Perpetual Care Fund - This fund is used to account for a portion of the burial fees charged that is held in trust to provide for perpetual care of the cemetery. Revenue decreased in 2016 due to the initial sale of additional spaces for sale created in the cemetery in 2015. Building Authority - This component unit is used to account for the Mt. Pleasant Building Authority established to sell bonds and construct improvements and an addition to the Department of Public Safety Building. Construction was essentially complete in 2002. During 2016 the general fund paid rent to the Building Authority equal to the amount of debt service required on the bonds. The bonds were paid off in 2016 and the Building Authority transferred ownership of the building to the City. Borden Building Debt Service Fund - This fund is used to account for the accumulation of resources and the repayment of the $3,685,000 bond issue dated December 13, 2007. The bond proceeds were used to construct the Borden Building Project. Revenue is received in an amount sufficient to pay debt service from a property tax levy and captures of property tax from the Brownfield District. During 2016 the bonds were refunded to achieve an economic gain of $75,473 in future interest savings.
20
Management’s Discussion and Analysis
Financial Analysis of the Government’s Funds (Continued) Capital Projects Fund - The Capital Projects Fund is used to account for the receipts and disbursements of monies used for the acquisition of capital facilities other than those financed by proprietary funds. The City has a Capital Project fund that is used to account for the 2.0 mill property tax levy. During 2016 the Capital Projects fund transferred to the General Fund $434,840, Local Street $100,000 and Parks & Recreation Fund $5,000. Enterprise Funds - Enterprise Funds are used to account for operations that are financed and operated in a manner similar to private business enterprises – where the intent of the City is that providing goods or services to the general public on a continuing basis be financed or recovered primarily through user charges; or where the intent of the City is that periodic determination of net income is appropriate for accountability purposes. The City has the following Enterprise Funds. The Sewer Fund is used to account for the costs of collecting and treating wastewaters. The Water Fund is used to account for the costs of providing water services to City residents. The Solid Waste Management Fund is used to account for the costs of collecting and disposing of solid waste. The Airport Fund is used to account for operating and maintenance costs of the municipal airport. Revenue is received from rentals of hanger space, fuel sales and a contribution from the General Fund. The Land Development Fund is used to account for the sale and development of residential and light industrial property on property purchased by the City and the Center property which is now ready for resale.
21
Management’s Discussion and Analysis
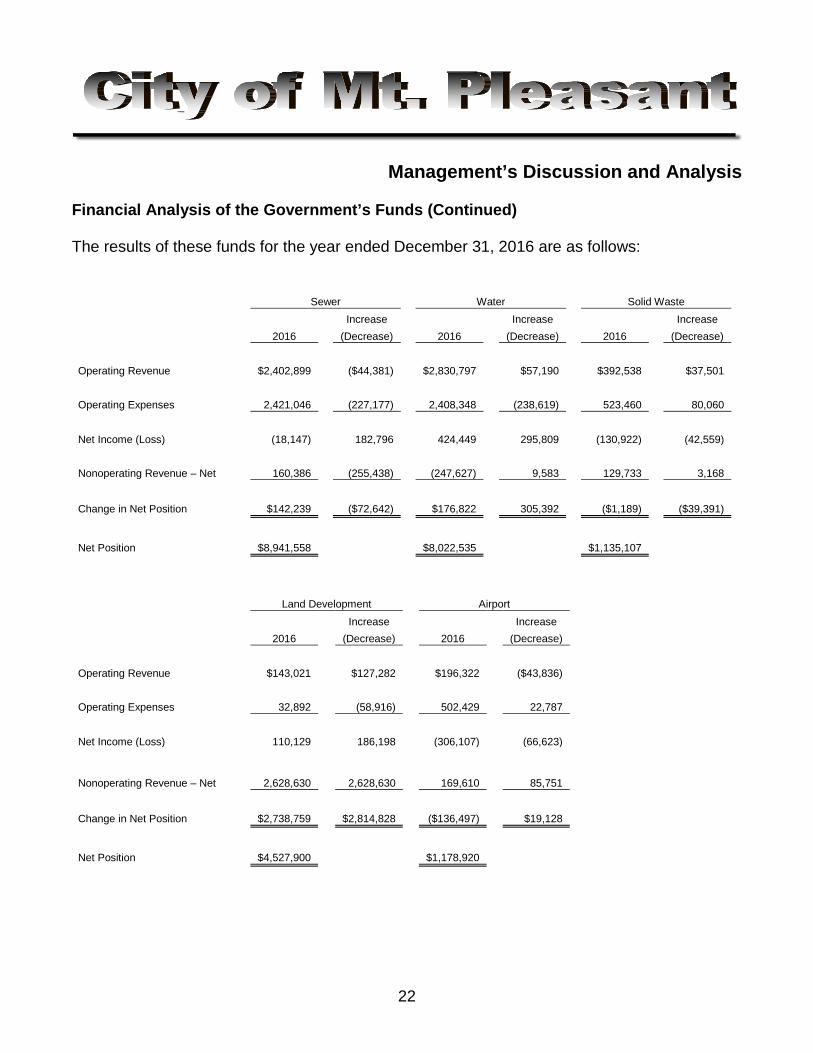
Financial Analysis of the Government’s Funds (Continued) The results of these funds for the year ended December 31, 2016 are as follows:
Sewer
Water
Solid Waste
Increase
Increase
Increase
2016
(Decrease)
2016
(Decrease)
2016
(Decrease)
Operating Revenue $2,402,899
($44,381)
$2,830,797
$57,190
$392,538
$37,501
Operating Expenses 2,421,046
(227,177)
2,408,348
(238,619)
523,460
80,060
Net Income (Loss) (18,147)
182,796
424,449
295,809
(130,922)
(42,559)
Nonoperating Revenue – Net 160,386
(255,438)
(247,627)
9,583
129,733
3,168
Change in Net Position $142,239
($72,642)
$176,822
305,392
($1,189)
($39,391)
Net Position $8,941,558
$8,022,535
$1,135,107
Land Development
Airport
Increase
Increase
2016
(Decrease)
2016
(Decrease)
Operating Revenue $143,021
$127,282
$196,322
($43,836)
Operating Expenses 32,892
(58,916)
502,429
22,787
Net Income (Loss) 110,129
186,198
(306,107)
(66,623)
Nonoperating Revenue – Net
2,628,630
2,628,630
169,610
85,751
Change in Net Position $2,738,759
$2,814,828
($136,497)
$19,128
Net Position $4,527,900
$1,178,920
22
Management’s Discussion and Analysis
Financial Analysis of the Government’s Funds (Continued) Internal Service Funds - Internal Service Funds are used to account for the financing of special activities or services performed by a designated unit within the City for other units of the City. These funds are supported entirely by the sale of goods or services to other funds. The City operates the following Internal Service Funds. The Central Stores Purchasing Fund is used to account for the purchase and subsequent resale of operating, and repair and maintenance supplies to the various City departments. The fund was closed out in 2016 and future purchases will be made directly by each fund. The Motor Vehicle and Equipment Fund is used to account for the purchase, maintenance, and operation of all motor vehicles except those of the Police and Fire Departments. The equipment is rented to the other operating funds at hourly rental rates to cover costs of the fund. The Self-Insurance Fund is used to account for the claims paid for employee health benefits and general liability claims deductibles and expenses. The individual funds and departments are charged monthly premiums to cover these costs. See Note 9 for more details. Fiduciary Funds - Fiduciary Funds are established to account for assets held by the governmental unit in a trustee capacity or as an agent for individuals, private organizations, and other governmental units and/or funds. The Fiduciary Funds of the City include: Pension Trust – Fire and Police Retirement System - A five member Board of Trustees manages this system under the provisions of P.A. 345 to provide pension benefits to police and fire retirees. See Note 11 for more details. Police Retiree Health Medical Benefits Fund - This fund was established in 2003 to account for medical benefits provided to police retirees that were hired before January 1, 2010 and retired in 2002 or later. Agency Funds - The City has two Agency Funds. These include funds for tax collections and payroll. General Fund Budgetary Highlights Over the course of the year, the City administration and City Commission monitor and amend the budget to take into account unanticipated events that occur during the year. There was a significant change made when the 2016 budget was amended to accommodate the internal financing of the demolition of buildings at the Center property. These internal financing are expected to be replenished with the funds available from the payoff of Building Authority debt. A comparison of the budgeted data begins on page 114. The original budget anticipated decreasing the fund balance by $700,950, the final budget projected decreasing the fund balance by $2,435,910 and fund balance actually decreased $2,147,200 due to cost savings by divisions and some projects being delayed until 2017. Expenditures were $105,257 less than budgeted due to overall savings by divisions and projects delayed until 2017.
23
Management’s Discussion and Analysis
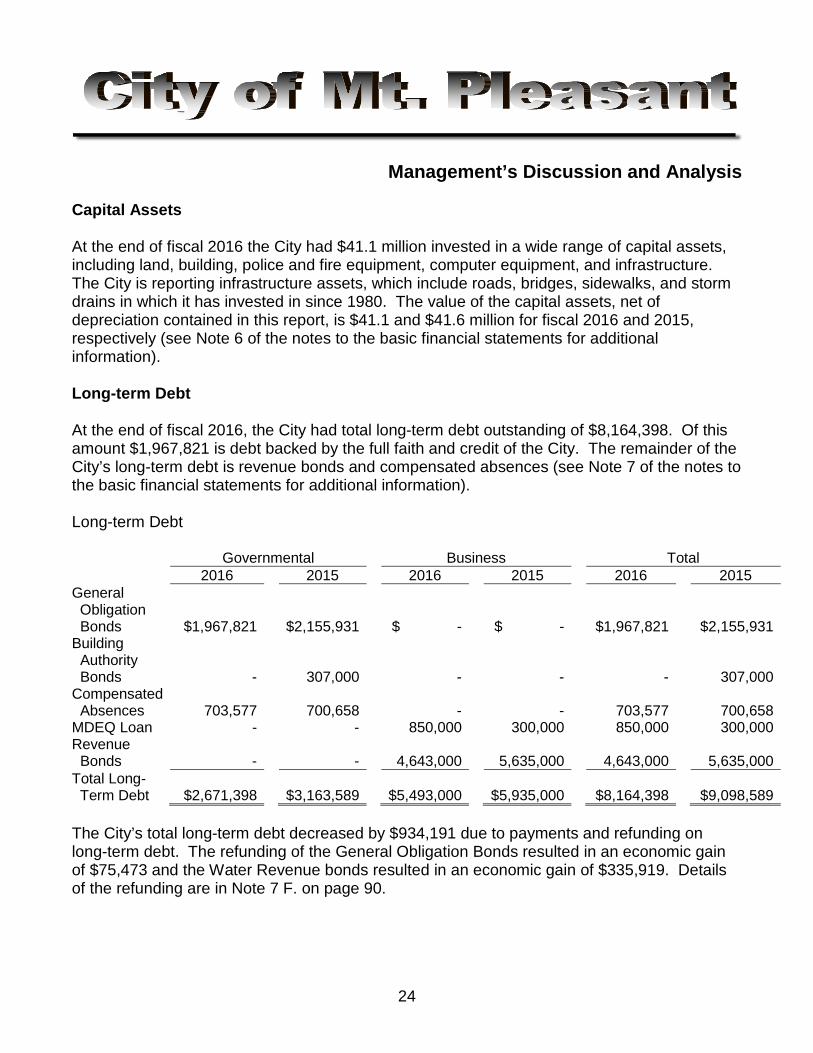
Capital Assets At the end of fiscal 2016 the City had $41.1 million invested in a wide range of capital assets, including land, building, police and fire equipment, computer equipment, and infrastructure. The City is reporting infrastructure assets, which include roads, bridges, sidewalks, and storm drains in which it has invested in since 1980. The value of the capital assets, net of depreciation contained in this report, is $41.1 and $41.6 million for fiscal 2016 and 2015, respectively (see Note 6 of the notes to the basic financial statements for additional information). Long-term Debt At the end of fiscal 2016, the City had total long-term debt outstanding of $8,164,398. Of this amount $1,967,821 is debt backed by the full faith and credit of the City. The remainder of the City’s long-term debt is revenue bonds and compensated absences (see Note 7 of the notes to the basic financial statements for additional information). Long-term Debt Governmental Business Total 2016 2015 2016 2015 2016 2015 General Obligation Bonds $1,967,821 $2,155,931 $ - $ - $1,967,821 $2,155,931 Building Authority Bonds - 307,000 - - - 307,000 Compensated Absences 703,577 700,658 - - 703,577 700,658 MDEQ Loan - - 850,000 300,000 850,000 300,000 Revenue Bonds - - 4,643,000 5,635,000 4,643,000 5,635,000 Total Long- Term Debt $2,671,398 $3,163,589 $5,493,000 $5,935,000 $8,164,398 $9,098,589 The City’s total long-term debt decreased by $934,191 due to payments and refunding on long-term debt. The refunding of the General Obligation Bonds resulted in an economic gain of $75,473 and the Water Revenue bonds resulted in an economic gain of $335,919. Details of the refunding are in Note 7 F. on page 90.
24
Management’s Discussion and Analysis
Long-term Debt (Continued) The City maintains an “A+” rating from Standard & Poors for revenue bonds and an “AA-“ for general obligation bonds. State statutes limit the amount of general obligation debt a governmental entity may issue to 10% of the state equalized value. The current debt limitation of the City is $46,745,858 which is significantly in excess of the City’s outstanding general obligation debt. Additional information on the City’s long-term debt can be found in Note 7 on pages 87-90 of this report. Economic Factors and Next Year’s Budgets and Rates The total City property tax millage currently is 16.25 mills, which is approximately 5 mills below the maximum allowed by Charter. Property tax revenues represent about 50% of the General Fund Revenue budget. The millage rate has ranged from 15.45 to 16.25 over the last 10 years with very little volatility in spite of the changes in funding from State Shared Revenue. During 2017, we expect that property tax values will experience an increase over 2016 values due to the completion of construction of the new Courtyard Mt Pleasant at CMU with a taxable value of $11.5 million. This is offset by the state exemption of eligible manufacturing personal property and small personal property parcels. The City has been fortunate that real property taxable values have decreased only once (in 2010) over the last thirteen (13) years. It is expected that the State will reimburse the equivalent of taxes on the personal property tax exempted. Based on State budget proposals, the City expects its 2017 fiscal year State Shared Revenue, which represents about 25% of the General Fund Revenue, to increase slightly. The distribution of the statutory portion of State Shared Revenue was drastically changed in the State’s 2011-12 approved budget. The new program entitled Economic Vitality Incentive Program (EVIP) requires cities to meet certain performance standards in order to receive it. The City has met all of the performance standards expected for 2013-17. The State Legislature passed legislation to eliminate a portion of personal property tax revenue in 2014 as well as revenue replacement options for the loss. The decrease in State Shared revenue over the past few years, the reduction of personal property tax, and the failure of property tax increases to outpace inflationary budget increases is projected to cause gaps between future revenues and expenditures. The staff and City Commission continue to pay close attention to the changes and adjust as needed.
25
Management’s Discussion and Analysis
Economic Factors and Next Year’s Budgets and Rates (Continued) The City will continue to focus on investing into our local economy by incenting the development and redevelopment of private business and commercial markets. The City is doing this by offering incentives and greater partnerships with our regional economic development organization (Middle Michigan Development Corporation) and the Central Michigan University Research Corporation to spin-off entrepreneurial businesses. Funding for these incentives will come from both of the local Tax Increment Districts and the $312,772 remaining in the General Fund Balance assigned for Economic Initiatives that the City Commission created in 2008. An analysis of our economic development focus reflects an increase of over $19.3 million in our taxable value between 2010 and 2016. In addition the City will begin to market the Center property for development. As we look forward to the next decade we will not be satisfied with merely surviving the change to the State economy. We expect to emerge providing excellent service and creating a future for our community where our citizens are safe, enriched and confident in their choice to live in mid-Michigan based on the investments we make to assist local business development and redevelopment. Contacting the City’s Management This financial report is intended to provide our citizens, taxpayers, customers, and investors with a general overview of the City’s finances and to show the City’s accountability for the money it receives. If you have any questions about this report or need additional information, we invite you to contact the Finance Director at City Hall.
26

27
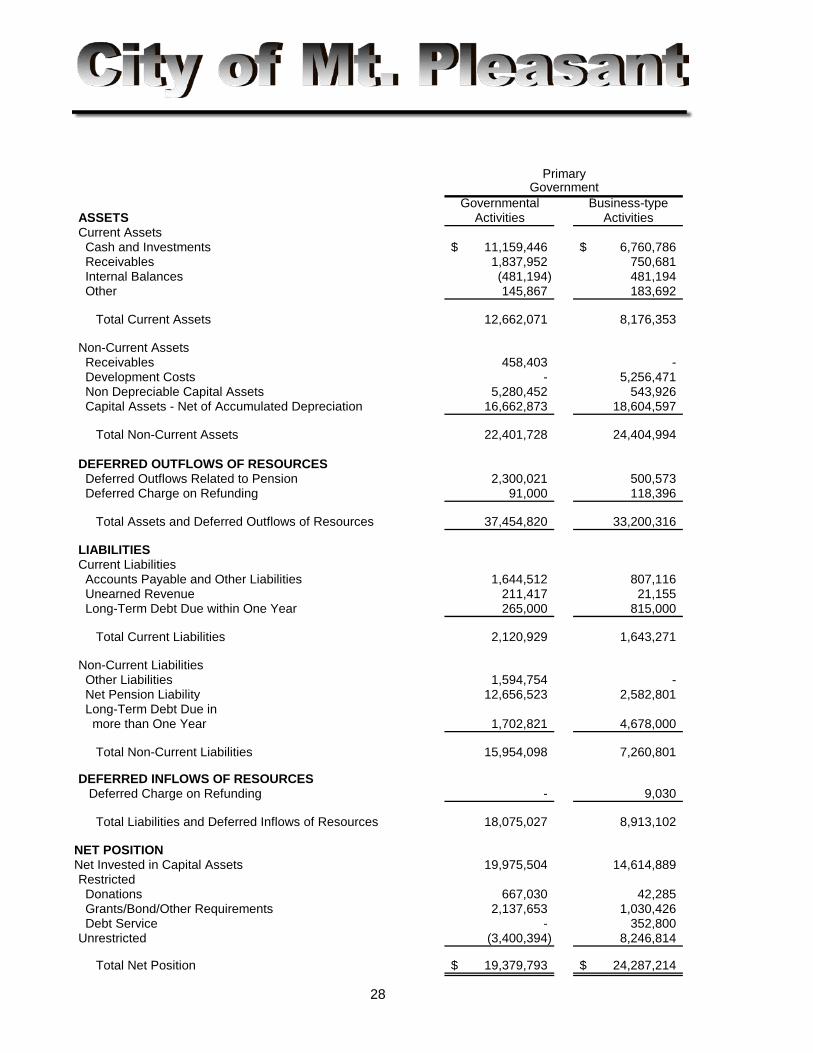
Governmental Business-typeASSETS Activities ActivitiesCurrent Assets Cash and Investments 11,159,446$ 6,760,786$ Receivables 1,837,952 750,681 Internal Balances (481,194) 481,194 Other 145,867 183,692
Total Current Assets 12,662,071 8,176,353
Non-Current Assets Receivables 458,403 - Development Costs - 5,256,471 Non Depreciable Capital Assets 5,280,452 543,926 Capital Assets - Net of Accumulated Depreciation 16,662,873 18,604,597
Total Non-Current Assets 22,401,728 24,404,994
DEFERRED OUTFLOWS OF RESOURCES Deferred Outflows Related to Pension 2,300,021 500,573 Deferred Charge on Refunding 91,000 118,396
Total Assets and Deferred Outflows of Resources 37,454,820 33,200,316
LIABILITIES Current Liabilities Accounts Payable and Other Liabilities 1,644,512 807,116 Unearned Revenue 211,417 21,155 Long-Term Debt Due within One Year 265,000 815,000
Total Current Liabilities 2,120,929 1,643,271
Non-Current Liabilities Other Liabilities 1,594,754 - Net Pension Liability 12,656,523 2,582,801 Long-Term Debt Due in more than One Year 1,702,821 4,678,000
Total Non-Current Liabilities 15,954,098 7,260,801
DEFERRED INFLOWS OF RESOURCES Deferred Charge on Refunding - 9,030
Total Liabilities and Deferred Inflows of Resources 18,075,027 8,913,102
NET POSITIONNet Invested in Capital Assets 19,975,504 14,614,889 Restricted Donations 667,030 42,285 Grants/Bond/Other Requirements 2,137,653 1,030,426 Debt Service - 352,800 Unrestricted (3,400,394) 8,246,814
Total Net Position 19,379,793$ 24,287,214$
PrimaryGovernment
28
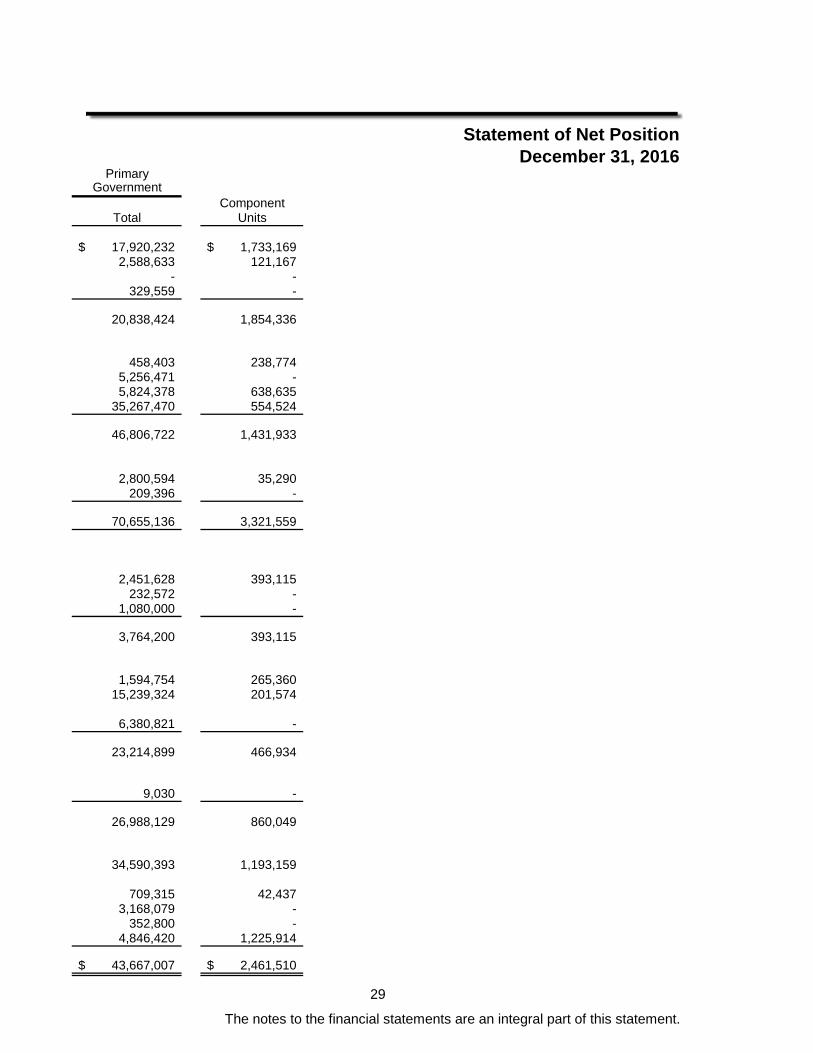
Statement of Net PositionDecember 31, 2016
PrimaryGovernment
ComponentTotal Units
17,920,232$ 1,733,169$ 2,588,633 121,167
- - 329,559 -
20,838,424 1,854,336
458,403 238,774 5,256,471 - 5,824,378 638,635
35,267,470 554,524
46,806,722 1,431,933
2,800,594 35,290 209,396 -
70,655,136 3,321,559
2,451,628 393,115 232,572 -
1,080,000 -
3,764,200 393,115
1,594,754 265,360 15,239,324 201,574
6,380,821 -
23,214,899 466,934
9,030 -
26,988,129 860,049
34,590,393 1,193,159
709,315 42,437 3,168,079 -
352,800 - 4,846,420 1,225,914
43,667,007$ 2,461,510$
The notes to the financial statements are an integral part of this statement.
29
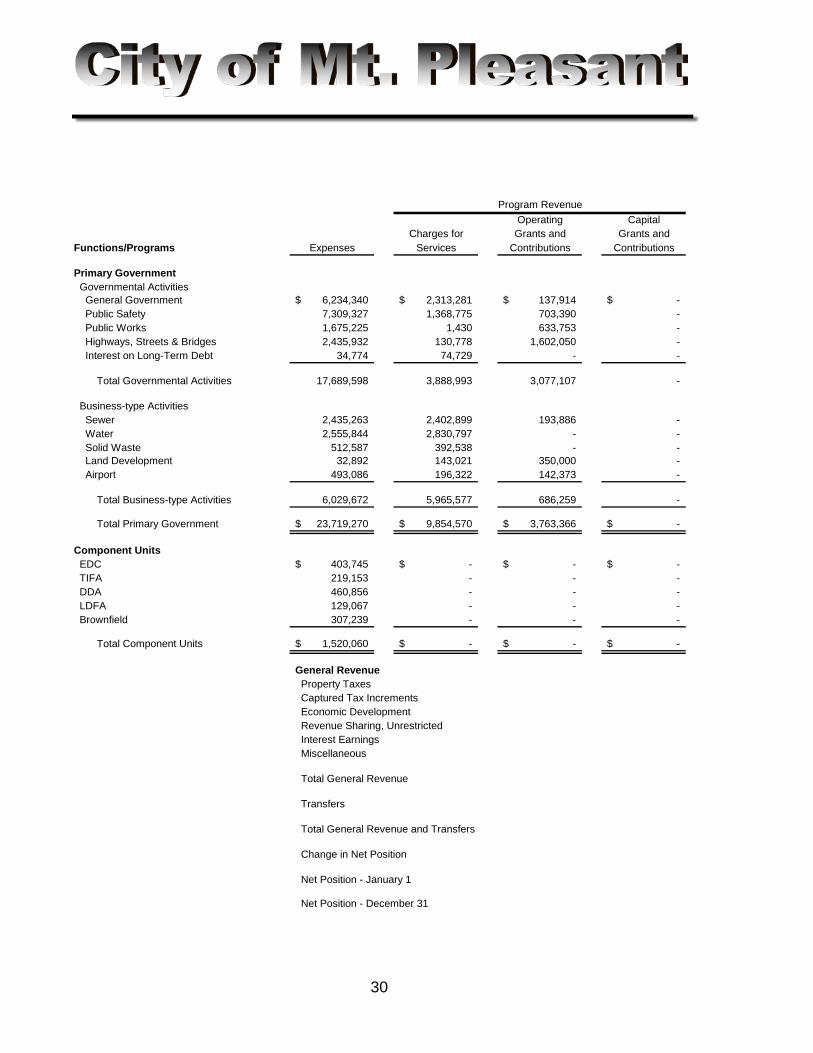
Operating CapitalCharges for Grants and Grants and
Functions/Programs Expenses Services Contributions Contributions
Primary Government Governmental Activities General Government 6,234,340$ 2,313,281$ 137,914$ -$ Public Safety 7,309,327 1,368,775 703,390 - Public Works 1,675,225 1,430 633,753 - Highways, Streets & Bridges 2,435,932 130,778 1,602,050 - Interest on Long-Term Debt 34,774 74,729 - -
Total Governmental Activities 17,689,598 3,888,993 3,077,107 -
Business-type Activities Sewer 2,435,263 2,402,899 193,886 - Water 2,555,844 2,830,797 - - Solid Waste 512,587 392,538 - - Land Development 32,892 143,021 350,000 - Airport 493,086 196,322 142,373 -
Total Business-type Activities 6,029,672 5,965,577 686,259 -
Total Primary Government 23,719,270$ 9,854,570$ 3,763,366$ -$
Component Units EDC 403,745$ -$ -$ -$ TIFA 219,153 - - - DDA 460,856 - - - LDFA 129,067 - - - Brownfield 307,239 - - -
Total Component Units 1,520,060$ -$ -$ -$
General Revenue Property Taxes Captured Tax Increments Economic Development Revenue Sharing, Unrestricted Interest Earnings Miscellaneous
Total General Revenue
Transfers
Total General Revenue and Transfers
Change in Net Position
Net Position - January 1
Net Position - December 31
30
Program Revenue
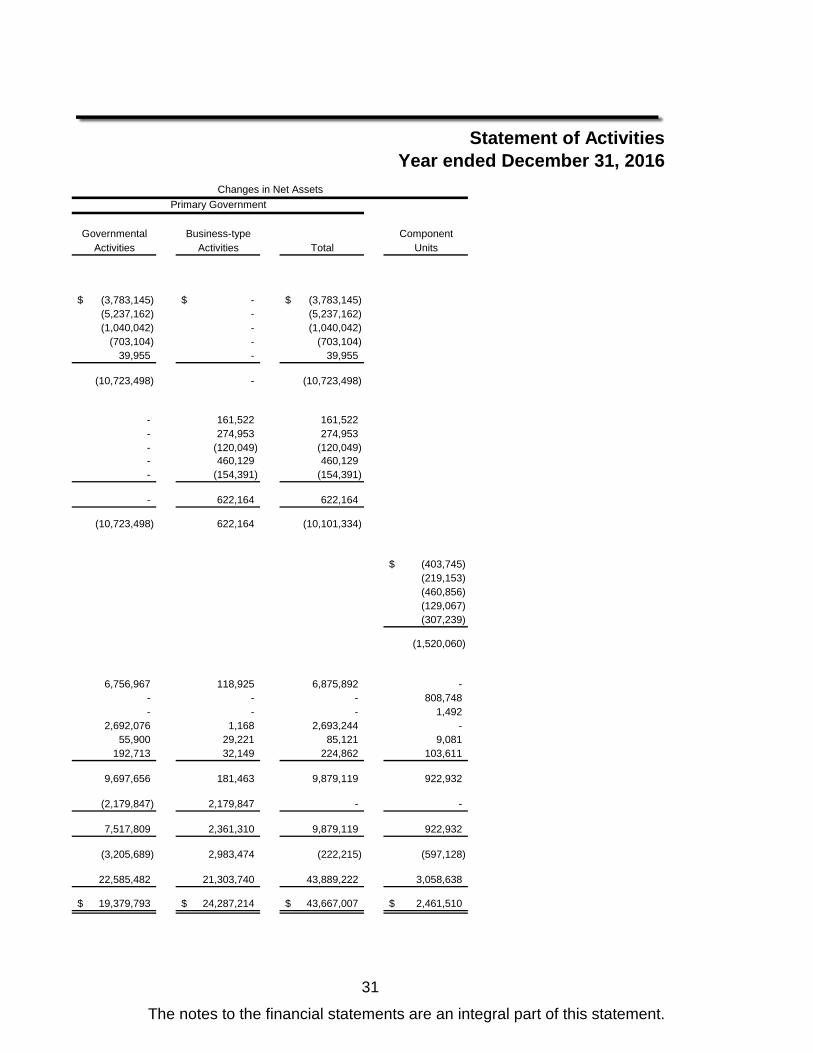
Statement of ActivitiesYear ended December 31, 2016
Governmental Business-type ComponentActivities Activities Total Units
(3,783,145)$ -$ (3,783,145)$ (5,237,162) - (5,237,162) (1,040,042) - (1,040,042)
(703,104) - (703,104) 39,955 - 39,955
(10,723,498) - (10,723,498)
- 161,522 161,522 - 274,953 274,953 - (120,049) (120,049) - 460,129 460,129 - (154,391) (154,391)
- 622,164 622,164
(10,723,498) 622,164 (10,101,334)
(403,745)$ (219,153) (460,856) (129,067) (307,239)
(1,520,060)
6,756,967 118,925 6,875,892 - - - - 808,748 - - - 1,492
2,692,076 1,168 2,693,244 - 55,900 29,221 85,121 9,081
192,713 32,149 224,862 103,611
9,697,656 181,463 9,879,119 922,932
(2,179,847) 2,179,847 - -
7,517,809 2,361,310 9,879,119 922,932
(3,205,689) 2,983,474 (222,215) (597,128)
22,585,482 21,303,740 43,889,222 3,058,638
19,379,793$ 24,287,214$ 43,667,007$ 2,461,510$
The notes to the financial statements are an integral part of this statement.
Changes in Net AssetsPrimary Government
31
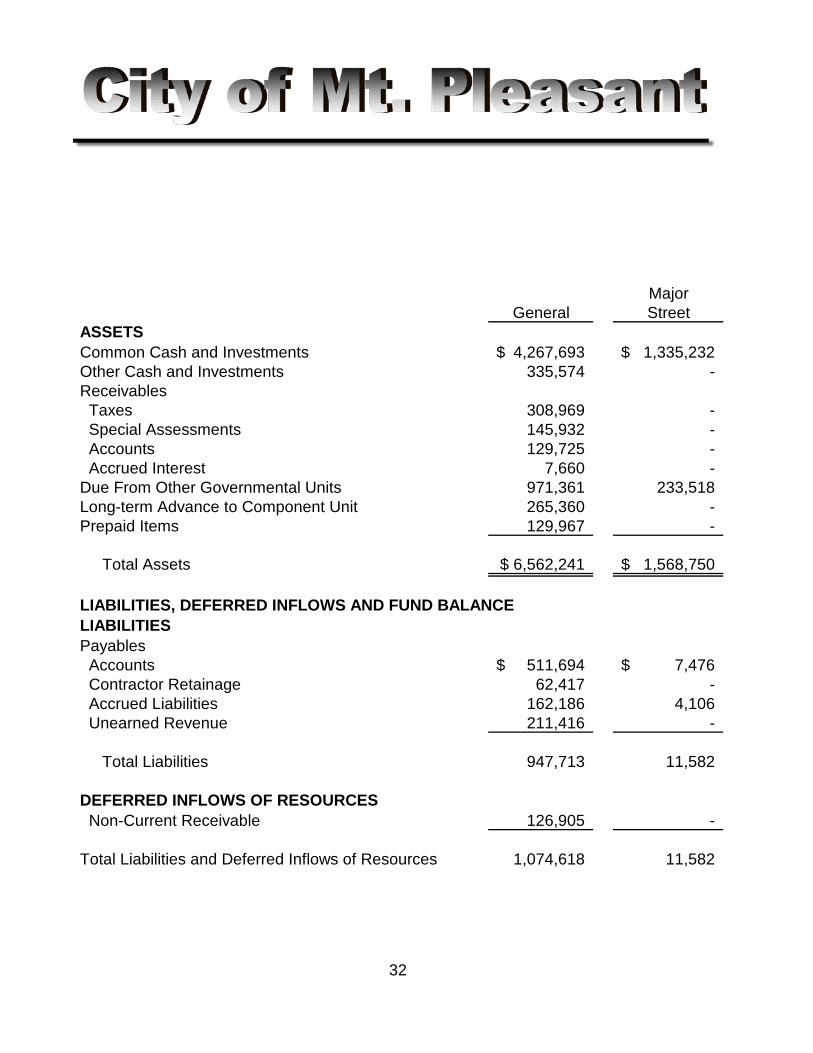
MajorGeneral Street
ASSETSCommon Cash and Investments 4,267,693$ 1,335,232$ Other Cash and Investments 335,574 - Receivables Taxes 308,969 - Special Assessments 145,932 - Accounts 129,725 - Accrued Interest 7,660 - Due From Other Governmental Units 971,361 233,518 Long-term Advance to Component Unit 265,360 - Prepaid Items 129,967 -
Total Assets 6,562,241$ 1,568,750$
LIABILITIES, DEFERRED INFLOWS AND FUND BALANCE LIABILITIES Payables Accounts 511,694$ 7,476$ Contractor Retainage 62,417 - Accrued Liabilities 162,186 4,106 Unearned Revenue 211,416 -
Total Liabilities 947,713 11,582
DEFERRED INFLOWS OF RESOURCES Non-Current Receivable 126,905 -
Total Liabilities and Deferred Inflows of Resources 1,074,618 11,582
32
Governmental FundsBalance Sheet
December 31, 2016(Continued)
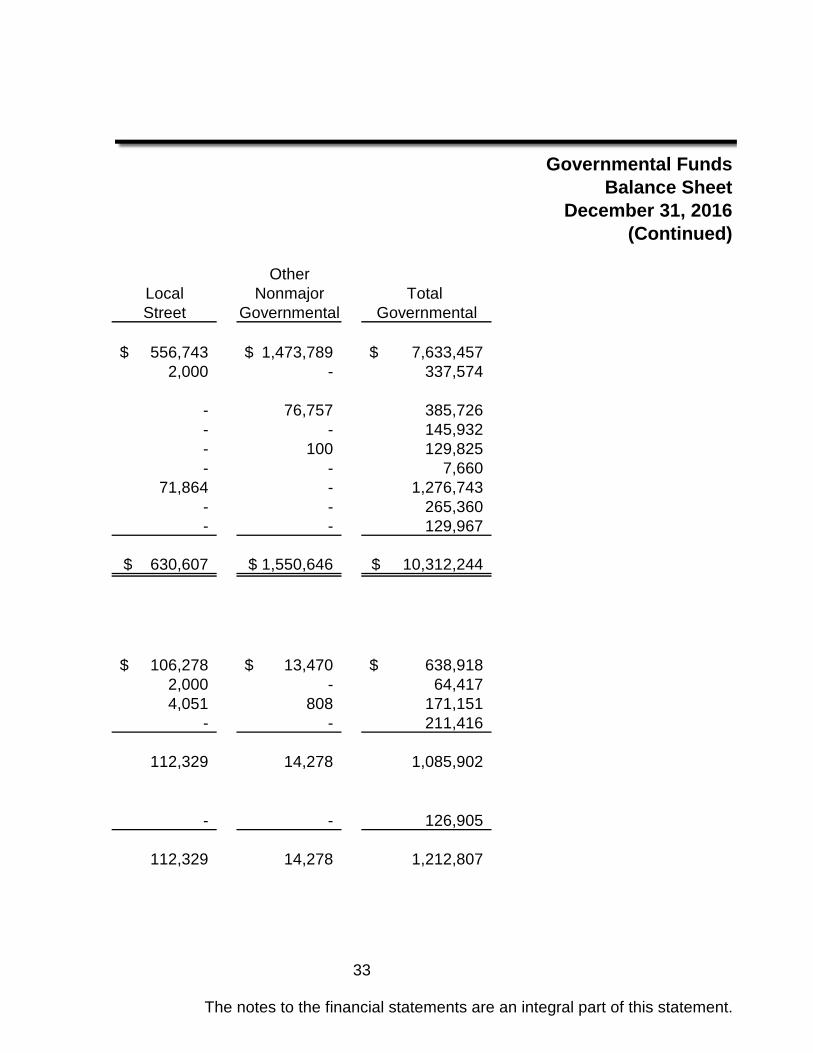
OtherLocal Nonmajor Total Street Governmental Governmental
556,743$ 1,473,789$ 7,633,457$ 2,000 - 337,574
- 76,757 385,726 - - 145,932 - 100 129,825 - - 7,660
71,864 - 1,276,743 - - 265,360 - - 129,967
630,607$ 1,550,646$ 10,312,244$
106,278$ 13,470$ 638,918$ 2,000 - 64,417 4,051 808 171,151
- - 211,416
112,329 14,278 1,085,902
- - 126,905
112,329 14,278 1,212,807
The notes to the financial statements are an integral part of this statement.
33
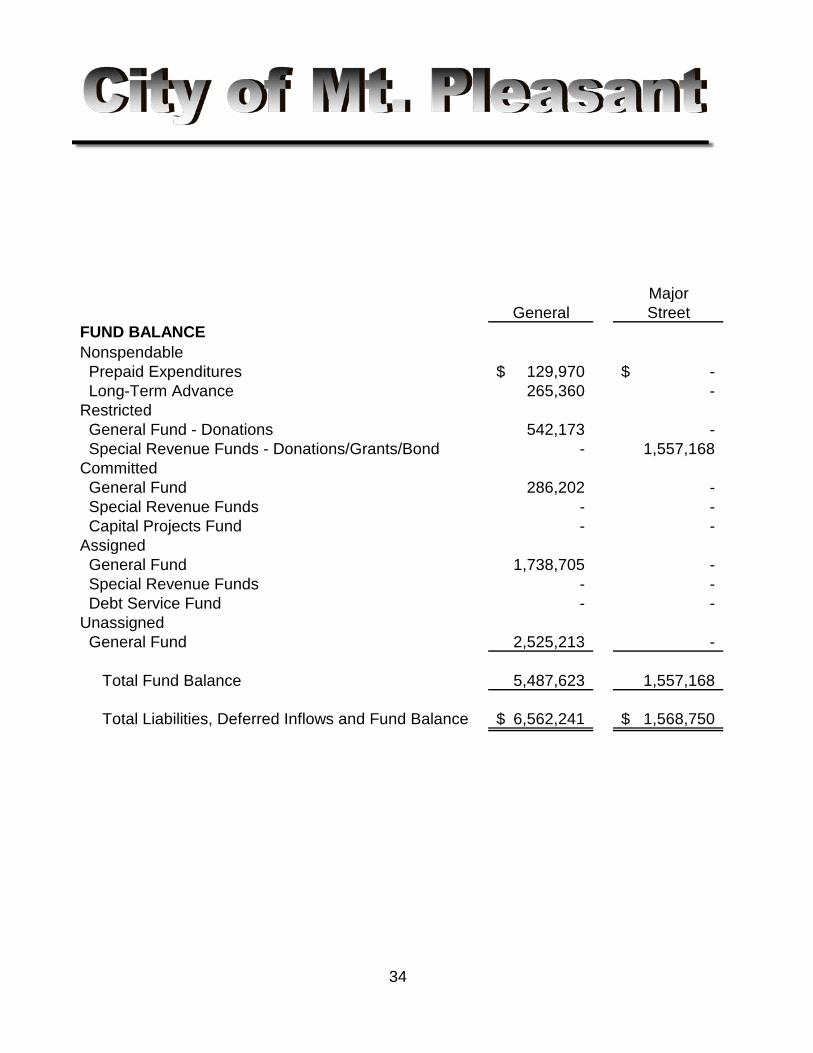
MajorGeneral Street
FUND BALANCENonspendable Prepaid Expenditures 129,970$ -$ Long-Term Advance 265,360 - Restricted General Fund - Donations 542,173 - Special Revenue Funds - Donations/Grants/Bond - 1,557,168 Committed General Fund 286,202 - Special Revenue Funds - - Capital Projects Fund - - Assigned General Fund 1,738,705 - Special Revenue Funds - - Debt Service Fund - - Unassigned General Fund 2,525,213 -
Total Fund Balance 5,487,623 1,557,168
Total Liabilities, Deferred Inflows and Fund Balance 6,562,241$ 1,568,750$
34
Governmental FundsBalance Sheet
December 31, 2016(Continued)
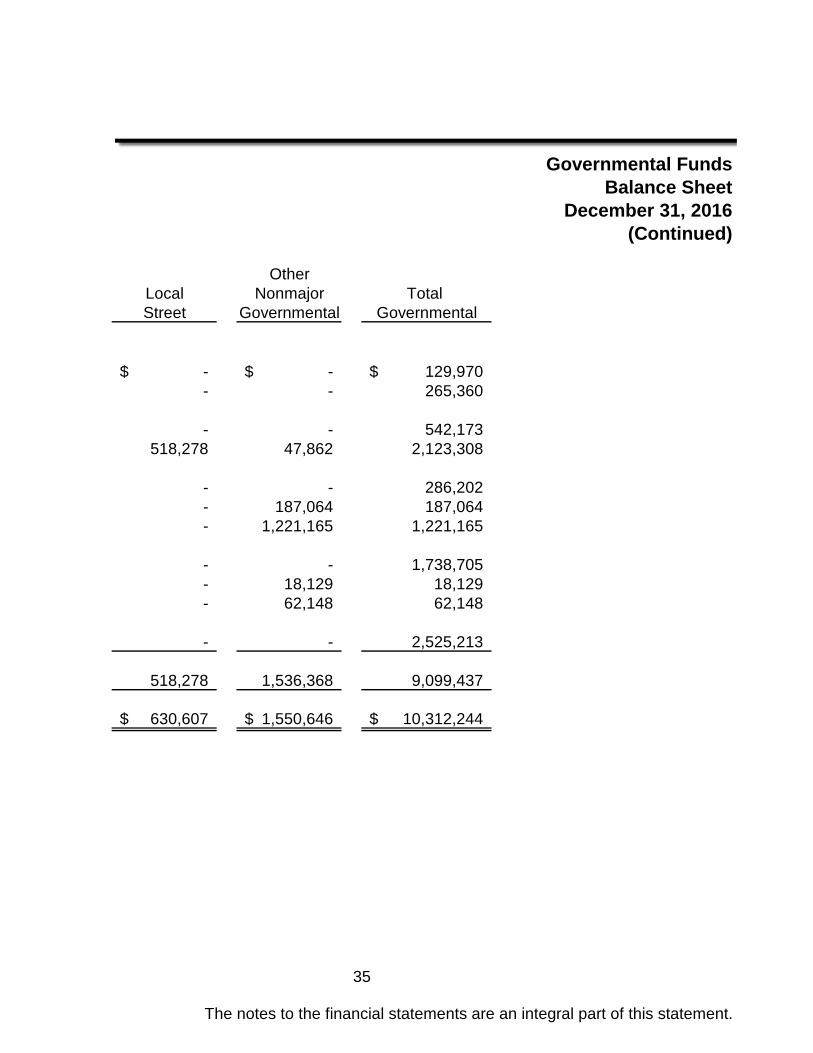
OtherLocal Nonmajor Total Street Governmental Governmental
-$ -$ 129,970$ - - 265,360
- - 542,173 518,278 47,862 2,123,308
- - 286,202 - 187,064 187,064 - 1,221,165 1,221,165
- - 1,738,705 - 18,129 18,129 - 62,148 62,148
- - 2,525,213
518,278 1,536,368 9,099,437
630,607$ 1,550,646$ 10,312,244$
The notes to the financial statements are an integral part of this statement.
35

36
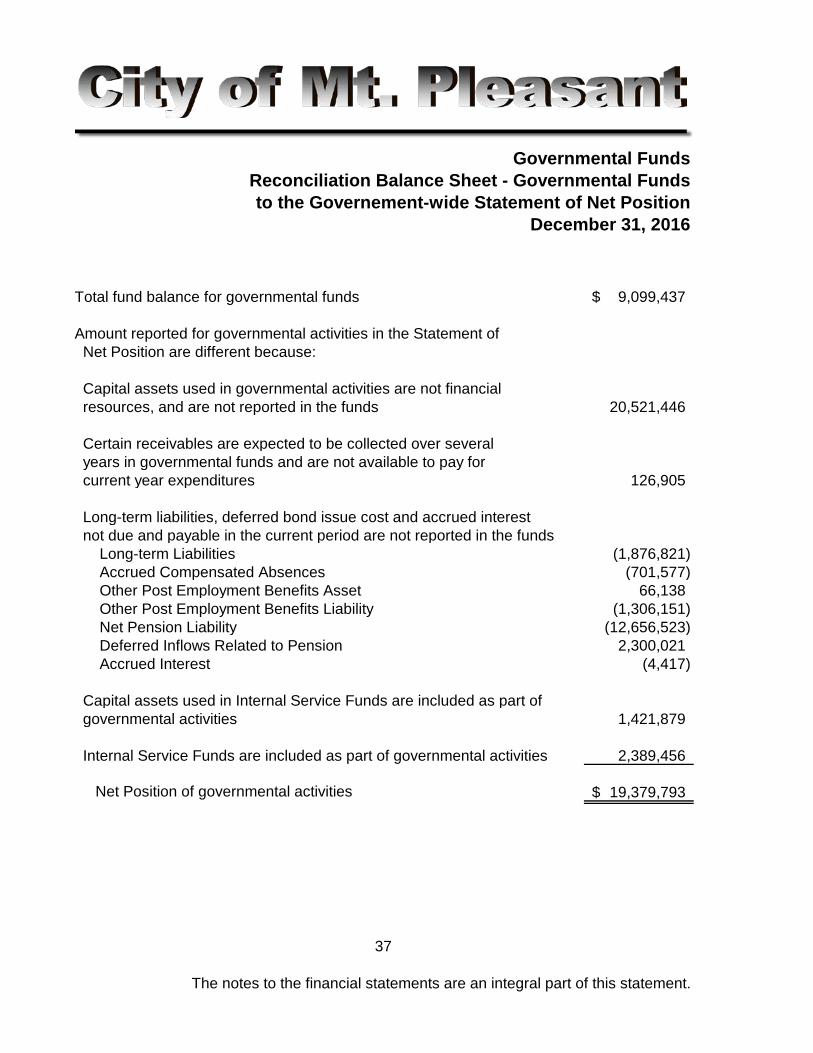
Governmental FundsReconciliation Balance Sheet - Governmental Fundsto the Governement-wide Statement of Net Position
December 31, 2016
Total fund balance for governmental funds 9,099,437$
Amount reported for governmental activities in the Statement of Net Position are different because:
Capital assets used in governmental activities are not financial resources, and are not reported in the funds 20,521,446
Certain receivables are expected to be collected over several years in governmental funds and are not available to pay for current year expenditures 126,905
Long-term liabilities, deferred bond issue cost and accrued interest not due and payable in the current period are not reported in the funds Long-term Liabilities (1,876,821) Accrued Compensated Absences (701,577) Other Post Employment Benefits Asset 66,138 Other Post Employment Benefits Liability (1,306,151) Net Pension Liability (12,656,523) Deferred Inflows Related to Pension 2,300,021 Accrued Interest (4,417)
Capital assets used in Internal Service Funds are included as part of governmental activities 1,421,879
Internal Service Funds are included as part of governmental activities 2,389,456
Net Position of governmental activities 19,379,793$
The notes to the financial statements are an integral part of this statement.
37
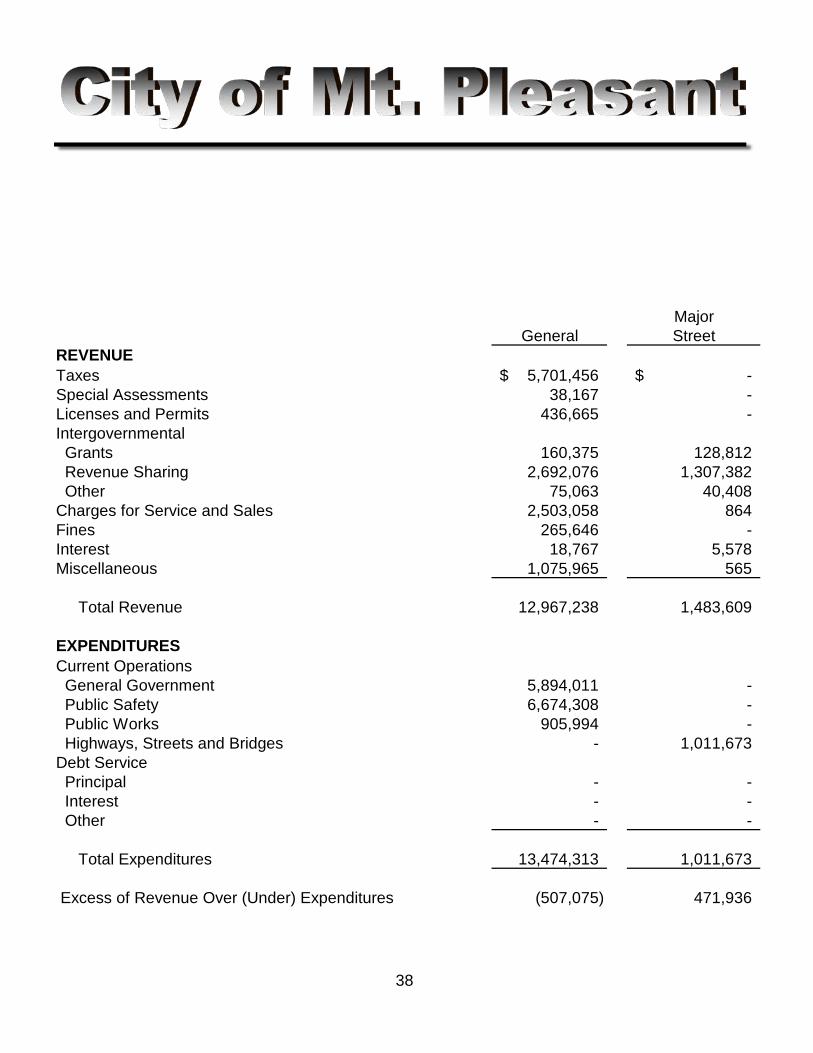
MajorGeneral Street
REVENUETaxes 5,701,456$ -$ Special Assessments 38,167 - Licenses and Permits 436,665 - Intergovernmental Grants 160,375 128,812 Revenue Sharing 2,692,076 1,307,382 Other 75,063 40,408 Charges for Service and Sales 2,503,058 864 Fines 265,646 - Interest 18,767 5,578 Miscellaneous 1,075,965 565
Total Revenue 12,967,238 1,483,609
EXPENDITURESCurrent Operations General Government 5,894,011 - Public Safety 6,674,308 - Public Works 905,994 - Highways, Streets and Bridges - 1,011,673 Debt Service Principal - - Interest - - Other - -
Total Expenditures 13,474,313 1,011,673
Excess of Revenue Over (Under) Expenditures (507,075) 471,936
38
Governmental FundsStatement of Revenue, Expenditures, and
Changes in Fund BalanceYear ended December 31, 2016
(Continued)
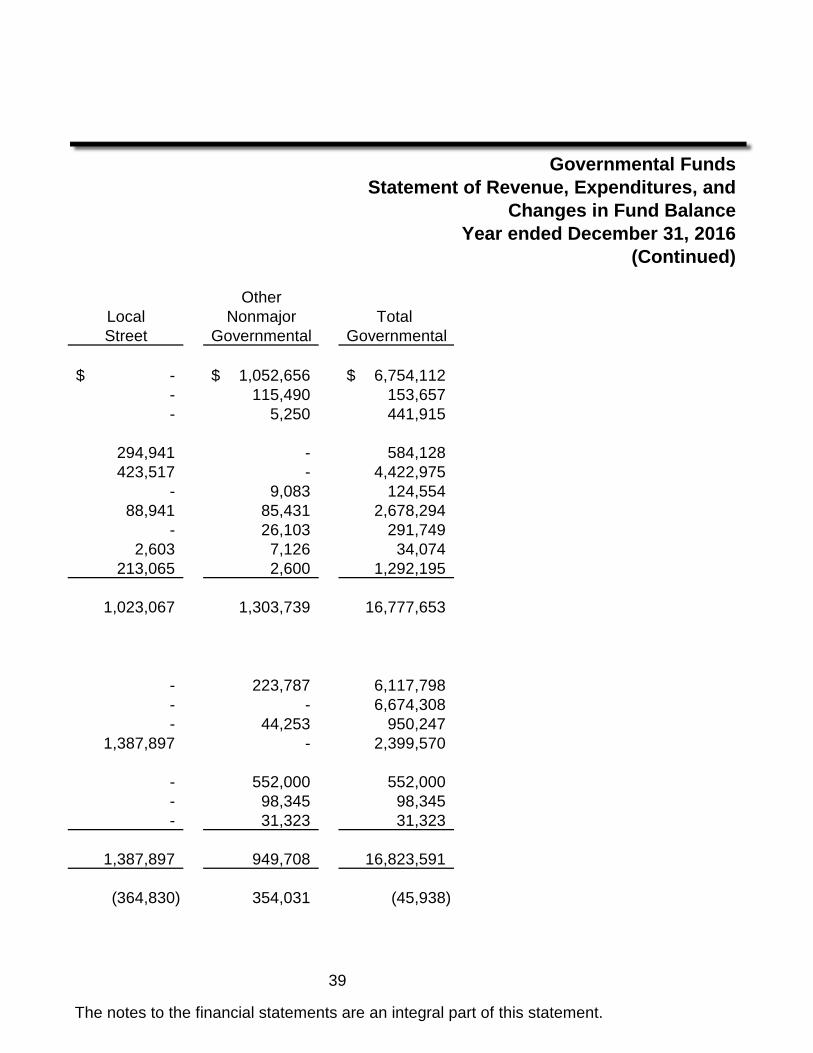
OtherLocal Nonmajor Total Street Governmental Governmental
-$ 1,052,656$ 6,754,112$ - 115,490 153,657 - 5,250 441,915
294,941 - 584,128 423,517 - 4,422,975
- 9,083 124,554 88,941 85,431 2,678,294
- 26,103 291,749 2,603 7,126 34,074
213,065 2,600 1,292,195
1,023,067 1,303,739 16,777,653
- 223,787 6,117,798 - - 6,674,308 - 44,253 950,247
1,387,897 - 2,399,570
- 552,000 552,000 - 98,345 98,345 - 31,323 31,323
1,387,897 949,708 16,823,591
(364,830) 354,031 (45,938)
The notes to the financial statements are an integral part of this statement.
39
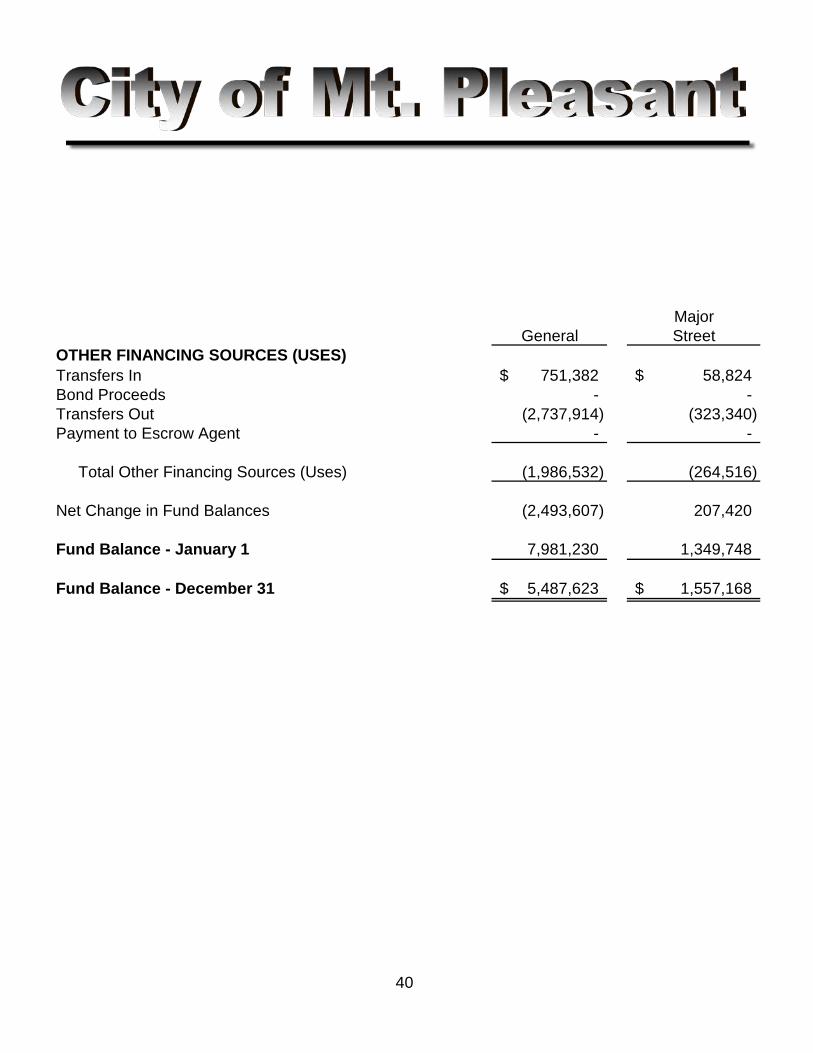
MajorGeneral Street
OTHER FINANCING SOURCES (USES)Transfers In 751,382$ 58,824$ Bond Proceeds - - Transfers Out (2,737,914) (323,340) Payment to Escrow Agent - -
Total Other Financing Sources (Uses) (1,986,532) (264,516)
Net Change in Fund Balances (2,493,607) 207,420
Fund Balance - January 1 7,981,230 1,349,748
Fund Balance - December 31 5,487,623$ 1,557,168$
40
Governmental FundsStatement of Revenue, Expenditures, and
Changes in Fund BalanceYear ended December 31, 2016
(Continued)
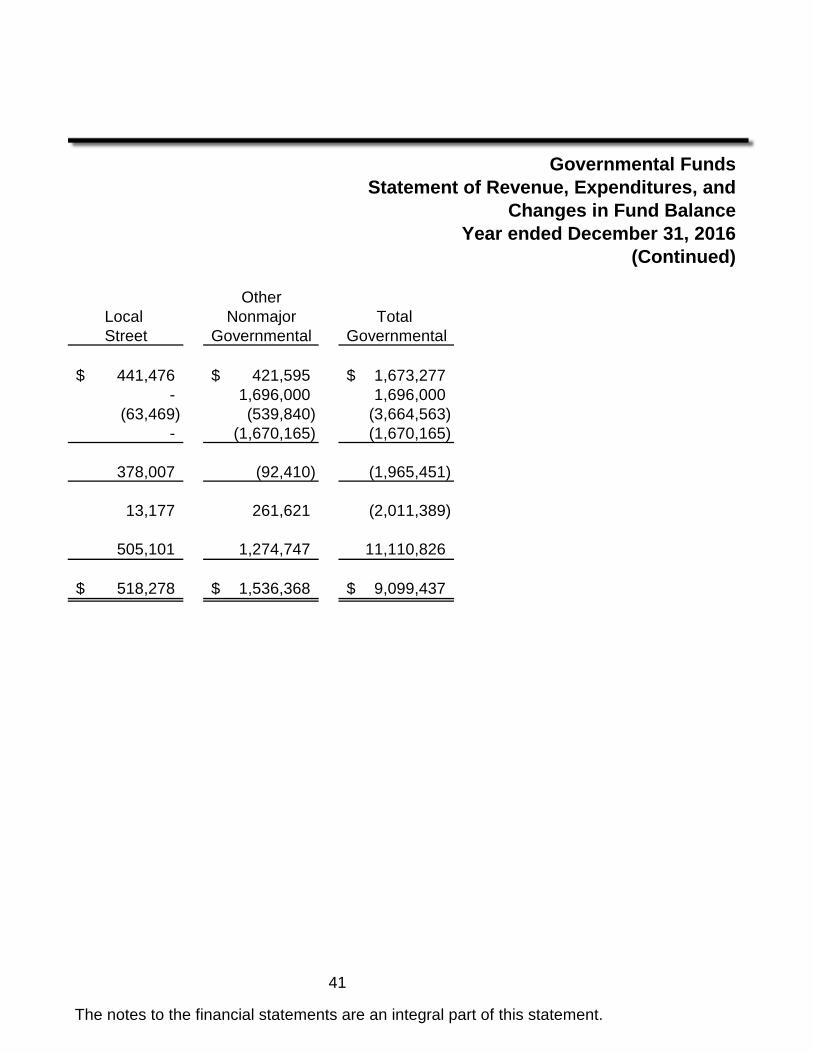
OtherLocal Nonmajor Total Street Governmental Governmental
441,476$ 421,595$ 1,673,277$ - 1,696,000 1,696,000
(63,469) (539,840) (3,664,563) - (1,670,165) (1,670,165)
378,007 (92,410) (1,965,451)
13,177 261,621 (2,011,389)
505,101 1,274,747 11,110,826
518,278$ 1,536,368$ 9,099,437$
The notes to the financial statements are an integral part of this statement.
41
Governmental FundsReconciliation of Statement of Revenue,
Expenditures, and Changes in Fund Balance - Governemental Funds to the Government-wide Statement of Activities
Year ended December 31, 2016
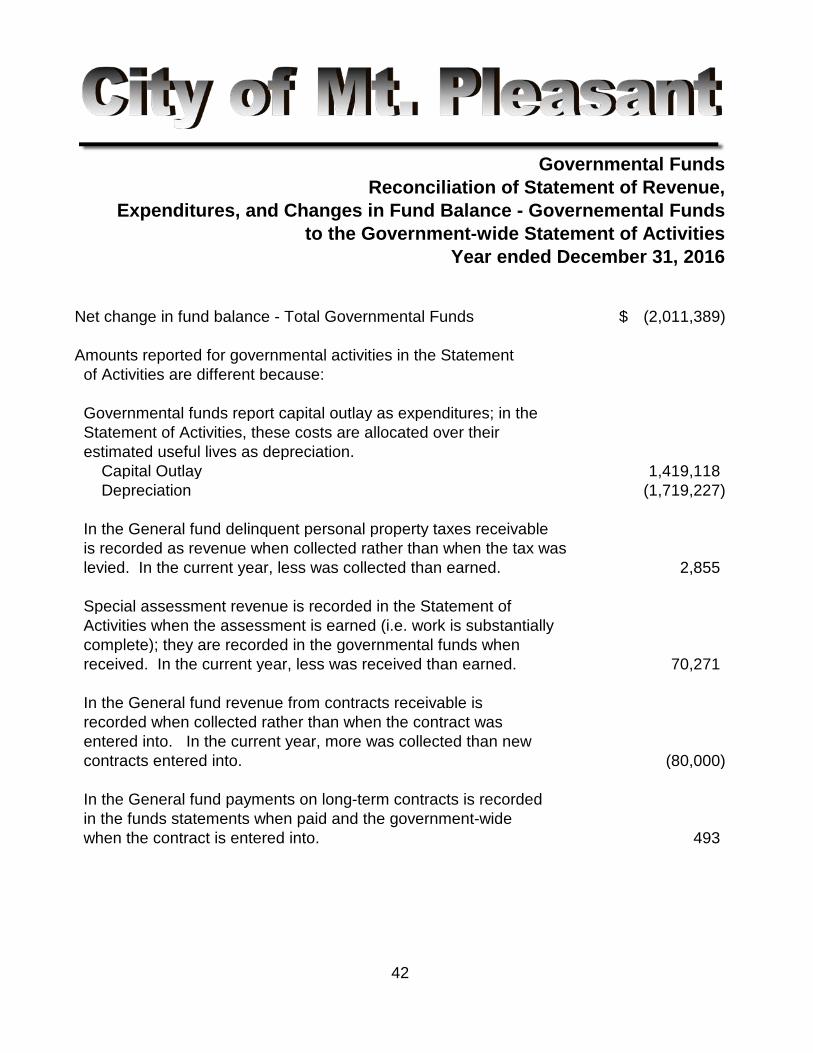
Net change in fund balance - Total Governmental Funds (2,011,389)$
Amounts reported for governmental activities in the Statement of Activities are different because:
Governmental funds report capital outlay as expenditures; in the Statement of Activities, these costs are allocated over their estimated useful lives as depreciation. Capital Outlay 1,419,118 Depreciation (1,719,227)
In the General fund delinquent personal property taxes receivable is recorded as revenue when collected rather than when the tax was levied. In the current year, less was collected than earned. 2,855
Special assessment revenue is recorded in the Statement of Activities when the assessment is earned (i.e. work is substantially complete); they are recorded in the governmental funds when received. In the current year, less was received than earned. 70,271
In the General fund revenue from contracts receivable is recorded when collected rather than when the contract was entered into. In the current year, more was collected than new contracts entered into. (80,000)
In the General fund payments on long-term contracts is recorded in the funds statements when paid and the government-wide when the contract is entered into. 493
42
Governmental FundsReconciliation of Statement of Revenue,
Expenditures, and Changes in Fund Balanceof Governmental Funds to the Statement of Activities
Year ended December 31, 2016
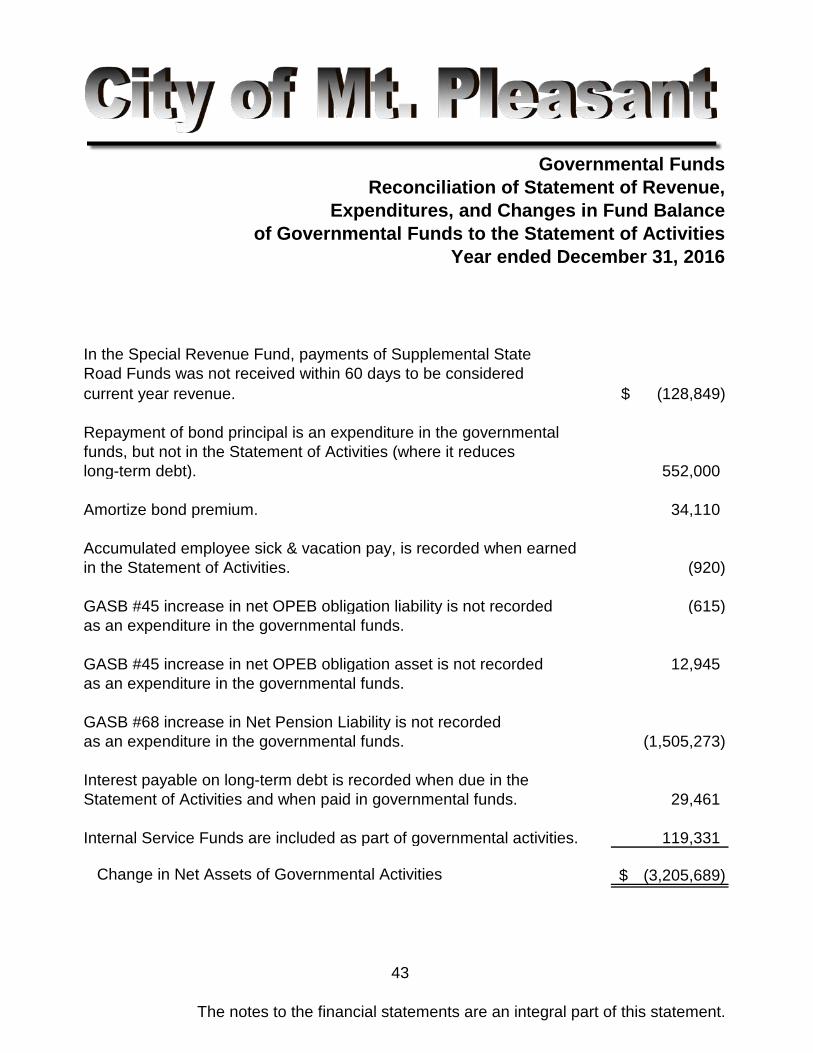
In the Special Revenue Fund, payments of Supplemental State Road Funds was not received within 60 days to be considered current year revenue. (128,849)$
Repayment of bond principal is an expenditure in the governmental funds, but not in the Statement of Activities (where it reduces long-term debt). 552,000
Amortize bond premium. 34,110
Accumulated employee sick & vacation pay, is recorded when earned in the Statement of Activities. (920)
GASB #45 increase in net OPEB obligation liability is not recorded (615) as an expenditure in the governmental funds.
GASB #45 increase in net OPEB obligation asset is not recorded 12,945 as an expenditure in the governmental funds.
GASB #68 increase in Net Pension Liability is not recorded as an expenditure in the governmental funds. (1,505,273)
Interest payable on long-term debt is recorded when due in the Statement of Activities and when paid in governmental funds. 29,461
Internal Service Funds are included as part of governmental activities. 119,331
Change in Net Assets of Governmental Activities (3,205,689)$
The notes to the financial statements are an integral part of this statement.
43
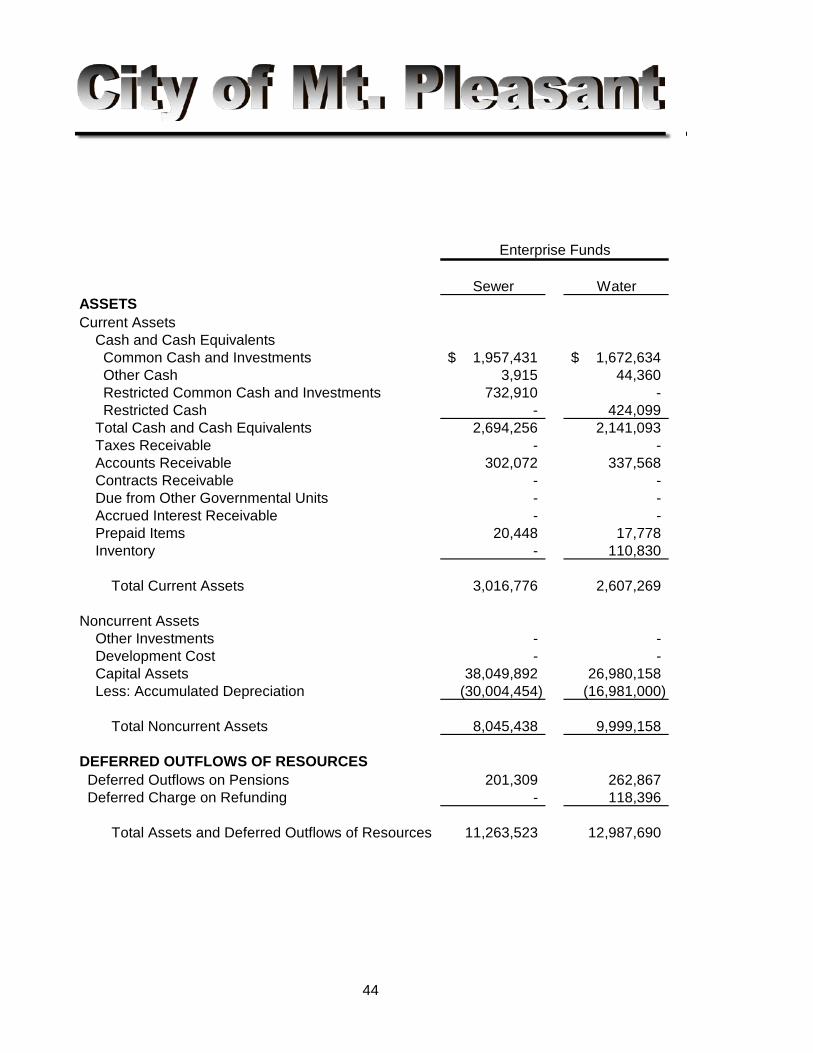
Sewer WaterASSETSCurrent Assets Cash and Cash Equivalents Common Cash and Investments 1,957,431$ 1,672,634$ Other Cash 3,915 44,360 Restricted Common Cash and Investments 732,910 - Restricted Cash - 424,099 Total Cash and Cash Equivalents 2,694,256 2,141,093 Taxes Receivable - - Accounts Receivable 302,072 337,568 Contracts Receivable - - Due from Other Governmental Units - - Accrued Interest Receivable - - Prepaid Items 20,448 17,778 Inventory - 110,830
Total Current Assets 3,016,776 2,607,269
Noncurrent Assets Other Investments - - Development Cost - - Capital Assets 38,049,892 26,980,158 Less: Accumulated Depreciation (30,004,454) (16,981,000)
Total Noncurrent Assets 8,045,438 9,999,158
DEFERRED OUTFLOWS OF RESOURCES Deferred Outflows on Pensions 201,309 262,867 Deferred Charge on Refunding - 118,396
Total Assets and Deferred Outflows of Resources 11,263,523 12,987,690
Enterprise Funds
44
Proprietary FundsStatement of Net Position
December 31, 2016(Continued)
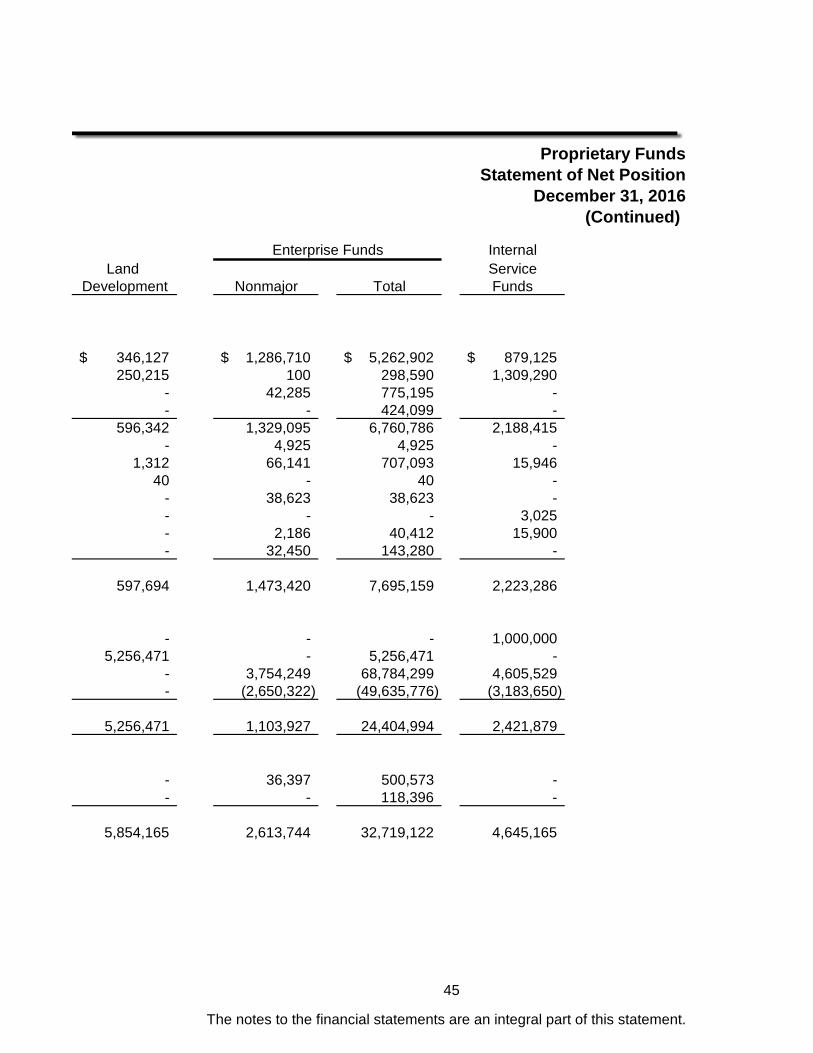
InternalLand Service
Development Nonmajor Total Funds
346,127$ 1,286,710$ 5,262,902$ 879,125$ 250,215 100 298,590 1,309,290
- 42,285 775,195 - - - 424,099 -
596,342 1,329,095 6,760,786 2,188,415 - 4,925 4,925 -
1,312 66,141 707,093 15,946 40 - 40 -
- 38,623 38,623 - - - - 3,025 - 2,186 40,412 15,900 - 32,450 143,280 -
597,694 1,473,420 7,695,159 2,223,286
- - - 1,000,000 5,256,471 - 5,256,471 -
- 3,754,249 68,784,299 4,605,529 - (2,650,322) (49,635,776) (3,183,650)
5,256,471 1,103,927 24,404,994 2,421,879
- 36,397 500,573 - - - 118,396 -
5,854,165 2,613,744 32,719,122 4,645,165
The notes to the financial statements are an integral part of this statement.
Enterprise Funds
45
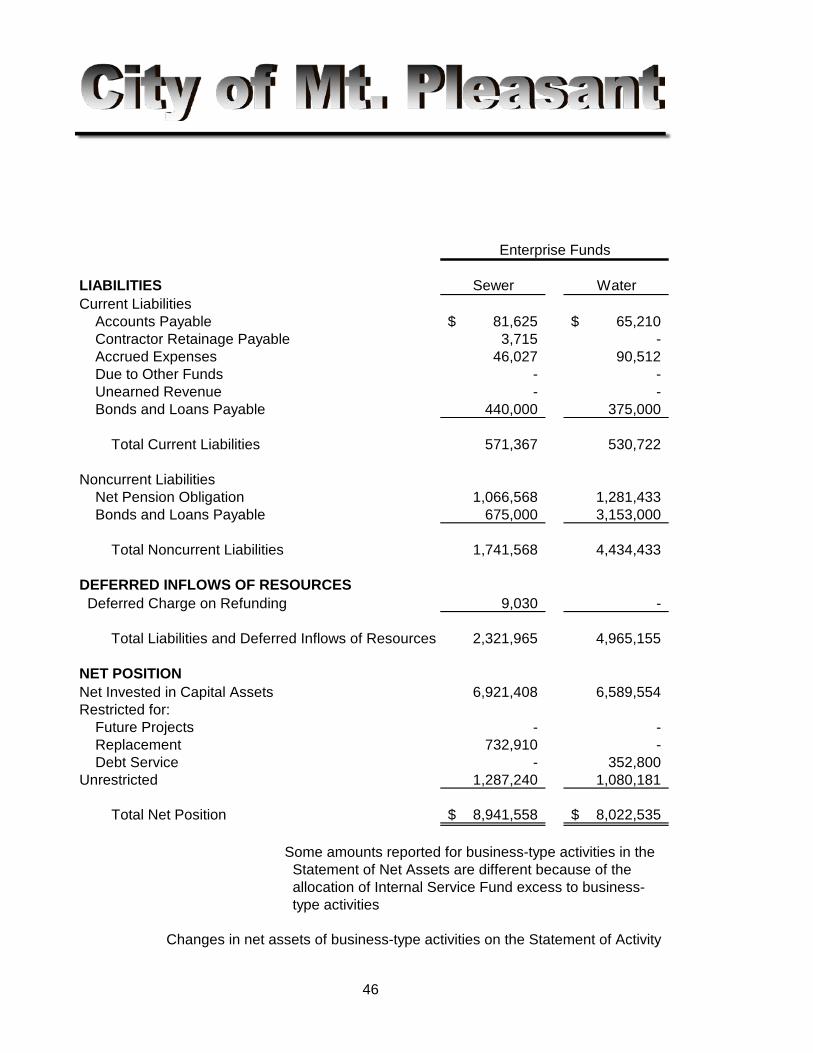
LIABILITIES Sewer WaterCurrent Liabilities Accounts Payable 81,625$ 65,210$ Contractor Retainage Payable 3,715 - Accrued Expenses 46,027 90,512 Due to Other Funds - - Unearned Revenue - - Bonds and Loans Payable 440,000 375,000
Total Current Liabilities 571,367 530,722
Noncurrent Liabilities Net Pension Obligation 1,066,568 1,281,433 Bonds and Loans Payable 675,000 3,153,000
Total Noncurrent Liabilities 1,741,568 4,434,433
DEFERRED INFLOWS OF RESOURCES Deferred Charge on Refunding 9,030 -
Total Liabilities and Deferred Inflows of Resources 2,321,965 4,965,155
NET POSITIONNet Invested in Capital Assets 6,921,408 6,589,554 Restricted for: Future Projects - - Replacement 732,910 - Debt Service - 352,800 Unrestricted 1,287,240 1,080,181
Total Net Position 8,941,558$ 8,022,535$
Some amounts reported for business-type activities in the Statement of Net Assets are different because of the allocation of Internal Service Fund excess to business- type activities
Changes in net assets of business-type activities on the Statement of Activity
46
Enterprise Funds
Proprietary FundsStatement of Net Position
December 31, 2016(Continued)
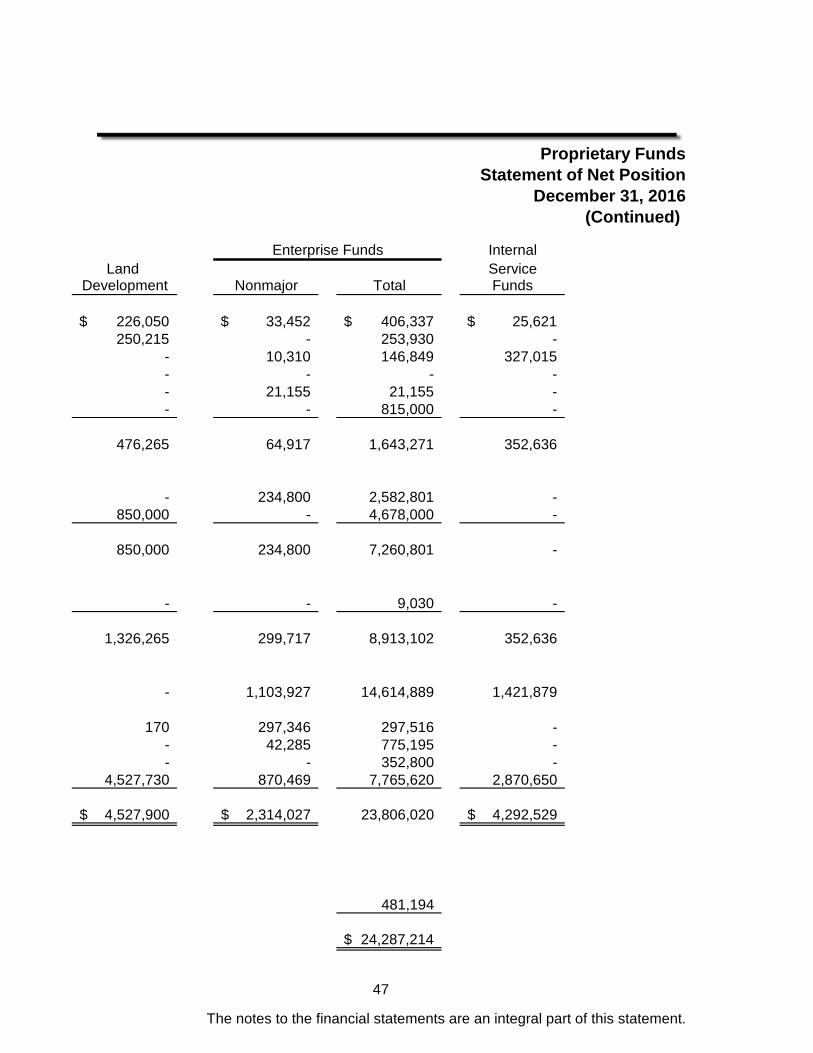
InternalLand Service
Development Nonmajor Total Funds
226,050$ 33,452$ 406,337$ 25,621$ 250,215 - 253,930 -
- 10,310 146,849 327,015 - - - - - 21,155 21,155 - - - 815,000 -
476,265 64,917 1,643,271 352,636
- 234,800 2,582,801 - 850,000 - 4,678,000 -
850,000 234,800 7,260,801 -
- - 9,030 -
1,326,265 299,717 8,913,102 352,636
- 1,103,927 14,614,889 1,421,879
170 297,346 297,516 - - 42,285 775,195 - - - 352,800 -
4,527,730 870,469 7,765,620 2,870,650
4,527,900$ 2,314,027$ 23,806,020 4,292,529$
481,194
24,287,214$
The notes to the financial statements are an integral part of this statement.
Enterprise Funds
47
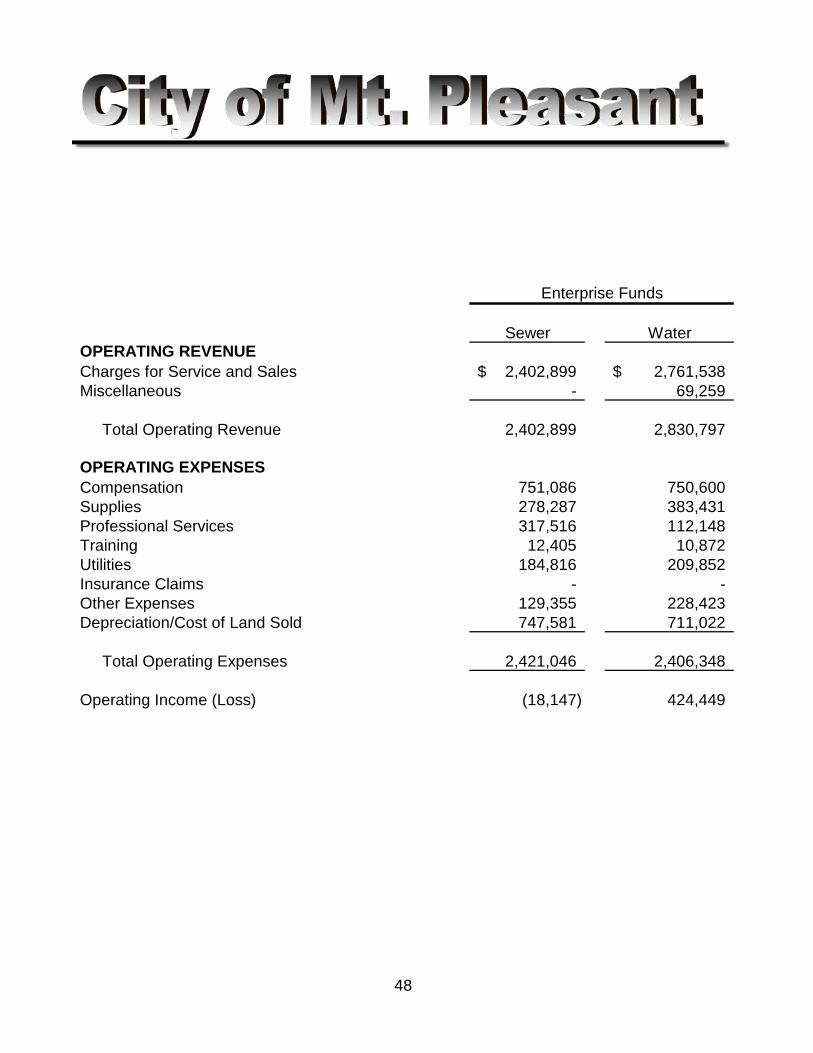
Sewer WaterOPERATING REVENUECharges for Service and Sales 2,402,899$ 2,761,538$ Miscellaneous - 69,259
Total Operating Revenue 2,402,899 2,830,797
OPERATING EXPENSESCompensation 751,086 750,600 Supplies 278,287 383,431 Professional Services 317,516 112,148 Training 12,405 10,872 Utilities 184,816 209,852 Insurance Claims - - Other Expenses 129,355 228,423 Depreciation/Cost of Land Sold 747,581 711,022
Total Operating Expenses 2,421,046 2,406,348
Operating Income (Loss) (18,147) 424,449
Enterprise Funds
48

Proprietary FundsStatement of Revenue, Expenses, and
Changes in Net PositionYear ended December 31, 2016
InternalLand Service
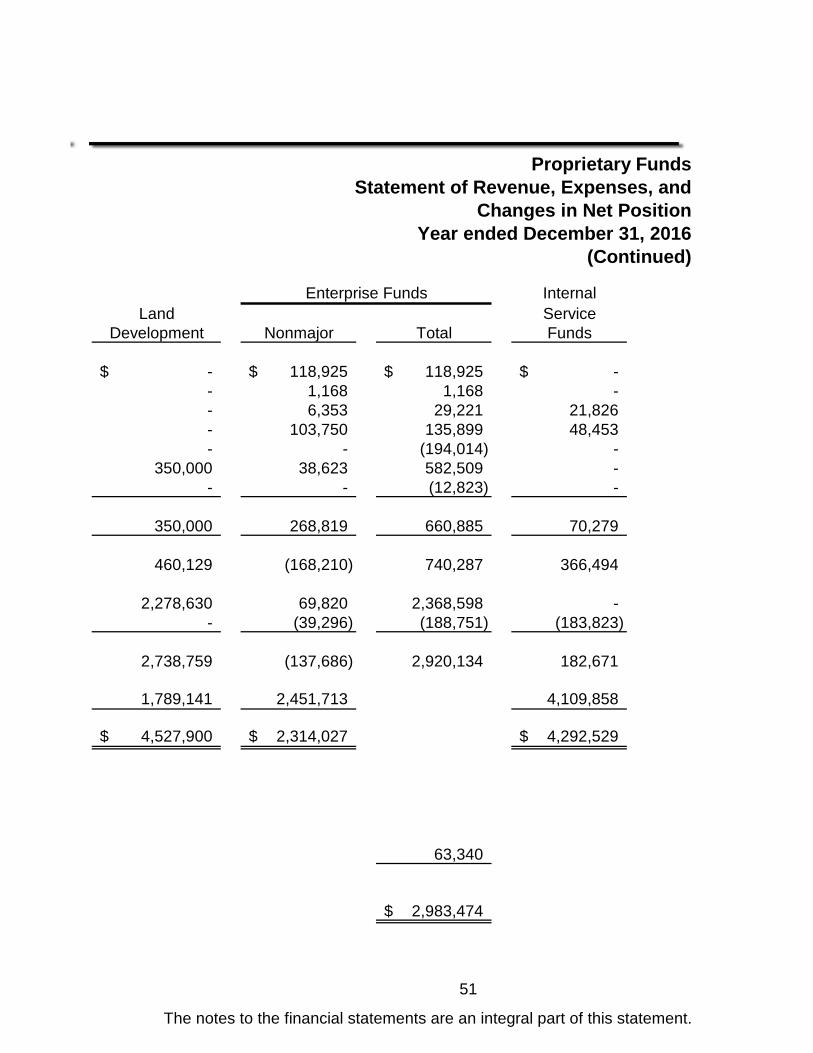
Development Nonmajor Total Funds
143,021$ 588,860$ 5,896,318$ 2,925,346$ - - 69,259 -
143,021 588,860 5,965,577 2,925,346
2,671 250,443 1,754,800 109,268 256 255,482 917,456 122,239
2,583 397,669 829,916 427,689 - - 23,277 - - 26,312 420,980 25,577 - - - 1,653,219
1,088 - 358,866 42,523 26,294 95,983 1,580,880 248,616
32,892 1,025,889 5,886,175 2,629,131
110,129 (437,029) 79,402 296,215
The notes to the financial statements are an integral part of this statement.
Enterprise Funds
49
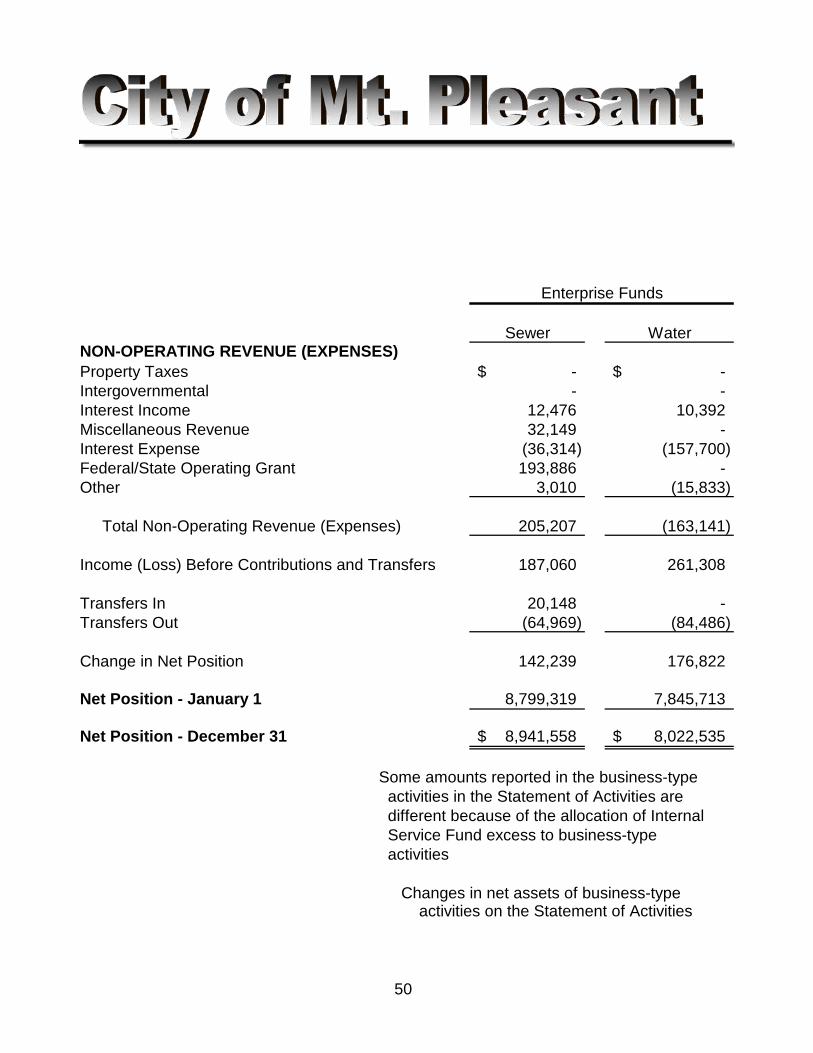
Sewer WaterNON-OPERATING REVENUE (EXPENSES)Property Taxes -$ -$ Intergovernmental - - Interest Income 12,476 10,392 Miscellaneous Revenue 32,149 - Interest Expense (36,314) (157,700) Federal/State Operating Grant 193,886 - Other 3,010 (15,833)
Total Non-Operating Revenue (Expenses) 205,207 (163,141)
Income (Loss) Before Contributions and Transfers 187,060 261,308
Transfers In 20,148 - Transfers Out (64,969) (84,486)
Change in Net Position 142,239 176,822
Net Position - January 1 8,799,319 7,845,713
Net Position - December 31 8,941,558$ 8,022,535$
Some amounts reported in the business-type activities in the Statement of Activities are different because of the allocation of Internal Service Fund excess to business-type activities
Changes in net assets of business-type activities on the Statement of Activities
50
Enterprise Funds
Proprietary FundsStatement of Revenue, Expenses, and
Changes in Net PositionYear ended December 31, 2016
(Continued)
InternalLand Service
Development Nonmajor Total Funds
-$ 118,925$ 118,925$ -$ - 1,168 1,168 - - 6,353 29,221 21,826 - 103,750 135,899 48,453 - - (194,014) -
350,000 38,623 582,509 - - - (12,823) -
350,000 268,819 660,885 70,279
460,129 (168,210) 740,287 366,494
2,278,630 69,820 2,368,598 - - (39,296) (188,751) (183,823)
2,738,759 (137,686) 2,920,134 182,671
1,789,141 2,451,713 4,109,858
4,527,900$ 2,314,027$ 4,292,529$
63,340
2,983,474$
The notes to the financial statements are an integral part of this statement.
51
Enterprise Funds
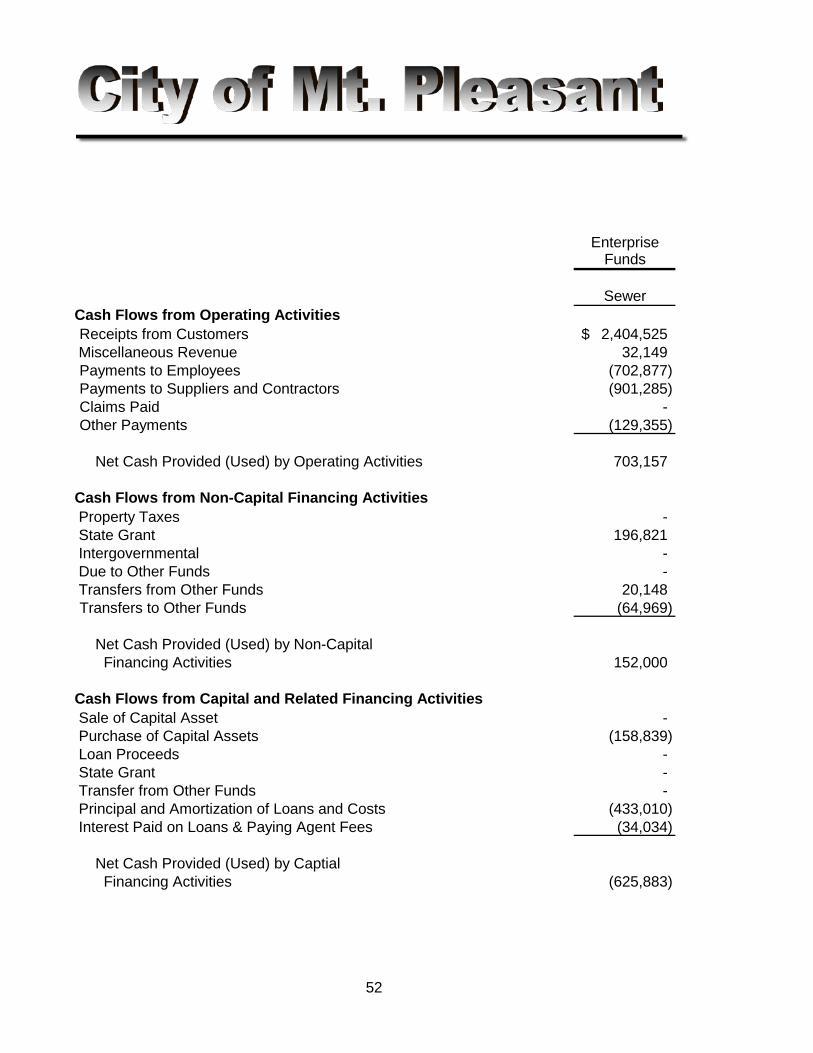
EnterpriseFunds
SewerCash Flows from Operating ActivitiesReceipts from Customers 2,404,525$
Miscellaneous Revenue 32,149 Payments to Employees (702,877) Payments to Suppliers and Contractors (901,285) Claims Paid - Other Payments (129,355)
Net Cash Provided (Used) by Operating Activities 703,157
Cash Flows from Non-Capital Financing Activities Property Taxes - State Grant 196,821 Intergovernmental - Due to Other Funds - Transfers from Other Funds 20,148 Transfers to Other Funds (64,969)
Net Cash Provided (Used) by Non-Capital Financing Activities 152,000
Cash Flows from Capital and Related Financing Activities Sale of Capital Asset - Purchase of Capital Assets (158,839) Loan Proceeds - State Grant - Transfer from Other Funds - Principal and Amortization of Loans and Costs (433,010) Interest Paid on Loans & Paying Agent Fees (34,034)
Net Cash Provided (Used) by Captial Financing Activities (625,883)
52
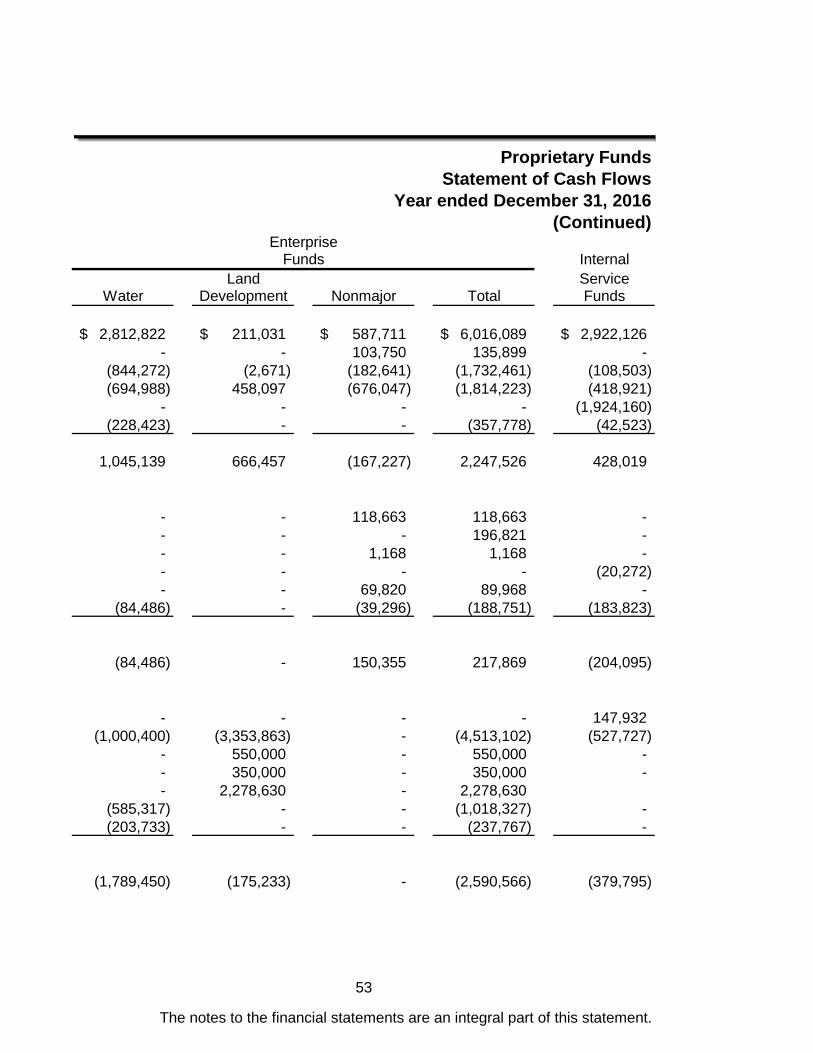
Proprietary FundsStatement of Cash Flows
Year ended December 31, 2016(Continued)
InternalLand Service
Water Development Nonmajor Total Funds
2,812,822$ 211,031$ 587,711$ 6,016,089$ 2,922,126$ - - 103,750 135,899 -
(844,272) (2,671) (182,641) (1,732,461) (108,503) (694,988) 458,097 (676,047) (1,814,223) (418,921)
- - - - (1,924,160) (228,423) - - (357,778) (42,523)
1,045,139 666,457 (167,227) 2,247,526 428,019
- - 118,663 118,663 - - - - 196,821 - - - 1,168 1,168 - - - - - (20,272) - - 69,820 89,968 -
(84,486) - (39,296) (188,751) (183,823)
(84,486) - 150,355 217,869 (204,095)
- - - - 147,932 (1,000,400) (3,353,863) - (4,513,102) (527,727)
- 550,000 - 550,000 - - 350,000 - 350,000 - - 2,278,630 - 2,278,630
(585,317) - - (1,018,327) - (203,733) - - (237,767) -
(1,789,450) (175,233) - (2,590,566) (379,795)
The notes to the financial statements are an integral part of this statement.
EnterpriseFunds
53
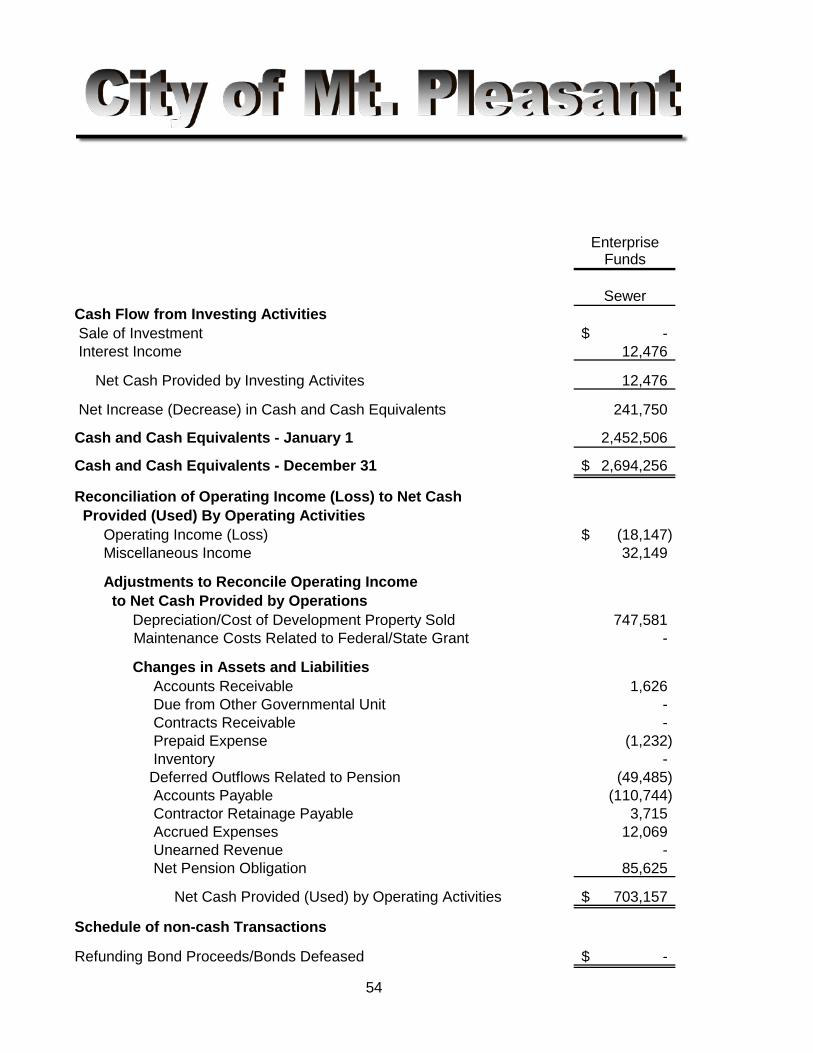
EnterpriseFunds
SewerCash Flow from Investing Activities Sale of Investment -$ Interest Income 12,476 Net Cash Provided by Investing Activites 12,476
Net Increase (Decrease) in Cash and Cash Equivalents 241,750
Cash and Cash Equivalents - January 1 2,452,506
Cash and Cash Equivalents - December 31 2,694,256$
Reconciliation of Operating Income (Loss) to Net Cash Provided (Used) By Operating Activities Operating Income (Loss) (18,147)$ Miscellaneous Income 32,149
Adjustments to Reconcile Operating Income to Net Cash Provided by Operations Depreciation/Cost of Development Property Sold 747,581 Maintenance Costs Related to Federal/State Grant -
Changes in Assets and Liabilities Accounts Receivable 1,626 Due from Other Governmental Unit - Contracts Receivable - Prepaid Expense (1,232) Inventory - Deferred Outflows Related to Pension (49,485) Accounts Payable (110,744) Contractor Retainage Payable 3,715 Accrued Expenses 12,069 Unearned Revenue - Net Pension Obligation 85,625
Net Cash Provided (Used) by Operating Activities 703,157$
Schedule of non-cash Transactions
Refunding Bond Proceeds/Bonds Defeased -$
54
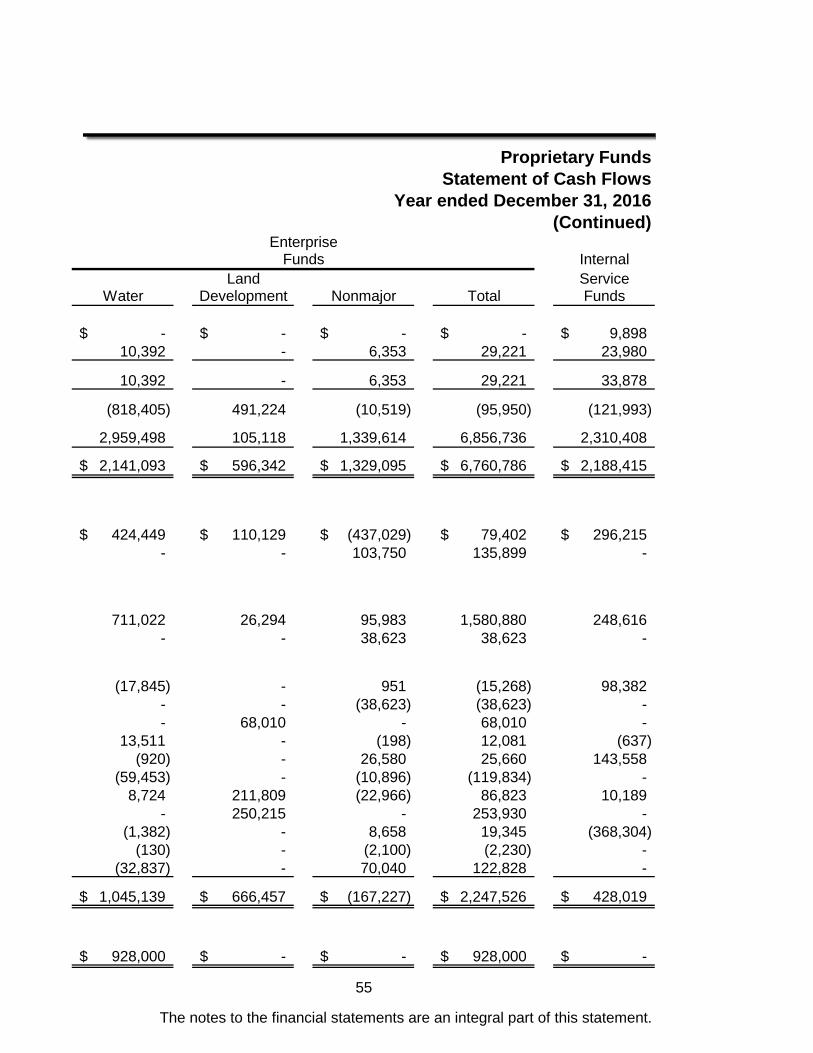
Proprietary FundsStatement of Cash Flows
Year ended December 31, 2016(Continued)
InternalLand Service
Water Development Nonmajor Total Funds
-$ -$ -$ -$ 9,898$ 10,392 - 6,353 29,221 23,980
10,392 - 6,353 29,221 33,878
(818,405) 491,224 (10,519) (95,950) (121,993)
2,959,498 105,118 1,339,614 6,856,736 2,310,408
2,141,093$ 596,342$ 1,329,095$ 6,760,786$ 2,188,415$
424,449$ 110,129$ (437,029)$ 79,402$ 296,215$ - - 103,750 135,899 -
711,022 26,294 95,983 1,580,880 248,616 - - 38,623 38,623 -
(17,845) - 951 (15,268) 98,382 - - (38,623) (38,623) - - 68,010 - 68,010 -
13,511 - (198) 12,081 (637) (920) - 26,580 25,660 143,558
(59,453) - (10,896) (119,834) - 8,724 211,809 (22,966) 86,823 10,189
- 250,215 - 253,930 - (1,382) - 8,658 19,345 (368,304)
(130) - (2,100) (2,230) - (32,837) - 70,040 122,828 -
1,045,139$ 666,457$ (167,227)$ 2,247,526$ 428,019$
928,000$ -$ -$ 928,000$ -$
The notes to the financial statements are an integral part of this statement.
55
FundsEnterprise
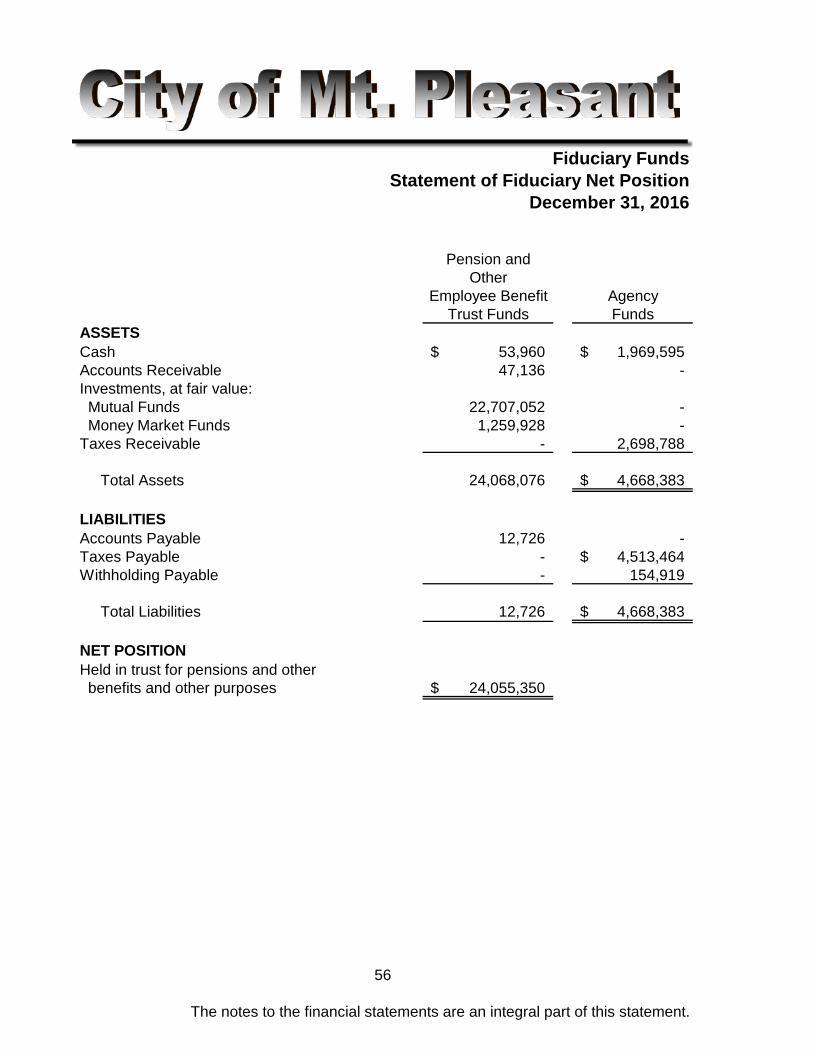
Fiduciary FundsStatement of Fiduciary Net Position
December 31, 2016
Pension andOther
Employee Benefit AgencyTrust Funds Funds
ASSETSCash 53,960$ 1,969,595$ Accounts Receivable 47,136 - Investments, at fair value: Mutual Funds 22,707,052 - Money Market Funds 1,259,928 - Taxes Receivable - 2,698,788 Total Assets 24,068,076 4,668,383$
LIABILITIESAccounts Payable 12,726 - Taxes Payable - 4,513,464$ Withholding Payable - 154,919
Total Liabilities 12,726 4,668,383$
NET POSITIONHeld in trust for pensions and other benefits and other purposes 24,055,350$
56
The notes to the financial statements are an integral part of this statement.

Fiduciary FundsStatement of Changes in Fiduciary Net Position
Year ended December 31, 2016
Pension andOther
Employee BenefitTrust Funds
ADDITIONSContributions Employer 733,657$ Employee 163,227
Total Contributions 896,884
Investment Income Net increase in fair value of investments 897,654 Interest 1,636 Dividends 996,564
Total Investment Income 1,895,854
Total Additions 2,792,738
DEDUCTIONSBenefit payments 1,423,459 Administration expense 32,205
Total Deductions 1,455,664
CHANGE IN NET POSITION 1,337,074
NET POSITION- JANUARY 1 22,718,276
NET POSITION - DECEMBER 31 24,055,350$
The notes to the financial statements are an integral part of this statement.
57
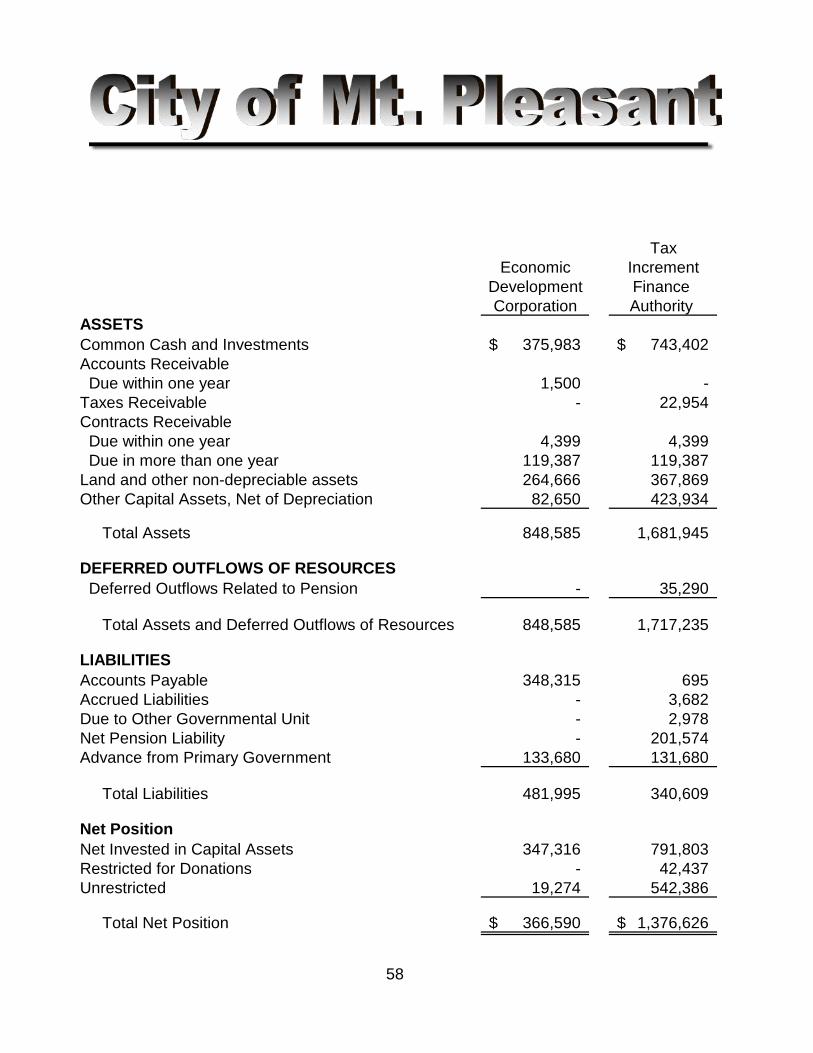
TaxEconomic Increment
Development Finance Corporation Authority
ASSETSCommon Cash and Investments 375,983$ 743,402$ Accounts Receivable Due within one year 1,500 - Taxes Receivable - 22,954 Contracts Receivable Due within one year 4,399 4,399 Due in more than one year 119,387 119,387 Land and other non-depreciable assets 264,666 367,869 Other Capital Assets, Net of Depreciation 82,650 423,934
Total Assets 848,585 1,681,945
DEFERRED OUTFLOWS OF RESOURCES Deferred Outflows Related to Pension - 35,290
Total Assets and Deferred Outflows of Resources 848,585 1,717,235
LIABILITIESAccounts Payable 348,315 695 Accrued Liabilities - 3,682 Due to Other Governmental Unit - 2,978 Net Pension Liability - 201,574 Advance from Primary Government 133,680 131,680
Total Liabilities 481,995 340,609
Net PositionNet Invested in Capital Assets 347,316 791,803 Restricted for Donations - 42,437 Unrestricted 19,274 542,386
Total Net Position 366,590$ 1,376,626$
58
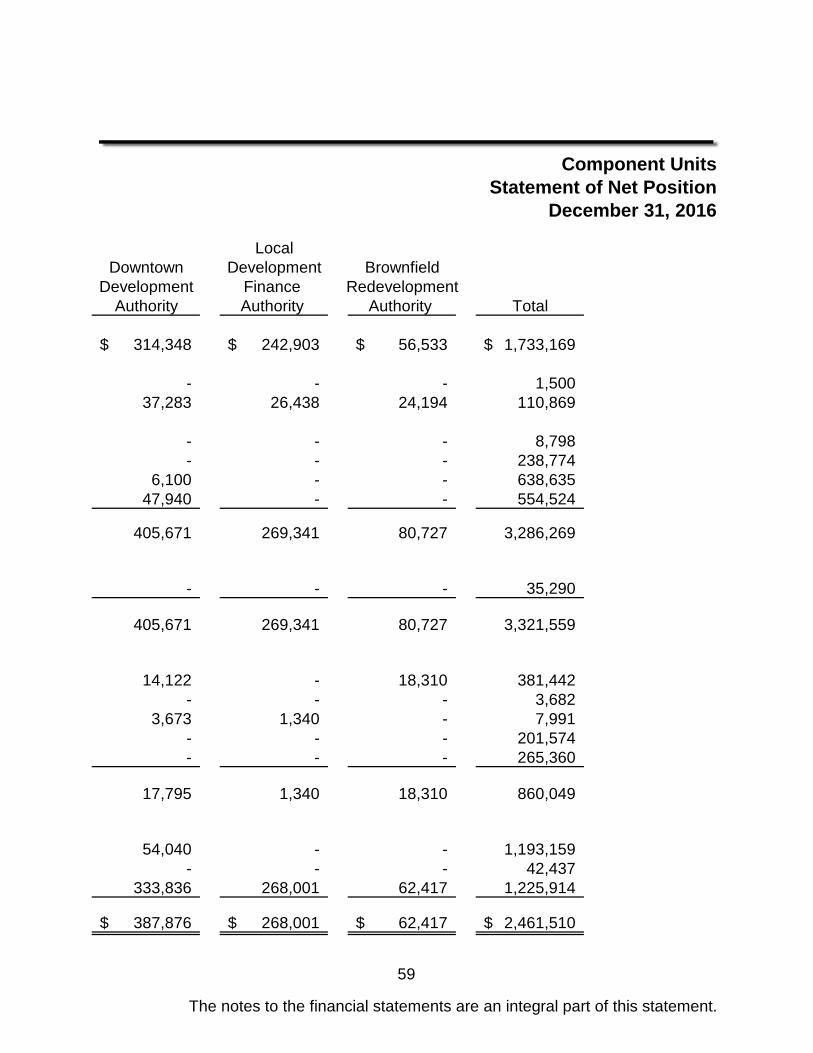
Component UnitsStatement of Net Position
December 31, 2016
LocalDowntown Development Brownfield
Development Finance RedevelopmentAuthority Authority Authority Total
314,348$ 242,903$ 56,533$ 1,733,169$
- - - 1,500 37,283 26,438 24,194 110,869
- - - 8,798 - - - 238,774
6,100 - - 638,635 47,940 - - 554,524
405,671 269,341 80,727 3,286,269
- - - 35,290
405,671 269,341 80,727 3,321,559
14,122 - 18,310 381,442 - - - 3,682
3,673 1,340 - 7,991 - - - 201,574 - - - 265,360
17,795 1,340 18,310 860,049
54,040 - - 1,193,159 - - - 42,437
333,836 268,001 62,417 1,225,914
387,876$ 268,001$ 62,417$ 2,461,510$
The notes to the financial statements are an integral part of this statement.
59
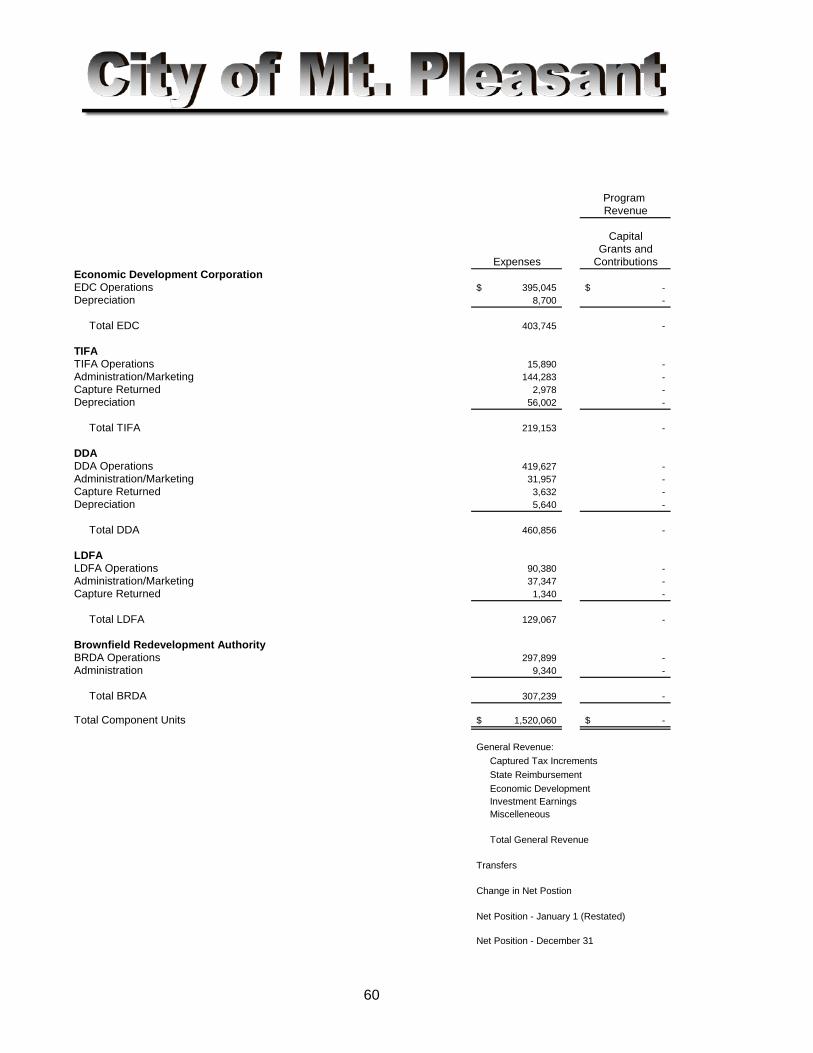
Program Revenue
CapitalGrants and
Expenses ContributionsEconomic Development CorporationEDC Operations 395,045$ -$ Depreciation 8,700 -
Total EDC 403,745 -
TIFATIFA Operations 15,890 - Administration/Marketing 144,283 - Capture Returned 2,978 - Depreciation 56,002 -
Total TIFA 219,153 -
DDADDA Operations 419,627 - Administration/Marketing 31,957 - Capture Returned 3,632 - Depreciation 5,640 -
Total DDA 460,856 -
LDFALDFA Operations 90,380 - Administration/Marketing 37,347 - Capture Returned 1,340 -
Total LDFA 129,067 -
Brownfield Redevelopment AuthorityBRDA Operations 297,899 - Administration 9,340 -
Total BRDA 307,239 -
Total Component Units 1,520,060$ -$
General Revenue: Captured Tax Increments State Reimbursement Economic Development Investment Earnings Miscelleneous
Total General Revenue
Transfers
Change in Net Postion
Net Position - January 1 (Restated)
Net Position - December 31
60
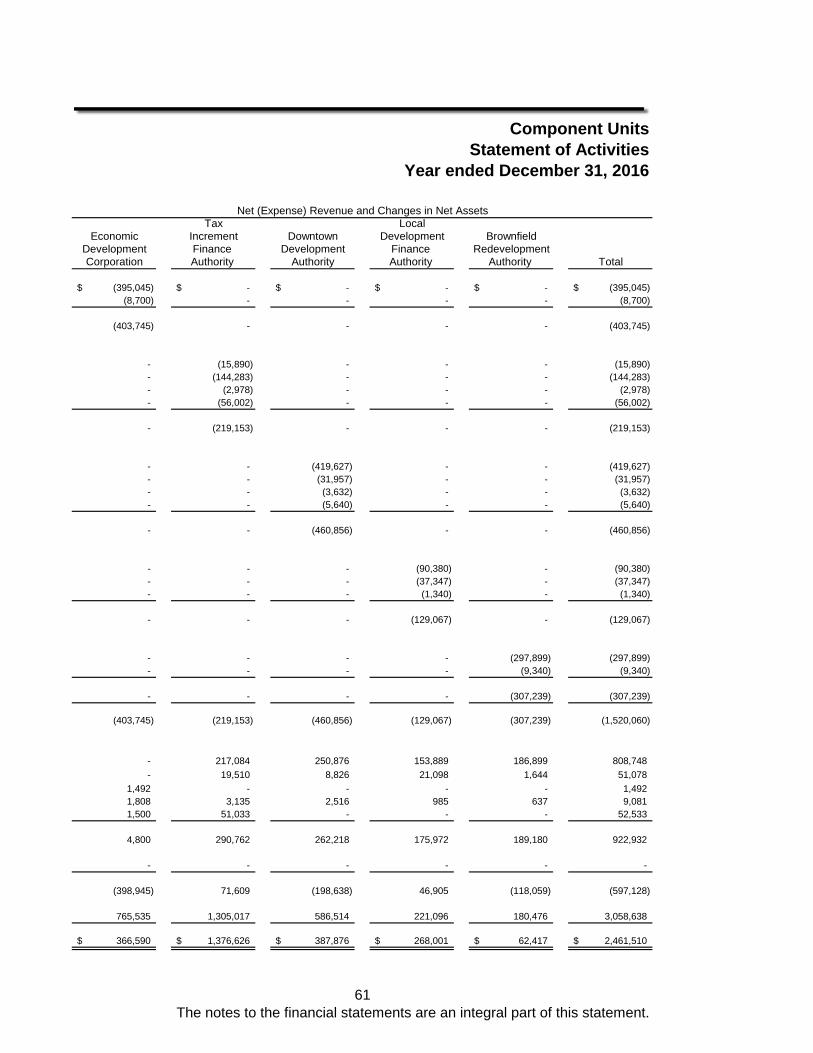
Component UnitsStatement of Activities
Year ended December 31, 2016
Tax LocalEconomic Increment Downtown Development Brownfield
Development Finance Development Finance RedevelopmentCorporation Authority Authority Authority Authority Total
(395,045)$ -$ -$ -$ -$ (395,045)$ (8,700) - - - - (8,700)
(403,745) - - - - (403,745)
- (15,890) - - - (15,890) - (144,283) - - - (144,283) - (2,978) - - - (2,978) - (56,002) - - - (56,002)
- (219,153) - - - (219,153)
- - (419,627) - - (419,627) - - (31,957) - - (31,957) - - (3,632) - - (3,632) - - (5,640) - - (5,640)
- - (460,856) - - (460,856)
- - - (90,380) - (90,380) - - - (37,347) - (37,347) - - - (1,340) - (1,340)
- - - (129,067) - (129,067)
- - - - (297,899) (297,899) - - - - (9,340) (9,340)
- - - - (307,239) (307,239)
(403,745) (219,153) (460,856) (129,067) (307,239) (1,520,060)
- 217,084 250,876 153,889 186,899 808,748 - 19,510 8,826 21,098 1,644 51,078
1,492 - - - - 1,492 1,808 3,135 2,516 985 637 9,081 1,500 51,033 - - - 52,533
4,800 290,762 262,218 175,972 189,180 922,932
- - - - - -
(398,945) 71,609 (198,638) 46,905 (118,059) (597,128)
765,535 1,305,017 586,514 221,096 180,476 3,058,638
366,590$ 1,376,626$ 387,876$ 268,001$ 62,417$ 2,461,510$
The notes to the financial statements are an integral part of this statement.
Net (Expense) Revenue and Changes in Net Assets
61

62
Index to Notes to Financial Statements Year Ended December 31, 2016
Note Title Page Number
1 Summary of Significant Accounting Policies A. Reporting Entity 65-66 B. Government-wide and Fund Financial Statements 66 C. Measurement Focus, Basis of Accounting and Financial Statement Presentation 67-70 D. Assets, Liabilities, and Net Position or Equity 70-73 E. Pension 74
2 Stewardship, Compliance and Accountability 74
3 Deposits and Investments A. Deposits and Investments 75-77 B. Deposits and Investments – Pension Trust Funds 77-79 C. Fair Value Measurement 79
4 Receivables and Payables 80
5 Interfund Receivable, Payables and Transfers A. Advance To/From Primary Government 81 B. Interfund Transfers Reported in the Fund Statements 82
6 Capital Assets A. Governmental Activities 83 B. Business-type Activities 84 C. Component Units 85 D. Depreciation Expense 86
7 Long-Term Debt A. Governmental Activities 87 B. Business-type Activities 88 C. Debt Service Requirements 89 D. Conduit Debt Obligation 89 E. Pledged Revenues 89 F. Refunding Bonds 90
63
Index to Notes to Financial Statements Year Ended December 31, 2016
Note Title Page Number
8 Restricted Net Position 91
9 Risk Management A. Property/Liability 92 B. Medical Claims 92 C. Schedule of Claims 92
10 Post-Employment Benefits A. Employer Paid Healthcare 93-96 B. Other Post Employment Benefits 96-97 C. Actuarial Assumptions 98
11 Employee Retirement Systems A. Municipal Employees Retirement System of Michigan 99-104 B. City of Mt. Pleasant Fire and Police Pension System 104-110
12 Joint Venture 111
13 Contingencies A. Grants 111 B. Litigation 111
14 Committed Fund Equity 111
15 Assigned Fund Equity 112
16 Tax Abatements 112
64
Notes to Financial Statements Year Ended December 31, 2016
NOTE 1 – SUMMARY OF SIGNIFICANT ACCOUNTING POLICIES The financial statements of the City of Mt. Pleasant have been prepared in conformity with generally accepted accounting principles (GAAP) in the United States of America as applied to governmental units. The Governmental Accounting Standards Board (GASB) is the accepted standard-setting body for establishing governmental accounting and financial reporting principles. A. Reporting Entity The City is organized under Michigan’s Comprehensive Home Rule City Act. A seven member City Commission is the governing body elected by the community at large. The City Commission selects a Mayor from its members and appoints a City Manager. Discretely Presented Component Units - The following component units are reported in a separate column in the government-wide financial statements to emphasize that they are legally separate from the City. They are the Tax Increment Financing Authority (TIFA), Downtown Development Authority (DDA), Local Development Finance Authority (LDFA), Economic Development Corporation (EDC) and Brownfield Redevelopment Authority (BRDA). The members of the LDFA are all appointed by the City Commission. The LDFA is responsible for the creation and promotion of the Center for Applied Research and Technology. The budget and expenditures of the LDFA must be approved by the City Commission. The members of the TIFA and DDA boards are the same and are all appointed by the City Commission. The members of the EDC and BRDA boards are the same and are all appointed by the City Commission. The City is responsible for compliance with federal grants, if any, received in conjunction with the TIFA/DDA projects. The City Commission must approve the budget and expenditures of the TIFA/DDA/BRDA. The EDC was established to hold title to land purchased in the City for economic development. The Project Plan for the EDC requires that all proceeds from the sale of these lands be returned to the City. All of the component units have separately issued financial statements that are available at the City Treasurer’s office in City Hall.
65
Notes to Financial Statements Year Ended December 31, 2016
NOTE 1 – SUMMARY OF SIGNIFICANT ACCOUNTING POLICIES (CONTINUED) A. Reporting Entity (Continued) Blended Component Unit - The Building Authority is blended with the Special Revenue funds in the governmental financial statements, because it provides service to the City only. The members of the Building Authority are all appointed by the City Commission. The Building Authority is responsible for the debt associated with the Department of Public Safety building renovation and expansion. The budget of the Building Authority must be approved by the City Commission. The general fund of the City of Mt. Pleasant pays the Building Authority annual rent equal to the amount of debt service for the year. The debt was paid off in 2016 and the building was deeded to the City of Mt. Pleasant. B. Government-wide and Fund Financial Statements The government-wide financial statements (i.e. the Statement of Net Position and the Statement of Changes in Net Position) report information on all of the nonfiduciary activities of the primary government and its component units. For the most part, the effect of interfund activities has been removed from these statements. Governmental activities, normally supported by taxes and intergovernmental revenues, are reported separately from business-type activities, which rely to a significant extent on fees and charges for support. Likewise, the primary government is reported separately from certain legally separate component units for which the primary government is financially accountable. The Statement of Activities demonstrates the degree to which the direct expenses of a given function or segment is offset by program revenue. Direct expenses are those that are clearly identifiable with a specific function or segment. Program revenue include: (1) charges to customers or applicants who purchase, use or directly benefit from goods, services, or privileges provided by a given function or segment; and (2) grants and contributions that are restricted to meeting the operational or capital requirements of a particular function or segment. Taxes and other items properly excluded from program revenue are reported as general revenue. Separate financial statements are provided for governmental funds, proprietary funds, and fiduciary funds, even though the latter are excluded from the government-wide financial statements. Major individual governmental funds and the major enterprise funds are reported in separate columns in the fund financial statements.
66
Notes to Financial Statements Year Ended December 31, 2016
NOTE 1 – SUMMARY OF SIGNIFICANT ACCOUNTING POLICIES (CONTINUED) C. Measurement Focus, Basis of Accounting and Financial Statement Presentation The government-wide financial statements are reported using the economic resources measurement focus and the accrual basis of accounting, as are the proprietary fund and fiduciary fund financial statements, except for agency funds, which do not have a measurement focus. Revenue is recorded when earned and expenses are recorded when a liability is incurred, regardless of the timing of related cash flows. Property taxes are recognized as revenue in the year for which they are levied. Grants and similar items are recognized as revenue as soon as all eligibility requirements imposed by the provider have been met. Governmental fund financial statements are reported using the current financial resources measurement focus and the modified accrual basis of accounting. Revenue is recognized as soon as it is both measurable and available. Revenue is considered to be available if it is collected within the current period or soon enough thereafter to pay liabilities of the current period. For this purpose, the government considers revenue to be available if it is collected within 60 days of the end of the current fiscal period except for reimbursement based grants and interest which use a one-year collection period. The period used for property taxes is through the settlement process in March since all delinquent real property taxes are purchased and collected by the county at that time. Expenditures generally are recorded when a liability is incurred, as under accrual accounting. However, debt service expenditures, expenditures relating to compensated absences, claims and judgments and net pension liability are recorded only when payment is due. Property taxes, franchise taxes, licenses, grants, state shared revenue, and interest associated with the current fiscal period are all considered to be susceptible to accrual and so have been recognized as revenue of the current fiscal period. Only the portion of special assessments and contracts receivable due within the current fiscal period is considered to be susceptible to accrual as revenue of the current period. All other revenue items are considered to be measurable and available only when cash is received by the government.
67
Notes to Financial Statements Year Ended December 31, 2016
NOTE 1 – SUMMARY OF SIGNIFICANT ACCOUNTING POLICIES (CONTINUED) C. Measurement Focus, Basis of Accounting and Financial Statement Presentation (Continued) City property taxes are levied and become an enforceable lien on property as of July 1. Taxes are due without penalty until July 31. After July 31, delinquent taxes are collected including a penalty of 1% per month. These summer tax bills include the City’s own property taxes and taxes billed on behalf of the school district, District Library and the County. Real property taxes not collected as of March 1 are turned over to Isabella County for collection. The County advances the City 100% of the balance outstanding for the delinquent real taxes and special assessments. Collection of delinquent personal property taxes remains the responsibility of the City Treasurer. Property taxes levied in July of each year are recognized as revenue in that year. Delinquent taxes due from taxpayers at year end to be advanced by the County at the March settlement are recorded as receivables and current year revenue. The City reports the following major governmental funds:
• The General Fund is the government’s primary operating fund. It accounts for all financial resources of the general government, except those required to be accounted for in another fund.
• Major and Local Streets are used to account for the receipt and expenditures of state
shared gas and weight taxes under P.A. 1951, as amended. The City reports the following major enterprise funds:
• The Sewer Fund accounts for the cost of collecting and treating waste water.
• The Water Fund accounts for the costs of providing water services to City residents and businesses.
• The Land Development Fund accounts for the land purchased and improved for future development.
68
Notes to Financial Statements Year Ended December 31, 2016
NOTE 1 – SUMMARY OF SIGNIFICANT ACCOUNTING POLICIES (CONTINUED) C. Measurement Focus, Basis of Accounting and Financial Statement Presentation (Continued) Additionally, the government reports the following fund types:
• Special revenue funds account for specific revenues that are legally restricted to expenditure for particular purposes.
• Debt service funds account for resources accumulated and payments made for principal and interest on long-term general obligation debt of governmental funds.
• Capital project funds are used to account for the resources and expenditures for major capital acquisition and construction.
• Enterprise funds are used to account for business type activities where the cost of providing the services is covered through fees and charges.
• Internal service funds account for major machinery and equipment purchases and maintenance, as well as the City’s Self Insurance activities for medical and liability coverage.
• The pension and other retiree benefits trust fund accounts for the activities of the police and fire employees retirement system which accumulates resources for pension benefit payments to qualified police and fire employees and for medical benefits provided to qualified police employees during retirement.
• Agency funds account for monies collected on behalf of other agencies that are later disbursed to them, including property tax collections and imprest payroll.
As a general rule, the effect of interfund activity has been eliminated from the government-wide financial statements. Exceptions to this general rule are charges between the government’s water and sewer function and various other functions of the government. Eliminations of these charges would distort the direct costs and program revenue reported for the various functions concerned.
69
Notes to Financial Statements Year Ended December 31, 2016
NOTE 1 – SUMMARY OF SIGNIFICANT ACCOUNTING POLICIES (CONTINUED) C. Measurement Focus, Basis of Accounting and Financial Statement Presentation (Continued) Amounts reported as program revenue include: (1) charges to customers or applicants for goods, services or privileges provided; (2) operating grants and contributions; and (3) capital grants and contributions, including special assessments. Internally dedicated resources are reported as general revenue rather than as program revenue. Likewise, general revenue includes all taxes. Proprietary funds distinguish operating revenue and expenses from nonoperating items. Operating revenue and expenses generally result from providing services and producing and delivering goods in connection with a proprietary fund’s principal ongoing operations. The principal operating revenue of our proprietary funds relate to charges to customers for sales and services. The water and sewer fund also recognizes the portion of tap fees intended to recover current costs (e.g., labor and materials to hook up new customers) as operating revenue. Operating expenses for proprietary funds include the cost of sales and services, administrative expenses, and depreciation on capital assets. All revenue and expenses not meeting this definition are reported as non-operating revenue and expenses. D. Assets, Liabilities, and Net Position or Equity Cash and Investments – Cash and investments include cash on hand, demand deposits, and short–term investments with a maturity of three months or less when acquired. Additionally, each fund’s equity in the City’s common cash and investment pool is treated as a cash equivalent because the funds can deposit or effectively withdraw cash at any time without prior notice or penalty. Shared pooled investment income is allocated to each fund based on its percentage of the balance in the pool. Investments, including pension funds, are stated at fair value (quoted market price or the best available estimate). Receivables and Payables – In general, outstanding balances between funds are reported as “due to/from other funds.” Activity between funds that is representative of lending/borrowing arrangements outstanding at the end of the fiscal year is referred to as “advances to/from other funds.” Any residual balances outstanding between the governmental activities and the business-type activities are reported in the government-wide financial statements as “internal balances.”
70
Notes to Financial Statements Year Ended December 31, 2016
NOTE 1 – SUMMARY OF SIGNIFICANT ACCOUNTING POLICIES (CONTINUED) D. Assets, Liabilities, and Net Position or Equity (Continued) Inventories and Prepaid Items – Inventories are valued at cost, on a first-in, first-out basis. Inventories of governmental funds are recorded as expenditures when purchased rather than when consumed. Inventory in governmental funds at year end is considered immaterial. Certain payments to vendors reflect costs applicable to future fiscal years and are recorded as prepaid items in both government-wide and fund financial statements. Restricted Assets – The revenue bonds of the enterprise funds require amounts to be set aside for construction, debt service principal and interest, operations and maintenance, and a bond reserve. These amounts have been classified as restricted assets. Capital Assets – Capital assets, which include property, plant, equipment, art and infrastructure assets (e.g., roads, bridges, sidewalks, and similar items) are reported in the applicable governmental or business-type activities column in the government-wide financial statements. Capital assets are defined by the City as assets with an initial individual cost of more than $5,000 and an estimated useful life in excess of two years. Such assets are recorded at historical cost or estimated historical cost if purchased or constructed. Donated capital assets are valued at acquisition value (the price that would be paid to acquire an asset with an equivalent service potential in an orderly market transaction) on the date received. Property, plant and equipment is depreciated using the straight-line method over the following useful lives: Buildings 30 years Building Improvements 30 years Water and Sewer Lines 30 years Roads 40 years Other Infrastructure 15 to 50 years Vehicles 2 to 30 years Office Equipment 5 to 10 years Computer Software 3 to 5 years
Land Improvements 15 years
71
Notes to Financial Statements Year Ended December 31, 2016
NOTE 1 – SUMMARY OF SIGNIFICANT ACCOUNTING POLICIES (CONTINUED) D. Assets, Liabilities, and Net Position or Equity (Continued) Deferred Outflows/Inflows of Resources – In addition to assets, the statement of financial position has a separate section for deferred outflows of resources. This section represents a consumption of net position that applies to future periods and so will not be recognized as an outflow of resources (expense) until then. The City only has two items that qualifies for reporting in this category. One is the deferred charge on refunding reported in the government-wide statement of net position. A deferred charge on refunding results from the difference in the carrying value of refunded debt and its requisition price. This amount is deferred and amortized over the life of the bonds. The second item reported in this category is related to the net pension liability which is discussed in Note 11. In addition to liabilities, the statement of financial position and governmental fund balance sheet has a separate section for deferred inflows of resources. On the statement of net position, this section represents an acquisition of net position that applies to a future period and so will not be recognized as an inflow of resources (revenue) until that time. In addition to the deferred inflow from refunding bonds as explained above, the City has one item, which arises only under a modified accrual basis of accounting, that qualifies for reporting in this category. Accordingly the item, unavailable revenue, is reported only in the governmental funds balance sheet. The governmental funds report unavailable revenues from two sources: long-term contracts and special assessments. These amounts are recognized as inflow of resources in the period that they become available. Compensated Absences (Vacation and Sick Leave) – The City’s policy allows employees to accumulate earned but unused sick and vacation pay benefits. The government-wide and proprietary statements accrue all vacation benefits as they are earned and sick pay as it is used or vested whichever is earlier. The vacation pay for all employees and sick pay due to employees eligible for retirement for governmental funds represents a reconciling item between fund and government-wide presentations. Since the benefit has not matured, for example, as a result of employee resignations or retirements, it is not considered a liability in the governmental funds. Long-Term Obligations – In the government-wide financial statements and the proprietary fund types in the fund financial statements, long-term debt and other long-term obligations are reported as liabilities in the applicable governmental activities, business-type activities, or proprietary fund type statement of net position. For new bond issuances after the implementation of GASB #34, bond premiums and deferred charges on refundings are deferred and amortized over the life of the bonds using the straight-line method which approximates the effective interest method.
72
Notes to Financial Statements Year Ended December 31, 2016
NOTE 1 – SUMMARY OF SIGNIFICANT ACCOUNTING POLICIES (CONTINUED) D. Assets, Liabilities, and Net Position or Equity (Continued) Net Position and Fund Balance Reporting – Governmental funds report fund balance in the following five categories:
1. Non-spendable - the related asset’s form does not allow expenditure of the balance. The assets are either (a) not in a spendable form or (b) legally or contractually required to be maintained intact. Nonspendable fund balance would be equal to inventory, prepaid items, non-current financial assets, and the nonspendable portion of endowments.
2. Restricted - the related assets can only be spent for the specific purposes stipulated by constitution, external resource providers, or as identified in enabling legislation.
3. Committed - the related assets can only be spent for a specific purpose identified by formal action of the governing board’s highest level of decision-making authority. The governing board can, by adoption of an ordinance prior to the end of the fiscal year, commit fund balance or rescind or modify a prior commitment of fund balance.
4. Assigned - the related assets can only be spent for a specific purpose identified by management as authorized by the governing board.
5. Unassigned - is the residual classification and includes all spendable amounts not contained in the other classifications. The general fund is the only fund that reports a positive unassigned fund balance. In other governmental funds it is not appropriate to report a positive unassigned fund balance.
In accordance with the Fund Balance Policy adopted by the City Commission, the City Finance Director has the authority to assign fund balance for the current year budget items that need to be reappropriated in the following year. When both restricted and unrestricted resources are available for use, it is the government’s policy to use restricted resources first, then unrestricted resources as they are needed.
It is the City’s policy to consider restricted fund balance to have been depleted before using any of the components of unrestricted fund balance. Further, when the components of unrestricted fund balance can be used for the same purpose, committed fund balance is depleted first, followed by assigned fund balance. Unassigned fund balance is applied last.
73
Notes to Financial Statements Year Ended December 31, 2016
NOTE 1 – SUMMARY OF SIGNIFICANT ACCOUNTING POLICIES (CONTINUED) E. Pensions For purposes of measuring the net pension liability, deferred outflows of resources and deferred inflows of resources related to pensions, and pension expense; information about the fiduciary net position of the Retirement Systems and additions to/deductions from fiduciary net position have been determined on the same basis as they are reported by the Retirement Systems. For this purpose, benefit payments (including refunds of employee contributions) are recognized when due and payable in accordance with the benefit terms. Investments are reported at fair value. NOTE 2 – STEWARDSHIP, COMPLIANCE AND ACCOUNTABILITY The budget is adopted in accordance with Public Act 493. In accordance with this Act, budgets are adopted on an annual basis for General and Special Revenue funds. Informational Summaries are adopted for Capital Projects, Debt Service and Proprietary Funds as a management control device. The budgets for all funds are adopted on a basis consistent with accounting principles generally accepted in the United States of America. Budgets were adopted for the following funds that don’t meet the GASB #54 criteria for separate financial reporting: Parks & Recreation, Special Assessment and Community Development Block Grant. These funds have been combined with the General Fund in the Governmental Financial statements. The budget and approved appropriations lapse at the end of the fiscal year. The City does not formally record encumbrances in the accounting records during the year as a normal practice, and no outstanding encumbrances exist at December 31, 2016. The budget is adopted with legal budgetary control at the fund level (i.e., expenditures may not exceed budgeted appropriations at the fund level), except for the General Fund, which is adopted at the division level. General Fund expenditures cannot exceed the budgeted appropriations at the division level. The division level is an aggregation of various departments within the General Fund. The City Manager and the Finance Director are authorized to transfer budgeted amounts within a division; however, any revisions that alter the total expenditures of any division in the General Fund or fund total for all other funds require approval of the City Commission and passage of a resolution. The City made supplemental appropriations. All expenditures were less than the budgeted amounts at the legal level of budgetary control except the Major Street – Special Revenue Fund was over budget $39,203.
74
Notes to Financial Statements Year Ended December 31, 2016
NOTE 3 - DEPOSITS AND INVESTMENTS A. Deposits and Investments Following is a reconciliation of deposit and investment balances (including both pooled cash and investments as well as pension trust fund balances, see Note 3-B) as of December 31, 2016: Statement of Net Position Cash and Investments: Primary Government $ 17,920,232 Component Unit 1,733,169 Statement of Fiduciary Net Position Pension trust funds: Cash 53,960 Investments 23,966,980 Agency Fund: Cash 1,969,595 Total $ 45,643,936 Deposits and Investments Bank Deposits: Checking/Savings Accounts $ 5,610,923 Certificates of Deposits 202,816 Insured Cash Sweep 9,555,283 Money Market Accounts 2,514,657 Investments in Securities and Mutual Funds: Pooled Investments 50,405 Pension and OPEB Investments 22,707,052 Government Agencies 5,000,000 Cash on Hand 2,800 Total $ 45,643,936
75
Notes to Financial Statements Year Ended December 31, 2016
NOTE 3 - DEPOSITS AND INVESTMENTS A. Deposits and Investments (Continued) As of December 31, 2016 the City had the following investments and maturities. .
Investment Maturities Fair Less Than More Than Investment Type Value 1 Year 1 Year Government Agencies $ 5,000,000 $ - $ 5,000,000 The city chooses to disclose its pooled investments by specifically identifying each. As of year end, the City had the following pooled investments.
Carrying Amount Credit (Fair Value) Rating Mutual and cash management funds $ 50,405 AAAm (MBIA Class) Interest Rate Risk. Public Act 196 of 1997 limits the allowable investments and the maturities of some of the allowable investments. The City’s investment policy does not have specific limits in excess of state law on investment maturities as a means of managing its exposure to fair value losses arising from increasing interest rates. Credit Risk. Public Act 196 of 1997 authorizes the City to deposit and invest in bonds, securities and other obligations of the United States, or any agency or instrumentality of the United States, in accounts of a financial institution, commercial paper with specific maximum maturities and ratings when purchased, repurchase agreements, bankers acceptances of United States banks, obligations of the State of Michigan or any of its political subdivisions, mutual funds composed of investment vehicles that are legal for direct investment by a public corporation and investments in Michigan government pools. The City’s investment policy does not have specific limits in excess of state law on investment credit risk. Credit risk ratings, where applicable, are above the allowable level for each investment. The Government agencies are debt of corporations established by the United States Government. $5,000,000 of government agencies are rated AA+.
76
Notes to Financial Statements Year Ended December 31, 2016
NOTE 3 - DEPOSITS AND INVESTMENTS (CONTINUED) A. Deposits and Investments (Continued) Custodial Credit Risk – Deposits. Custodial credit risk is the risk that in the event of a bank failure, the City’s deposits may not be returned. State law does not require and the City does not have a policy for deposit credit risk. As of year-end, $6,806,103 of the City’s bank balance of $18,295,101 was exposed to custodial credit risk because it was uninsured and uncollateralized. The City’s investment policy does not specifically address this risk, although the City believes that due to the dollar amounts of cash deposits and the limits of FDIC insurance, it is impractical to insure all bank deposits. The City analyzes the financial condition of the banks. The City only invests with those institutions with an acceptable estimated risk level for depositories and certificates of deposit. Custodial Credit Risk – Investments. For an investment, custodial credit risk is the risk that, in the event of the failure of the counterparty, the City will not be able to recover the value of its investments or collateral securities that are in the possession of an outside party. State law does not require a policy for investment custodial credit risk. To minimize custodial credit risk, the City investment policy requires all brokered investments be held in safekeeping by a third party safekeeping company. Of the above pooled/mutual fund investments the City’s custodial credit risk exposure cannot be determined because the pooled/mutual funds do not consist of specifically identifiable securities. Concentration of Credit Risk. State law limits allowable investments but does not limit concentration of credit risk as identified in the list of authorized investments. The City’s investment policy does not have specific limits in excess of state law on concentration of credit risk. B. Deposits and Investments – Pension and OPEB Trust Funds The deposits and investments of the City’s pension and OPEB trust funds are maintained separately from the City’s pooled cash and investments, and are subject to separate investment policies and state statutes. Accordingly, the required disclosures for the pension deposits and investments are presented separately. Deposits - The pension trust funds do not maintain any checking or other demand/time deposit accounts. Amounts reported as cash and investments and other cash in the statement of net position are composed entirely of short-term investments in money market accounts. These money market accounts are not rated.
77

Notes to Financial Statements Year Ended December 31, 2016
NOTE 3 - DEPOSITS AND INVESTMENTS (CONTINUED) B. Deposits and Investments – Pension and OPEB Trust Funds (Continued) Investments – The Michigan Public Employees Retirement Systems’ Investment Act, Public Act 314 of 1965, as amended, authorizes the pension trust funds to invest in stocks, government and corporate securities, mortgages, real estate, and various other investment instruments, subject to certain limitations. The retirement boards have the responsibility and authority to oversee the investment portfolio. All investment decisions are subject to Michigan law and the investment policy established by the retirement boards. The investments of each pension trust fund are held in a bank-administered trust fund. Following is a summary of pension investments as of December 31, 2016: Police and Fire Police Retiree
Pension Fund Health Care Fund Total Investments at fair value, as determined by quoted market value Domestic Bond Mutual Funds $ 3,847,738 $ 196,509 $ 4,044,247 Domestic Equity Mutual Funds 15,558,187 850,855 16,409,042 Foreign Equity Mutual Funds 2,121,803 131,960 2,253,763 Total Investments $ 21,527,728 $ 1,179,324 $ 22,707,052 Credit Risk. The Fire and Police Pension and Police Retiree Health Care board’s investment policy provide that safety is the foremost objective of the investment program. To achieve this objective, the board invests predominately in mutual funds. Before purchasing mutual funds the board reviews the prospectus for the fund, the rating of the money manager and the beta for the fund. The mutual fund investments are not rated for credit risk. Interest Rate Risk. Public Act 314 of 1965, authorizes the pension trust fund investments in various interest bearing investments. The Fire and Police Pension and Police Retiree Health Care board has chosen to use mutual funds for this type of investment to help mitigate interest rate risk. Approximately 41% of the bond mutual funds are invested in short term (0-3 year maturities), 54% intermediate (4-10 years) and 0% long term (10+ years). Foreign Currency Risk - The investment policy of the Fire and Police Pension and Police Retiree Health Care Board is silent regarding foreign currency risk. Management believes the City’s exposure to foreign currency risk from its position in Foreign Equity Mutual funds is minimal.
78
Notes to Financial Statements Year Ended December 31, 2016
NOTE 3 - DEPOSITS AND INVESTMENTS (CONTINUED) B. Deposits and Investments – Pension and OPEB Trust Funds (Continued) Custodial Credit Risk. For investments, custodial credit risk is the risk that, in the event of the failure of the counterparty, the City will not be able to recover its value of its investments or collateral securities that are in possession of an outside party. The City’s pension and retiree health investment procedure is that all securities be held in trust by a third-party institution in the name of the pension or retiree health fund. The custodial credit risk of the mutual funds cannot be determined because the funds do not consist of specifically identifiable securities. Concentration of Credit Risk. The Michigan Public Employees Retirement Systems’ Investment Act, Public Act 314 of 1965, as amended, provides that the pension and retiree health funds hold no more than 5% of it’s portfolio in one company and that it owns no more than 5% of the value of any company. These requirements have been met. The City’s pension and retiree health care fund’s policies require that the investments be diversified but does not specify a percentage of dollar amounts per issuer. The investment philosophy of the pension fund does require diversification in various equity categories and does specify a percentage or dollar amount. C. Fair Value Measurement
The City has the following recurring fair value measurements as of year-end:
• The City’s Pension and OPEB trust funds investments of domestic bond mutual funds, domestic equity mutual funds, and foreign equity mutual funds are valued using quoted market prices (Level 1 inputs).
• The City’s government agencies are valued using a pricing model utilizing observable fair value measures of fund/pool investments and other observable inputs to determining the fair value of the securities making up the of investments fund/pool (Level 2 inputs).
• The City does not have any investments that report fair value based on significant
unobservable inputs (Level 3 inputs).
79
Notes to Financial Statements Year Ended December 31, 2016
NOTE 4 – RECEIVABLES AND PAYABLES Receivables as of year-end in the aggregate, are as follows: Governmental Business-type Component
Activities Activities Units Taxes $ 385,726 $ 4,925 $ 110,869 Special Assessments 145,932 - - Accounts 145,771 707,093 1,500 Other Post Employment Benefits 66,138 - - Interest 10,685 - - Contracts Receivable - 40 247,572 Advance To Component Unit 265,360 - - Intergovernmental 1,276,743 38,623 - Total Receivables $ 2,296,355 $ 750,681 $ 359,941 Of the $385,726 Taxes Receivable, $10,132 is not expected to be collected in one year. Of the $145,932 Special Assessments, $116,773 is not expected to be collected in one year. All of the other post-employment benefit is not expected to be collected in one year. The entire Advance to Component Unit is not expected to be collected in one year. Of the $247,572 Contracts Receivable - Component Unit $238,774 is not expected to be collected in one year. Accounts payable and other liabilities as of year-end in the aggregate, are as follows: Governmental Business-type Component Activities Activities Units Accounts $ 410,590 $ 406,337 $ 381,442 Contractor Retainage 64,417 253,930 - Compensated Absences 701,577 71,894 - Post Employment Benefits 1,306,151 - - Accrued Liabilities 475,734 28,685 3,682 Accrued Interest 4,417 46,270 - Advance to Primary Government - - 265,360 Intergovernmental 276,380 - 7,991 $ 3,239,266 $ 807,116 $658,475 Of the $701,577 of Compensated Absences, $288,603 is not expected to be paid in one year. All of the Post-Employment Benefits is not expected to be paid in one year. The entire Advance from Primary Government is not expected to be paid in one year.
80
Notes to Financial Statements Year Ended December 31, 2016
NOTE 5 – INTERFUND RECEIVABLE, PAYABLES AND TRANSFERS The composition of interfund balances in the fund statements is as follows: A. Advance To/From Primary Government Receivable Entity Payable Entity Amount General Fund Component Unit – EDC $133,680 General Fund Component Unit – TIFA 131,680 Total General Fund $265,360 The General Fund loaned the Economic Development Corporation $150,000 and the Tax Increment Finance Authority $148,000 for the purchase of properties for economic development. The loans are being repaid as payments are made on the land contract that was entered into for the purchase of these properties by a developer.
81
Notes to Financial Statements Year Ended December 31, 2016
NOTE 5 – INTERFUND RECEIVABLE, PAYABLES AND TRANSFERS (CONTINUED) B. Interfund Transfers Reported in the Fund Statements These transfers are used to move restricted and unrestricted resources from the funds in which they are collected to the funds which have budgetary authorization for the expenditure of these balances. Fund Transferred From Fund Transferred To Amount General Fund Nonmajor Governmental Funds $417,684 Land Development Fund 2,278,630 Nonmajor Proprietary Funds 41,600 Total General Fund 2,737,914 Major Street Fund General Fund 36,990 Local Street 276,000 Nonmajor Proprietary Funds 10,350 Total Major Street Fund 323,340 Local Street Fund General Fund 45,599 Nonmajor Proprietary Funds 17,870 Total Local Street Fund 63,469 Nonmajor Governmental Funds General Fund 444,578
Local Street Fund 100,000
Total Nonmajor Governmental Funds 544,578 Sewer Fund General Fund 64,969 Water Fund General Fund 84,486 Nonmajor Proprietary Funds General Fund 39,296 Internal Service Funds General Fund 35,464 Nonmajor Governmental Funds 3,911 Major Street Fund 58,824 Local Street Fund 65,476 Sewer Fund 20,148
Total Internal Service Funds 183,823 Total $4,041,875
82
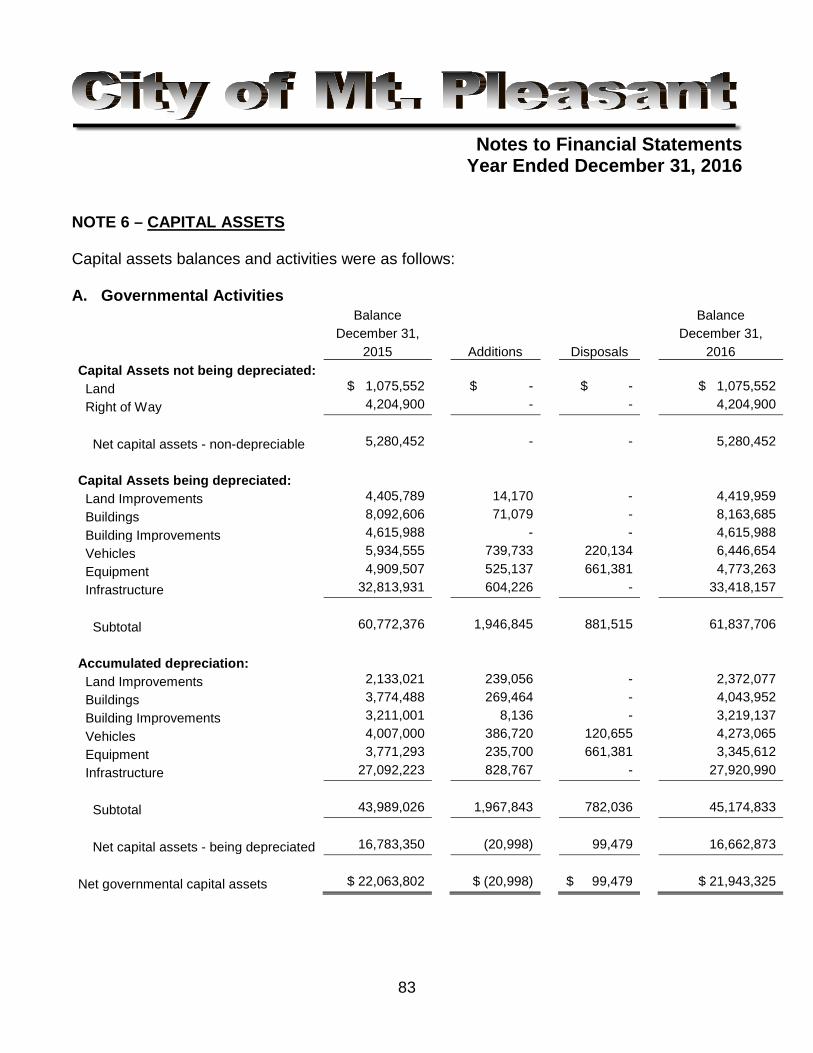
Notes to Financial Statements Year Ended December 31, 2016
NOTE 6 – CAPITAL ASSETS Capital assets balances and activities were as follows: A. Governmental Activities
Balance
Balance
December 31,
December 31,
2015
Additions
Disposals
2016
Capital Assets not being depreciated: Land $ 1,075,552 $ - $ - $ 1,075,552
Right of Way 4,204,900 - - 4,204,900
Net capital assets - non-depreciable 5,280,452 - - 5,280,452
Capital Assets being depreciated: Land Improvements 4,405,789 14,170 - 4,419,959
Buildings 8,092,606 71,079 - 8,163,685 Building Improvements 4,615,988 - - 4,615,988 Vehicles 5,934,555 739,733 220,134 6,446,654 Equipment 4,909,507 525,137 661,381 4,773,263 Infrastructure 32,813,931 604,226 - 33,418,157
Subtotal 60,772,376 1,946,845 881,515 61,837,706
Accumulated depreciation: Land Improvements 2,133,021 239,056 - 2,372,077 Buildings 3,774,488 269,464 - 4,043,952 Building Improvements 3,211,001 8,136 - 3,219,137 Vehicles 4,007,000 386,720 120,655 4,273,065 Equipment 3,771,293 235,700 661,381 3,345,612 Infrastructure 27,092,223 828,767 - 27,920,990
Subtotal 43,989,026 1,967,843 782,036 45,174,833
Net capital assets - being depreciated 16,783,350 (20,998) 99,479 16,662,873
Net governmental capital assets $ 22,063,802 $ (20,998) $ 99,479 $ 21,943,325
83
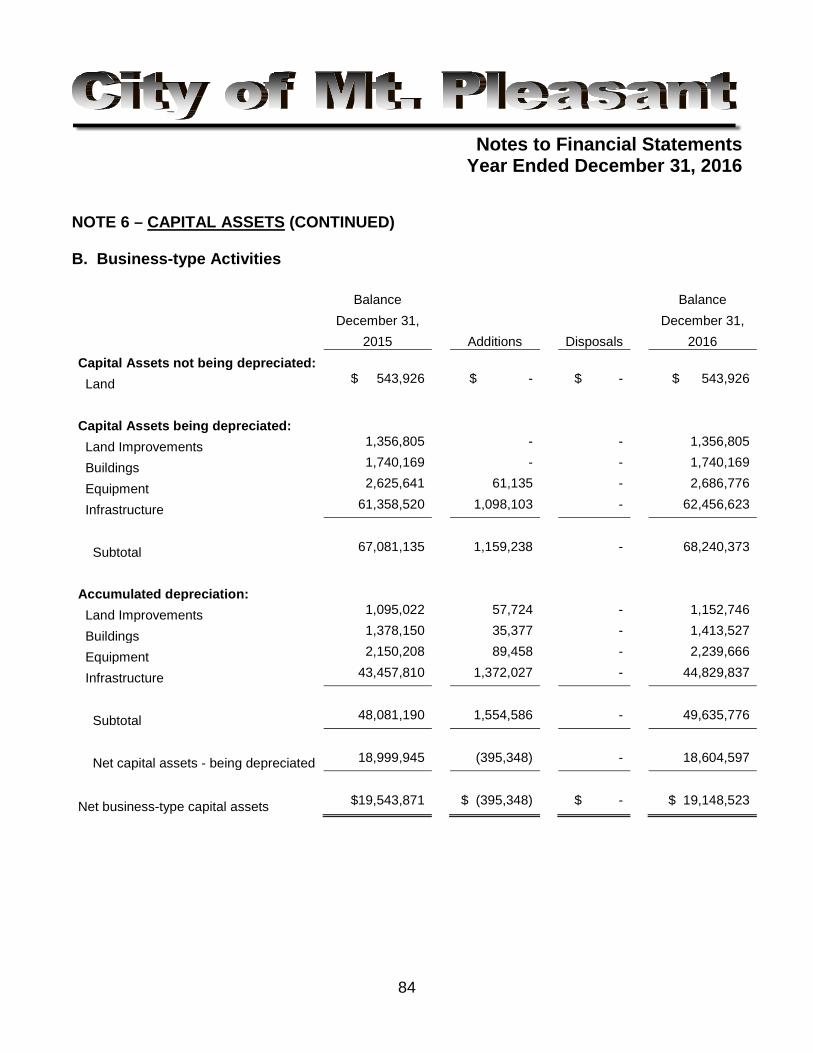
Notes to Financial Statements Year Ended December 31, 2016
NOTE 6 – CAPITAL ASSETS (CONTINUED) B. Business-type Activities
Balance
Balance
December 31,
December 31,
2015
Additions
Disposals
2016
Capital Assets not being depreciated: Land $ 543,926 $ - $ - $ 543,926
Capital Assets being depreciated: Land Improvements 1,356,805 - - 1,356,805
Buildings 1,740,169 - - 1,740,169
Equipment 2,625,641 61,135 - 2,686,776
Infrastructure 61,358,520 1,098,103 - 62,456,623
Subtotal 67,081,135 1,159,238 - 68,240,373
Accumulated depreciation: Land Improvements 1,095,022 57,724 - 1,152,746
Buildings 1,378,150 35,377 - 1,413,527
Equipment 2,150,208 89,458 - 2,239,666
Infrastructure 43,457,810 1,372,027 - 44,829,837
Subtotal 48,081,190 1,554,586 - 49,635,776
Net capital assets - being depreciated 18,999,945 (395,348) - 18,604,597
Net business-type capital assets $19,543,871 $ (395,348) $ - $ 19,148,523
84

Notes to Financial Statements Year Ended December 31, 2016
NOTE 6 – CAPITAL ASSETS (CONTINUED) C. Component Units
Balance
Balance
December 31,
December 31,
2015
Additions
Disposals
2016
Capital Assets not being depreciated: Land $ 545,767 $ - $ - $ 545,767
Art 92,868 - - 92,868
Net capital assets - non-depreciable 638,635 - - 638,635
Capital Assets being depreciated: Land Improvements 1,887,731 - - 1,887,731
Equipment 174,000 - - 174,000
Infrastructure 854,214 - - 854,214
Subtotal 2,915,945 - - 2,915,945
Accumulated depreciation: Land Improvements 1,649,661 36,387 - 1,686,048
Equipment 82,650 8,700 - 91,350
Infrastructure 558,768 25,255 - 584,023
Subtotal 2,291,079 70,342 - 2,361,421
Net capital assets - being depreciated 624,866 (70,342) - 554,524
Net component units capital assets $ 1,263,501 $ (70,342) $ - $1,193,159
85

Notes to Financial Statements Year Ended December 31, 2016
NOTE 6 – CAPITAL ASSETS (CONTINUED) D. Depreciation Expense Depreciation expense was charged to the primary government as follows: Governmental Activities: General Government $ 766,481 Public Safety 295,221 Highways, Streets & Bridges 657,525 Internal Service Fund depreciation is charged back to the various funds based on their usage of the assets 248,616 Total Governmental Activities $ 1,967,843 Business-type Activities: Sewer $ 747,581 Water 711,022 Airport 95,983 Total Business-type Activities $ 1,554,586
86
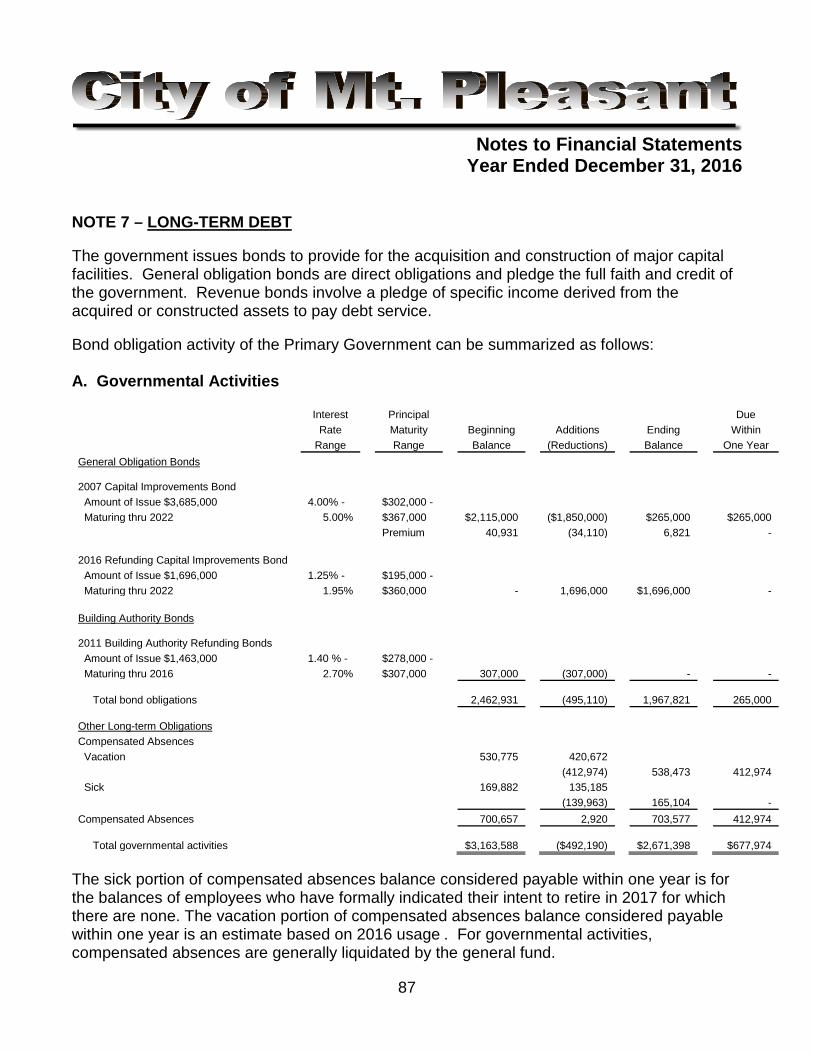
Notes to Financial Statements Year Ended December 31, 2016
NOTE 7 – LONG-TERM DEBT The government issues bonds to provide for the acquisition and construction of major capital facilities. General obligation bonds are direct obligations and pledge the full faith and credit of the government. Revenue bonds involve a pledge of specific income derived from the acquired or constructed assets to pay debt service. Bond obligation activity of the Primary Government can be summarized as follows: A. Governmental Activities
Interest
Principal
Due
Rate
Maturity
Beginning
Additions
Ending
Within
Range
Range
Balance
(Reductions)
Balance
One Year
General Obligation Bonds
2007 Capital Improvements Bond Amount of Issue $3,685,000 4.00% -
$302,000 -
Maturing thru 2022 5.00%
$367,000
$2,115,000
($1,850,000)
$265,000
$265,000
Premium
40,931
(34,110)
6,821
-
2016 Refunding Capital Improvements Bond
Amount of Issue $1,696,000 1.25% -
$195,000 - Maturing thru 2022 1.95%
$360,000
-
1,696,000
$1,696,000
-
Building Authority Bonds
2011 Building Authority Refunding Bonds
Amount of Issue $1,463,000 1.40 % -
$278,000 - Maturing thru 2016 2.70%
$307,000
307,000
(307,000)
-
-
Total bond obligations
2,462,931
(495,110)
1,967,821
265,000
Other Long-term Obligations Compensated Absences Vacation
530,775
420,672
(412,974)
538,473
412,974
Sick
169,882
135,185
(139,963)
165,104
-
Compensated Absences
700,657
2,920
703,577
412,974
Total governmental activities
$3,163,588
($492,190)
$2,671,398
$677,974 The sick portion of compensated absences balance considered payable within one year is for the balances of employees who have formally indicated their intent to retire in 2017 for which there are none. The vacation portion of compensated absences balance considered payable within one year is an estimate based on 2016 usage . For governmental activities, compensated absences are generally liquidated by the general fund.
87
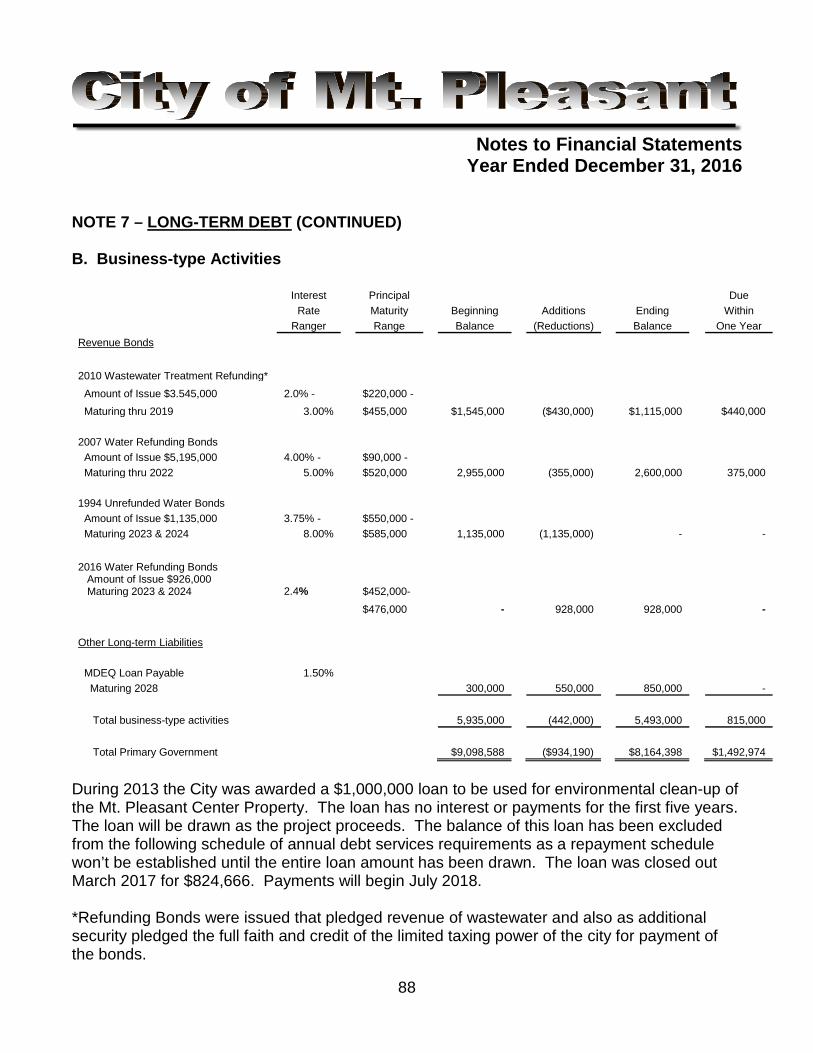
Notes to Financial Statements Year Ended December 31, 2016
NOTE 7 – LONG-TERM DEBT (CONTINUED) B. Business-type Activities
Interest
Principal
Due
Rate
Maturity
Beginning
Additions
Ending
Within
Ranger
Range
Balance
(Reductions)
Balance
One Year
Revenue Bonds
2010 Wastewater Treatment Refunding* Amount of Issue $3.545,000 2.0% - $220,000 - Maturing thru 2019 3.00%
$455,000
$1,545,000
($430,000) $1,115,000 $440,000
2007 Water Refunding Bonds Amount of Issue $5,195,000 4.00% -
$90,000 -
Maturing thru 2022 5.00%
$520,000
2,955,000
(355,000)
2,600,000
375,000
1994 Unrefunded Water Bonds Amount of Issue $1,135,000 3.75% -
$550,000 -
Maturing 2023 & 2024 8.00%
$585,000
1,135,000
(1,135,000)
-
-
2016 Water Refunding Bonds Amount of Issue $926,000 Maturing 2023 & 2024 2.4% $452,000- $476,000 - 928,000 928,000 - Other Long-term Liabilities
MDEQ Loan Payable 1.50%
Maturing 2028
300,000
550,000
850,000
-
Total business-type activities
5,935,000
(442,000)
5,493,000
815,000
Total Primary Government
$9,098,588
($934,190)
$8,164,398
$1,492,974
During 2013 the City was awarded a $1,000,000 loan to be used for environmental clean-up of the Mt. Pleasant Center Property. The loan has no interest or payments for the first five years. The loan will be drawn as the project proceeds. The balance of this loan has been excluded from the following schedule of annual debt services requirements as a repayment schedule won’t be established until the entire loan amount has been drawn. The loan was closed out March 2017 for $824,666. Payments will begin July 2018. *Refunding Bonds were issued that pledged revenue of wastewater and also as additional security pledged the full faith and credit of the limited taxing power of the city for payment of the bonds.
88

Notes to Financial Statements Year Ended December 31, 2016
NOTE 7 – LONG-TERM DEBT (CONTINUED) C. Debt Service Requirements Annual debt service requirements, excluding premium, to maturity for the above obligations is as follows:
Primary Government: Year Ended Governmental Activities Business-type Activities
December 31, Principal Interest Principal Interest 2017 265,000 31,885 815,000 169,600 2018 302,000 27,722 850,000 126,907 2019 340,000 23,947 640,000 96,425 2020 337,000 19,017 440,000 72,087 2021 350,000 13,457 450,000 53,562
2021-24 367,000 7,157 1,448,000 55,752 Total $ 1,961,000 $ 123,185 $ 4,643,000 $ 574,333
D. Conduit Debt Obligation
During 2000, the City of Mt. Pleasant issued bonds, in the amount of $2,400,000, for Crisis Center, Inc. to obtain the necessary funding to construct 40 units of low and moderate-income housing. The bonds do not constitute a charge, lien or encumbrance, legal or equitable, upon any property within the City except the housing project constructed. The bonds clearly state that under no circumstances will the City, the County, the State or any of its taxpayers or citizens ever be required to pay any of the principal or interest on the bonds, or any costs relating to the issuance thereof from any tax revenues. The outstanding balance on the debt as of December 31, 2016 is $1,214,793. E. Pledged Revenues The City has pledged future water revenues, to repay $3,528,000 in remaining water system revenue bonds issued in 1994 and partially refunded in 2007 and 2016. Proceeds from the bonds provided financing for water system improvements. The bonds are payable solely from water system revenues and are payable through 2024. Net pledged revenue was 2.06 times the annual principal and interest payments on the bonds of $513,000. Future pledged revenues are expected to exceed debt service requires with a specific coverage percentage being inestimable. The total principal and interest remaining to be paid on the bonds is approximately $4,048,746. Current year principal and interest paid for the current year and net pledged revenues were approximately $513,000 and $1,061,377, respectively.
89
Notes to Financial Statements Year Ended December 31, 2016
NOTE 7 – LONG-TERM DEBT (CONTINUED) F. 2016 Refunding Bonds 2007 Capital Improvement Bonds – On December 29, 2016, the City issued $1,605,000 in General Obligation Limited Tax Refunding Bonds with an average interest rate of 1.72% to advance refund $1,870,000 of the 2007 Capital Improvement Bonds. The maturities from 2017-2022 was refunded. These maturities had interest rates of 4.0-5.0%. The new debt reported in the Statement of Net Assets is reported net of the difference between the requisition price and the net carrying amount of $91,000. This amount is being amortized over the life of the bonds. This refunding was undertaken to reduce the total debt service payment over the next six years by $76,096.92 and resulted in an economic gain of $75,473.62. As of December 31, 2016, $1,605,000 of the outstanding bonds payable are considered defeased and are scheduled to be called and paid in full in 2017. 1994 Unrefunded Water Bonds – On December 29, 2016, the City issued $928,000 in Water System Supply Refunding Bonds with an interest rate of 2.4%. The bond proceeds plus cash of $266,600 was used to advance refund $1,135,000 of the 1994 Water Revenue Bonds. The maturities from 2023-2024 were refunded. These maturities had interest rates of 3.75-8.0%. The new debt reported in the Statement of Net Assets is reported net of the difference between the requisition price and the net carrying amount of $36,900. This amount is being amortized over the life of the bonds. This refunding was undertaken to reduce the total debt service payment over the next eight years by $378,464.27 and resulted in an economic gain of $335,919.02. As of December 31, 2016, $1,135,000 of the outstanding bonds payable are considered defeased and were called and paid in full in February of 2017.
90
Notes to Financial Statements Year Ended December 31, 2016
NOTE 8 – RESTRICTED NET POSITION Specific net position have been restricted as follows: Governmental Activities General Fund Unspent Donations $ 542,173 Major Street Unspent Donations 15,399 Unspent Act 51 1,541,769 Local Street Unspent Donations 109,458 Unspent Act 51 408,820 Other Nonmajor Governmental Funds Cemetery Ordinance Requirements 187,064 Total Governmental Activities $2,804,683 Business Type Activities Sewer Fund Ordinance Requirements $ 732,910 Water Fund Debt Service 352,800 Land Development Fund Legal Requirements - Condo Association 170 Nonmajor Proprietary Funds Unspent Donation 42,285 Legal Requirements – County Agreement 297,346 Total Business-Type Activities $ 1,425,511 Component Units Unspent Donations $ 42,437
91
Notes to Financial Statements Year Ended December 31, 2016
NOTE 9 - RISK MANAGEMENT A. Property/Liability The City is exposed to various risks related to civil suits, property protection, errors and omissions and natural disasters. The City participates in a risk pool with other local units of government in the Michigan Municipal Risk Management Authority. This self-insurance plan provides members with loss protection for property damage, general liability, automobile damage, machinery damage and errors and omissions. The City pays an annual contribution to provide for the procurement of re-insurance, risk management, underwriting, establishment of loss reserves, and other related expenses. The City also makes contributions to its member retention fund. When a claim is incurred and or paid, the individual member retention fund is charged up to the $224,000 self retention limits; individual claims in excess of $100,000 are paid by the reinsurance. The City has no obligation for payment of another member’s losses. The City carries Airport and Pollution liability insurance from a commercial carrier. There have been no reductions in insurance coverage of any type from December 31, 2016. For the past three years, settlement of insurance claims has not exceeded insurance coverage. B. Medical Claims The City provides group health insurance to its employees through a self-funded health plan. Core Source administers the plan under contractual agreement with the City. The plan is accounted for in the City’s Self Insurance Fund. The City has stop-loss insurance coverage for all claims in excess of $150,000 per individual plus corridor for first individual claim. A liability for claims incurred but not yet reported (IBNR Claims) of $170,284 has also been recorded in the Self Insurance Fund. The IBNR Claims reported consist of projected claims to be paid in 2017 based on the plan’s previous two years history. C. Schedule of Claims Property/Liability Medical 2016 2015 2016 2015 IBNR Claims Payable Beginning of Year $ 5,500 $ 29,645 $ 564,382 $ 268,701 Claims Incurred 22,620 (23,355) 1,575,896 2,912,810 Claims Paid (13,020 ) (790) (1,969,994) (2,617,129) IBNR Claims Payable End of Year $ 15,100 $ 5,500 $ 170,284 $ 564,382
92
Notes to Financial Statements Year Ended December 31, 2016
NOTE 10 – POST-EMPLOYMENT BENEFITS A. Employer Paid Healthcare In accordance with POAM and COAM union agreements, in addition to providing pension benefits, the City provides all police and command officers who were hired prior to January 2010 and who retire with Act 345 pension benefits after January 1, 2002 with paid health care benefits for the retiree only. Beginning January 1, 2003, the City established a Retiree Health Care Fund in accordance with Public Act 149 of 1999. The Retiree Health Care fund is funded by a 2% employee contribution, a transfer of excess Act 345 pension interest in accordance with Public Act 28 for the first ten years of the plan, and an employer contribution from the City. The City has chosen to fund the plan based on the actuarial valuation. The plan is reported in the Retiree Health Trust Fund. This plan does not issue a separate report. Following are the financial statements for the Retiree Health Care Trust Fund for the year ended December 31, 2016. Statement of Plan Net Position
ASSETS Other Cash $ 53,960 Accounts Receivable 10,075 Investments, at fair value: Mutual Funds 1,179,324 Money Market Funds 31,691 Total Assets 1,275,050 LIABILITIES Accounts Payable 12,726
NET POSITION Held in trust for pensions and other benefits and other purposes $ 1,262,324
93
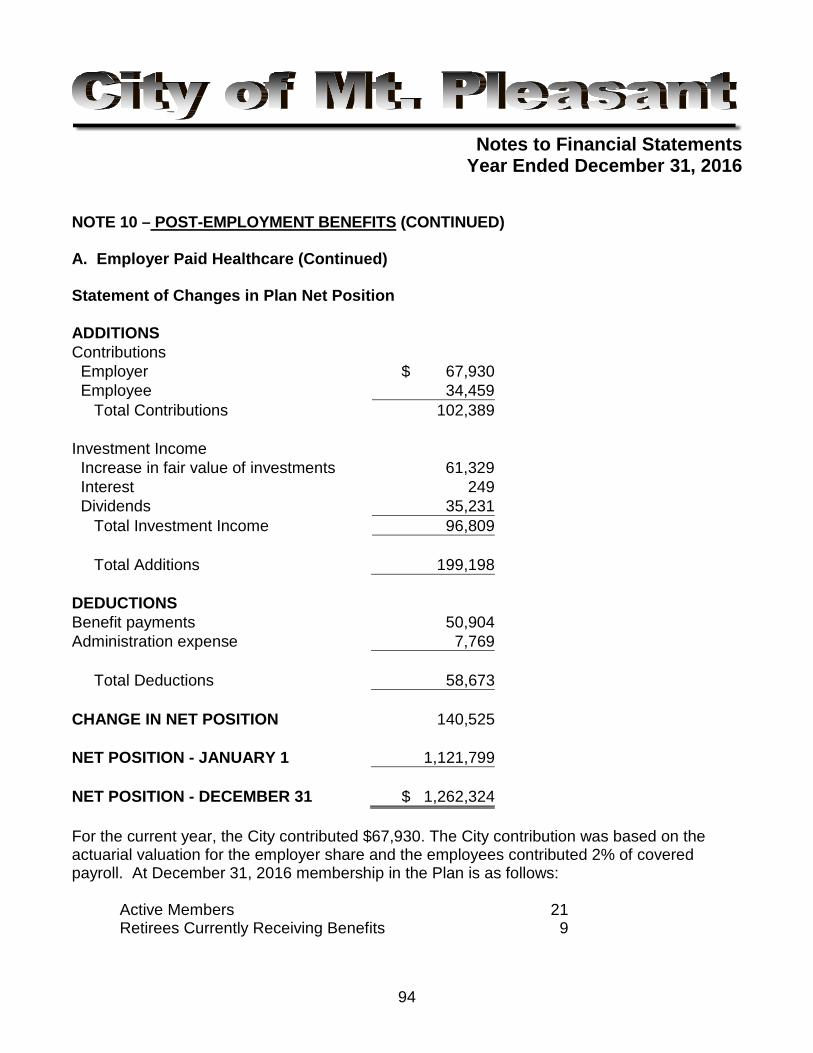
Notes to Financial Statements Year Ended December 31, 2016
NOTE 10 – POST-EMPLOYMENT BENEFITS (CONTINUED) A. Employer Paid Healthcare (Continued) Statement of Changes in Plan Net Position ADDITIONS Contributions Employer $ 67,930 Employee 34,459 Total Contributions 102,389 Investment Income Increase in fair value of investments 61,329 Interest 249 Dividends 35,231 Total Investment Income 96,809 Total Additions 199,198 DEDUCTIONS Benefit payments 50,904 Administration expense 7,769 Total Deductions 58,673 CHANGE IN NET POSITION 140,525 NET POSITION - JANUARY 1 1,121,799 NET POSITION - DECEMBER 31 $ 1,262,324 For the current year, the City contributed $67,930. The City contribution was based on the actuarial valuation for the employer share and the employees contributed 2% of covered payroll. At December 31, 2016 membership in the Plan is as follows: Active Members 21 Retirees Currently Receiving Benefits 9
94
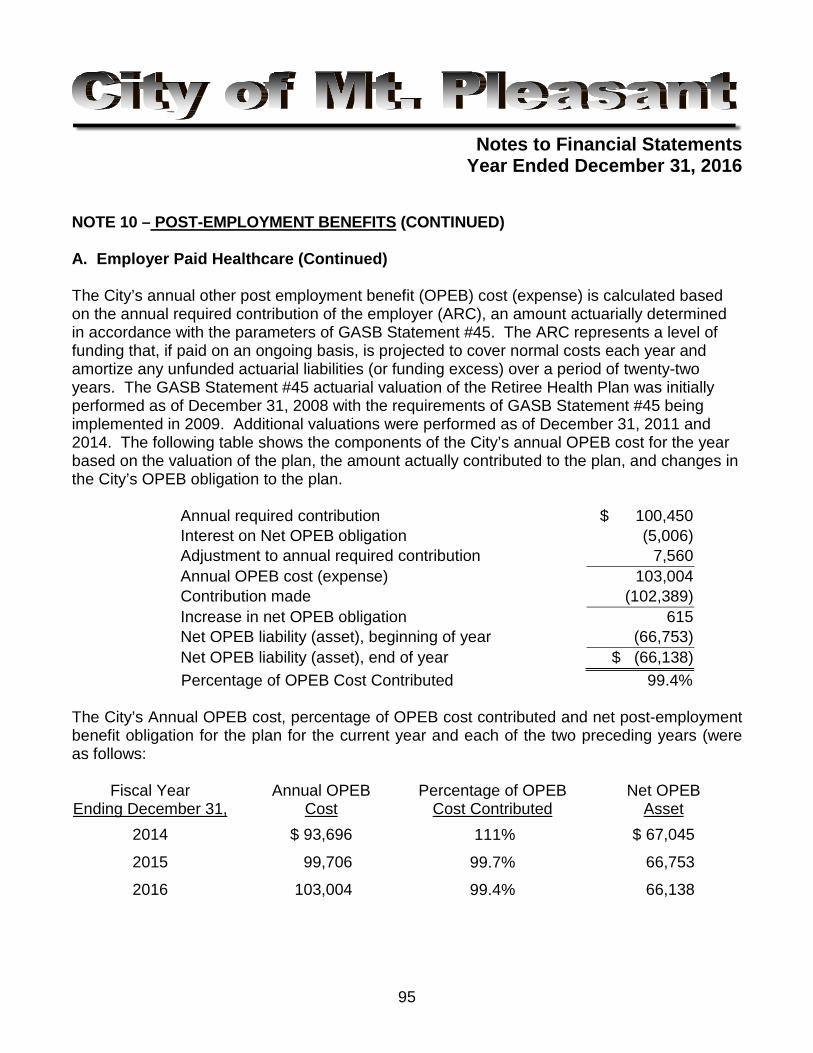
Notes to Financial Statements Year Ended December 31, 2016
NOTE 10 – POST-EMPLOYMENT BENEFITS (CONTINUED) A. Employer Paid Healthcare (Continued) The City’s annual other post employment benefit (OPEB) cost (expense) is calculated based on the annual required contribution of the employer (ARC), an amount actuarially determined in accordance with the parameters of GASB Statement #45. The ARC represents a level of funding that, if paid on an ongoing basis, is projected to cover normal costs each year and amortize any unfunded actuarial liabilities (or funding excess) over a period of twenty-two years. The GASB Statement #45 actuarial valuation of the Retiree Health Plan was initially performed as of December 31, 2008 with the requirements of GASB Statement #45 being implemented in 2009. Additional valuations were performed as of December 31, 2011 and 2014. The following table shows the components of the City’s annual OPEB cost for the year based on the valuation of the plan, the amount actually contributed to the plan, and changes in the City’s OPEB obligation to the plan. Annual required contribution $ 100,450 Interest on Net OPEB obligation (5,006) Adjustment to annual required contribution 7,560 Annual OPEB cost (expense) 103,004 Contribution made (102,389) Increase in net OPEB obligation 615 Net OPEB liability (asset), beginning of year (66,753) Net OPEB liability (asset), end of year $ (66,138) Percentage of OPEB Cost Contributed 99.4% The City’s Annual OPEB cost, percentage of OPEB cost contributed and net post-employment benefit obligation for the plan for the current year and each of the two preceding years (were as follows:
Fiscal Year Annual OPEB Percentage of OPEB Net OPEB Ending December 31, Cost Cost Contributed Asset
2014 $ 93,696 111% $ 67,045
2015 99,706 99.7% 66,753
2016 103,004 99.4% 66,138
95
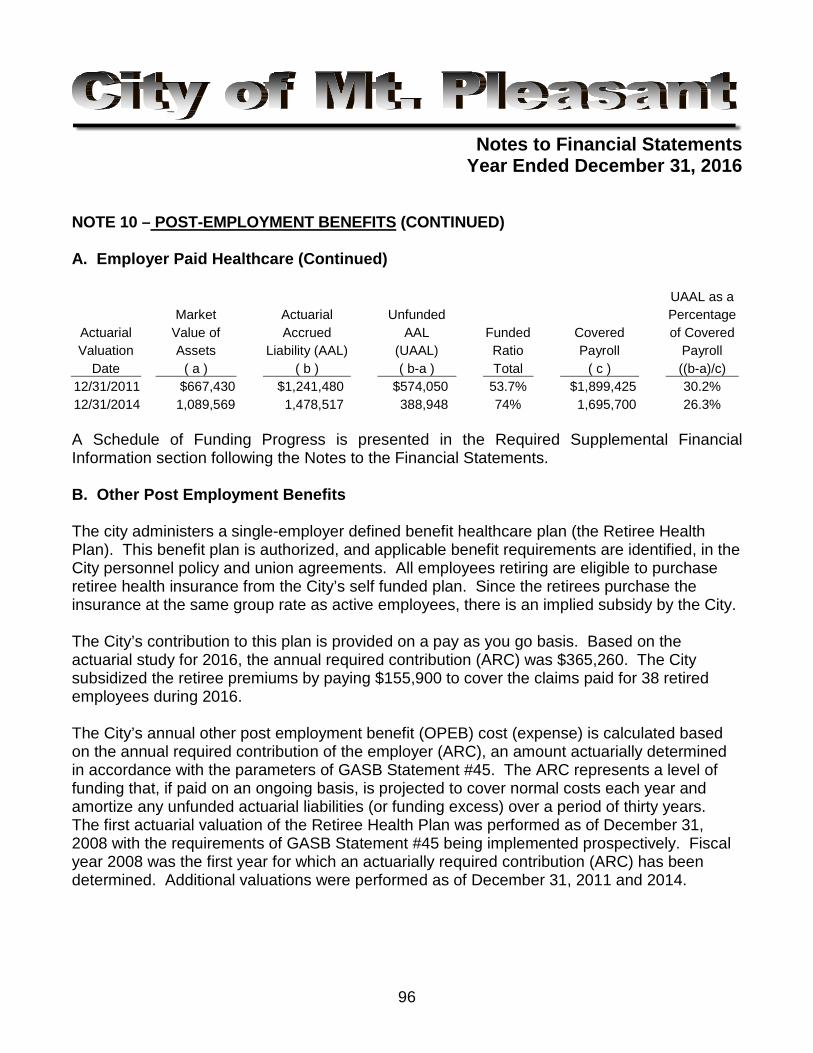
Notes to Financial Statements Year Ended December 31, 2016
NOTE 10 – POST-EMPLOYMENT BENEFITS (CONTINUED) A. Employer Paid Healthcare (Continued)
UAAL as a Market Actuarial Unfunded Percentage
Actuarial Value of Accrued AAL Funded Covered of Covered Valuation Assets Liability (AAL) (UAAL) Ratio Payroll Payroll
Date ( a ) ( b ) ( b-a ) Total ( c ) ((b-a)/c) 12/31/2011 $667,430 $1,241,480 $574,050 53.7% $1,899,425 30.2% 12/31/2014 1,089,569 1,478,517 388,948 74% 1,695,700 26.3% A Schedule of Funding Progress is presented in the Required Supplemental Financial Information section following the Notes to the Financial Statements. B. Other Post Employment Benefits The city administers a single-employer defined benefit healthcare plan (the Retiree Health Plan). This benefit plan is authorized, and applicable benefit requirements are identified, in the City personnel policy and union agreements. All employees retiring are eligible to purchase retiree health insurance from the City’s self funded plan. Since the retirees purchase the insurance at the same group rate as active employees, there is an implied subsidy by the City. The City’s contribution to this plan is provided on a pay as you go basis. Based on the actuarial study for 2016, the annual required contribution (ARC) was $365,260. The City subsidized the retiree premiums by paying $155,900 to cover the claims paid for 38 retired employees during 2016. The City’s annual other post employment benefit (OPEB) cost (expense) is calculated based on the annual required contribution of the employer (ARC), an amount actuarially determined in accordance with the parameters of GASB Statement #45. The ARC represents a level of funding that, if paid on an ongoing basis, is projected to cover normal costs each year and amortize any unfunded actuarial liabilities (or funding excess) over a period of thirty years. The first actuarial valuation of the Retiree Health Plan was performed as of December 31, 2008 with the requirements of GASB Statement #45 being implemented prospectively. Fiscal year 2008 was the first year for which an actuarially required contribution (ARC) has been determined. Additional valuations were performed as of December 31, 2011 and 2014.
96
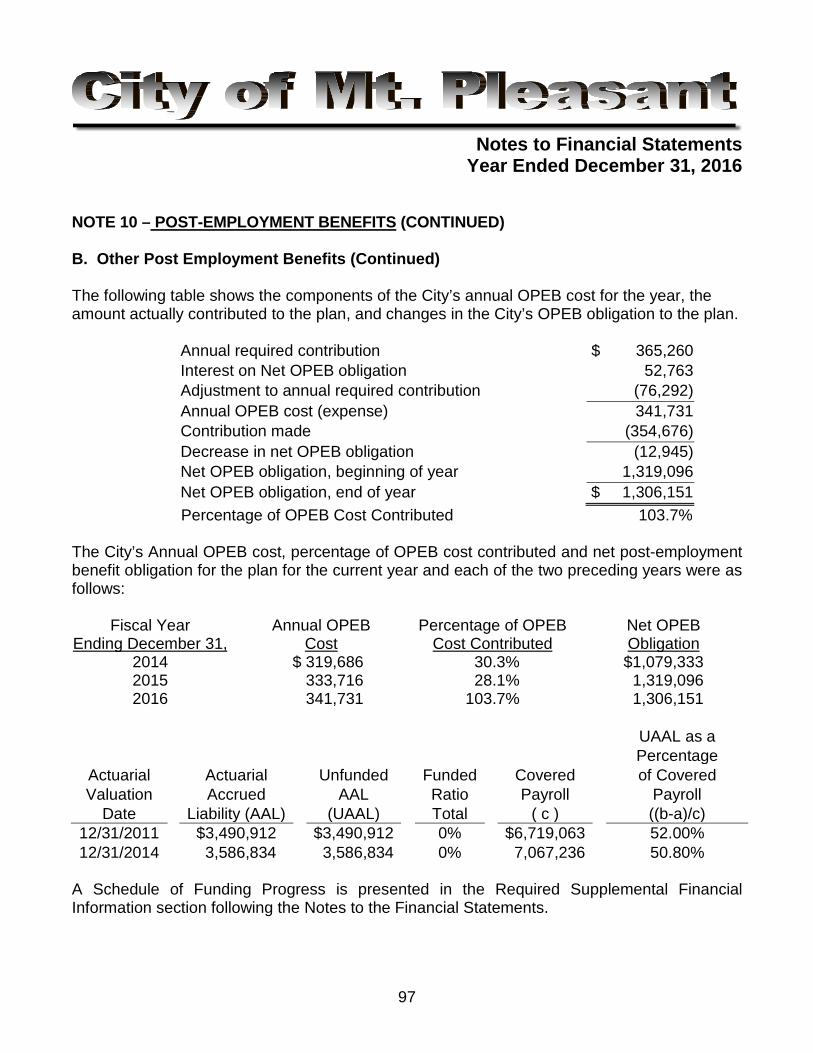
Notes to Financial Statements Year Ended December 31, 2016
NOTE 10 – POST-EMPLOYMENT BENEFITS (CONTINUED) B. Other Post Employment Benefits (Continued) The following table shows the components of the City’s annual OPEB cost for the year, the amount actually contributed to the plan, and changes in the City’s OPEB obligation to the plan. Annual required contribution $ 365,260 Interest on Net OPEB obligation 52,763 Adjustment to annual required contribution (76,292) Annual OPEB cost (expense) 341,731 Contribution made (354,676) Decrease in net OPEB obligation (12,945) Net OPEB obligation, beginning of year 1,319,096 Net OPEB obligation, end of year $ 1,306,151 Percentage of OPEB Cost Contributed 103.7% The City’s Annual OPEB cost, percentage of OPEB cost contributed and net post-employment benefit obligation for the plan for the current year and each of the two preceding years were as follows:
Fiscal Year Annual OPEB Percentage of OPEB Net OPEB Ending December 31, Cost Cost Contributed Obligation
2014 $ 319,686 30.3% $1,079,333 2015 333,716 28.1% 1,319,096 2016 341,731 103.7% 1,306,151
UAAL as a Percentage
Actuarial Actuarial Unfunded Funded Covered of Covered Valuation Accrued AAL Ratio Payroll Payroll
Date Liability (AAL) (UAAL) Total ( c ) ((b-a)/c) 12/31/2011 $3,490,912 $3,490,912 0% $6,719,063 52.00% 12/31/2014 3,586,834 3,586,834 0% 7,067,236 50.80%
A Schedule of Funding Progress is presented in the Required Supplemental Financial Information section following the Notes to the Financial Statements.
97
Notes to Financial Statements Year Ended December 31, 2016
NOTE 10 – POST-EMPLOYMENT BENEFITS (CONTINUED) C. Actuarial Assumptions Actuarial valuations of ongoing plans involve estimates of the value of reported amounts and assumptions about the probability of occurrence of events far into the future. Examples include assumptions about future employment, mortality, and healthcare cost trend. Amounts determined regarding the funded status of the plans and the annual required contributions of the employer are subject to continual revision as actual results are compared with past expectations and new estimates are made about the future. The required schedules of funding progress immediately following the notes to the financial statements, present multi-year trend information about whether the actuarial value of the plan assets are increasing or decreasing over time relative to the actuarial accrued liabilities for benefits. Projections of benefits for financial reporting purposes are based on the substantive plan (the plan as understood by the employer and the plan members) and include the types of benefits provided at the time of each valuation and the historical pattern of sharing of benefit costs between the employer and the plan members to that point. The actuarial methods and assumptions used include techniques that are designed to reduce the effects of short-term volatility in actuarial accrued liabilities and the actuarial value of assets, consistent with the long-term perspective of the calculation. In the December 31, 2014 actuarial valuation the Plan utilized the projected unit credit actuarial cost method; projected unit level dollar, closed amortization method and an amortization period of 20 years for the employer paid plan; and open amortization method and a amortization period of 30 years for the other post employment benefit plan. The actuarial assumptions included a 7.5% return on plan net position for the employer paid healthcare plan (which is a blended rate of return of the expected long-term investment returns on plan assets and on the employer’s own investments calculated based on the funded level of the plan at the valuation date) and a 0% return on plan net position for the other post employment benefit plan, as this plan is not funded, and a 5% medical inflation rate. Projected salary increases are not applicable to these plans. IRC 1.43(h) mortality table is assumed.
98
Notes to Financial Statements Year Ended December 31, 2016
NOTE 11 - EMPLOYEE RETIREMENT SYSTEMS The City maintains two pension plans: 1) a contributory defined benefit pension plan with the Municipal Employees Retirement System of Michigan (MERS), which is an agent multiple-employer public employee retirement system, and 2) a single-employer contributory defined benefit pension plan for its police and fire employees under P.A. 345 of the Michigan Public Acts of 1937, as amended. A. Municipal Employees Retirement System of Michigan Plan Description - The following brief description of the MERS plan is provided for general information purposes only. Participants should refer to the Plan agreement for more complete information. One employee of the Tax Increment Finance Authority Component Unit participates in the plan and represents 2.4% of the plan. The City contributes to the Municipal Employees Retirement System of Michigan (MERS), multiple-employer public employee retirement system administered by the MERS Retirement Board. The system provides retirement, disability and death benefits to plan members and their beneficiaries. Act No. 427 of the Public Acts of 1984, as amended, establishes and amends the benefit provisions of the participants in MERS. MERS issues a publicly available financial report that includes financial statements and required supplementary information for the system. That report may be obtained accessing the MERS website at www.mersofmich.com. All full-time City employees and paid on call firefighters hired prior to January 1, 2011, except for the police and fire members who have their own retirement plan, are eligible to participate in the system. Employees become eligible to participate upon employment. Benefits provided – Benefits provided include plans with multipliers ranging from 1.7 to 2.5. Vesting period of 6-10 years. Normal retirement age is 60 with early retirement dependent on years of service. Final average compensation is calculated based on 3 years. Membership of the defined benefit plan consisted of the following at the date of the latest actuarial valuation (December 31, 2015):
Active plan members 89 Inactive employees entitled but not yet receiving benefits 18 Inactive employees or beneficiaries currently receiving benefits 83 Total 190
99
Notes to Financial Statements Year Ended December 31, 2016
NOTE 11 - EMPLOYEE RETIREMENT SYSTEMS (CONTINUED) A. Municipal Employees Retirement System of Michigan (Continued) Contributions - The City is required to contribute at an actuarially determined rate. The employer makes an annual contribution the first of the year and the credit is applied monthly to the liability for the month. Participating employees are required to contribute from 4.0% to 5.0% percent of gross wages to the Plan based on position and classification. The contribution requirements of the City are established and may be amended by the MERS Retirement Board. The contribution requirements of employees are established and may be amended by labor agreements. Net Pension Liability - The employer’s Net Pension Liability was measured as of December 31, 2015, and the total pension liability used to calculate the Net Pension Liability was determined by an annual actuarial valuation as of that date.
The total pension liability in the December 31, 2015 annual actuarial valuation was determined using the following actuarial assumptions, applied to all periods included in the measurement:
• Inflation: 2.5% 3%-4%.
• Salary Increases: 3.75% in the long-term (plus merit and longevity from 0 to 11% based on age) (4.5% for 2014)
• Investment rate of return: 7.75%, net of investment expense, including inflation (8.25% for 2014).
• Mortality rates used for non-disabled plan member were based on a weighted blend of RP-2014 mortality tables of a 50% Male and 50% Female blend. Mortality rates used for disabled plan member were based on a blend of RP-2014 disabled retire mortality tables of a 50% Male and 50% Female blend of disabled retires. (1994 group annuity tables is 2014)
The actuarial assumptions used in valuation were based on the results of the most recent actuarial experience study dated July 6, 2015. The long-term expected rate of return on pension plan investments was determined using a model method in which the best-estimate ranges of expected future real rates of return (expected returns, net of investment and administrative expenses and inflation) are developed for each major asset class. These ranges are combined to produce the long-term expected rate of return by weighting the expected future real rates of return by the target asset allocation percentage and by adding expected inflation. The target allocation and best estimates of arithmetic real rates of return for each major asset class are summarized in the following table:
100
Notes to Financial Statements Year Ended December 31, 2016
NOTE 11 - EMPLOYEE RETIREMENT SYSTEMS (CONTINUED) A. Municipal Employees Retirement System of Michigan (Continued)
The target allocation and best estimates of arithmetic real rates of return for each major asset class are summarized in the following table:
Asset Class
Target Allocation
Long-Term
Expected Real Rate of Return
Expected Money Weighted Rate of
Return Global Equity 57.5% 6.27% 3.60% Global Fixed Income 20.0% 3.43% 0.68% Real Assets 12.5% 5.48% 0.69% Diversifying Strategies 10.0% 7.81% 0.78% Inflation 2.00% Administrative fee 0.25% Investment rate of return 8.00%
Discount rate. The discount rate used to measure the total pension liability is 8.00%. The projection of cash flows used to determine the discount rate assumes that employer and employee contributions will be made at the rates agreed upon for employees and the actuarially determined rates for employers. Based on these assumptions, the pension plan’s fiduciary net position was projected to be available to pay all projected future benefit payments of current active and inactive employees. Therefore, the long-term expected rate of return on pension plan investments was applied to all periods of projected benefit payments to determine the total pension liability.
101
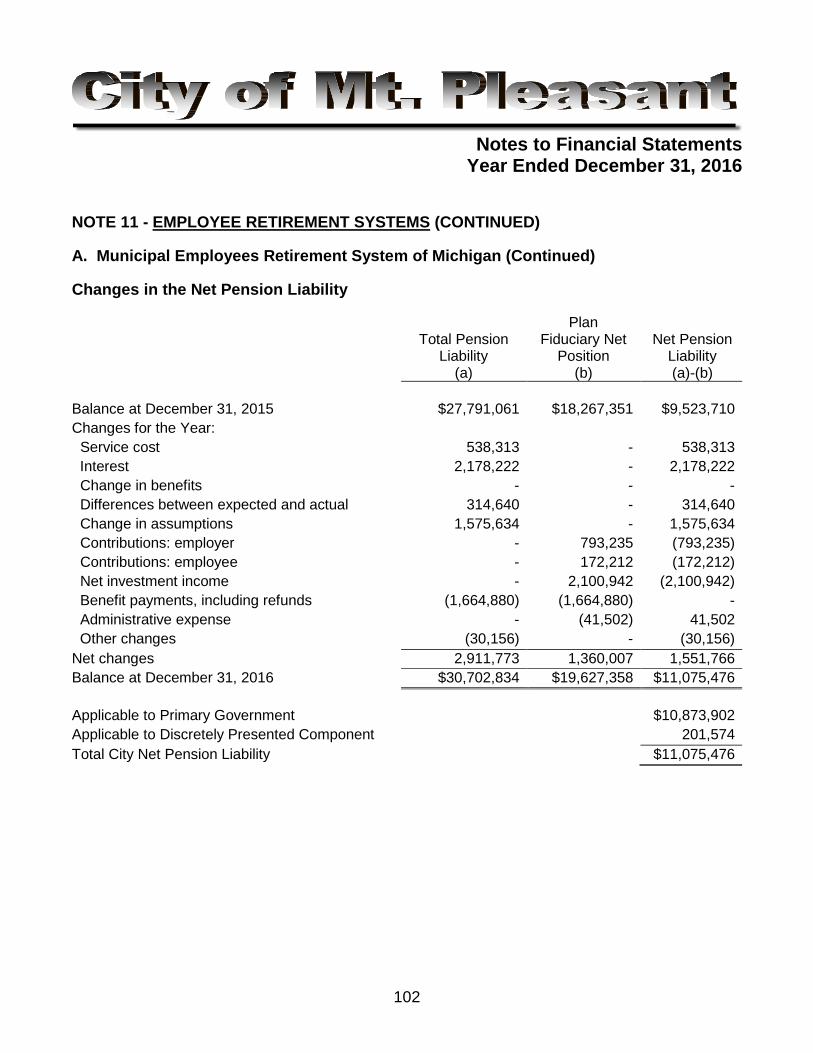
Notes to Financial Statements Year Ended December 31, 2016
NOTE 11 - EMPLOYEE RETIREMENT SYSTEMS (CONTINUED) A. Municipal Employees Retirement System of Michigan (Continued) Changes in the Net Pension Liability
Total Pension Liability
(a)
Plan Fiduciary Net
Position (b)
Net Pension
Liability (a)-(b)
Balance at December 31, 2015
$27,791,061 $18,267,351 $9,523,710 Changes for the Year: Service cost 538,313 - 538,313 Interest 2,178,222 - 2,178,222 Change in benefits - - - Differences between expected and actual
314,640 - 314,640 Change in assumptions 1,575,634 - 1,575,634 Contributions: employer - 793,235 (793,235) Contributions: employee - 172,212 (172,212) Net investment income - 2,100,942 (2,100,942) Benefit payments, including refunds (1,664,880) (1,664,880) - Administrative expense - (41,502) 41,502 Other changes (30,156) - (30,156) Net changes 2,911,773 1,360,007 1,551,766 Balance at December 31, 2016 $30,702,834 $19,627,358 $11,075,476 Applicable to Primary Government $10,873,902 Applicable to Discretely Presented Component
201,574 Total City Net Pension Liability $11,075,476
102
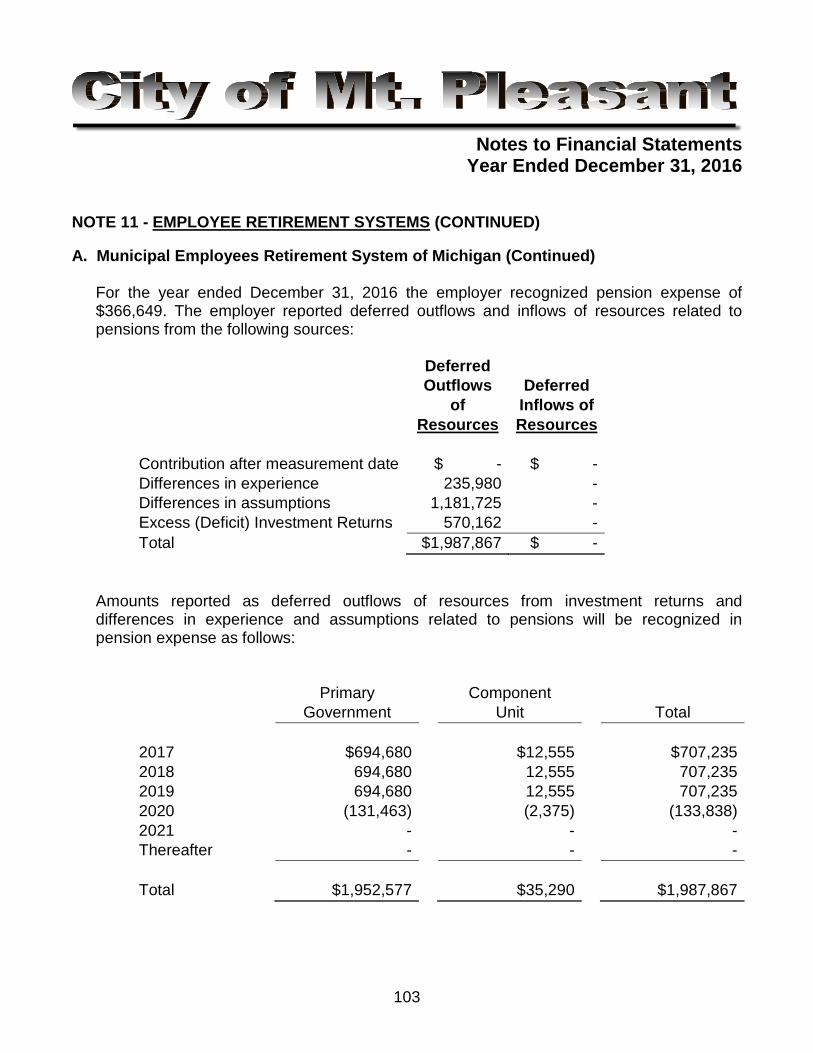
Notes to Financial Statements Year Ended December 31, 2016
NOTE 11 - EMPLOYEE RETIREMENT SYSTEMS (CONTINUED) A. Municipal Employees Retirement System of Michigan (Continued)
For the year ended December 31, 2016 the employer recognized pension expense of $366,649. The employer reported deferred outflows and inflows of resources related to pensions from the following sources:
Deferred Outflows
of Resources
Deferred
Inflows of Resources
Contribution after measurement date $ - $ - Differences in experience 235,980 - Differences in assumptions 1,181,725 - Excess (Deficit) Investment Returns 570,162 - Total $1,987,867 $ -
Amounts reported as deferred outflows of resources from investment returns and differences in experience and assumptions related to pensions will be recognized in pension expense as follows:
Primary Component Government Unit Total 2017 $694,680 $12,555 $707,235 2018 694,680 12,555 707,235 2019 694,680 12,555 707,235 2020 (131,463) (2,375) (133,838) 2021 - - - Thereafter - - - Total $1,952,577 $35,290 $1,987,867
103
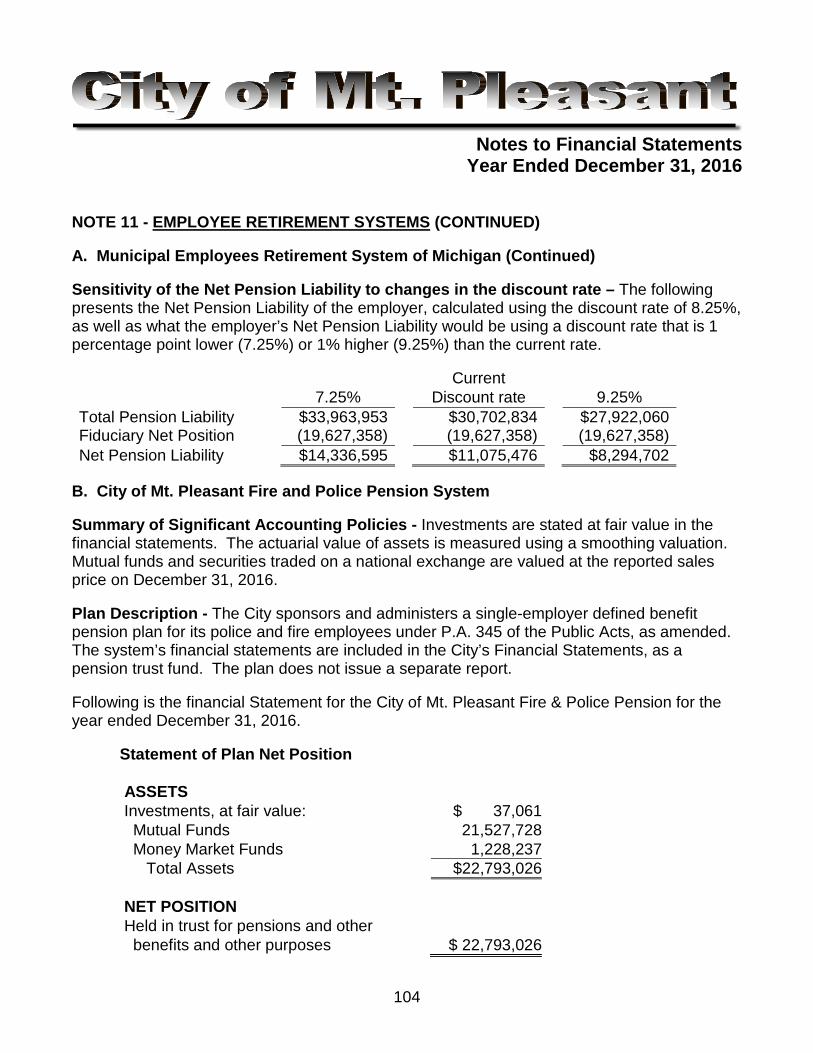
Notes to Financial Statements Year Ended December 31, 2016
NOTE 11 - EMPLOYEE RETIREMENT SYSTEMS (CONTINUED) A. Municipal Employees Retirement System of Michigan (Continued) Sensitivity of the Net Pension Liability to changes in the discount rate – The following presents the Net Pension Liability of the employer, calculated using the discount rate of 8.25%, as well as what the employer’s Net Pension Liability would be using a discount rate that is 1 percentage point lower (7.25%) or 1% higher (9.25%) than the current rate. Current 7.25%
Discount rate 9.25%
Total Pension Liability $33,963,953 $30,702,834 $27,922,060 Fiduciary Net Position (19,627,358) (19,627,358) (19,627,358) Net Pension Liability $14,336,595 $11,075,476 $8,294,702
B. City of Mt. Pleasant Fire and Police Pension System Summary of Significant Accounting Policies - Investments are stated at fair value in the financial statements. The actuarial value of assets is measured using a smoothing valuation. Mutual funds and securities traded on a national exchange are valued at the reported sales price on December 31, 2016. Plan Description - The City sponsors and administers a single-employer defined benefit pension plan for its police and fire employees under P.A. 345 of the Public Acts, as amended. The system’s financial statements are included in the City’s Financial Statements, as a pension trust fund. The plan does not issue a separate report. Following is the financial Statement for the City of Mt. Pleasant Fire & Police Pension for the year ended December 31, 2016.
Statement of Plan Net Position ASSETS Investments, at fair value: $ 37,061 Mutual Funds 21,527,728 Money Market Funds 1,228,237 Total Assets $22,793,026 NET POSITION Held in trust for pensions and other benefits and other purposes $ 22,793,026
104
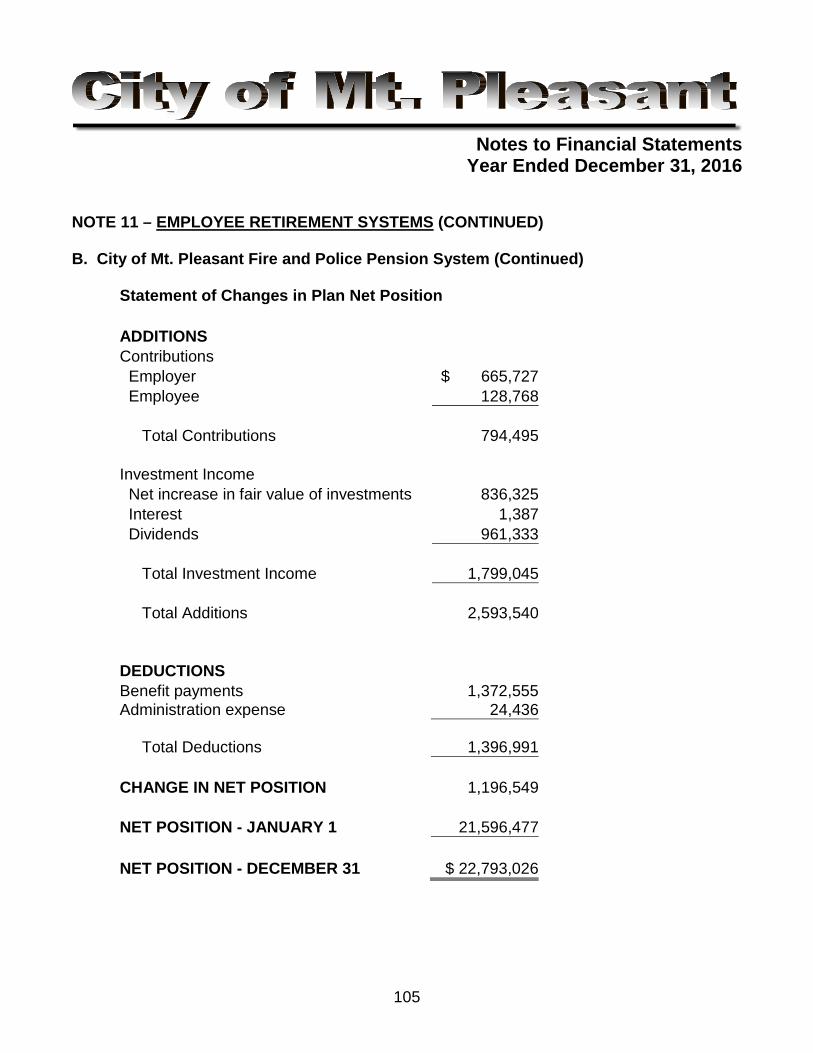
Notes to Financial Statements Year Ended December 31, 2016
NOTE 11 – EMPLOYEE RETIREMENT SYSTEMS (CONTINUED) B. City of Mt. Pleasant Fire and Police Pension System (Continued)
Statement of Changes in Plan Net Position ADDITIONS Contributions Employer $ 665,727 Employee 128,768 Total Contributions 794,495 Investment Income Net increase in fair value of investments 836,325 Interest 1,387 Dividends 961,333 Total Investment Income 1,799,045 Total Additions 2,593,540 DEDUCTIONS Benefit payments 1,372,555 Administration expense 24,436
Total Deductions
1,396,991 CHANGE IN NET POSITION 1,196,549 NET POSITION - JANUARY 1 21,596,477 NET POSITION - DECEMBER 31 $ 22,793,026
105
Notes to Financial Statements Year Ended December 31, 2016
NOTE 11 – EMPLOYEE RETIREMENT SYSTEMS (CONTINUED) B. City of Mt. Pleasant Fire and Police Pension System (Continued) Management of the Fire and Police Pension Plan is vested in the Police & Fire Pension Board. The Board consists of a representative from police, fire, the City Treasurer and two citizens appointed by the City Commission. At December 31, 2016 membership in the System is as follows: Group Membership Active Members 40 Retirees and Beneficiaries Currently Receiving Benefits 39 Inactive, Vested Members 2 The system provides retirement, disability and death benefits to plan members and their beneficiaries. The following brief description of the Fire and Police Pension System plan is provided for general information purposes only. Participants should refer to the Plan agreement for more complete information. Fire retirees’ straight life pension equals 2.75% of 3-year average final compensation (AFC) times the first 25 years of service plus 1% of AFC times years of service in excess of 25 years with an 80% of AFC maximum benefit. Police retirees’ straight life pension equals 2.75% of 3-year AFC times the greater of 25 years of service or years of service to age 50, plus 1% of AFC times years of service to which 2.75% multiplier didn’t apply with a 75% of AFC maximum benefit. All members are eligible for non-duty disability upon 5 years of service and for duty disability upon hire. Non-duty death benefits are eligible to a surviving spouse upon 10 years of service and duty death upon hire and expiration of workers’ compensation benefits. A plan member who leaves service may withdraw their contributions, plus any accumulated interest. The union agreements for Police and Fire provide for a 13th check provided the plan is greater than 84% funded. Police 13th check for officers retired before January 1, 2002 is 7.5% of payments to eligible retirees divided by the number of eligible police retirees and beneficiaries. Fire 13th check is 5% for firefighters retired prior to 2000 and 7.5% for firefighters retired after 2000.
106
Notes to Financial Statements Year Ended December 31, 2016
NOTE 11 – EMPLOYEE RETIREMENT SYSTEMS (CONTINUED) B. City of Mt. Pleasant Fire and Police Pension System (Continued) Plan member benefits and member contributions are determined based on negotiations with the three bargaining units covering members Police plan members are required to contribute 4% of their annual covered payroll. Fire plan members hired before December 31, 2014 are required to contribute 4% of their annual covered payroll if the plan is 84% or greater funded and 5% if not. Fire plan members hired after January 1, 2015 are required to contribute 5% of their annual covered payroll. Employer contributions to the plan provide for an annual contribution at an actuarially determined rate. The City levies a voted millage to cover the contribution. Administrative costs of the plan are financed through investment earnings. Trend Information
2014 2015 2016 Annual Pension Cost (APC) $747,621 $ 708,175 $ 665,727 Percentage of APC to Cover Payroll 27.4% 23.4% 24.4% Percentage of APC Contributed 100% 100% 100% Investments The pension plan’s policy in regard to the allocation of invested assets is established and may be amended by the Police & Fire Pension Board by a majority vote of the its members. It is the policy of the Police & Fire Pension Board to pursue an investment strategy that reduces risk through diversification of the portfolio. The following is the Board’s adopted asset allocation policy as of August 20, 2013. The market value of the pension portfolio invested in equity investments shall be 65% with a tolerance for fluctuation of +5%. The market value of the pension portfolio invested in international equity investments shall not exceed 20%. No individual stocks will be held. All equity investment will be in mutual funds. The market value of the equity portfolio will be 50% value and 50% growth with a tolerance for fluctuation of +/- 10%. The market value of the equity portfolio will be 80% giant and large stocks and 20-30% medium and small stocks. Given the lengthy time horizon of pension investments, rebalancing shall be evaluated annually and phased in over a period of time. For the year ended December 31, 2016, the annual money-weighted rate of return on pension plan investments, net of pension plan investment expense, was 9.3%. The money-weighted rate of return expresses investment performance, net of investment expense, adjusted for the changing amounts actually invested.
107
Notes to Financial Statements Year Ended December 31, 2016
NOTE 11 – EMPLOYEE RETIREMENT SYSTEMS (CONTINUED) B. City of Mt. Pleasant Fire and Police Pension System (Continued) Reserves The system is required to maintain reserves for employees’ contributions and retired benefit payments. At December 31, 2016 these reserves equal 100% of non-retired employee contributions plus interest and 100% of the actuarial determined reserve for retiree benefit payments. Reserve balances at December 31, 2016 are: Reserve for Employee Contribution $ 2,031,675 Reserve for Retiree Benefit Payment 13,225,247 Net Pension Liability of the City The components of the net pension liability of the City at December 31, 2016 were as follows: Total Pension Liability $ 27,158,447 Plan Fiduciary Net Position (22,793,025) City’s Net Pension Liability $ 4,365,422 Plan Fiduciary net position as a percentage of total pension liability 83.93% The actuarial assumptions used in valuation were based on the results of the most recent actuarial experiences study dated March 27, 2017. Significant actuarial assumptions used include (a) an 7.25% net investment yield, (b) projected salary increases of 4% to 7% including a percentage based in an age-related scale to reflect merit, longevity and promotional salary increases per year and (c) inflation of 4%. Mortality rates were based on the RP2000 Group Annuity Mortality Table for males and females projected to 2017 using scale BB with a 3-year set forward for males. The long-term expected rate of return on pension plan investments was determined to be 7.25% a year, compounded annually. The assumptions consist of 3.25% for real rate of return and 4% in recognition of wage inflation.
108
Notes to Financial Statements Year Ended December 31, 2016
NOTE 11 – EMPLOYEE RETIREMENT SYSTEMS (CONTINUED) B. City of Mt. Pleasant Fire and Police Pension System (Continued) The discount rate used to measure the total pension liability was 7.25%. The projection of cash flows used to determine the discount rate assumed that plan member contributions will be made at the current contribution rate and that City contributions will be made at the current contributions rate and that the City contributions will be made at rates equal to the difference between actuarially determined contributions and the member rates. Therefore, the long-term expected rate of return on pension plan investments was applied to all periods of projected benefit payments to determine the total pension benefit liability. The following are the components of the change in net pension liability are as follows:
Total Pension Liability
(a)
Plan Fiduciary Net
Position (b)
Net Pension
Liability (a)-(b)
Balance at December 31, 2015 $26,184,366 $21,596,477 $4,587,889 Service Cost 628,907 - 628,907 Interest on Total Pension Liability 1,871,409 - 1,871,409 Changes in Assumptions (120,536) - (120,536) Differences between Expected & Actuarial Experience (33,144) - (33,144) Employer Contributions - 665,727 (665,727) Employee Contributions - 128,768 (128,768) Net Investment Income - 1,799,045 (1,799,045) Benefit Payments (1,372,555) (1,372,555) - Administration Expense - (24,437) 24,437 Net Changes 974,081 1,196,548 (222,467) Balance at December 31, 2016 $27,158,447 $22,793,025 $4,365,422
109
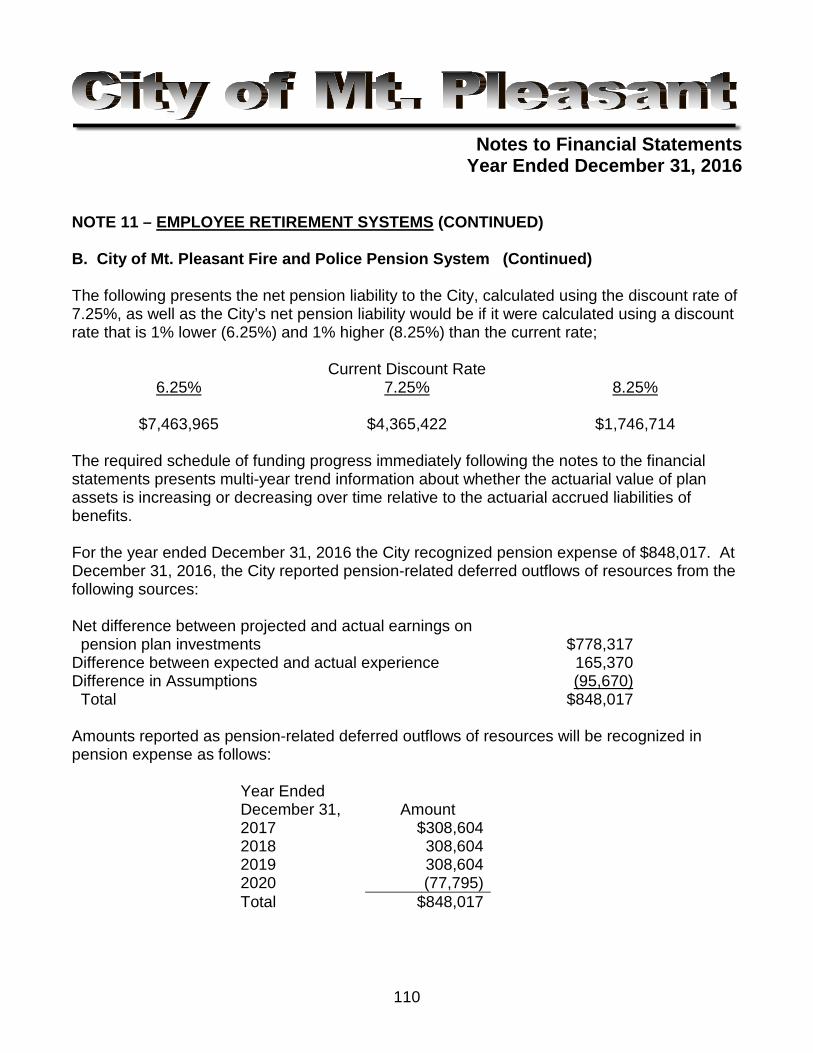
Notes to Financial Statements Year Ended December 31, 2016
NOTE 11 – EMPLOYEE RETIREMENT SYSTEMS (CONTINUED) B. City of Mt. Pleasant Fire and Police Pension System (Continued) The following presents the net pension liability to the City, calculated using the discount rate of 7.25%, as well as the City’s net pension liability would be if it were calculated using a discount rate that is 1% lower (6.25%) and 1% higher (8.25%) than the current rate;
Current Discount Rate 6.25% 7.25% 8.25%
$7,463,965 $4,365,422 $1,746,714
The required schedule of funding progress immediately following the notes to the financial statements presents multi-year trend information about whether the actuarial value of plan assets is increasing or decreasing over time relative to the actuarial accrued liabilities of benefits. For the year ended December 31, 2016 the City recognized pension expense of $848,017. At December 31, 2016, the City reported pension-related deferred outflows of resources from the following sources: Net difference between projected and actual earnings on pension plan investments $778,317 Difference between expected and actual experience 165,370 Difference in Assumptions (95,670) Total $848,017 Amounts reported as pension-related deferred outflows of resources will be recognized in pension expense as follows:
Year Ended December 31,
Amount
2017 $308,604 2018 308,604 2019 308,604 2020 (77,795) Total $848,017
110
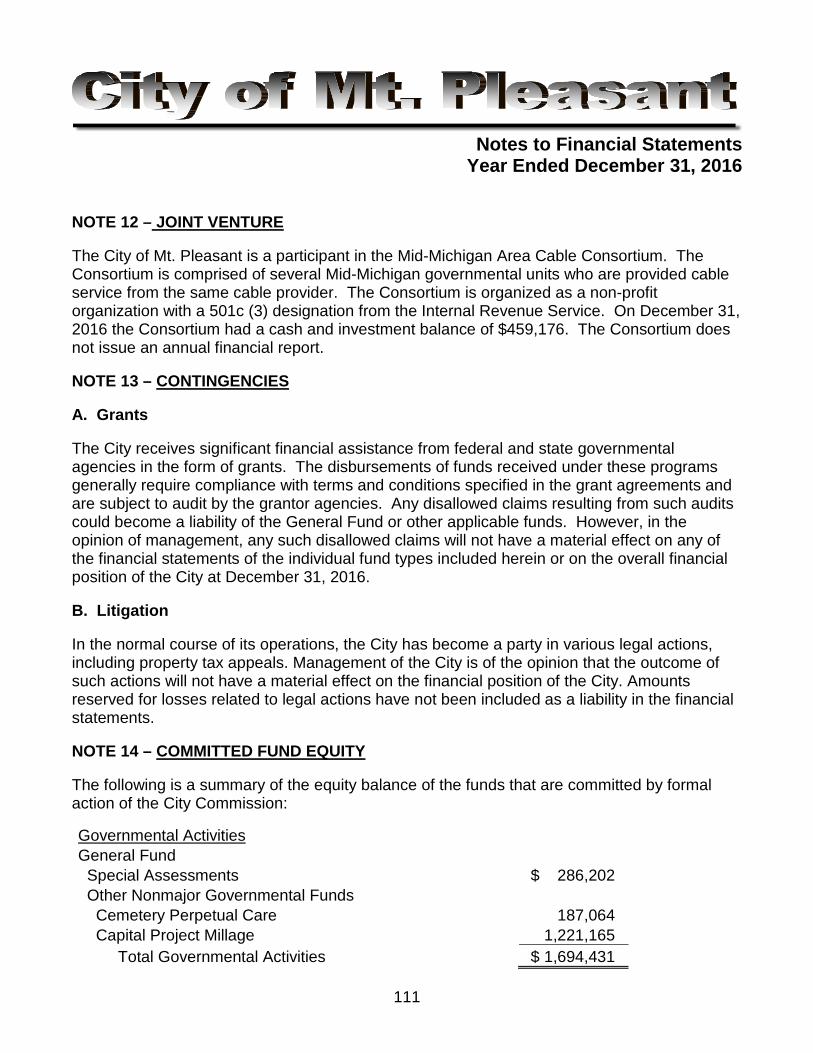
Notes to Financial Statements Year Ended December 31, 2016
NOTE 12 – JOINT VENTURE The City of Mt. Pleasant is a participant in the Mid-Michigan Area Cable Consortium. The Consortium is comprised of several Mid-Michigan governmental units who are provided cable service from the same cable provider. The Consortium is organized as a non-profit organization with a 501c (3) designation from the Internal Revenue Service. On December 31, 2016 the Consortium had a cash and investment balance of $459,176. The Consortium does not issue an annual financial report. NOTE 13 – CONTINGENCIES A. Grants The City receives significant financial assistance from federal and state governmental agencies in the form of grants. The disbursements of funds received under these programs generally require compliance with terms and conditions specified in the grant agreements and are subject to audit by the grantor agencies. Any disallowed claims resulting from such audits could become a liability of the General Fund or other applicable funds. However, in the opinion of management, any such disallowed claims will not have a material effect on any of the financial statements of the individual fund types included herein or on the overall financial position of the City at December 31, 2016. B. Litigation In the normal course of its operations, the City has become a party in various legal actions, including property tax appeals. Management of the City is of the opinion that the outcome of such actions will not have a material effect on the financial position of the City. Amounts reserved for losses related to legal actions have not been included as a liability in the financial statements. NOTE 14 – COMMITTED FUND EQUITY The following is a summary of the equity balance of the funds that are committed by formal action of the City Commission:
Governmental Activities General Fund Special Assessments
$ 286,202 Other Nonmajor Governmental Funds
Cemetery Perpetual Care
187,064 Capital Project Millage
1,221,165
Total Governmental Activities
$ 1,694,431
111

Notes to Financial Statements Year Ended December 31, 2016
NOTE 15 – ASSIGNED FUND EQUITY The following is a summary of the equity balance of the funds with management’s assignment.
Non-Major Water/Sewer Non-Major Component
General Government Fund Proprietary Unit Assigned for: Fire Truck Replacement $ 101,937 $ - $ - $ - $ -
Economic Development 312,772 - - - -
Subsequent Years' Expenditures 442,551 18,129 - 120,519 923,221
Appropriated Next Year’s Budget 26,730 - - - -
Debt Service - 62,148 - - -
Parks & Recreation 509,483 - - - -
Community Development Block
Grant Eligible Expenditures 345,232 - - - -
Plant/Line Replacement - - 1,435,724 - -
Total Assigned $ 1,738,705 $ 80,277 $ 1,435,724 $ 120,519 $ 923,221
NOTE 16 – TAX ABATEMENTS As of December 31, 2016, the City provides tax abatements as defined by Governmental Standards Board through three programs, Payment in Lieu of Taxes, Industrial Facilities Tax Exemption and Brownfield Tax Capture. Payment in Lieu of Taxes is set by Ordinance of the City Commission to allow apartment complexes that provide housing to elderly and/or low income tenants. These taxpayers pay a service fee based on net rent rather than ad valorem taxes. Industrial Facilities Tax Exemptions are provided for by the State of Michigan Public Act 198 of 1974. Exemptions approved by the City Commission allow Industrial Tax payers to pay ½ of the tax rate for a set period of years for real or personal property. Brownfield Tax Capture is provided for by the State of Michigan Public Act 381 of 1996. The Brownfield Redevelopment Authority has approved reimbursement agreements with nine tax payers that provide for a portion of the taxes they pay be captured and paid to the developer to cover eligible costs under the Brownfield Act. Tax Abatement Program Amount of Taxes Abated Payment in Lieu of Taxes $124,976 Industrial Facilities Tax Exemption 43,805 Brownfield Tax Capture 88,334
112

113
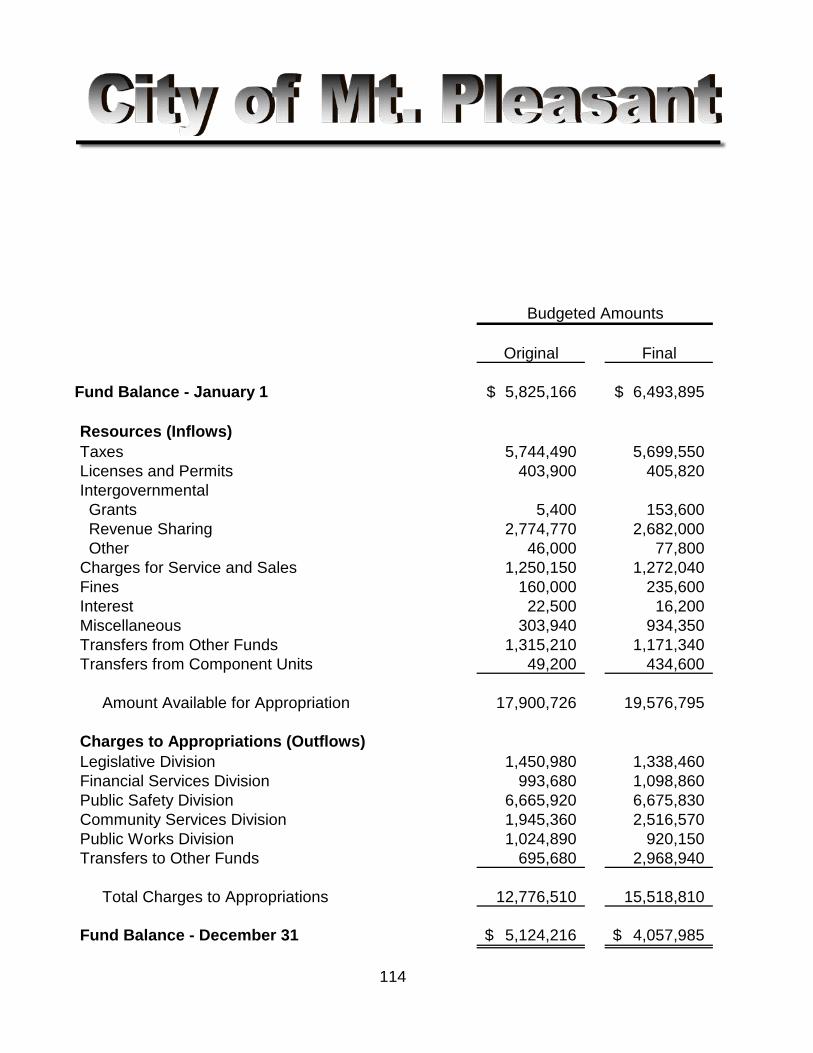
Original Final
Fund Balance - January 1 5,825,166$ 6,493,895$
Resources (Inflows)Taxes 5,744,490 5,699,550 Licenses and Permits 403,900 405,820 Intergovernmental Grants 5,400 153,600 Revenue Sharing 2,774,770 2,682,000 Other 46,000 77,800 Charges for Service and Sales 1,250,150 1,272,040 Fines 160,000 235,600 Interest 22,500 16,200 Miscellaneous 303,940 934,350 Transfers from Other Funds 1,315,210 1,171,340 Transfers from Component Units 49,200 434,600
Amount Available for Appropriation 17,900,726 19,576,795
Charges to Appropriations (Outflows)Legislative Division 1,450,980 1,338,460 Financial Services Division 993,680 1,098,860 Public Safety Division 6,665,920 6,675,830 Community Services Division 1,945,360 2,516,570 Public Works Division 1,024,890 920,150 Transfers to Other Funds 695,680 2,968,940
Total Charges to Appropriations 12,776,510 15,518,810
Fund Balance - December 31 5,124,216$ 4,057,985$
Budgeted Amounts
114
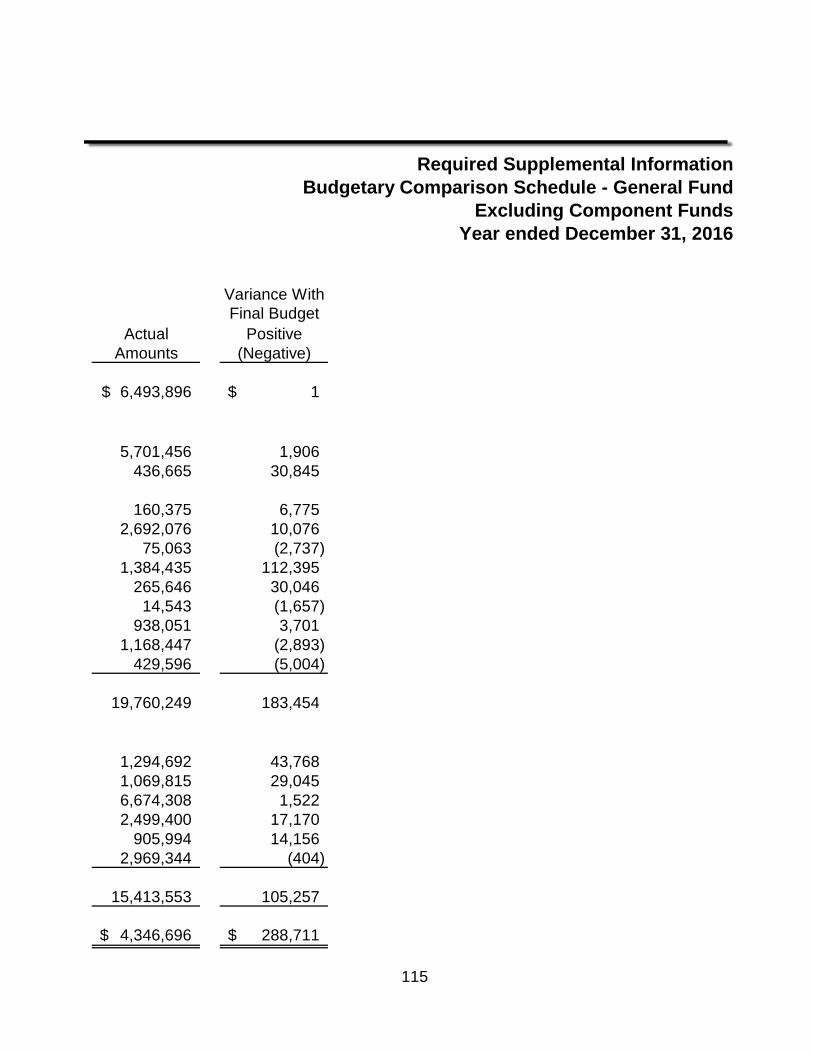
Required Supplemental InformationBudgetary Comparison Schedule - General Fund
Excluding Component FundsYear ended December 31, 2016
Variance WithFinal Budget
Actual PositiveAmounts (Negative)
6,493,896$ 1$
5,701,456 1,906 436,665 30,845
160,375 6,775 2,692,076 10,076
75,063 (2,737) 1,384,435 112,395
265,646 30,046 14,543 (1,657)
938,051 3,701 1,168,447 (2,893)
429,596 (5,004)
19,760,249 183,454
1,294,692 43,768 1,069,815 29,045 6,674,308 1,522 2,499,400 17,170
905,994 14,156 2,969,344 (404)
15,413,553 105,257
4,346,696$ 288,711$
115
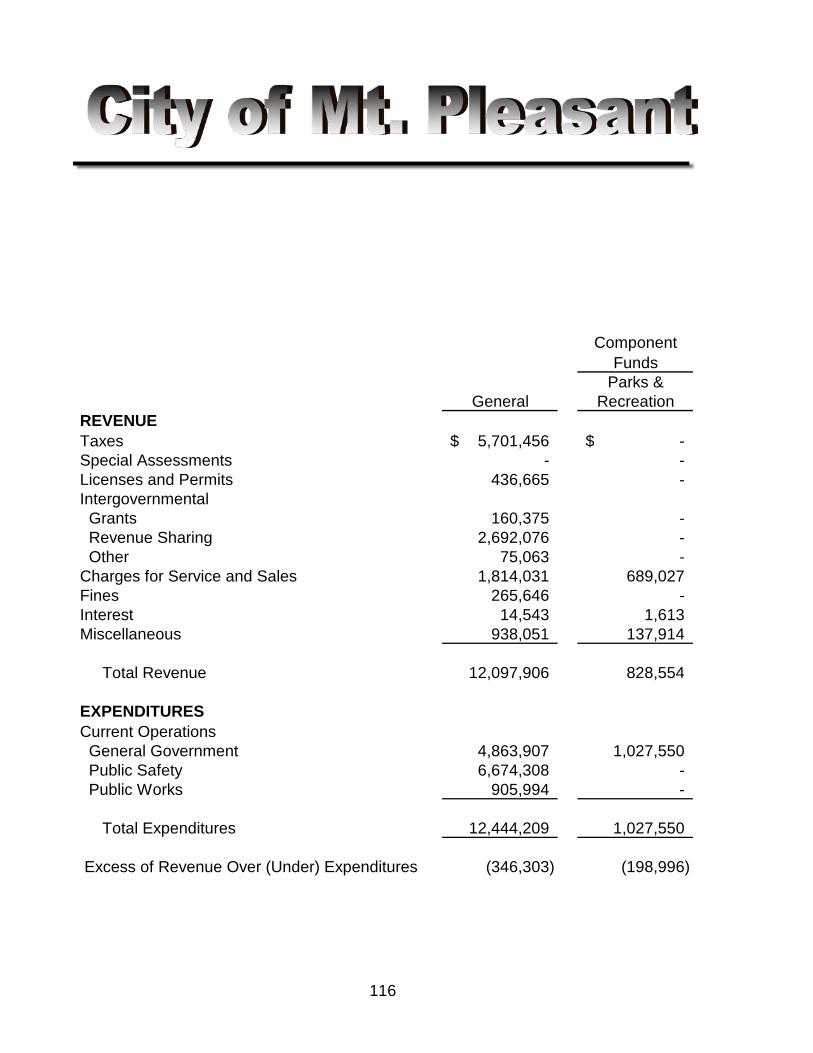
ComponentFunds
Parks &General Recreation
REVENUETaxes 5,701,456$ -$ Special Assessments - - Licenses and Permits 436,665 - Intergovernmental Grants 160,375 - Revenue Sharing 2,692,076 - Other 75,063 - Charges for Service and Sales 1,814,031 689,027 Fines 265,646 - Interest 14,543 1,613 Miscellaneous 938,051 137,914
Total Revenue 12,097,906 828,554
EXPENDITURESCurrent Operations General Government 4,863,907 1,027,550 Public Safety 6,674,308 - Public Works 905,994 -
Total Expenditures 12,444,209 1,027,550
Excess of Revenue Over (Under) Expenditures (346,303) (198,996)
116
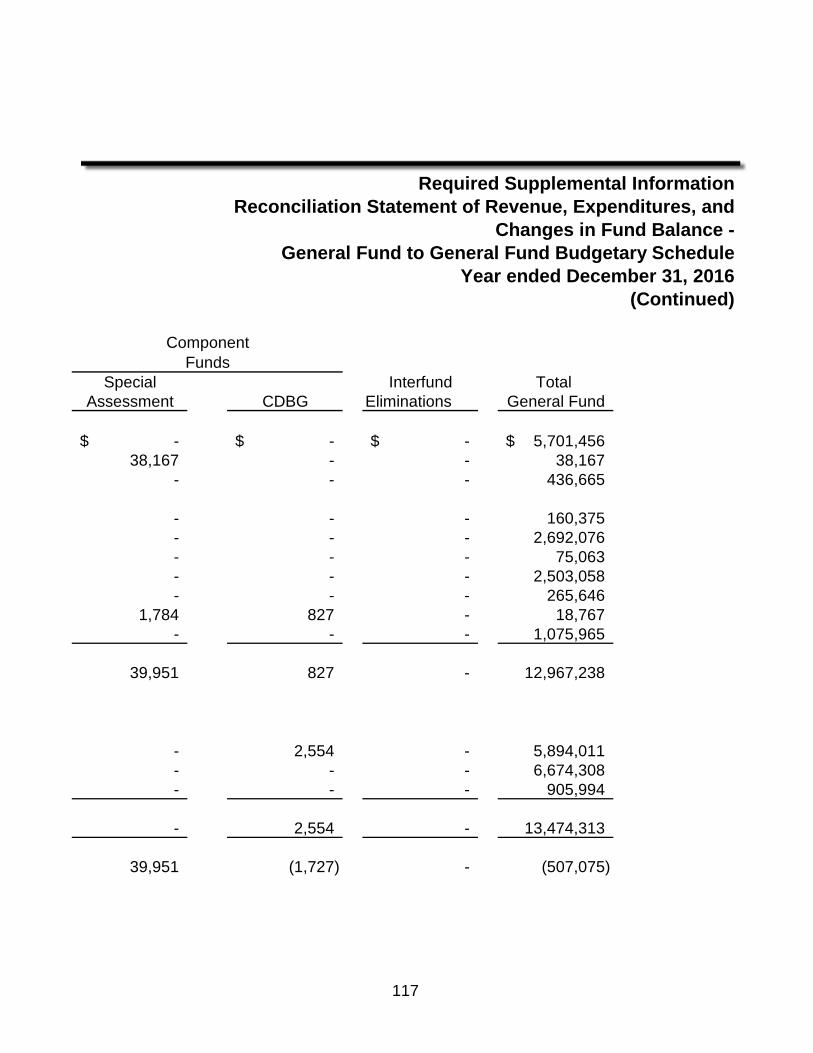
Required Supplemental InformationReconciliation Statement of Revenue, Expenditures, and
Changes in Fund Balance -General Fund to General Fund Budgetary Schedule
Year ended December 31, 2016(Continued)
Special Interfund Total Assessment CDBG Eliminations General Fund
-$ -$ -$ 5,701,456$ 38,167 - - 38,167
- - - 436,665
- - - 160,375 - - - 2,692,076 - - - 75,063 - - - 2,503,058 - - - 265,646
1,784 827 - 18,767 - - - 1,075,965
39,951 827 - 12,967,238
- 2,554 - 5,894,011 - - - 6,674,308 - - - 905,994
- 2,554 - 13,474,313
39,951 (1,727) - (507,075)
FundsComponent
117
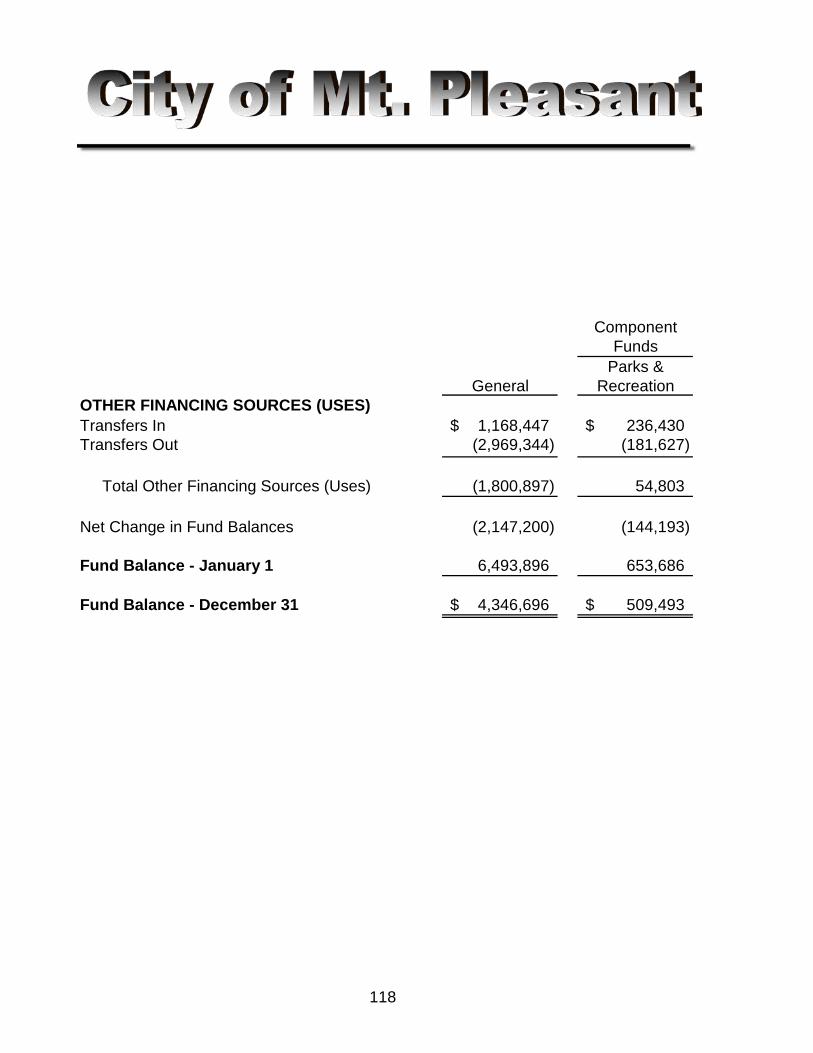
ComponentFunds
Parks &General Recreation
OTHER FINANCING SOURCES (USES)Transfers In 1,168,447$ 236,430$ Transfers Out (2,969,344) (181,627)
Total Other Financing Sources (Uses) (1,800,897) 54,803
Net Change in Fund Balances (2,147,200) (144,193)
Fund Balance - January 1 6,493,896 653,686
Fund Balance - December 31 4,346,696$ 509,493$
118
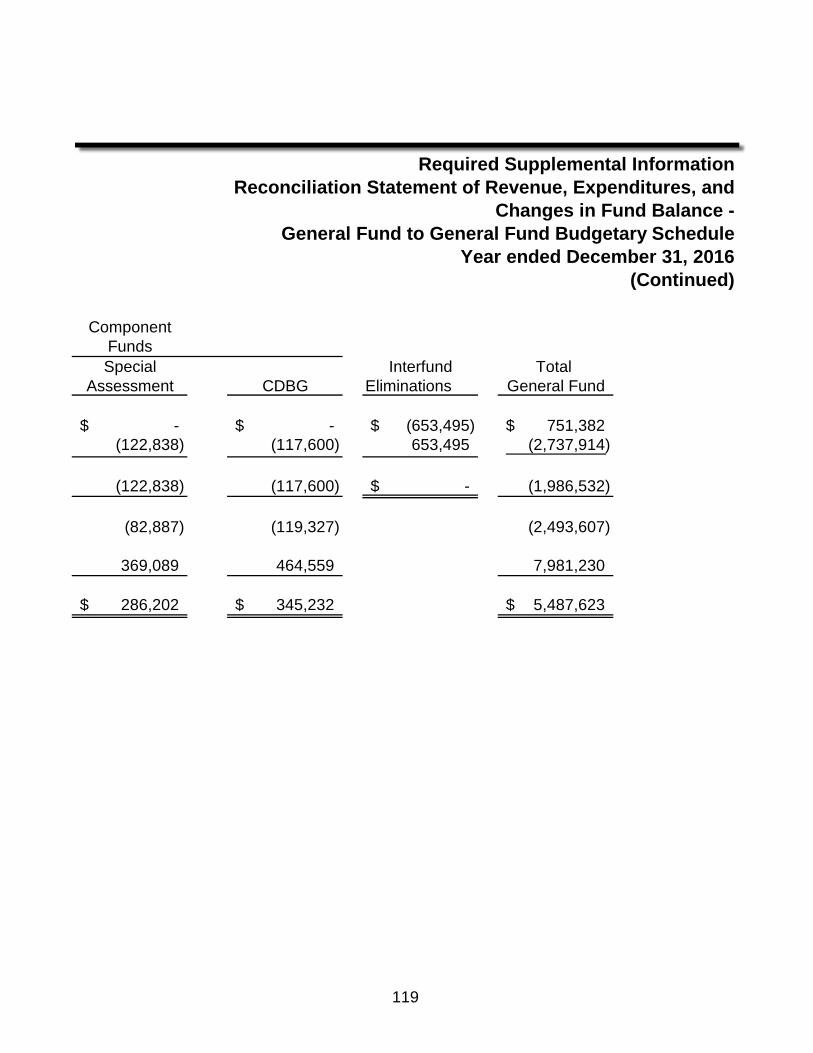
Required Supplemental InformationReconciliation Statement of Revenue, Expenditures, and
Changes in Fund Balance -General Fund to General Fund Budgetary Schedule
Year ended December 31, 2016(Continued)
ComponentFundsSpecial Interfund Total
Assessment CDBG Eliminations General Fund
-$ -$ (653,495)$ 751,382$ (122,838) (117,600) 653,495 (2,737,914)
(122,838) (117,600) -$ (1,986,532)
(82,887) (119,327) (2,493,607)
369,089 464,559 7,981,230
286,202$ 345,232$ 5,487,623$
119
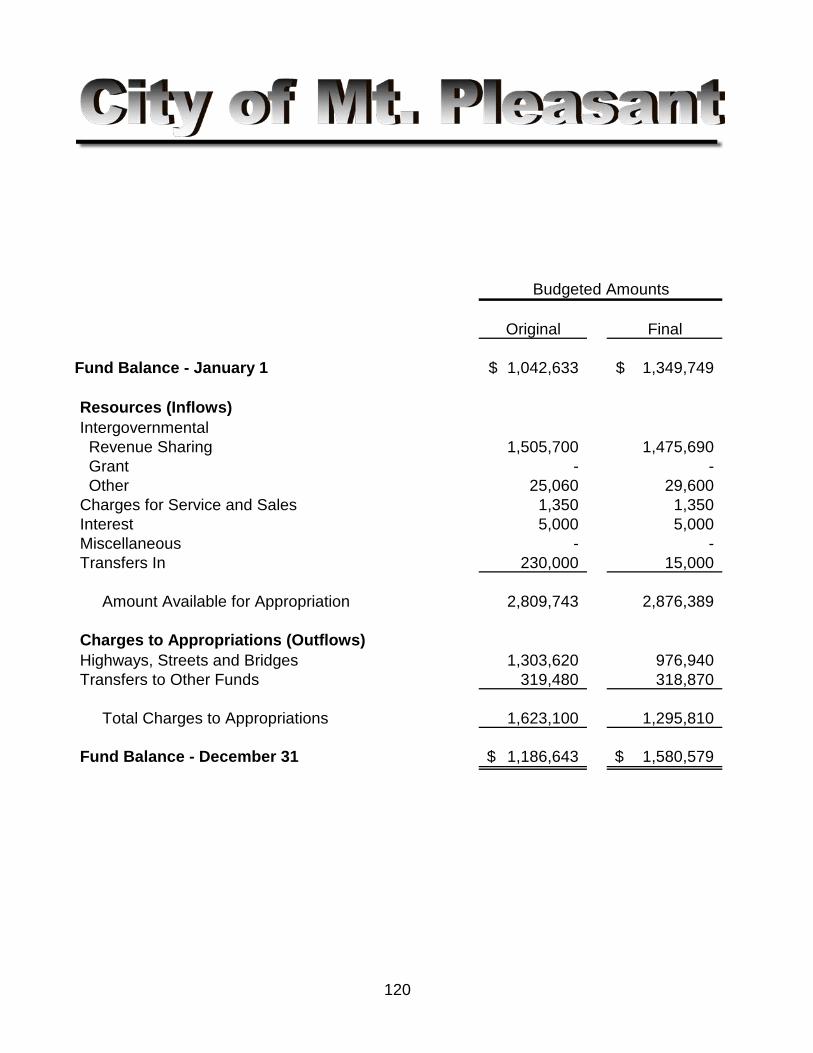
Original Final
Fund Balance - January 1 1,042,633$ 1,349,749$
Resources (Inflows)Intergovernmental Revenue Sharing 1,505,700 1,475,690 Grant - - Other 25,060 29,600 Charges for Service and Sales 1,350 1,350 Interest 5,000 5,000 Miscellaneous - - Transfers In 230,000 15,000
Amount Available for Appropriation 2,809,743 2,876,389
Charges to Appropriations (Outflows)Highways, Streets and Bridges 1,303,620 976,940 Transfers to Other Funds 319,480 318,870
Total Charges to Appropriations 1,623,100 1,295,810
Fund Balance - December 31 1,186,643$ 1,580,579$
Budgeted Amounts
120
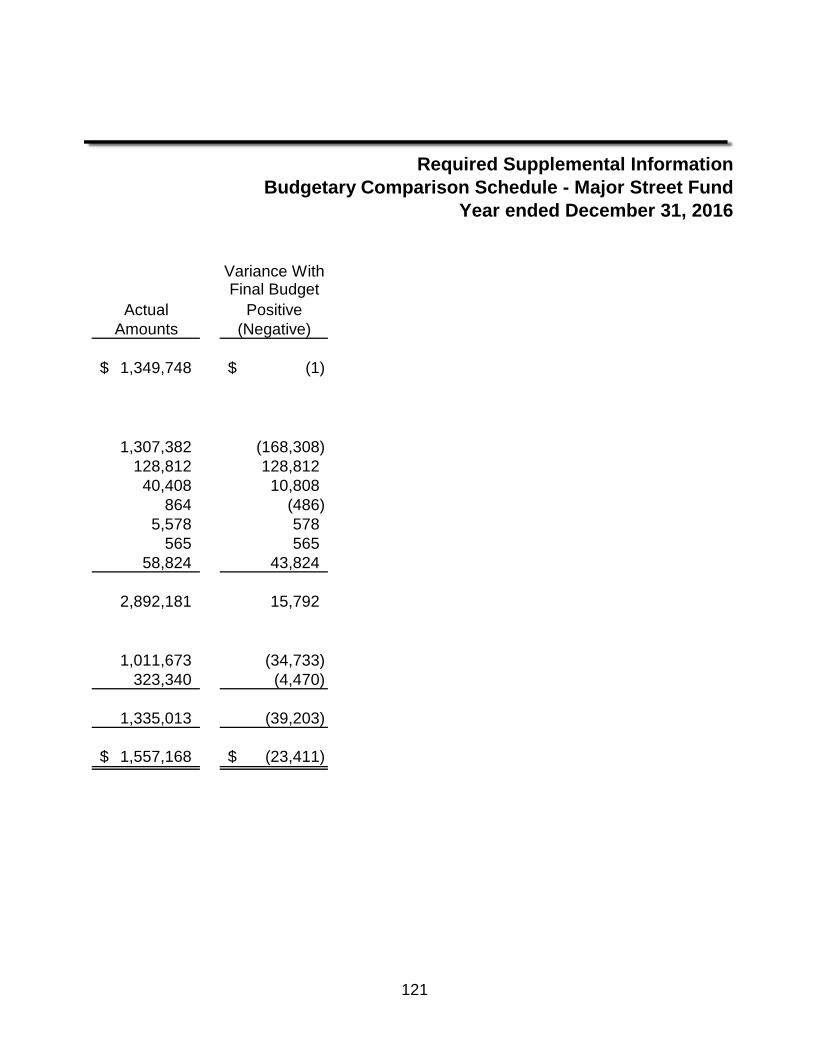
Required Supplemental InformationBudgetary Comparison Schedule - Major Street Fund
Year ended December 31, 2016
Variance WithFinal Budget
Actual PositiveAmounts (Negative)
1,349,748$ (1)$
1,307,382 (168,308) 128,812 128,812
40,408 10,808 864 (486)
5,578 578 565 565
58,824 43,824
2,892,181 15,792
1,011,673 (34,733) 323,340 (4,470)
1,335,013 (39,203)
1,557,168$ (23,411)$
121
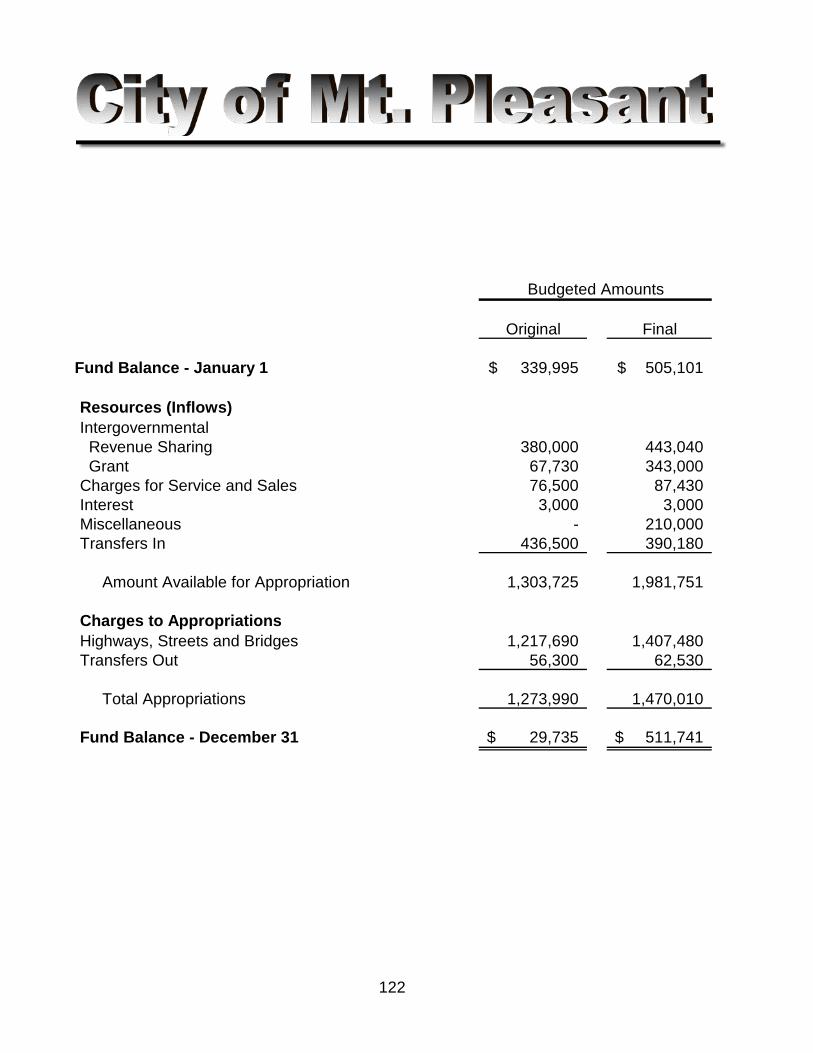
Original Final
Fund Balance - January 1 339,995$ 505,101$
Resources (Inflows)Intergovernmental Revenue Sharing 380,000 443,040 Grant 67,730 343,000 Charges for Service and Sales 76,500 87,430 Interest 3,000 3,000 Miscellaneous - 210,000 Transfers In 436,500 390,180
Amount Available for Appropriation 1,303,725 1,981,751
Charges to AppropriationsHighways, Streets and Bridges 1,217,690 1,407,480 Transfers Out 56,300 62,530
Total Appropriations 1,273,990 1,470,010
Fund Balance - December 31 29,735$ 511,741$
Budgeted Amounts
122
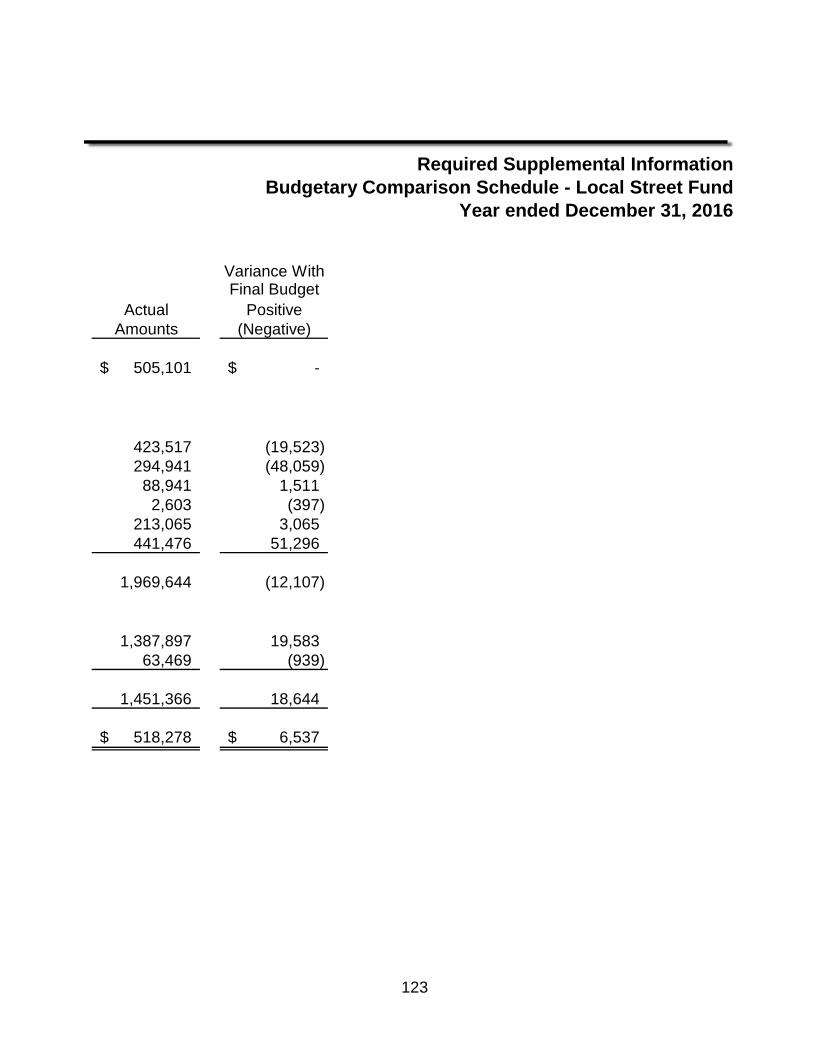
Required Supplemental InformationBudgetary Comparison Schedule - Local Street Fund
Year ended December 31, 2016
Variance WithFinal Budget
Actual PositiveAmounts (Negative)
505,101$ -$
423,517 (19,523) 294,941 (48,059)
88,941 1,511 2,603 (397)
213,065 3,065 441,476 51,296
1,969,644 (12,107)
1,387,897 19,583 63,469 (939)
1,451,366 18,644
518,278$ 6,537$
123
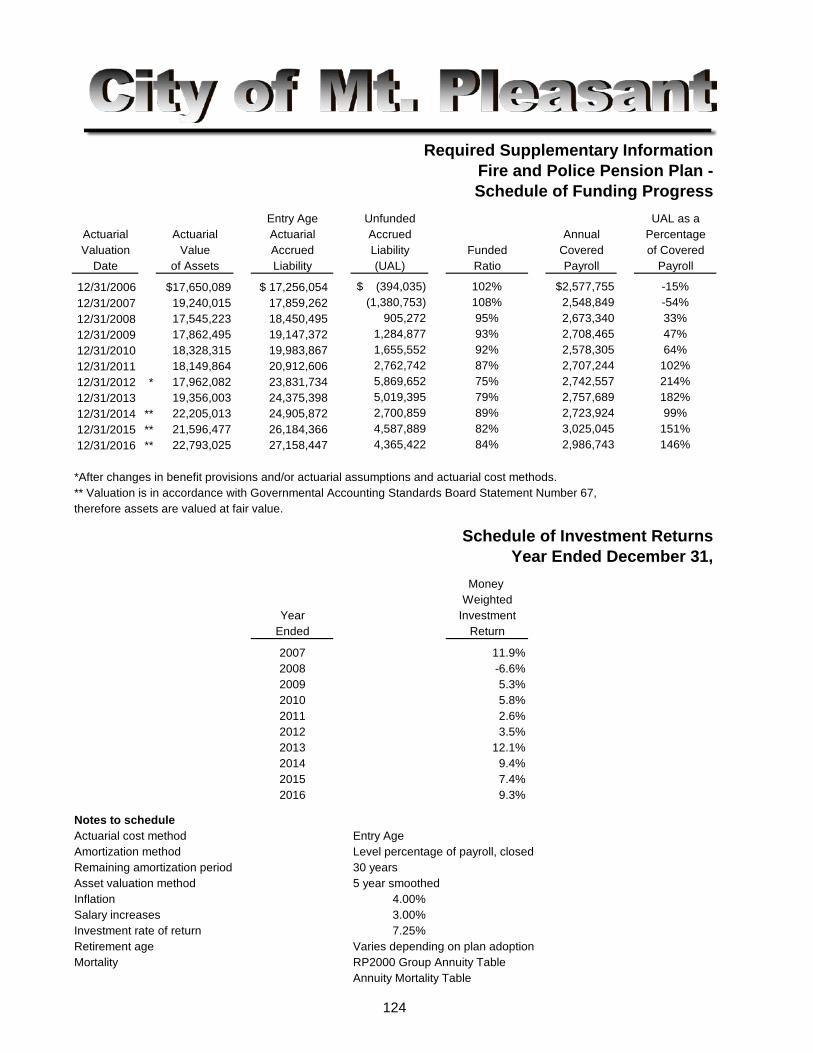
Required Supplementary InformationFire and Police Pension Plan -Schedule of Funding Progress
Entry Age Unfunded UAL as aActuarial Actuarial Actuarial Accrued Annual PercentageValuation Value Accrued Liability Funded Covered of Covered
Date of Assets Liability (UAL) Ratio Payroll Payroll
12/31/2006 $17,650,089 $ 17,256,054 $ (394,035) 102% $2,577,755 -15%12/31/2007 19,240,015 17,859,262 (1,380,753) 108% 2,548,849 -54%12/31/2008 17,545,223 18,450,495 905,272 95% 2,673,340 33%12/31/2009 17,862,495 19,147,372 1,284,877 93% 2,708,465 47%12/31/2010 18,328,315 19,983,867 1,655,552 92% 2,578,305 64%12/31/2011 18,149,864 20,912,606 2,762,742 87% 2,707,244 102%12/31/2012 * 17,962,082 23,831,734 5,869,652 75% 2,742,557 214%12/31/2013 19,356,003 24,375,398 5,019,395 79% 2,757,689 182%12/31/2014 ** 22,205,013 24,905,872 2,700,859 89% 2,723,924 99%12/31/2015 ** 21,596,477 26,184,366 4,587,889 82% 3,025,045 151%12/31/2016 ** 22,793,025 27,158,447 4,365,422 84% 2,986,743 146%
** Valuation is in accordance with Governmental Accounting Standards Board Statement Number 67, therefore assets are valued at fair value.
Schedule of Investment ReturnsYear Ended December 31,
Money Weighted
Year InvestmentEnded Return
2007 11.9%2008 -6.6%2009 5.3%2010 5.8%2011 2.6%2012 3.5%2013 12.1%2014 9.4%2015 7.4%2016 9.3%
Notes to schedule Actuarial cost method Entry AgeAmortization method Level percentage of payroll, closedRemaining amortization period 30 yearsAsset valuation method 5 year smoothedInflation 4.00%Salary increases 3.00%Investment rate of return 7.25%Retirement age Varies depending on plan adoptionMortality RP2000 Group Annuity Table
Annuity Mortality Table
*After changes in benefit provisions and/or actuarial assumptions and actuarial cost methods.
124
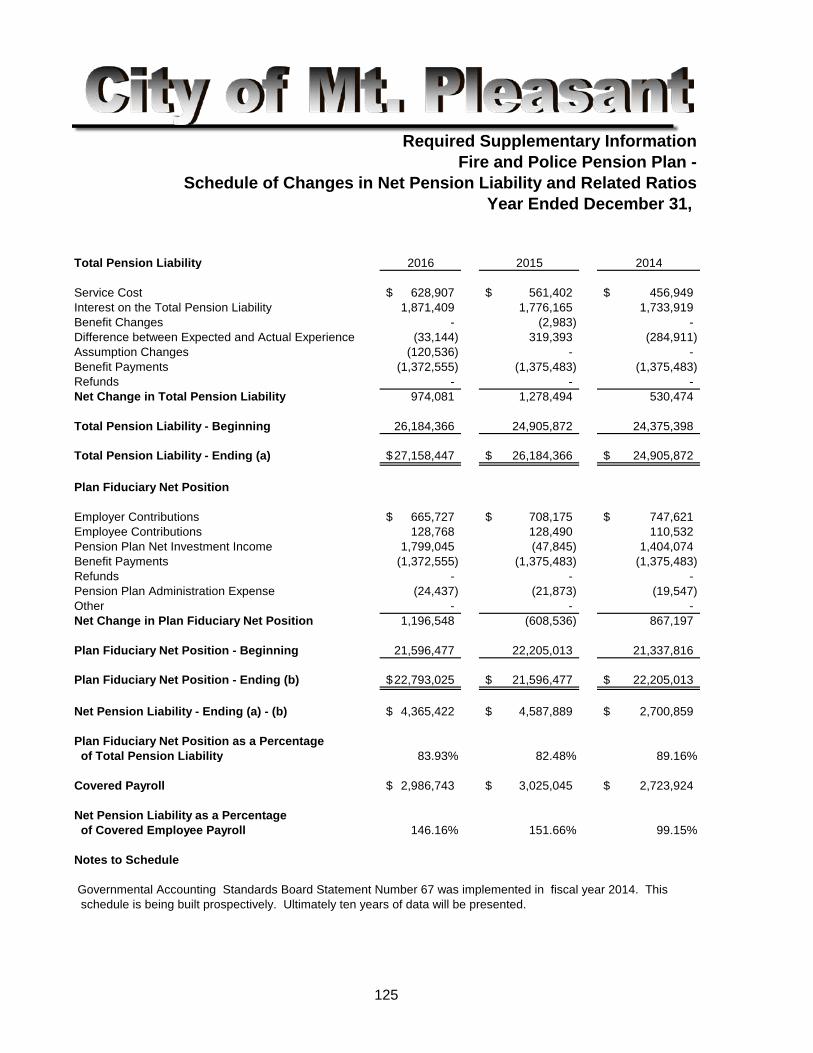
Required Supplementary InformationFire and Police Pension Plan -
Schedule of Changes in Net Pension Liability and Related RatiosYear Ended December 31,
Total Pension Liability 2016 2015 2014
Service Cost 628,907$ 561,402$ 456,949$ Interest on the Total Pension Liability 1,871,409 1,776,165 1,733,919 Benefit Changes - (2,983) - Difference between Expected and Actual Experience (33,144) 319,393 (284,911) Assumption Changes (120,536) - - Benefit Payments (1,372,555) (1,375,483) (1,375,483) Refunds - - - Net Change in Total Pension Liability 974,081 1,278,494 530,474
Total Pension Liability - Beginning 26,184,366 24,905,872 24,375,398
Total Pension Liability - Ending (a) 27,158,447$ 26,184,366$ 24,905,872$
Plan Fiduciary Net Position
Employer Contributions 665,727$ 708,175$ 747,621$ Employee Contributions 128,768 128,490 110,532 Pension Plan Net Investment Income 1,799,045 (47,845) 1,404,074 Benefit Payments (1,372,555) (1,375,483) (1,375,483) Refunds - - - Pension Plan Administration Expense (24,437) (21,873) (19,547) Other - - - Net Change in Plan Fiduciary Net Position 1,196,548 (608,536) 867,197
Plan Fiduciary Net Position - Beginning 21,596,477 22,205,013 21,337,816
Plan Fiduciary Net Position - Ending (b) 22,793,025$ 21,596,477$ 22,205,013$
Net Pension Liability - Ending (a) - (b) 4,365,422$ 4,587,889$ 2,700,859$
Plan Fiduciary Net Position as a Percentage of Total Pension Liability 83.93% 82.48% 89.16%
Covered Payroll 2,986,743$ 3,025,045$ 2,723,924$
Net Pension Liability as a Percentage of Covered Employee Payroll 146.16% 151.66% 99.15%
Notes to Schedule
Governmental Accounting Standards Board Statement Number 67 was implemented in fiscal year 2014. This schedule is being built prospectively. Ultimately ten years of data will be presented.
125
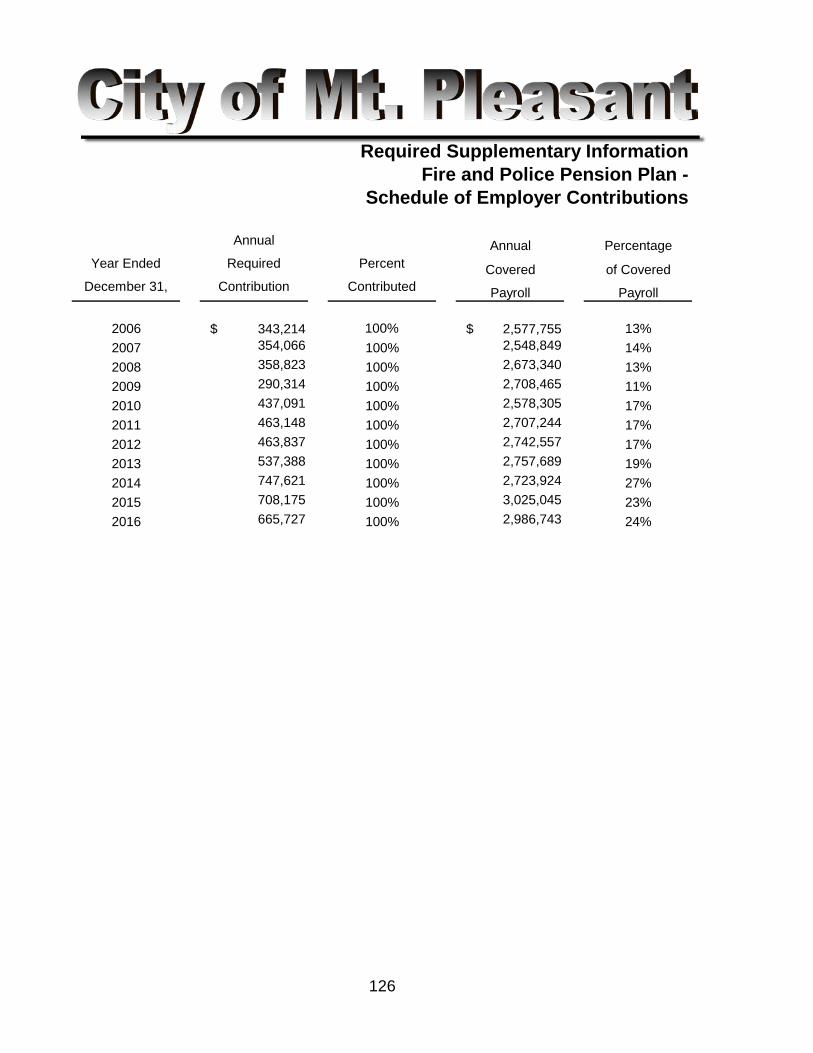
Required Supplementary InformationFire and Police Pension Plan -
Schedule of Employer Contributions
Annual Annual PercentageYear Ended Required Percent Covered of Covered
December 31, Contribution Contributed Payroll Payroll
2006 $ 343,214 100% $ 2,577,755 13%2007 354,066 100% 2,548,849 14%2008 358,823 100% 2,673,340 13%2009 290,314 100% 2,708,465 11%2010 437,091 100% 2,578,305 17%2011 463,148 100% 2,707,244 17%2012 463,837 100% 2,742,557 17%2013 537,388 100% 2,757,689 19%2014 747,621 100% 2,723,924 27%2015 708,175 100% 3,025,045 23%2016 665,727 100% 2,986,743 24%
126
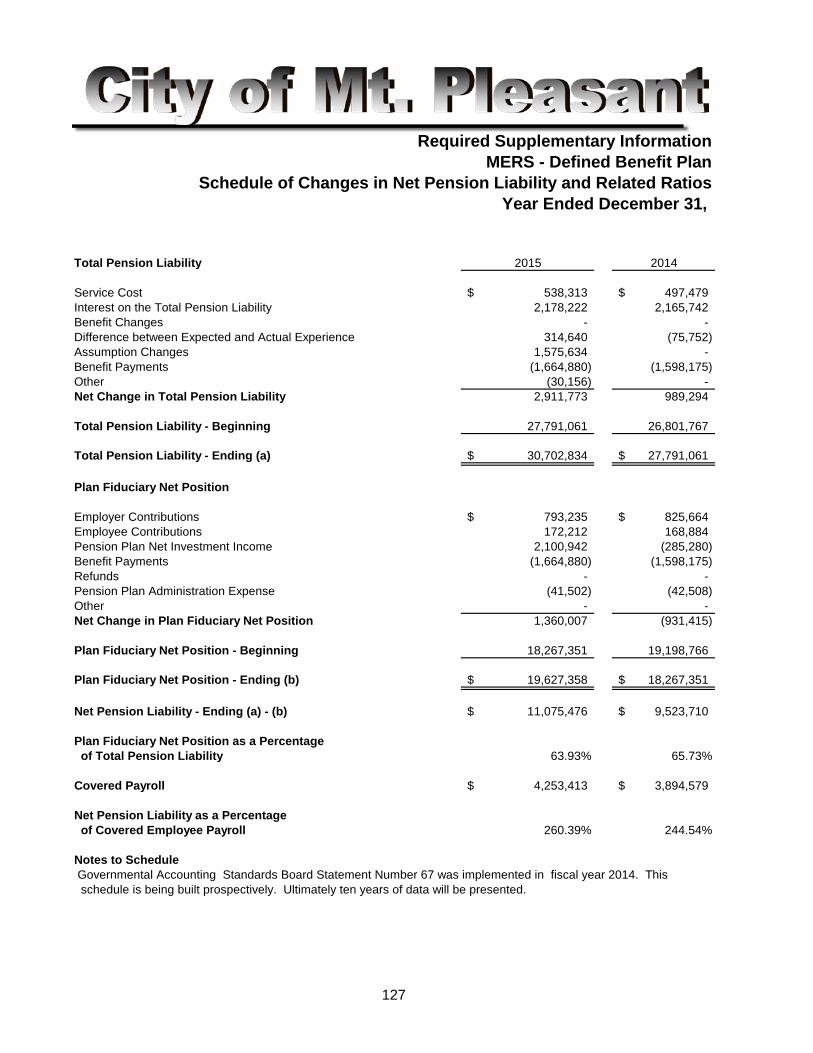
Required Supplementary InformationMERS - Defined Benefit Plan
Schedule of Changes in Net Pension Liability and Related RatiosYear Ended December 31,
Total Pension Liability 2015 2014
Service Cost 538,313$ 497,479$ Interest on the Total Pension Liability 2,178,222 2,165,742 Benefit Changes - - Difference between Expected and Actual Experience 314,640 (75,752) Assumption Changes 1,575,634 - Benefit Payments (1,664,880) (1,598,175) Other (30,156) - Net Change in Total Pension Liability 2,911,773 989,294
Total Pension Liability - Beginning 27,791,061 26,801,767
Total Pension Liability - Ending (a) 30,702,834$ 27,791,061$
Plan Fiduciary Net Position
Employer Contributions 793,235$ 825,664$ Employee Contributions 172,212 168,884 Pension Plan Net Investment Income 2,100,942 (285,280) Benefit Payments (1,664,880) (1,598,175) Refunds - - Pension Plan Administration Expense (41,502) (42,508) Other - - Net Change in Plan Fiduciary Net Position 1,360,007 (931,415)
Plan Fiduciary Net Position - Beginning 18,267,351 19,198,766
Plan Fiduciary Net Position - Ending (b) 19,627,358$ 18,267,351$
Net Pension Liability - Ending (a) - (b) 11,075,476$ 9,523,710$
Plan Fiduciary Net Position as a Percentage of Total Pension Liability 63.93% 65.73%
Covered Payroll 4,253,413$ 3,894,579$
Net Pension Liability as a Percentage of Covered Employee Payroll 260.39% 244.54%
Notes to Schedule Governmental Accounting Standards Board Statement Number 67 was implemented in fiscal year 2014. This schedule is being built prospectively. Ultimately ten years of data will be presented.
127
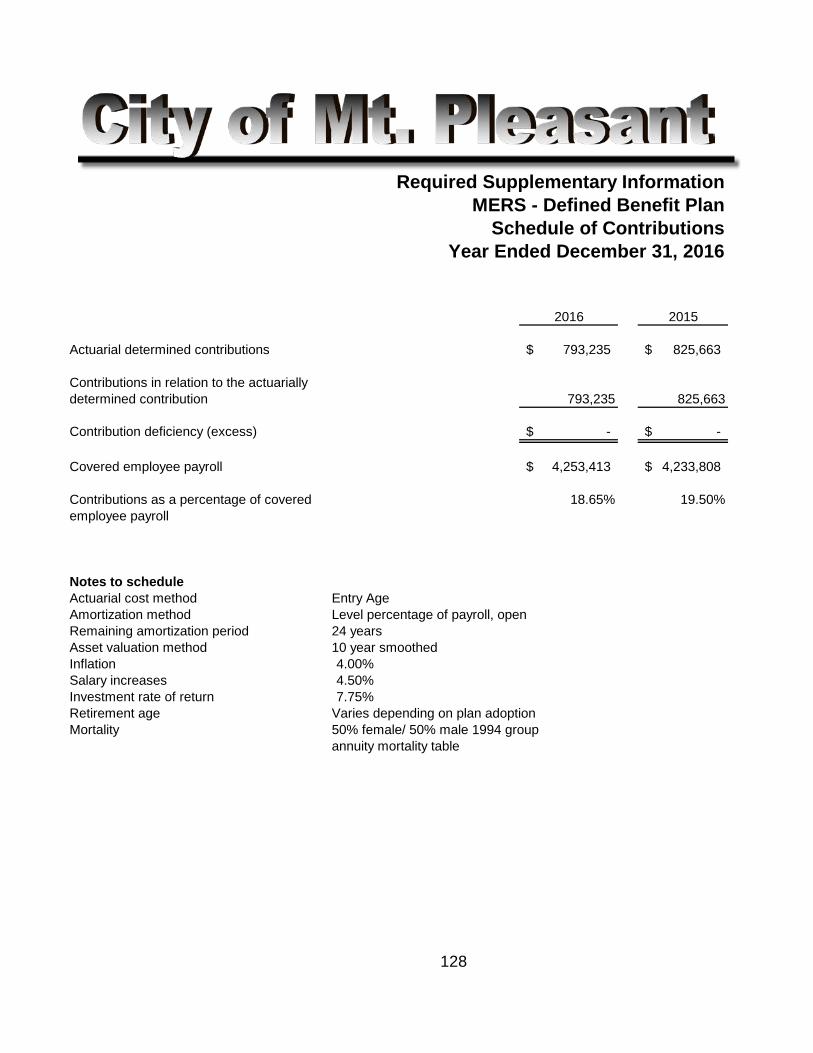
Required Supplementary InformationMERS - Defined Benefit Plan
Schedule of ContributionsYear Ended December 31, 2016
2016 2015
Actuarial determined contributions 793,235$ 825,663$
Contributions in relation to the actuarially determined contribution 793,235 825,663
Contribution deficiency (excess) -$ -$
Covered employee payroll 4,253,413$ 4,233,808$
Contributions as a percentage of covered 18.65% 19.50%employee payroll
Notes to scheduleActuarial cost method Entry AgeAmortization method Level percentage of payroll, openRemaining amortization period 24 yearsAsset valuation method 10 year smoothedInflation 4.00%Salary increases 4.50%Investment rate of return 7.75%Retirement age Varies depending on plan adoptionMortality 50% female/ 50% male 1994 group
annuity mortality table
128

Required Supplementary InformationEmployer Paid Health Care
Schedule of Funding Progress
Entry Age Unfunded UAL as aActuarial Actuarial Actuarial Accrued Annual PercentageValuation Value Accrued Liability Funded Covered of Covered
Date of Assets Liability (UAL) Ratio Payroll Payroll
2008 $321,065 $920,544 $599,479 34.9% $1,880,052 31.8%2011 667,430 1,241,480 574,050 53.7% 1,899,425 30.2%2014 1,089,569 1,478,517 389,948 74.0% 1,695,700 26.3%
Other Post Employment BenefitsSchedule of Funding Progress
Entry Age Unfunded UAL as aActuarial Actuarial Actuarial Accrued Annual PercentageValuation Value Accrued Liability Funded Covered of Covered
Date of Assets Liability (UAL) Ratio Payroll Payroll
2008 $0 $3,146,627 $ 3,146,627 0.0% $8,191,746 38.4%2011 0 3,490,912 3,490,912 0.0% 6,719,063 52.0%2014 0 3,586,834 3,589,834 0.0% 7,067,236 50.8%
129
Required Supplementary InformationNotes to the Required Schedules
BUDGETARY COMPARISON SCHEDULE
The budgets for all funds are adopted on a basis consistent with accounting principles generally accepted in the United States of America. The budget is adopted with legal budgetary control at the fund level (i.e. expenditures may not exceed budgeted appropriations at the fund level), except the General Fund, which is adopted at the division level. Budgets are adopted in accordance Public Act 493. In accordance with this Act, budgets are adopted on an annual basis for General and Special Revenue funds. Informational summaries are adopted for Capital Projects, Debt Service, Proprietary Funds and Component Units as a management control device. Appropriations lapse at year end.
The General Fund includes the Parks and Recreations, Special Assessment and Community Development Block Grant funds for financial reporting purposes which have a separate legally adopted budget.
MANAGEMENT DISCUSSION AND ANALYSIS
Management Discussion and Analysis can be found on pages 11-26 of this report.
130

131
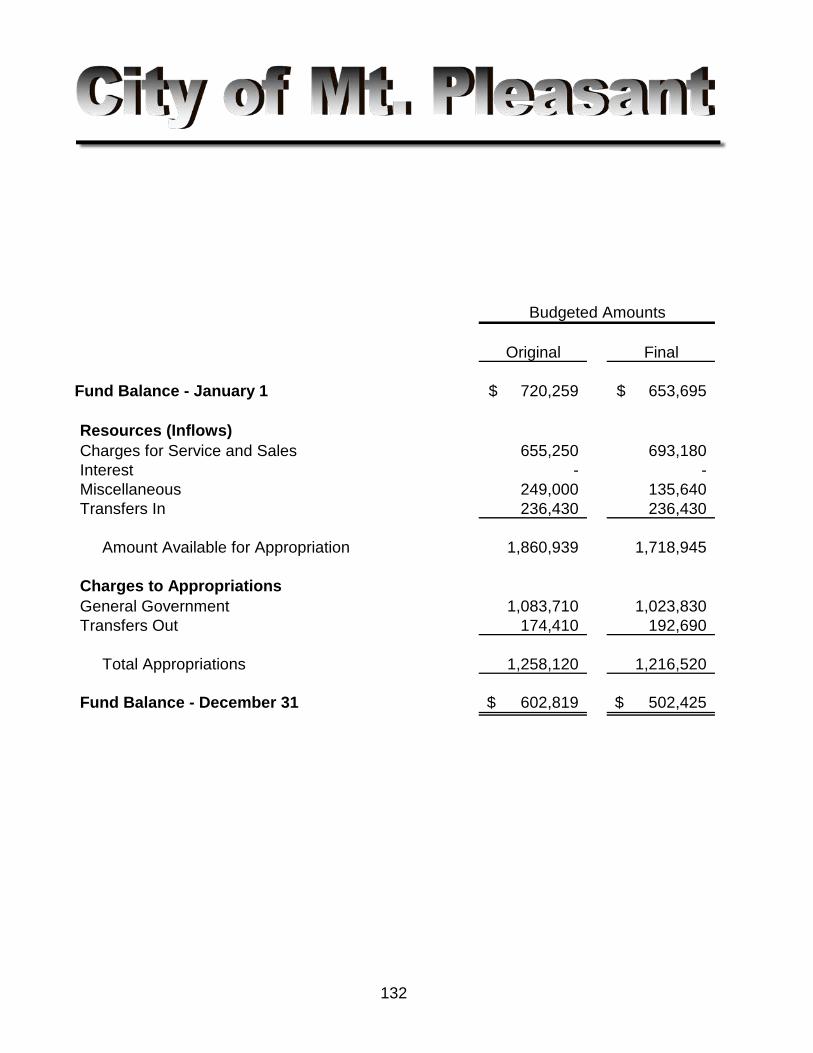
Original Final
Fund Balance - January 1 720,259$ 653,695$
Resources (Inflows)Charges for Service and Sales 655,250 693,180 Interest - - Miscellaneous 249,000 135,640 Transfers In 236,430 236,430
Amount Available for Appropriation 1,860,939 1,718,945
Charges to AppropriationsGeneral Government 1,083,710 1,023,830 Transfers Out 174,410 192,690
Total Appropriations 1,258,120 1,216,520
Fund Balance - December 31 602,819$ 502,425$
Budgeted Amounts
132
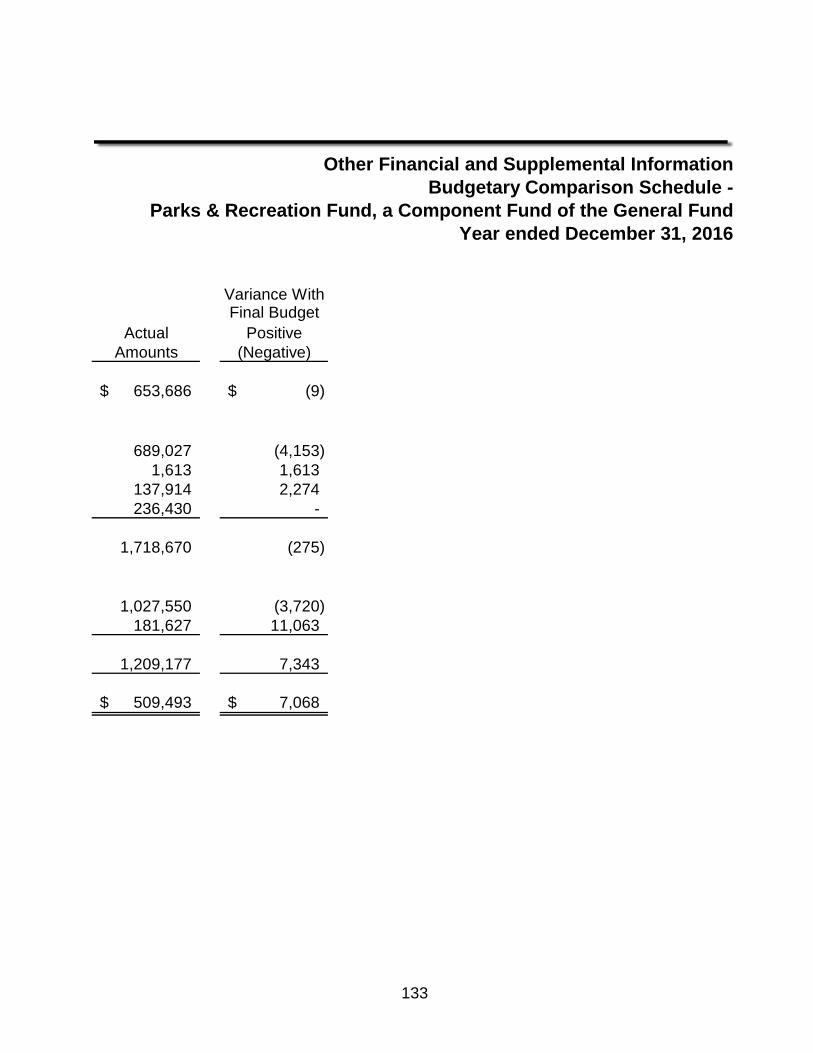
Other Financial and Supplemental InformationBudgetary Comparison Schedule -
Parks & Recreation Fund, a Component Fund of the General FundYear ended December 31, 2016
Variance WithFinal Budget
Actual PositiveAmounts (Negative)
653,686$ (9)$
689,027 (4,153) 1,613 1,613
137,914 2,274 236,430 -
1,718,670 (275)
1,027,550 (3,720) 181,627 11,063
1,209,177 7,343
509,493$ 7,068$
133
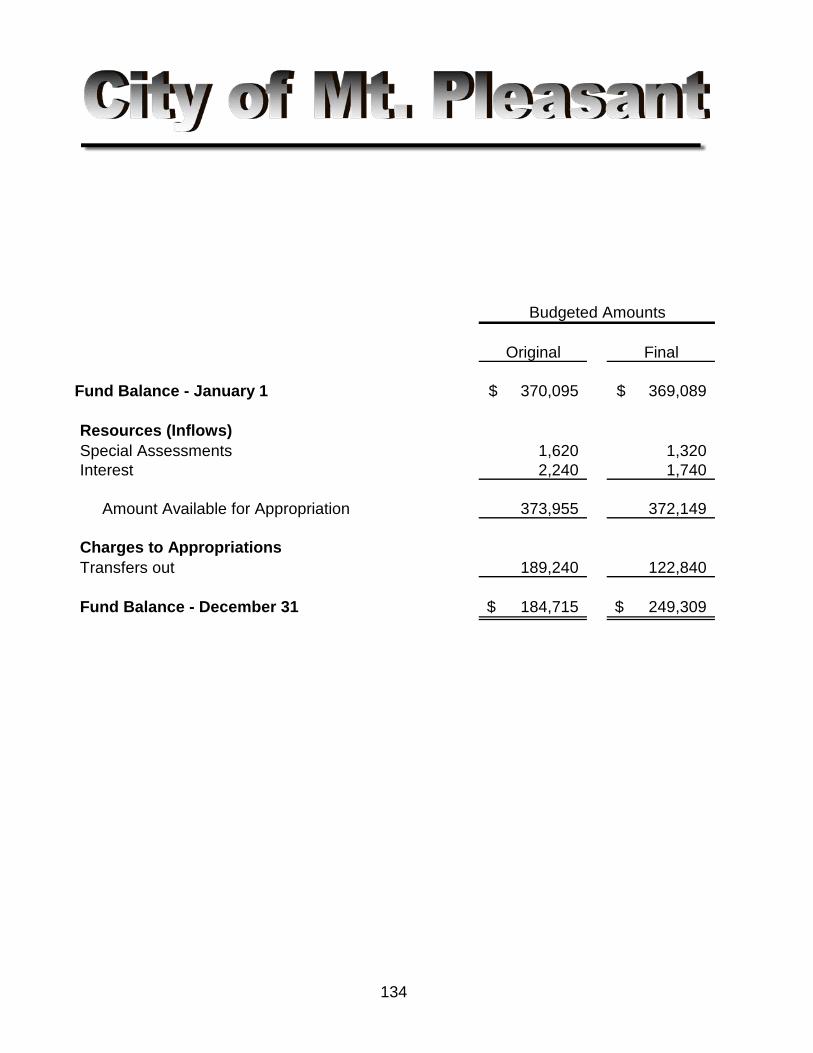
Original Final
Fund Balance - January 1 370,095$ 369,089$
Resources (Inflows)Special Assessments 1,620 1,320 Interest 2,240 1,740
Amount Available for Appropriation 373,955 372,149
Charges to AppropriationsTransfers out 189,240 122,840
Fund Balance - December 31 184,715$ 249,309$
Budgeted Amounts
134
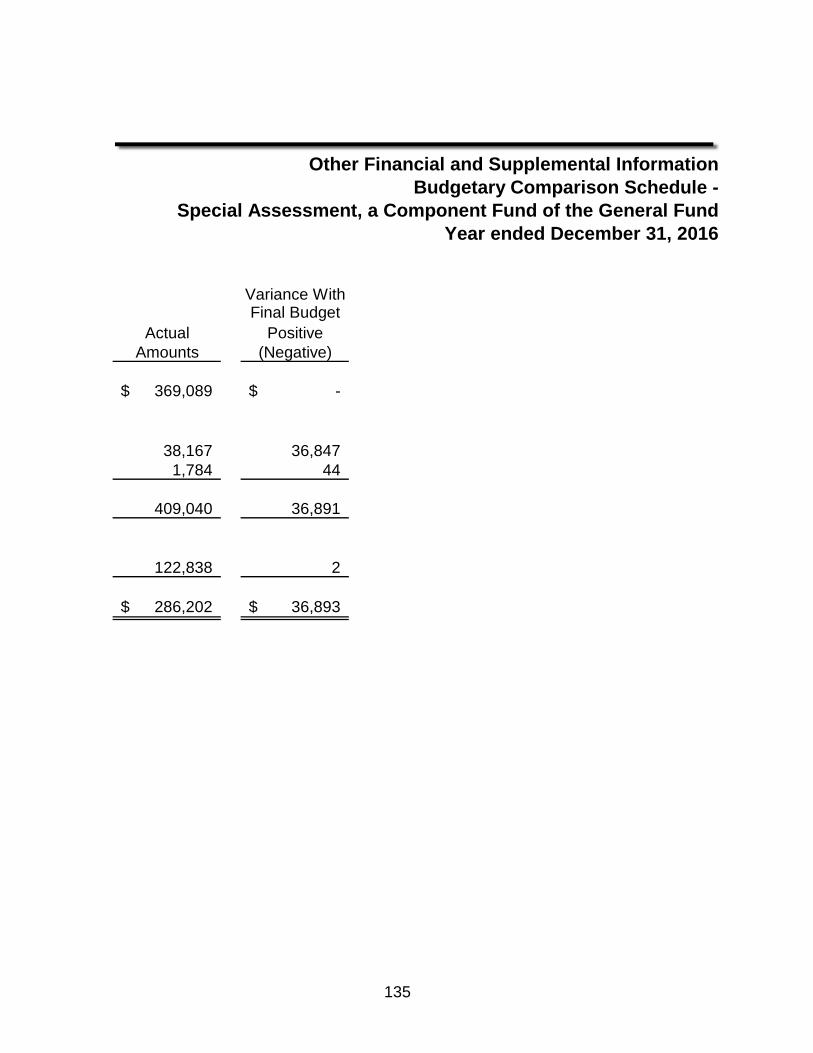
Other Financial and Supplemental InformationBudgetary Comparison Schedule -
Special Assessment, a Component Fund of the General FundYear ended December 31, 2016
Variance WithFinal Budget
Actual PositiveAmounts (Negative)
369,089$ -$
38,167 36,847 1,784 44
409,040 36,891
122,838 2
286,202$ 36,893$
135
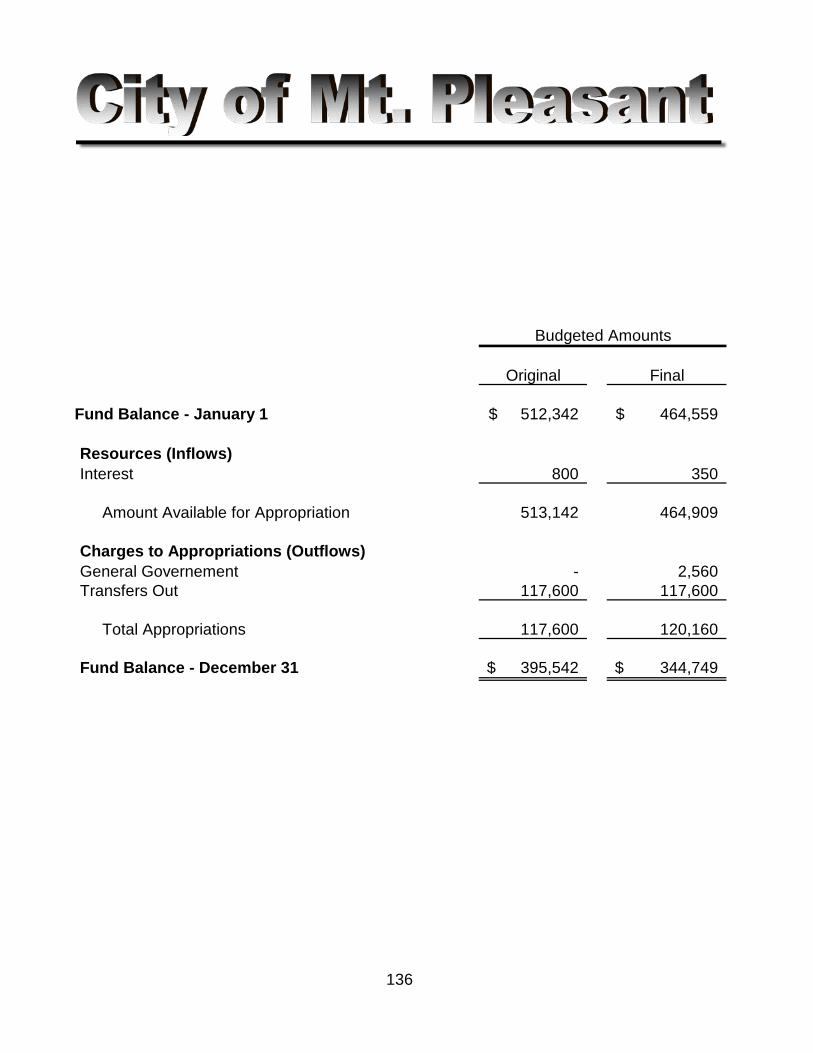
Original Final
Fund Balance - January 1 512,342$ 464,559$
Resources (Inflows)Interest 800 350
Amount Available for Appropriation 513,142 464,909
Charges to Appropriations (Outflows)General Governement - 2,560 Transfers Out 117,600 117,600
Total Appropriations 117,600 120,160
Fund Balance - December 31 395,542$ 344,749$
Budgeted Amounts
136
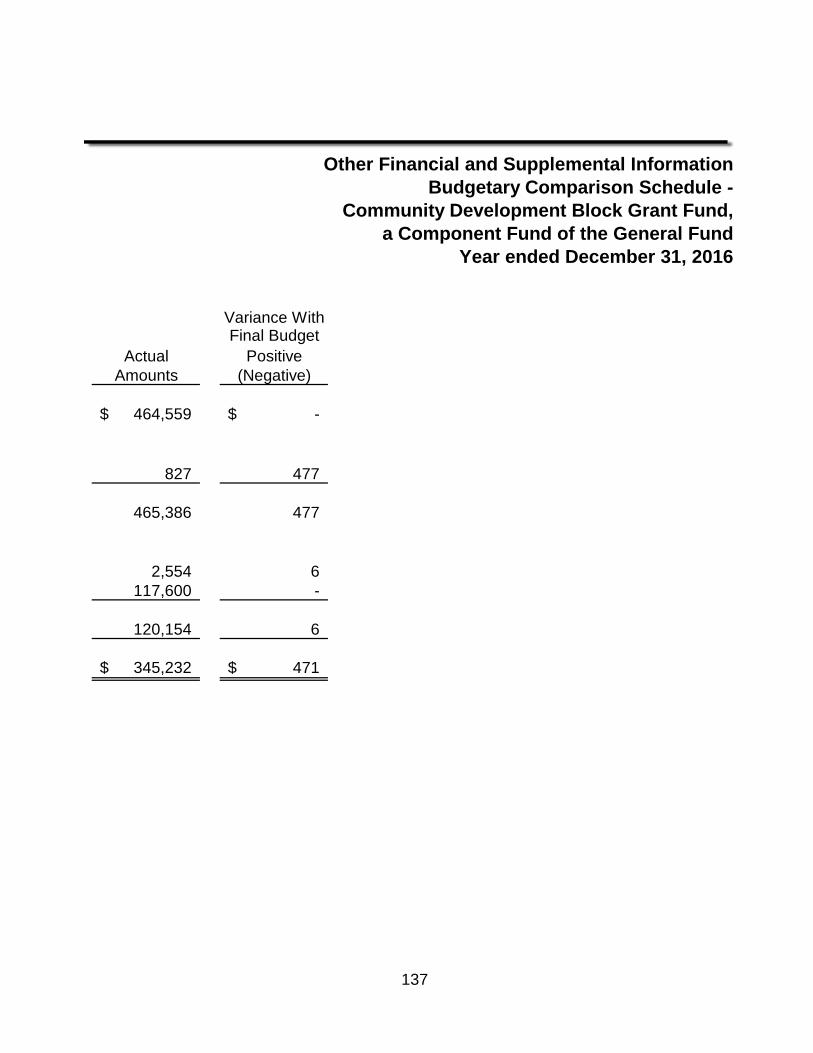
Other Financial and Supplemental InformationBudgetary Comparison Schedule -
Community Development Block Grant Fund,a Component Fund of the General Fund
Year ended December 31, 2016
Variance WithFinal Budget
Actual PositiveAmounts (Negative)
464,559$ -$
827 477
465,386 477
2,554 6 117,600 -
120,154 6
345,232$ 471$
137
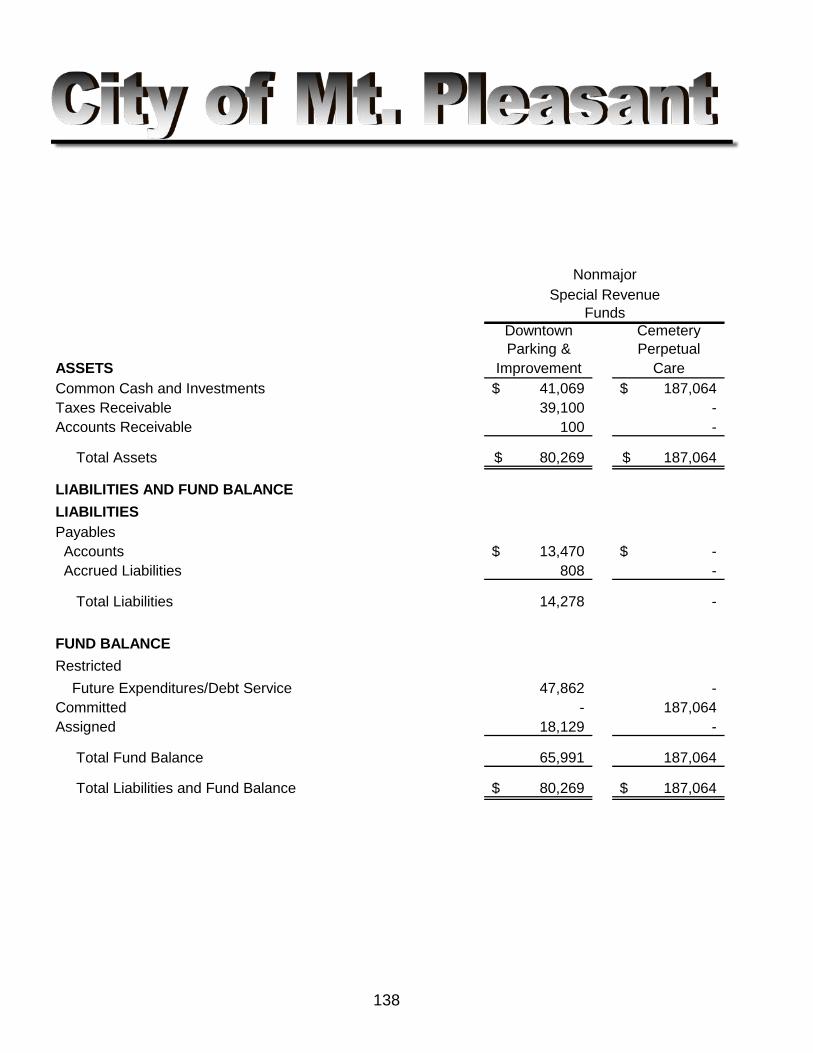
Downtown CemeteryParking & Perpetual
ASSETS Improvement CareCommon Cash and Investments 41,069$ 187,064$ Taxes Receivable 39,100 - Accounts Receivable 100 -
Total Assets 80,269$ 187,064$
LIABILITIES AND FUND BALANCE LIABILITIES Payables Accounts 13,470$ -$ Accrued Liabilities 808 -
Total Liabilities 14,278 -
FUND BALANCERestricted Future Expenditures/Debt Service 47,862 - Committed - 187,064 Assigned 18,129 -
Total Fund Balance 65,991 187,064
Total Liabilities and Fund Balance 80,269$ 187,064$
138
Special RevenueFunds
Nonmajor
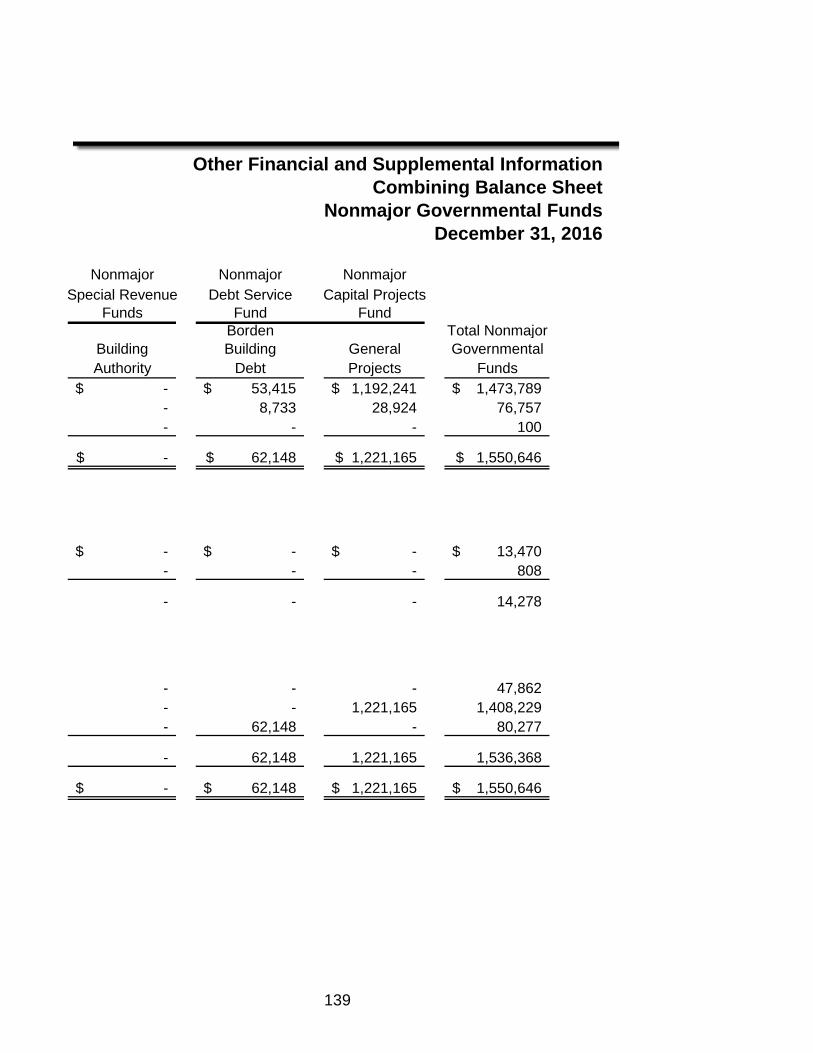
Other Financial and Supplemental InformationCombining Balance Sheet
Nonmajor Governmental FundsDecember 31, 2016
Nonmajor Nonmajor NonmajorSpecial Revenue Debt Service Capital Projects
Funds Fund FundBorden Total Nonmajor
Building Building General GovernmentalAuthority Debt Projects Funds
-$ 53,415$ 1,192,241$ 1,473,789$ - 8,733 28,924 76,757 - - - 100
-$ 62,148$ 1,221,165$ 1,550,646$
-$ -$ -$ 13,470$ - - - 808
- - - 14,278
- - - 47,862 - - 1,221,165 1,408,229 - 62,148 - 80,277
- 62,148 1,221,165 1,536,368
-$ 62,148$ 1,221,165$ 1,550,646$
139
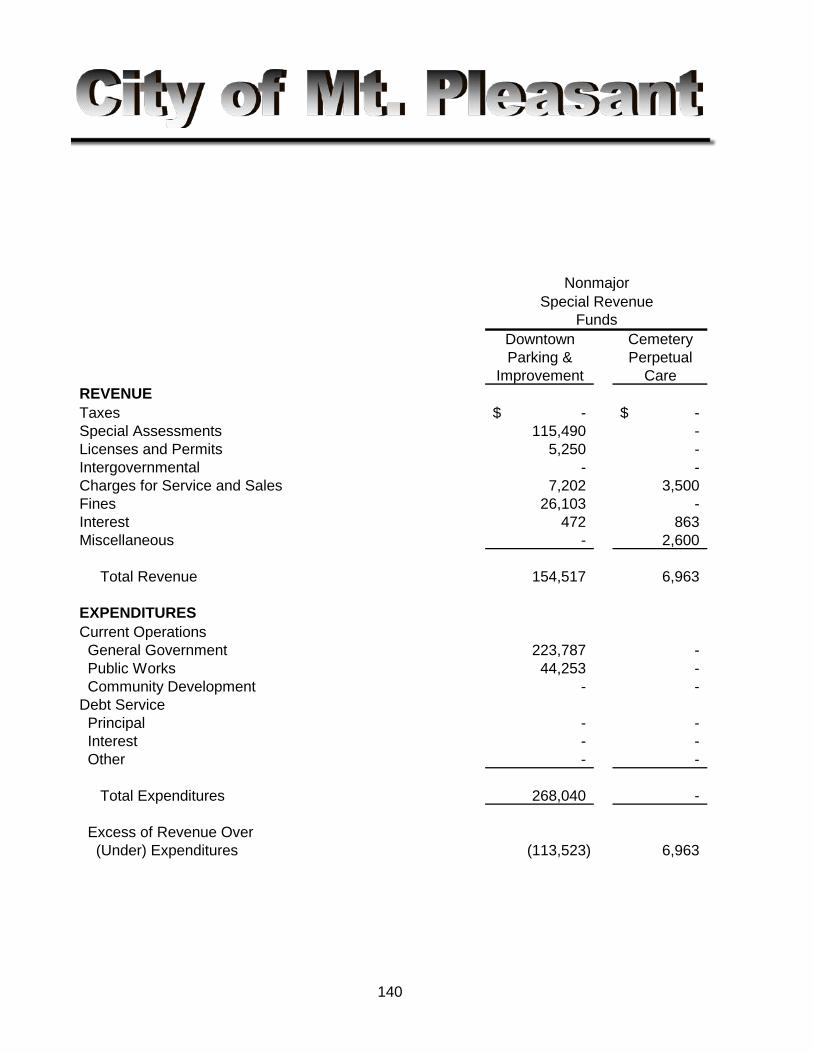
Downtown CemeteryParking & Perpetual
Improvement CareREVENUETaxes -$ -$ Special Assessments 115,490 - Licenses and Permits 5,250 - Intergovernmental - - Charges for Service and Sales 7,202 3,500 Fines 26,103 - Interest 472 863 Miscellaneous - 2,600
Total Revenue 154,517 6,963
EXPENDITURESCurrent Operations General Government 223,787 - Public Works 44,253 - Community Development - - Debt Service Principal - - Interest - - Other - -
Total Expenditures 268,040 -
Excess of Revenue Over (Under) Expenditures (113,523) 6,963
NonmajorSpecial Revenue
Funds
140
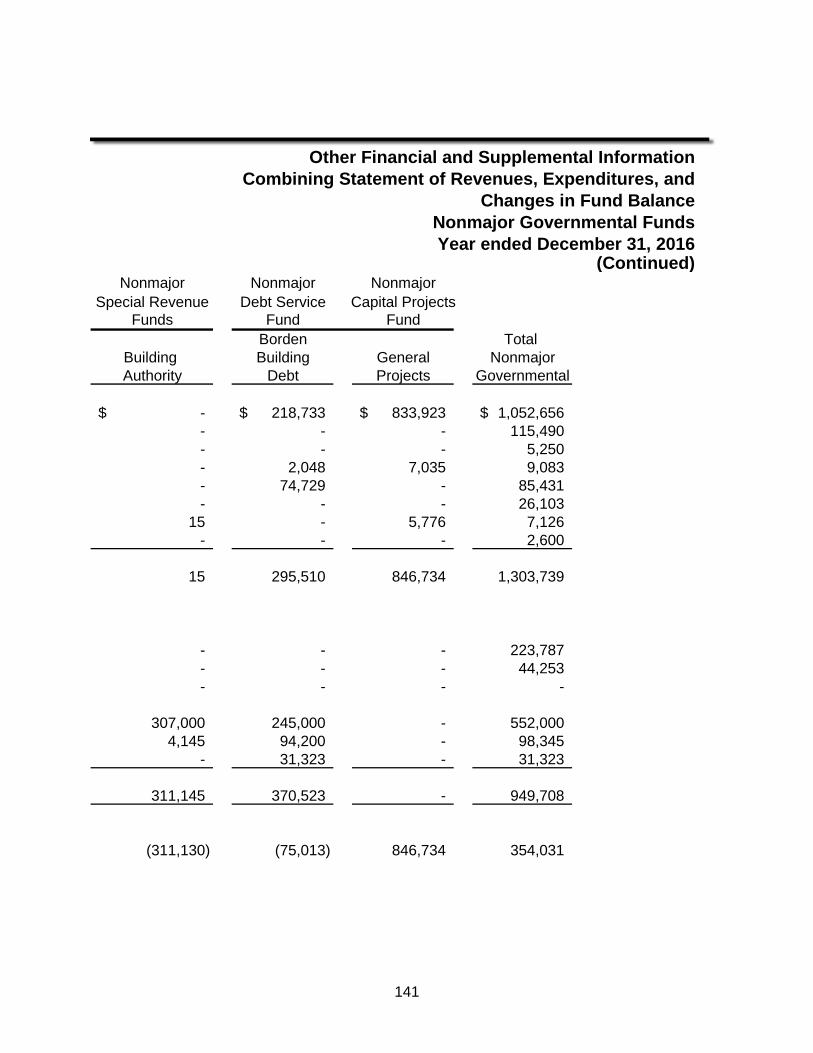
Other Financial and Supplemental InformationCombining Statement of Revenues, Expenditures, and
Changes in Fund BalanceNonmajor Governmental FundsYear ended December 31, 2016
(Continued)Nonmajor Nonmajor Nonmajor
Special Revenue Debt Service Capital ProjectsFunds Fund Fund
Borden Total Building Building General NonmajorAuthority Debt Projects Governmental
-$ 218,733$ 833,923$ 1,052,656$ - - - 115,490 - - - 5,250 - 2,048 7,035 9,083 - 74,729 - 85,431 - - - 26,103
15 - 5,776 7,126 - - - 2,600
15 295,510 846,734 1,303,739
- - - 223,787 - - - 44,253 - - - -
307,000 245,000 - 552,000 4,145 94,200 - 98,345
- 31,323 - 31,323
311,145 370,523 - 949,708
(311,130) (75,013) 846,734 354,031
141
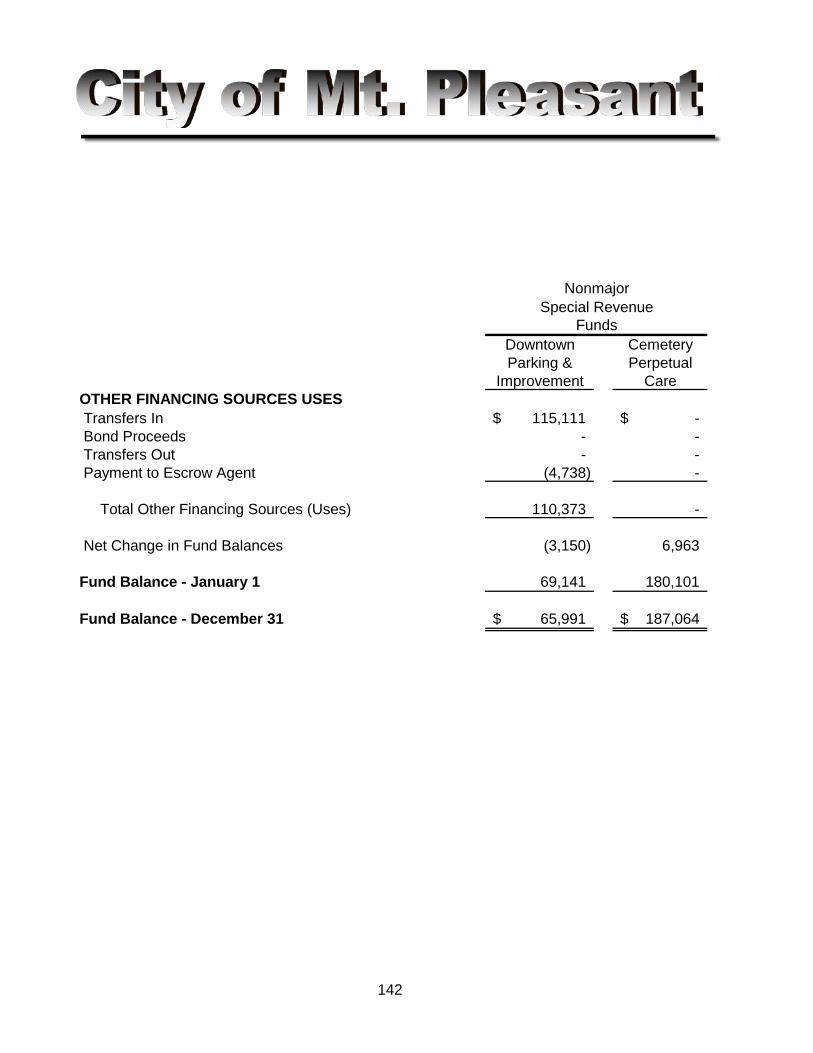
Downtown CemeteryParking & Perpetual
Improvement CareOTHER FINANCING SOURCES USES Transfers In 115,111$ -$ Bond Proceeds - - Transfers Out - - Payment to Escrow Agent (4,738) -
Total Other Financing Sources (Uses) 110,373 -
Net Change in Fund Balances (3,150) 6,963
Fund Balance - January 1 69,141 180,101
Fund Balance - December 31 65,991$ 187,064$
NonmajorSpecial Revenue
142
Funds
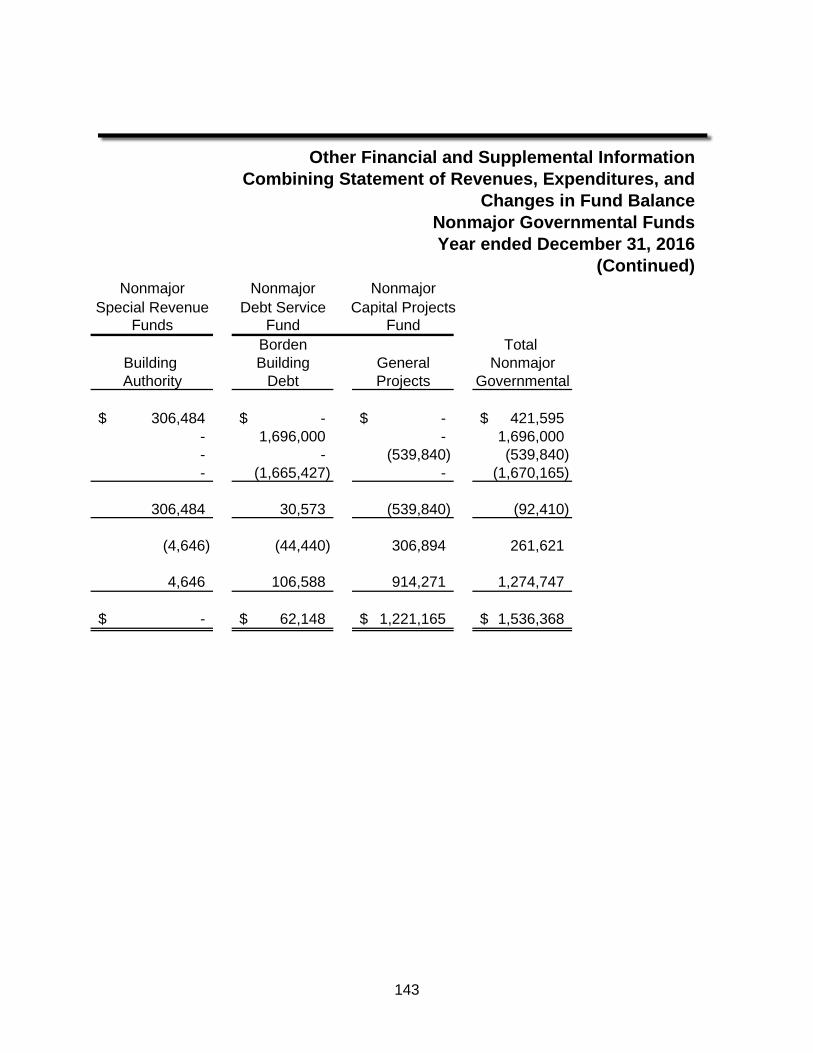
Other Financial and Supplemental InformationCombining Statement of Revenues, Expenditures, and
Changes in Fund BalanceNonmajor Governmental FundsYear ended December 31, 2016
(Continued)Nonmajor Nonmajor Nonmajor
Special Revenue Debt Service Capital ProjectsFunds Fund Fund
Borden Total Building Building General NonmajorAuthority Debt Projects Governmental
306,484$ -$ -$ 421,595$ - 1,696,000 - 1,696,000 - - (539,840) (539,840) - (1,665,427) - (1,670,165)
306,484 30,573 (539,840) (92,410)
(4,646) (44,440) 306,894 261,621
4,646 106,588 914,271 1,274,747
-$ 62,148$ 1,221,165$ 1,536,368$
143
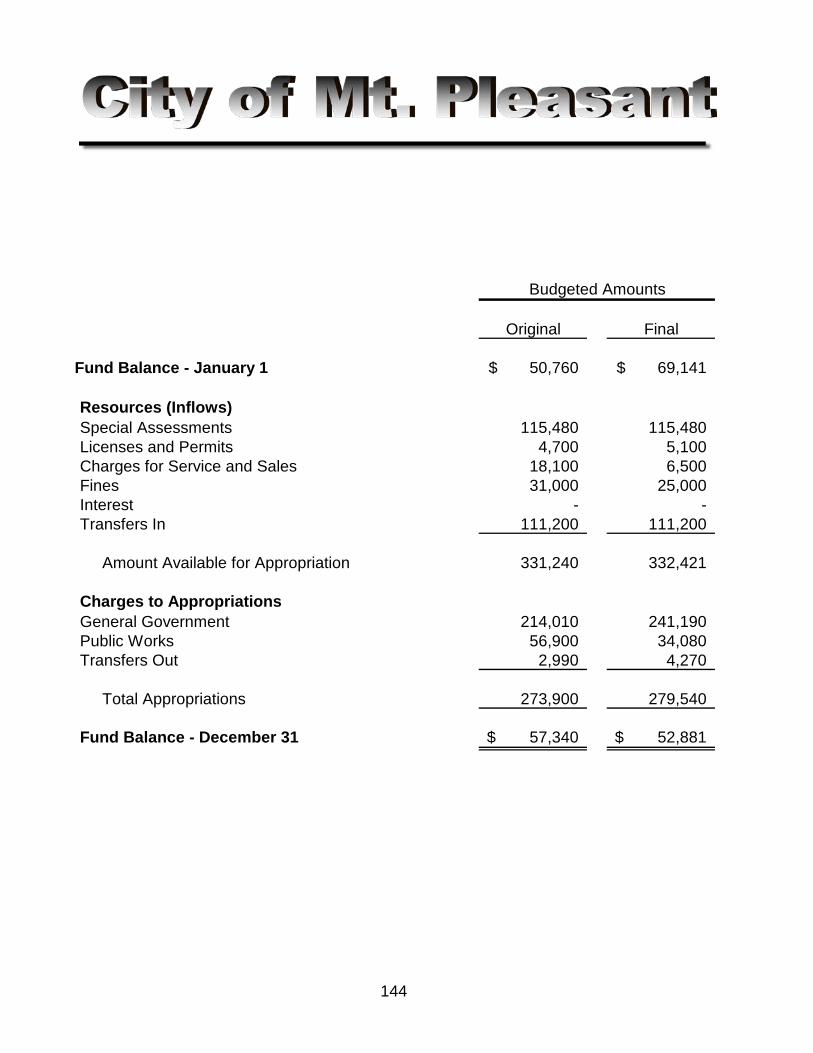
Original Final
Fund Balance - January 1 50,760$ 69,141$
Resources (Inflows) Special Assessments 115,480 115,480 Licenses and Permits 4,700 5,100 Charges for Service and Sales 18,100 6,500 Fines 31,000 25,000 Interest - - Transfers In 111,200 111,200
Amount Available for Appropriation 331,240 332,421
Charges to AppropriationsGeneral Government 214,010 241,190 Public Works 56,900 34,080 Transfers Out 2,990 4,270
Total Appropriations 273,900 279,540
Fund Balance - December 31 57,340$ 52,881$
Budgeted Amounts
144
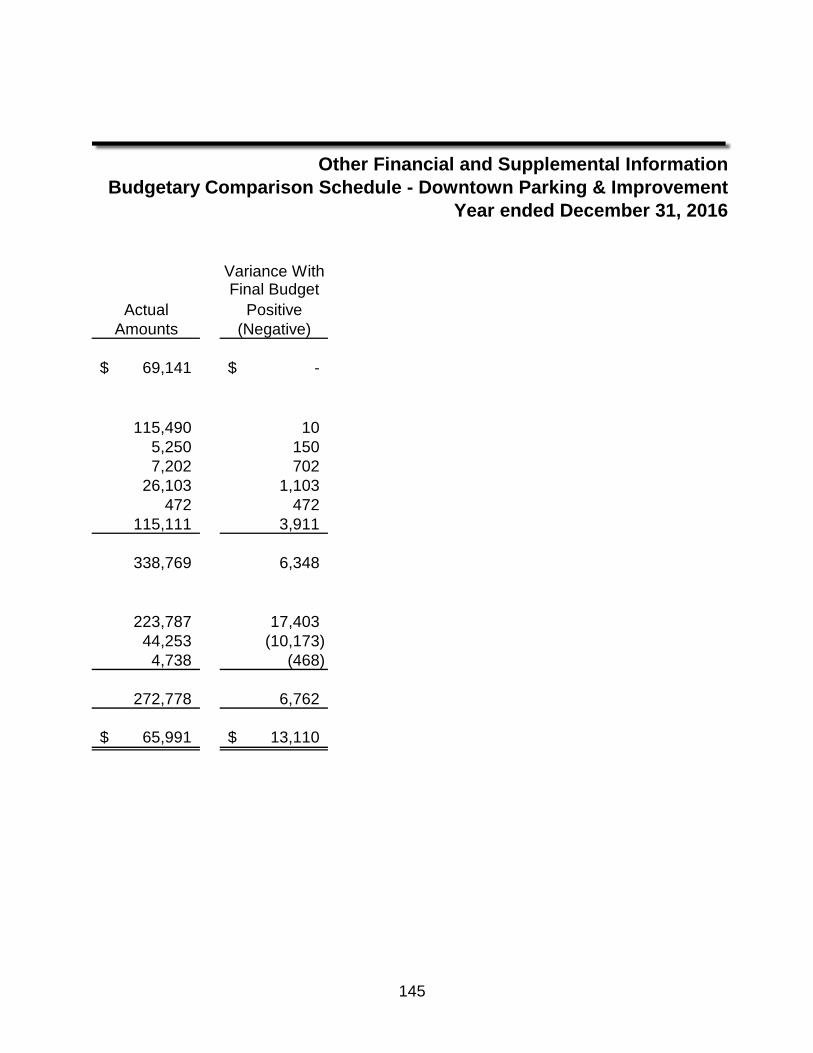
Other Financial and Supplemental InformationBudgetary Comparison Schedule - Downtown Parking & Improvement
Year ended December 31, 2016
Variance WithFinal Budget
Actual PositiveAmounts (Negative)
69,141$ -$
115,490 10 5,250 150 7,202 702
26,103 1,103 472 472
115,111 3,911
338,769 6,348
223,787 17,403 44,253 (10,173)
4,738 (468)
272,778 6,762
65,991$ 13,110$
145
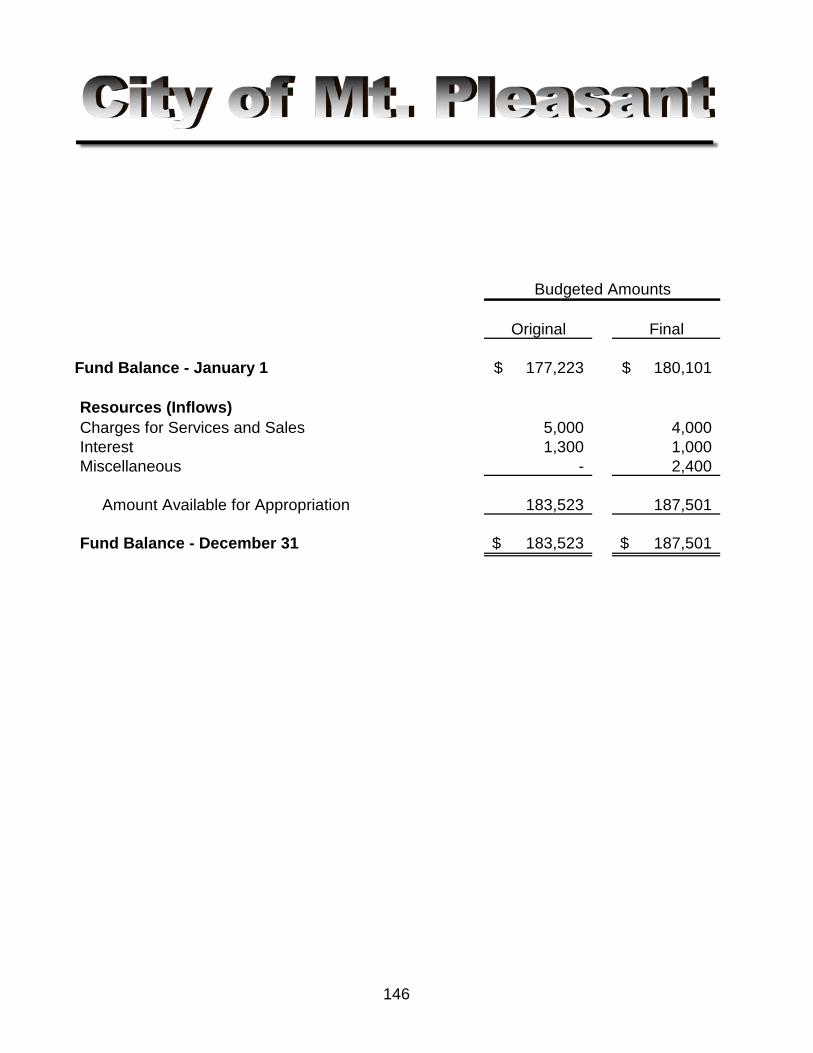
Original Final
Fund Balance - January 1 177,223$ 180,101$
Resources (Inflows)Charges for Services and Sales 5,000 4,000 Interest 1,300 1,000 Miscellaneous - 2,400
Amount Available for Appropriation 183,523 187,501
Fund Balance - December 31 183,523$ 187,501$
Budgeted Amounts
146
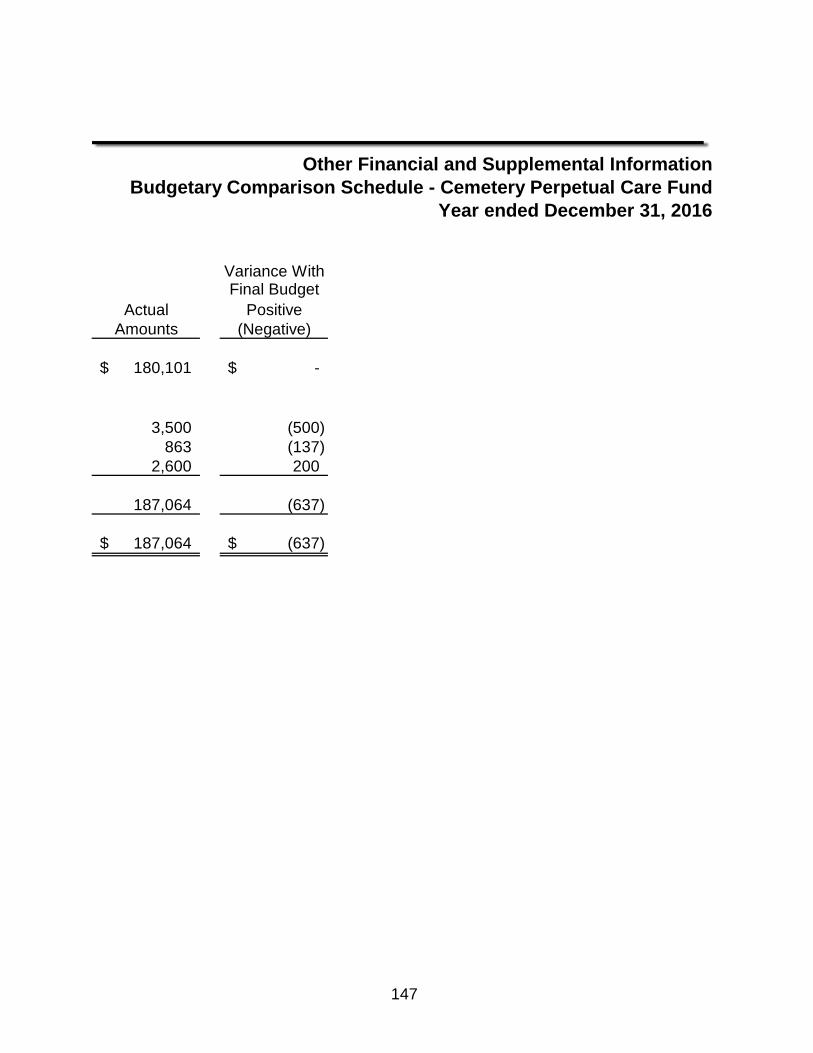
Other Financial and Supplemental InformationBudgetary Comparison Schedule - Cemetery Perpetual Care Fund
Year ended December 31, 2016
Variance WithFinal Budget
Actual PositiveAmounts (Negative)
180,101$ -$
3,500 (500) 863 (137)
2,600 200
187,064 (637)
187,064$ (637)$
147
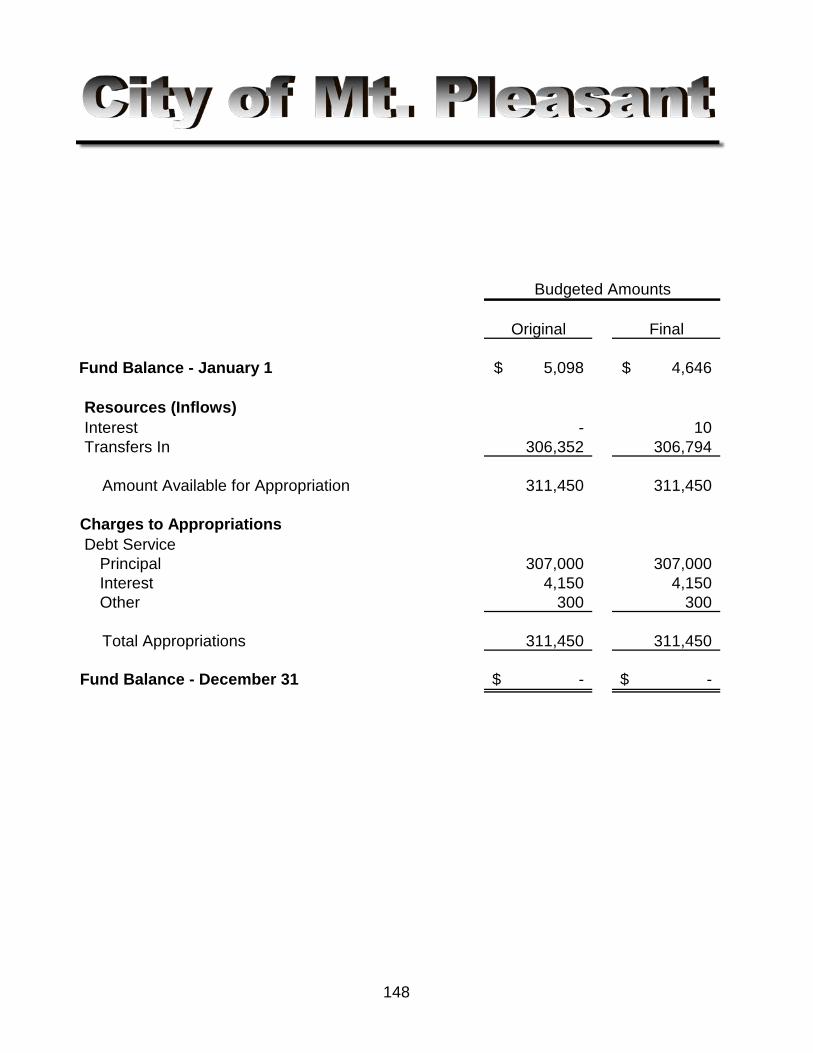
Original Final
Fund Balance - January 1 5,098$ 4,646$
Resources (Inflows) Interest - 10 Transfers In 306,352 306,794
Amount Available for Appropriation 311,450 311,450
Charges to Appropriations Debt Service
Principal 307,000 307,000 Interest 4,150 4,150 Other 300 300
Total Appropriations 311,450 311,450
Fund Balance - December 31 -$ -$
Budgeted Amounts
148
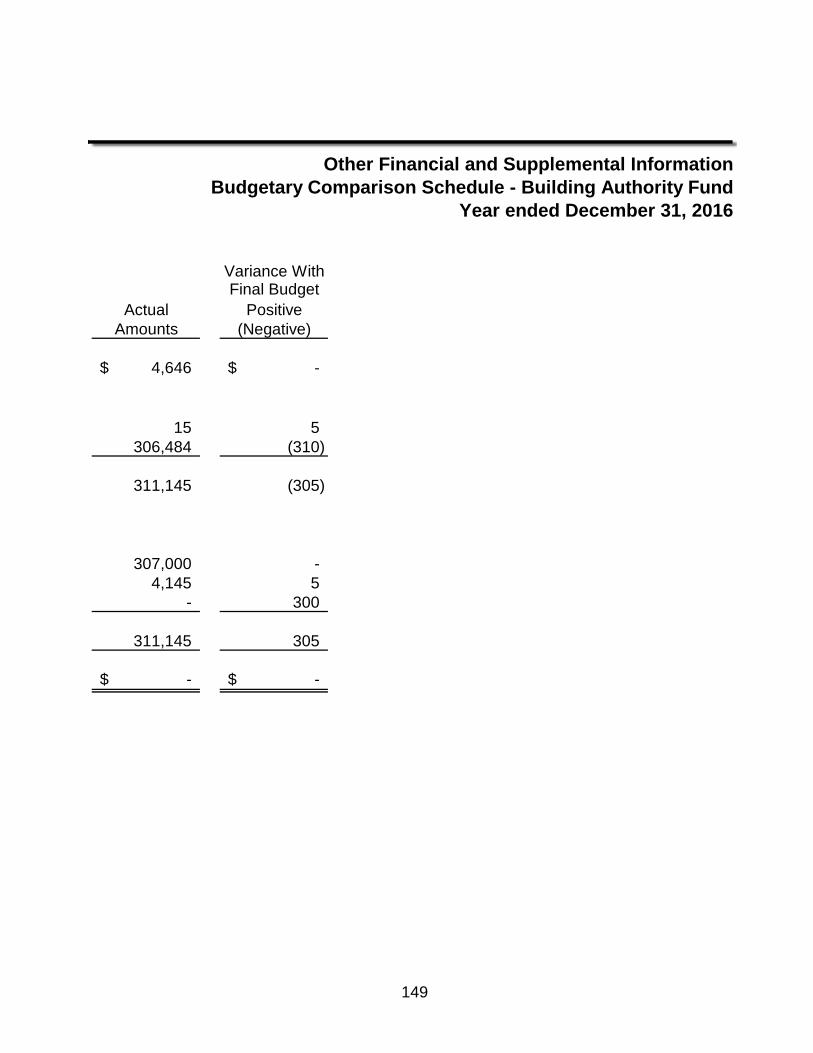
Other Financial and Supplemental InformationBudgetary Comparison Schedule - Building Authority Fund
Year ended December 31, 2016
Variance WithFinal Budget
Actual PositiveAmounts (Negative)
4,646$ -$
15 5 306,484 (310)
311,145 (305)
307,000 - 4,145 5
- 300
311,145 305
-$ -$
149
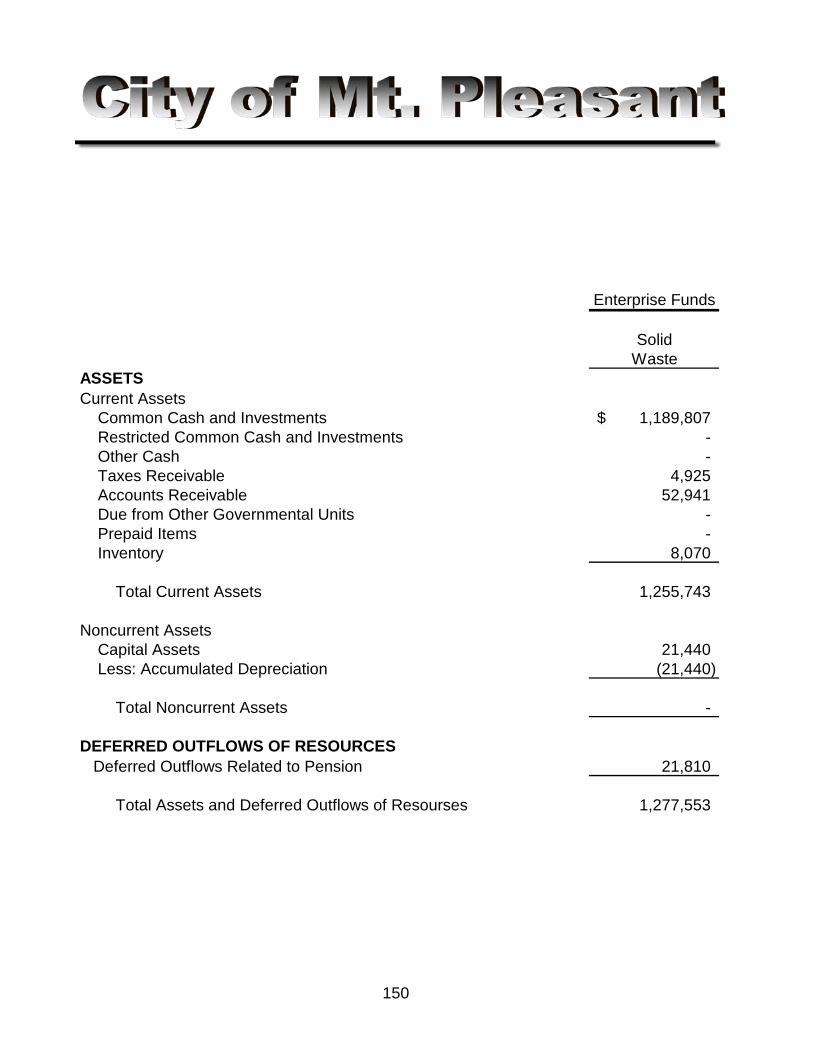
Enterprise Funds
SolidWaste
ASSETSCurrent Assets Common Cash and Investments 1,189,807$ Restricted Common Cash and Investments - Other Cash - Taxes Receivable 4,925 Accounts Receivable 52,941 Due from Other Governmental Units - Prepaid Items - Inventory 8,070
Total Current Assets 1,255,743
Noncurrent Assets Capital Assets 21,440 Less: Accumulated Depreciation (21,440)
Total Noncurrent Assets -
DEFERRED OUTFLOWS OF RESOURCES Deferred Outflows Related to Pension 21,810
Total Assets and Deferred Outflows of Resourses 1,277,553
150
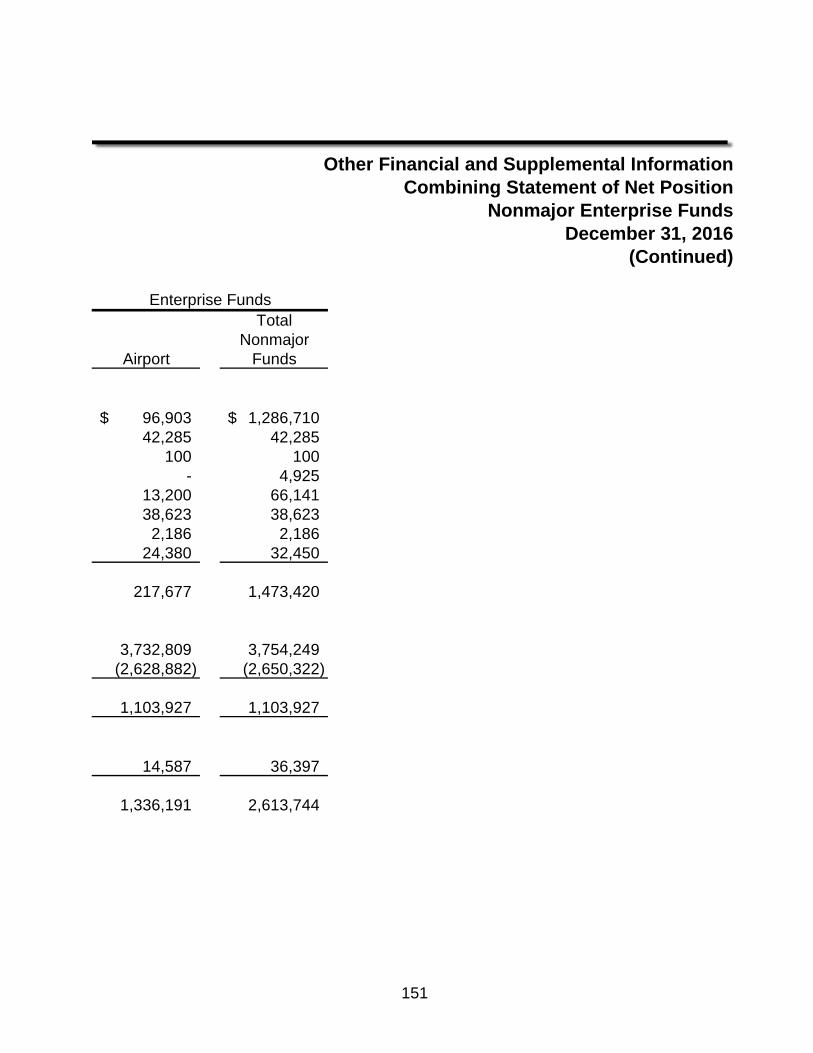
Other Financial and Supplemental InformationCombining Statement of Net Position
Nonmajor Enterprise FundsDecember 31, 2016
(Continued)
TotalNonmajor
Airport Funds
96,903$ 1,286,710$ 42,285 42,285
100 100 - 4,925
13,200 66,141 38,623 38,623
2,186 2,186 24,380 32,450
217,677 1,473,420
3,732,809 3,754,249 (2,628,882) (2,650,322)
1,103,927 1,103,927
14,587 36,397
1,336,191 2,613,744
Enterprise Funds
151
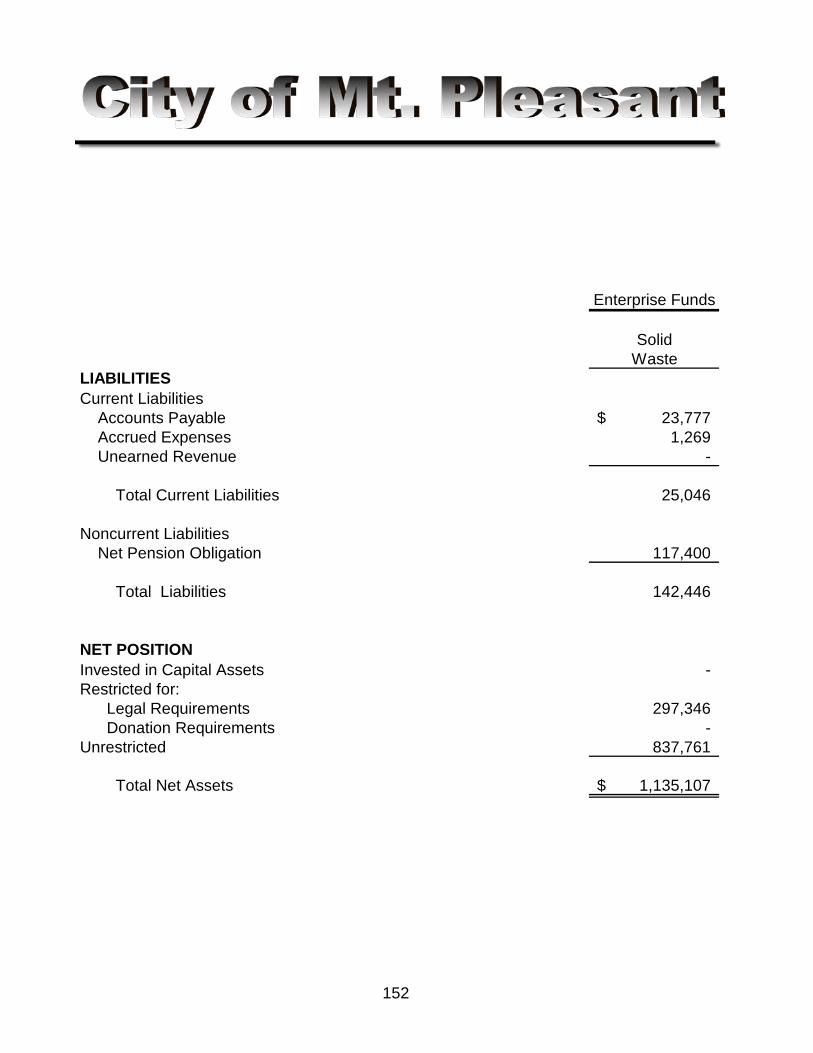
Enterprise Funds
SolidWaste
LIABILITIESCurrent Liabilities Accounts Payable 23,777$ Accrued Expenses 1,269 Unearned Revenue -
Total Current Liabilities 25,046
Noncurrent Liabilities Net Pension Obligation 117,400
Total Liabilities 142,446
NET POSITIONInvested in Capital Assets - Restricted for: Legal Requirements 297,346 Donation Requirements - Unrestricted 837,761
Total Net Assets 1,135,107$
152

Other Financial and Supplemental InformationCombining Statement of Net Assets
Nonmajor Proprietary FundsDecember 31, 2016
(Continued)
TotalNonmajor
Airport Funds
9,675$ 33,452$ 9,041 10,310
21,155 21,155
39,871 64,917
117,400 234,800
157,271 299,717
1,103,927 1,103,927
- 297,346 42,285 42,285 32,708 870,469
1,178,920$ 2,314,027$
153
Enterprise Funds
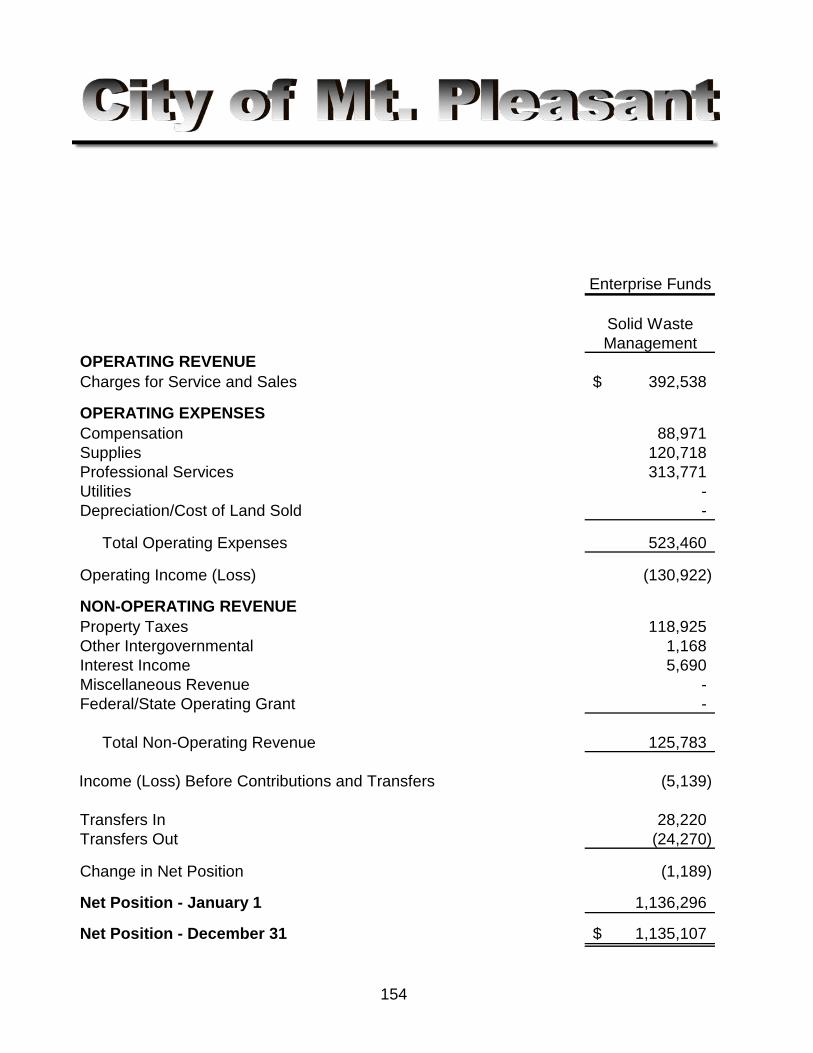
Enterprise Funds
Solid WasteManagement
OPERATING REVENUECharges for Service and Sales 392,538$
OPERATING EXPENSESCompensation 88,971 Supplies 120,718 Professional Services 313,771 Utilities - Depreciation/Cost of Land Sold -
Total Operating Expenses 523,460
Operating Income (Loss) (130,922)
NON-OPERATING REVENUEProperty Taxes 118,925 Other Intergovernmental 1,168 Interest Income 5,690 Miscellaneous Revenue - Federal/State Operating Grant -
Total Non-Operating Revenue 125,783
Income (Loss) Before Contributions and Transfers (5,139)
Transfers In 28,220 Transfers Out (24,270)
Change in Net Position (1,189)
Net Position - January 1 1,136,296
Net Position - December 31 1,135,107$
154
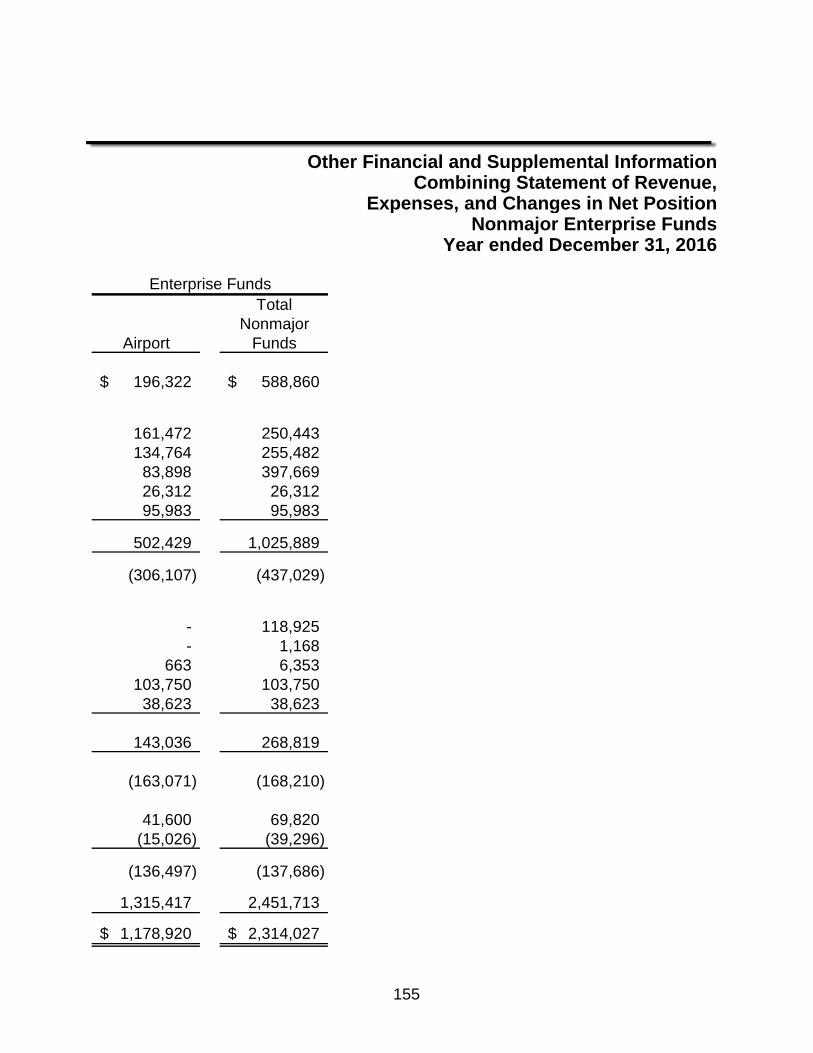
Other Financial and Supplemental InformationCombining Statement of Revenue,
Expenses, and Changes in Net PositionNonmajor Enterprise Funds
Year ended December 31, 2016
TotalNonmajor
Airport Funds
196,322$ 588,860$
161,472 250,443 134,764 255,482
83,898 397,669 26,312 26,312 95,983 95,983
502,429 1,025,889
(306,107) (437,029)
- 118,925 - 1,168
663 6,353 103,750 103,750
38,623 38,623
143,036 268,819
(163,071) (168,210)
41,600 69,820 (15,026) (39,296)
(136,497) (137,686)
1,315,417 2,451,713
1,178,920$ 2,314,027$
Enterprise Funds
155
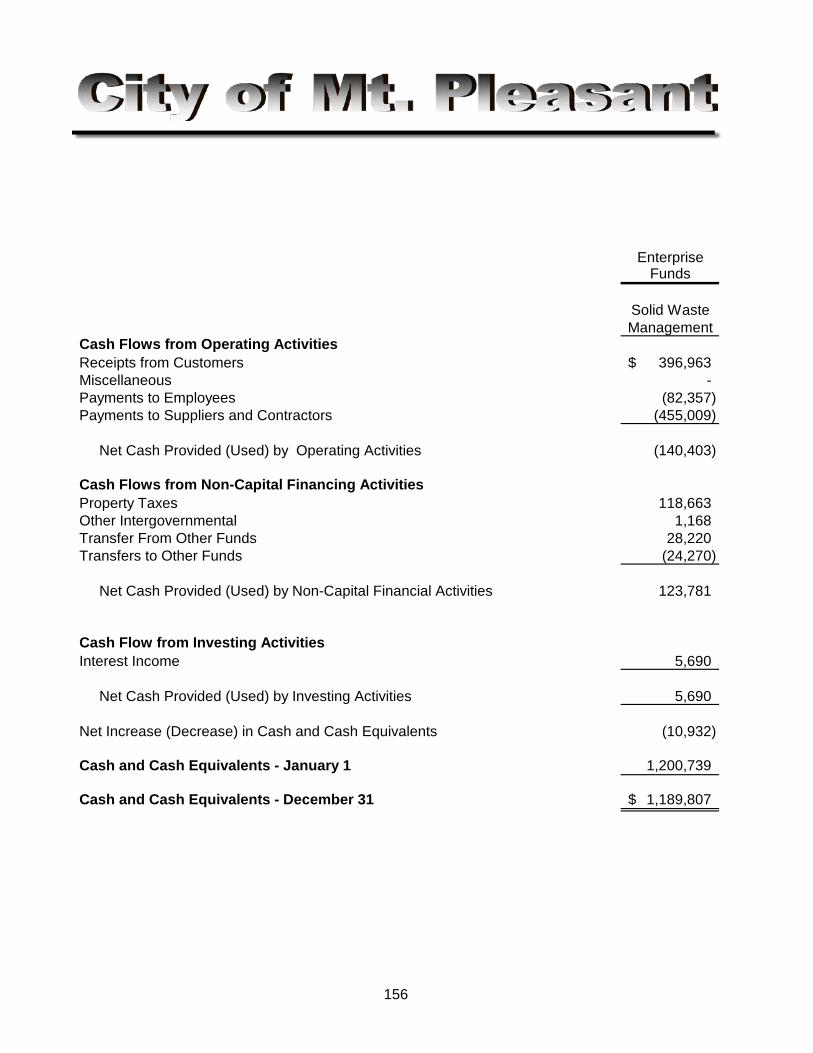
EnterpriseFunds
Solid WasteManagement
Cash Flows from Operating ActivitiesReceipts from Customers 396,963$ Miscellaneous - Payments to Employees (82,357) Payments to Suppliers and Contractors (455,009)
Net Cash Provided (Used) by Operating Activities (140,403)
Cash Flows from Non-Capital Financing ActivitiesProperty Taxes 118,663 Other Intergovernmental 1,168 Transfer From Other Funds 28,220 Transfers to Other Funds (24,270)
Net Cash Provided (Used) by Non-Capital Financial Activities 123,781
Cash Flow from Investing ActivitiesInterest Income 5,690
Net Cash Provided (Used) by Investing Activities 5,690
Net Increase (Decrease) in Cash and Cash Equivalents (10,932)
Cash and Cash Equivalents - January 1 1,200,739
Cash and Cash Equivalents - December 31 1,189,807$
156
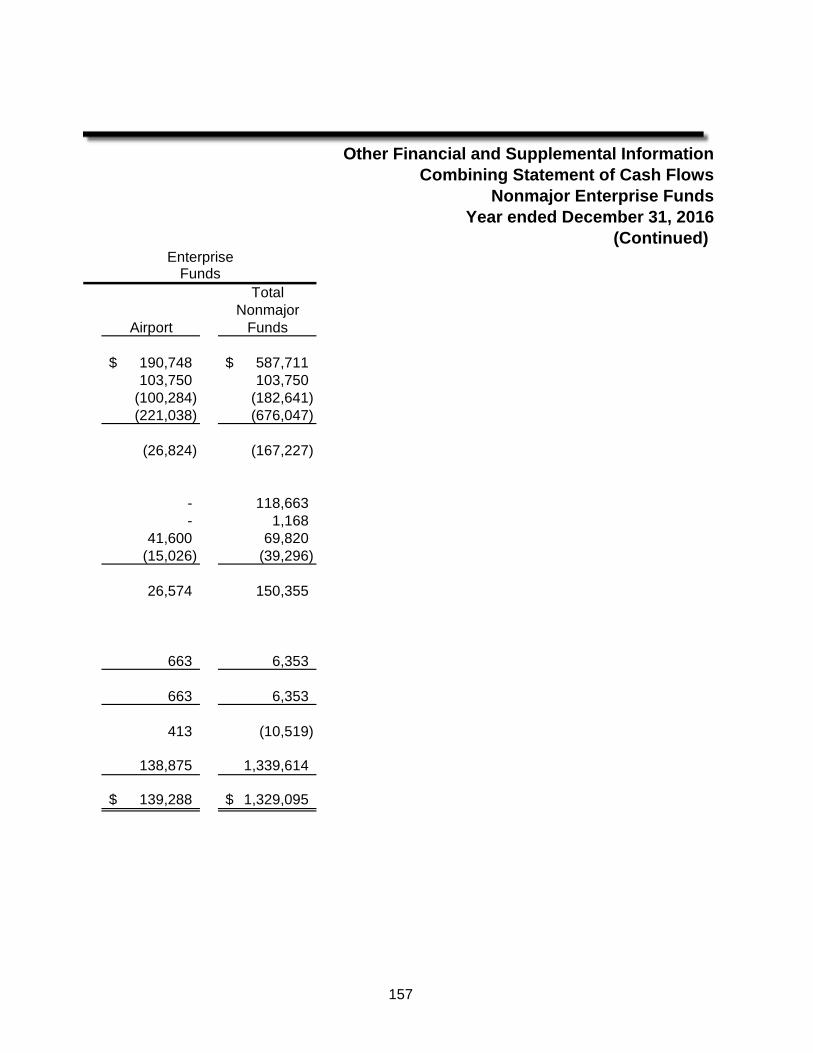
Other Financial and Supplemental InformationCombining Statement of Cash Flows
Nonmajor Enterprise FundsYear ended December 31, 2016
(Continued)
TotalNonmajor
Airport Funds
190,748$ 587,711$ 103,750 103,750
(100,284) (182,641) (221,038) (676,047)
(26,824) (167,227)
- 118,663 - 1,168
41,600 69,820 (15,026) (39,296)
26,574 150,355
663 6,353
663 6,353
413 (10,519)
138,875 1,339,614
139,288$ 1,329,095$
EnterpriseFunds
157
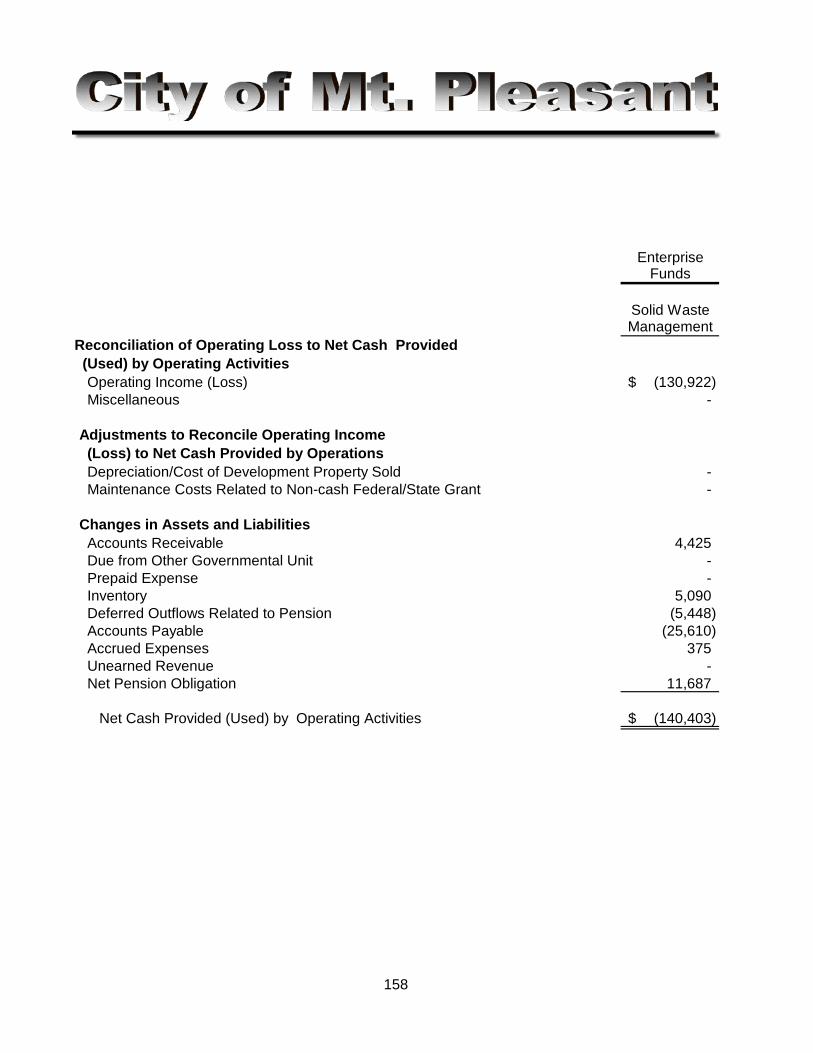
EnterpriseFunds
Solid WasteManagement
Reconciliation of Operating Loss to Net Cash Provided (Used) by Operating Activities Operating Income (Loss) (130,922)$ Miscellaneous -
Adjustments to Reconcile Operating Income (Loss) to Net Cash Provided by Operations Depreciation/Cost of Development Property Sold - Maintenance Costs Related to Non-cash Federal/State Grant -
Changes in Assets and Liabilities Accounts Receivable 4,425 Due from Other Governmental Unit - Prepaid Expense - Inventory 5,090 Deferred Outflows Related to Pension (5,448) Accounts Payable (25,610) Accrued Expenses 375 Unearned Revenue - Net Pension Obligation 11,687
Net Cash Provided (Used) by Operating Activities (140,403)$
158
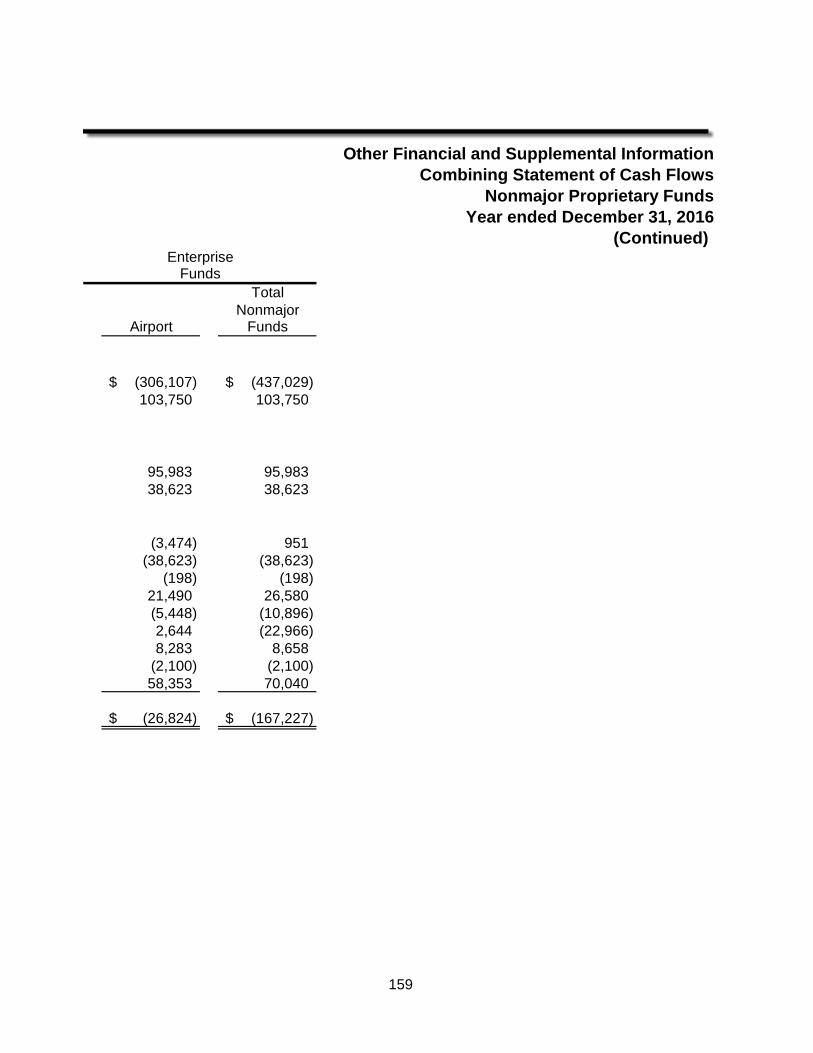
Other Financial and Supplemental InformationCombining Statement of Cash Flows
Nonmajor Proprietary FundsYear ended December 31, 2016
(Continued)
TotalNonmajor
Airport Funds
(306,107)$ (437,029)$ 103,750 103,750
95,983 95,983 38,623 38,623
(3,474) 951 (38,623) (38,623)
(198) (198) 21,490 26,580 (5,448) (10,896) 2,644 (22,966) 8,283 8,658
(2,100) (2,100) 58,353 70,040
(26,824)$ (167,227)$
FundsEnterprise
159
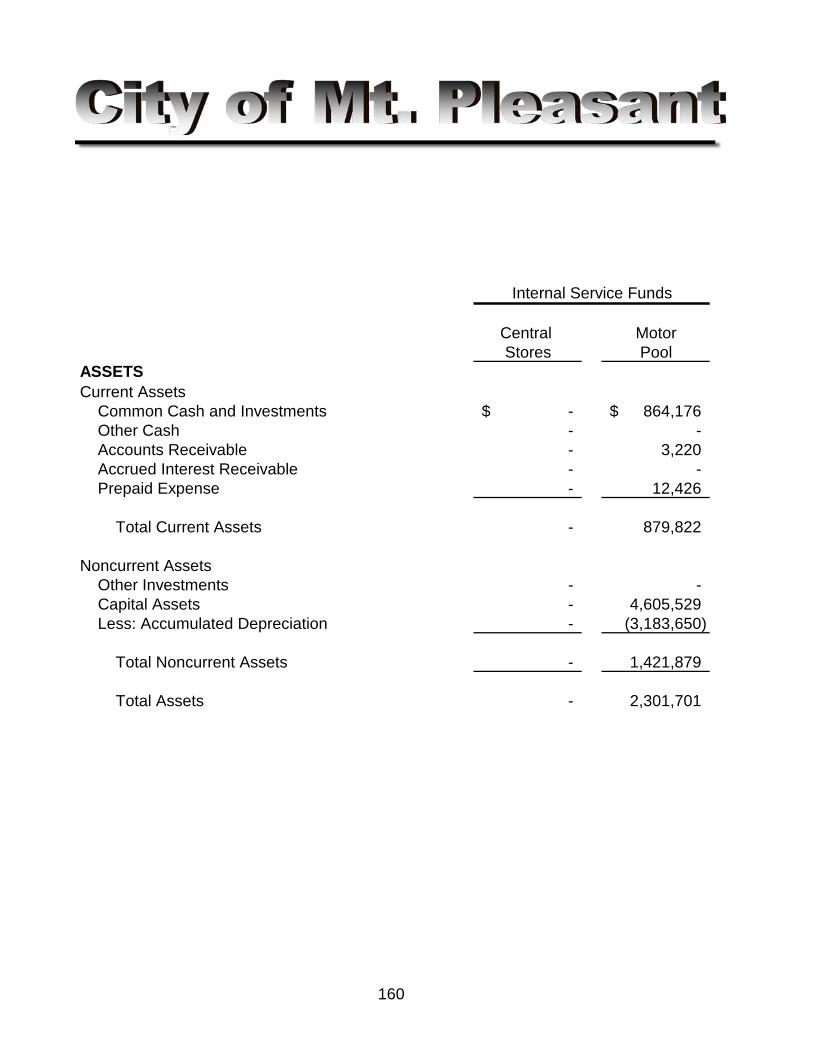
Central MotorStores Pool
ASSETSCurrent Assets Common Cash and Investments -$ 864,176$ Other Cash - - Accounts Receivable - 3,220 Accrued Interest Receivable - - Prepaid Expense - 12,426
Total Current Assets - 879,822
Noncurrent Assets Other Investments - - Capital Assets - 4,605,529 Less: Accumulated Depreciation - (3,183,650)
Total Noncurrent Assets - 1,421,879
Total Assets - 2,301,701
Internal Service Funds
160
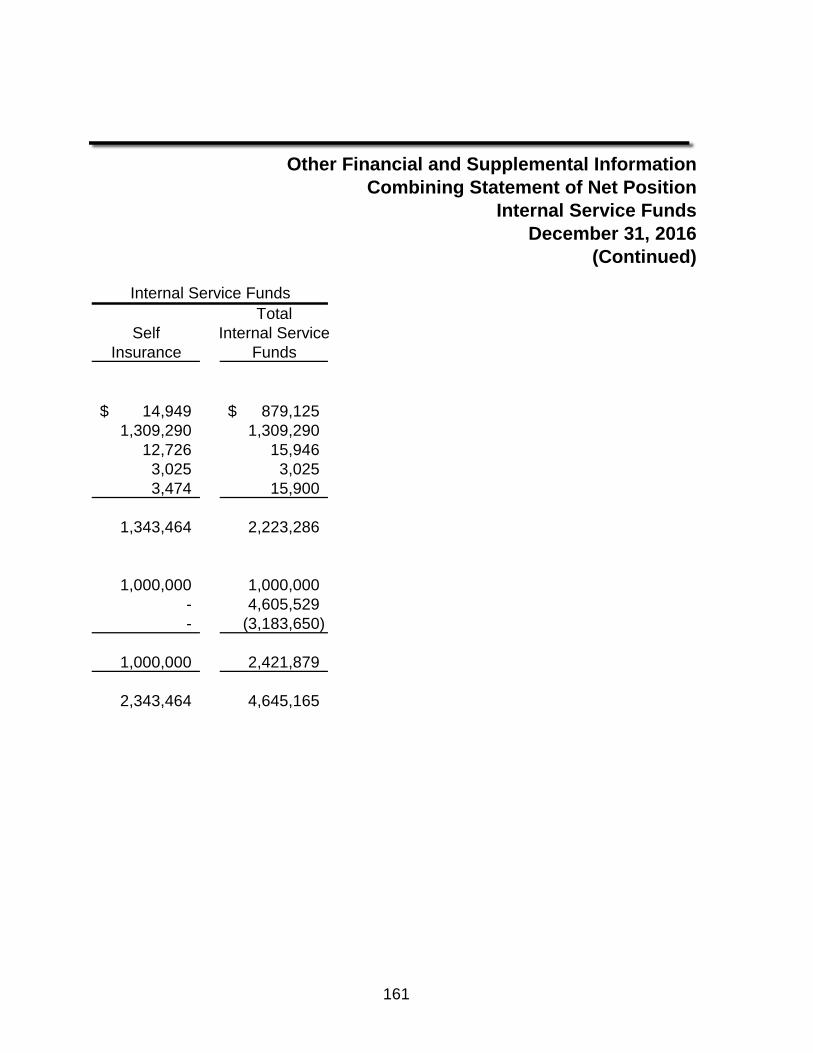
Other Financial and Supplemental InformationCombining Statement of Net Position
Internal Service FundsDecember 31, 2016
(Continued)
TotalSelf Internal Service
Insurance Funds
14,949$ 879,125$ 1,309,290 1,309,290
12,726 15,946 3,025 3,025 3,474 15,900
1,343,464 2,223,286
1,000,000 1,000,000 - 4,605,529 - (3,183,650)
1,000,000 2,421,879
2,343,464 4,645,165
Internal Service Funds
161
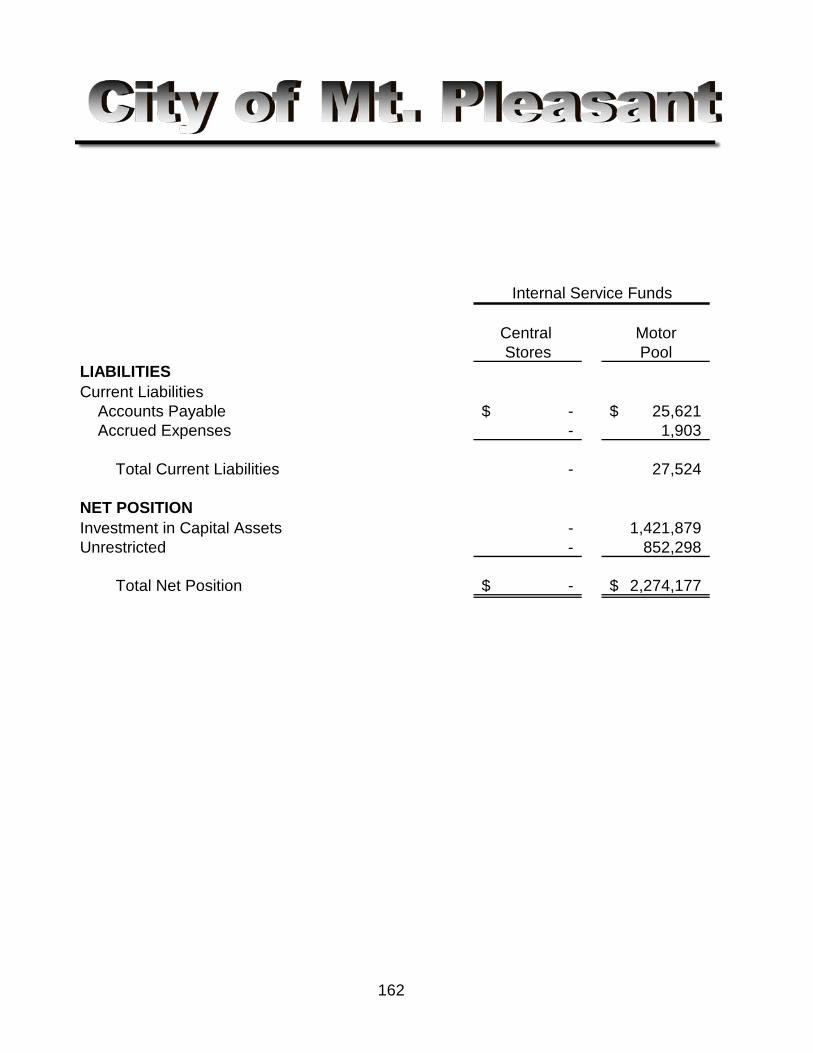
Central MotorStores Pool
LIABILITIESCurrent Liabilities Accounts Payable -$ 25,621$ Accrued Expenses - 1,903
Total Current Liabilities - 27,524
NET POSITIONInvestment in Capital Assets - 1,421,879 Unrestricted - 852,298
Total Net Position -$ 2,274,177$
162
Internal Service Funds
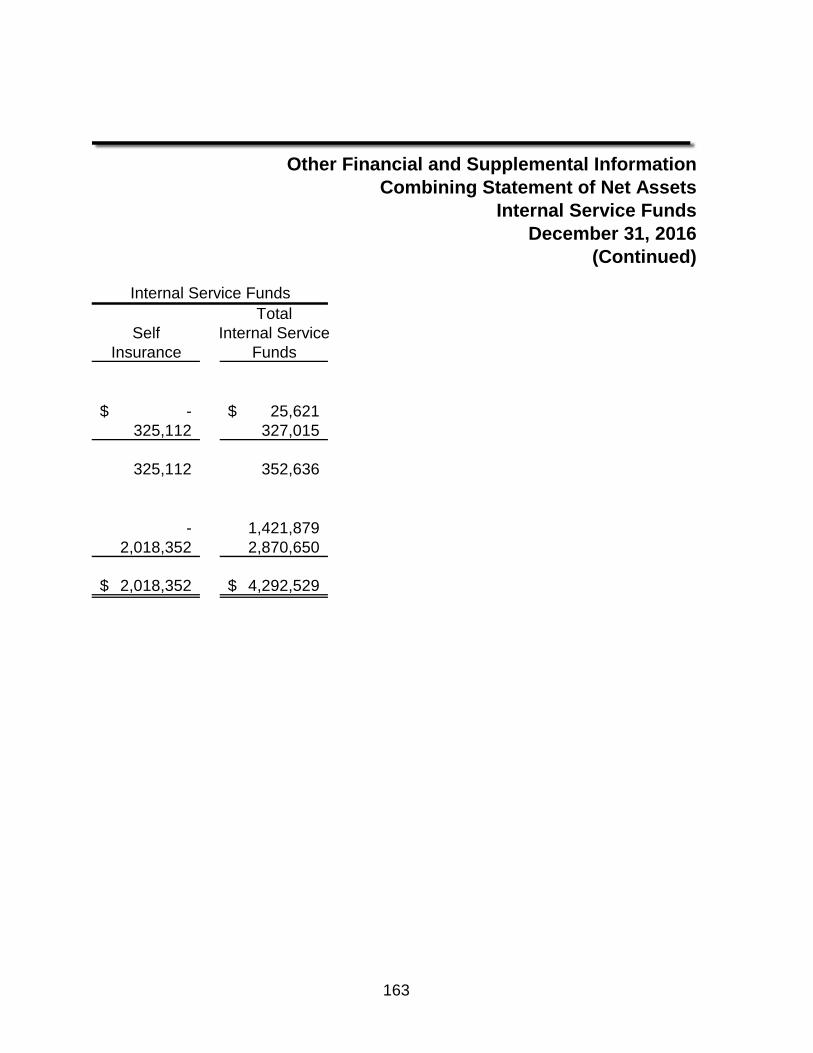
Other Financial and Supplemental InformationCombining Statement of Net Assets
Internal Service FundsDecember 31, 2016
(Continued)
TotalSelf Internal Service
Insurance Funds
-$ 25,621$ 325,112 327,015
325,112 352,636
- 1,421,879 2,018,352 2,870,650
2,018,352$ 4,292,529$
163
Internal Service Funds
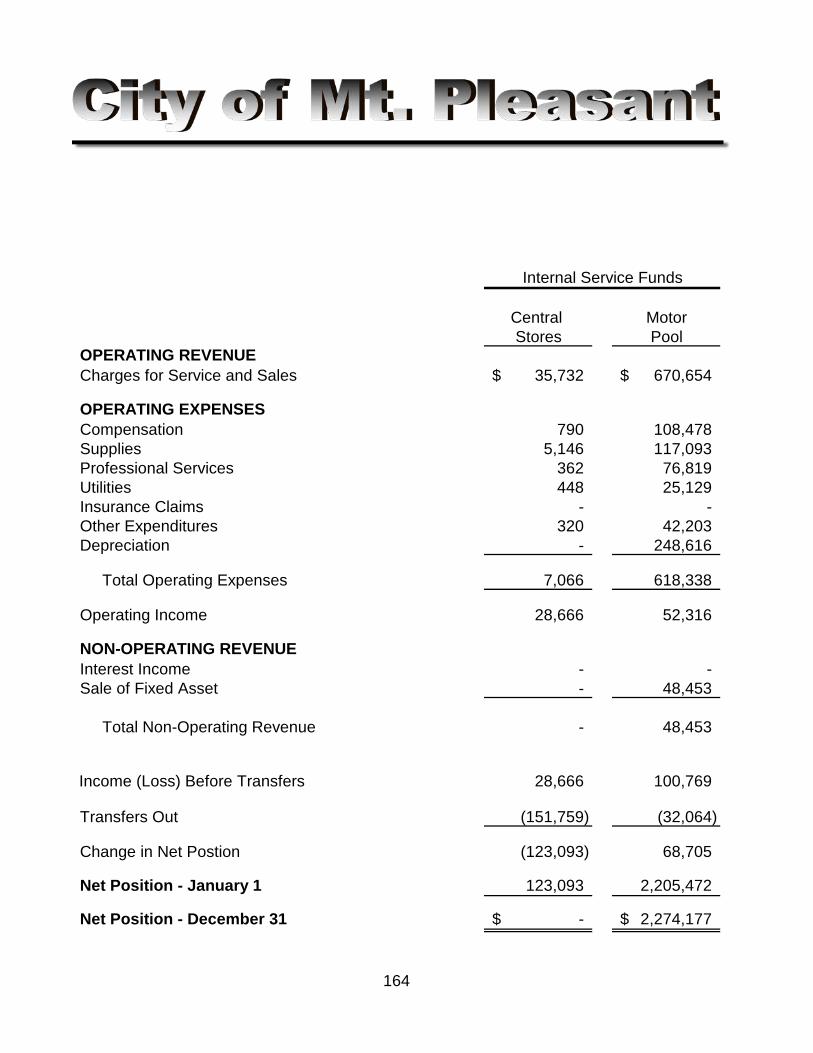
Central MotorStores Pool
OPERATING REVENUECharges for Service and Sales 35,732$ 670,654$
OPERATING EXPENSESCompensation 790 108,478 Supplies 5,146 117,093 Professional Services 362 76,819 Utilities 448 25,129 Insurance Claims - - Other Expenditures 320 42,203 Depreciation - 248,616
Total Operating Expenses 7,066 618,338
Operating Income 28,666 52,316
NON-OPERATING REVENUE Interest Income - - Sale of Fixed Asset - 48,453
Total Non-Operating Revenue - 48,453
Income (Loss) Before Transfers 28,666 100,769
Transfers Out (151,759) (32,064)
Change in Net Postion (123,093) 68,705
Net Position - January 1 123,093 2,205,472
Net Position - December 31 -$ 2,274,177$
Internal Service Funds
164
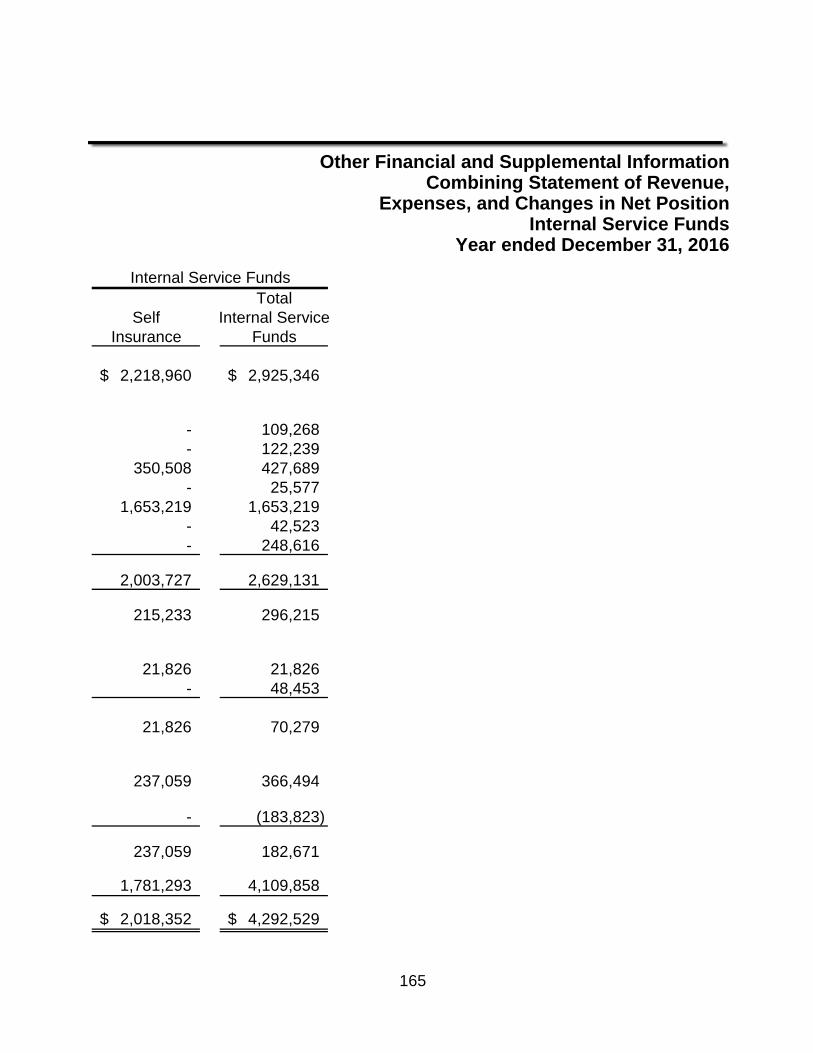
Other Financial and Supplemental InformationCombining Statement of Revenue,
Expenses, and Changes in Net PositionInternal Service Funds
Year ended December 31, 2016
TotalSelf Internal Service
Insurance Funds
2,218,960$ 2,925,346$
- 109,268 - 122,239
350,508 427,689 - 25,577
1,653,219 1,653,219 - 42,523 - 248,616
2,003,727 2,629,131
215,233 296,215
21,826 21,826 - 48,453
21,826 70,279
237,059 366,494
- (183,823)
237,059 182,671
1,781,293 4,109,858
2,018,352$ 4,292,529$
Internal Service Funds
165
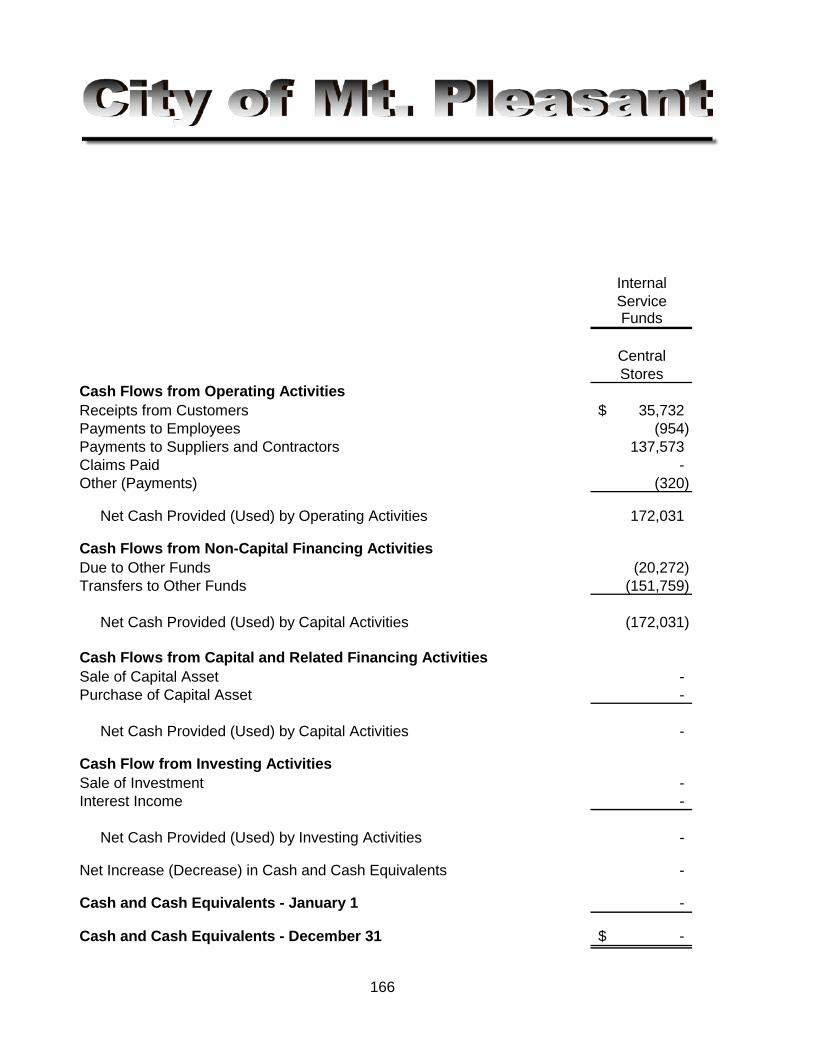
InternalServiceFunds
CentralStores
Cash Flows from Operating ActivitiesReceipts from Customers 35,732$ Payments to Employees (954) Payments to Suppliers and Contractors 137,573 Claims Paid - Other (Payments) (320)
Net Cash Provided (Used) by Operating Activities 172,031
Cash Flows from Non-Capital Financing ActivitiesDue to Other Funds (20,272) Transfers to Other Funds (151,759)
Net Cash Provided (Used) by Capital Activities (172,031)
Cash Flows from Capital and Related Financing ActivitiesSale of Capital Asset - Purchase of Capital Asset -
Net Cash Provided (Used) by Capital Activities -
Cash Flow from Investing ActivitiesSale of Investment - Interest Income -
Net Cash Provided (Used) by Investing Activities -
Net Increase (Decrease) in Cash and Cash Equivalents -
Cash and Cash Equivalents - January 1 - Cash and Cash Equivalents - December 31 -$
166
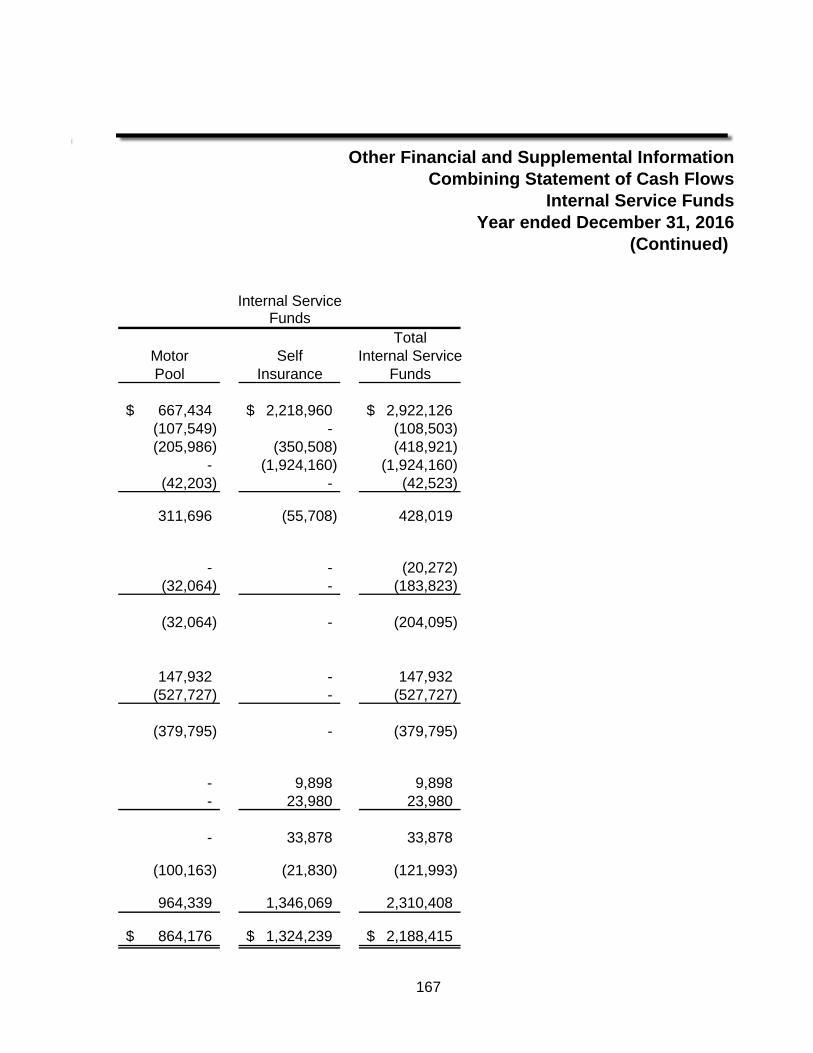
Other Financial and Supplemental InformationCombining Statement of Cash Flows
Internal Service FundsYear ended December 31, 2016
(Continued)
TotalMotor Self Internal ServicePool Insurance Funds
667,434$ 2,218,960$ 2,922,126$ (107,549) - (108,503) (205,986) (350,508) (418,921)
- (1,924,160) (1,924,160) (42,203) - (42,523)
311,696 (55,708) 428,019
- - (20,272) (32,064) - (183,823)
(32,064) - (204,095)
147,932 - 147,932 (527,727) - (527,727)
(379,795) - (379,795)
- 9,898 9,898 - 23,980 23,980
- 33,878 33,878
(100,163) (21,830) (121,993)
964,339 1,346,069 2,310,408
864,176$ 1,324,239$ 2,188,415$
Internal ServiceFunds
167
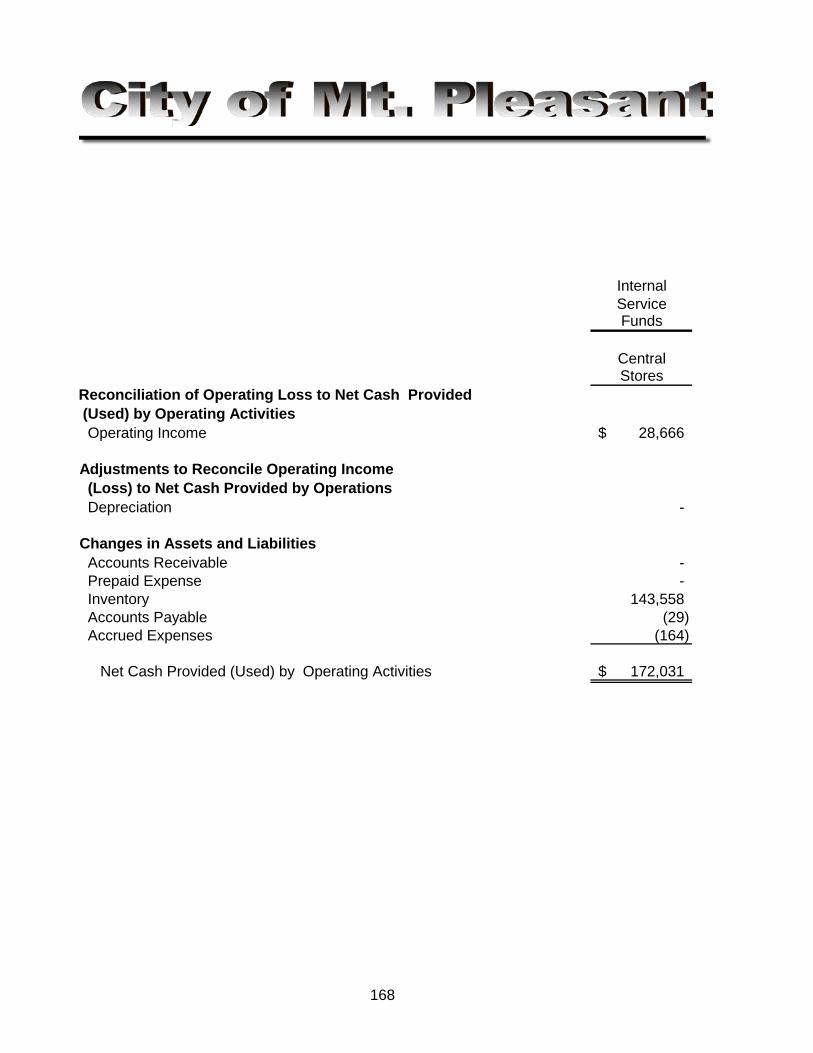
InternalServiceFunds
CentralStores
Reconciliation of Operating Loss to Net Cash Provided (Used) by Operating Activities Operating Income 28,666$
Adjustments to Reconcile Operating Income (Loss) to Net Cash Provided by Operations Depreciation -
Changes in Assets and Liabilities Accounts Receivable - Prepaid Expense - Inventory 143,558 Accounts Payable (29) Accrued Expenses (164)
Net Cash Provided (Used) by Operating Activities 172,031$
168
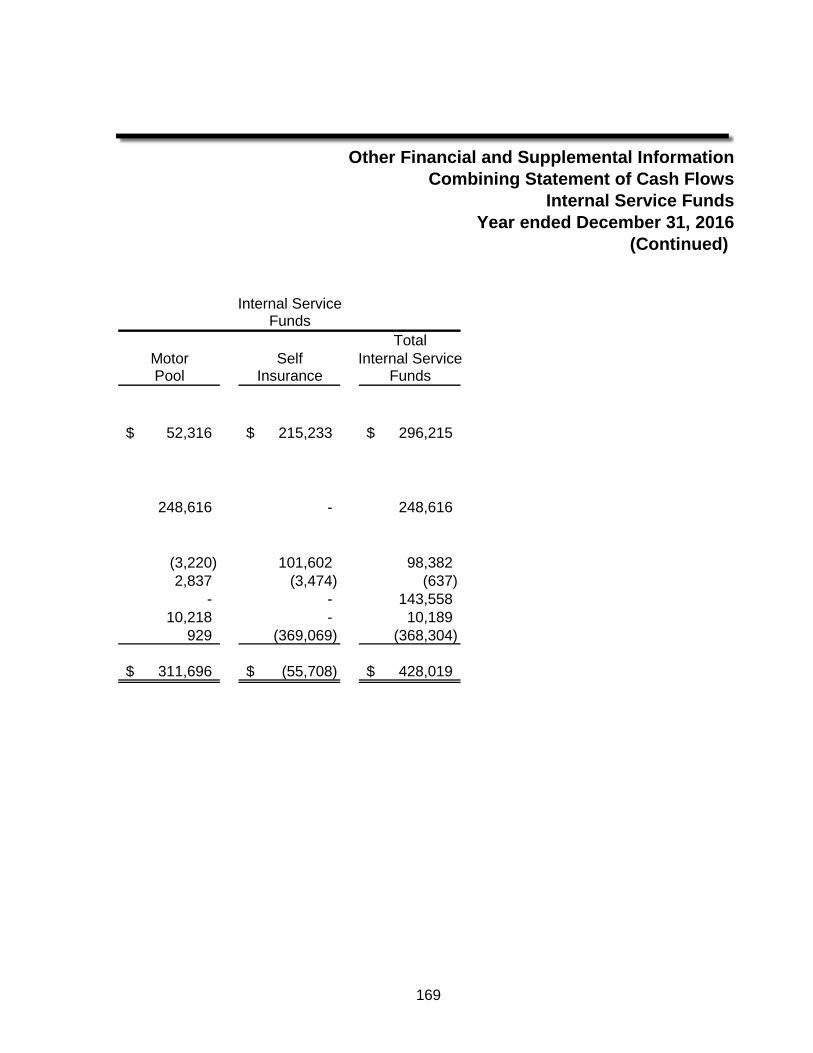
Other Financial and Supplemental InformationCombining Statement of Cash Flows
Internal Service FundsYear ended December 31, 2016
(Continued)
TotalMotor Self Internal ServicePool Insurance Funds
52,316$ 215,233$ 296,215$
248,616 - 248,616
(3,220) 101,602 98,382 2,837 (3,474) (637)
- - 143,558 10,218 - 10,189
929 (369,069) (368,304)
311,696$ (55,708)$ 428,019$
169
FundsInternal Service
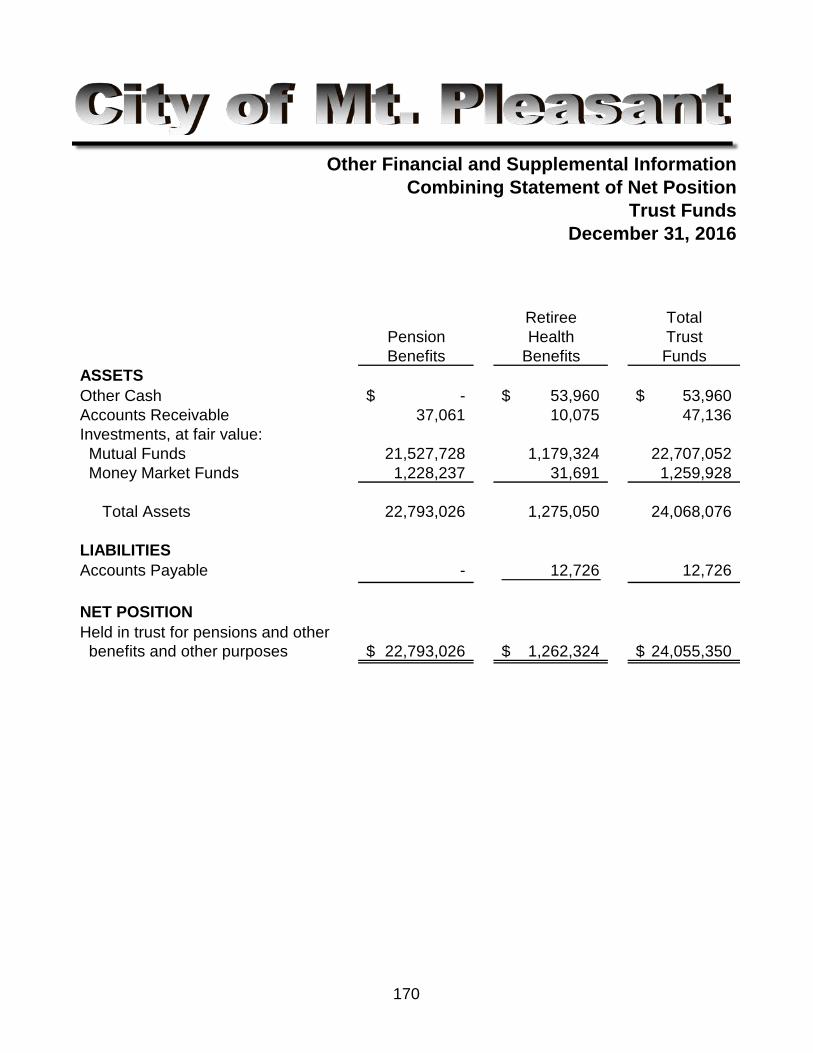
Other Financial and Supplemental InformationCombining Statement of Net Position
Trust FundsDecember 31, 2016
Retiree TotalPension Health TrustBenefits Benefits Funds
ASSETSOther Cash -$ 53,960$ 53,960$ Accounts Receivable 37,061 10,075 47,136 Investments, at fair value: Mutual Funds 21,527,728 1,179,324 22,707,052 Money Market Funds 1,228,237 31,691 1,259,928 Total Assets 22,793,026 1,275,050 24,068,076
LIABILITIESAccounts Payable - 12,726 12,726
NET POSITIONHeld in trust for pensions and other benefits and other purposes 22,793,026$ 1,262,324$ 24,055,350$
170
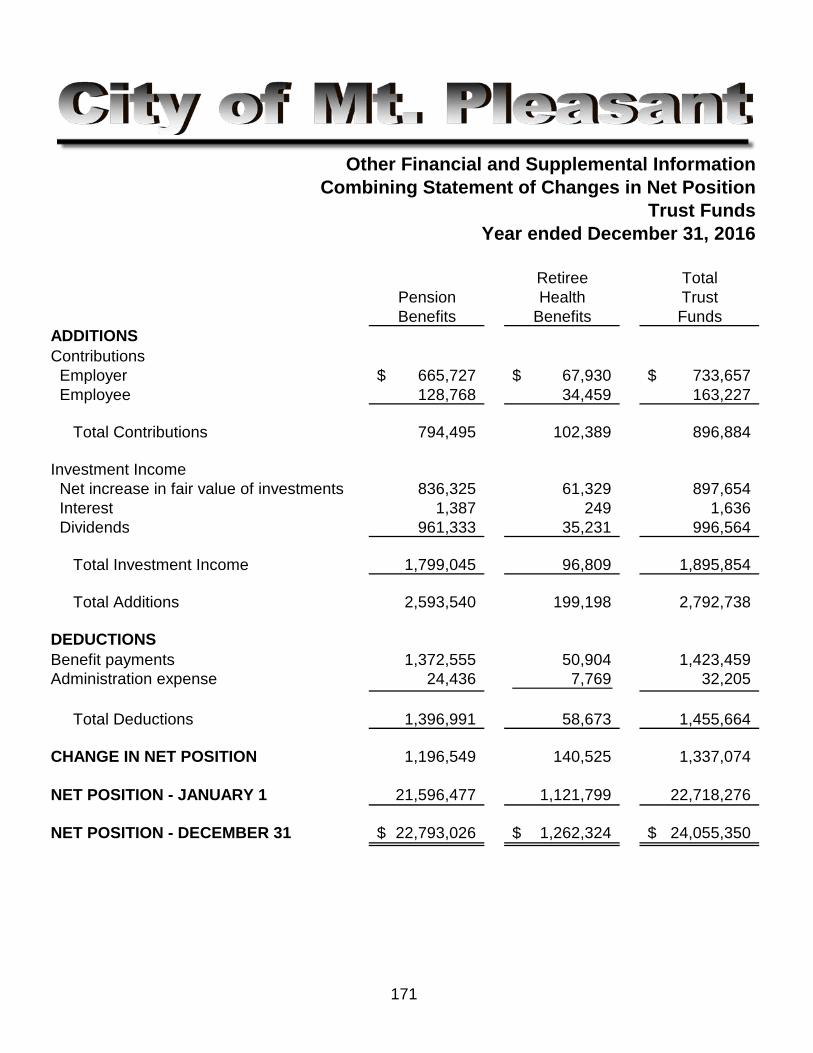
Other Financial and Supplemental InformationCombining Statement of Changes in Net Position
Trust FundsYear ended December 31, 2016
Retiree TotalPension Health TrustBenefits Benefits Funds
ADDITIONSContributions Employer 665,727$ 67,930$ 733,657$ Employee 128,768 34,459 163,227
Total Contributions 794,495 102,389 896,884
Investment Income Net increase in fair value of investments 836,325 61,329 897,654 Interest 1,387 249 1,636 Dividends 961,333 35,231 996,564
Total Investment Income 1,799,045 96,809 1,895,854
Total Additions 2,593,540 199,198 2,792,738
DEDUCTIONSBenefit payments 1,372,555 50,904 1,423,459 Administration expense 24,436 7,769 32,205
Total Deductions 1,396,991 58,673 1,455,664
CHANGE IN NET POSITION 1,196,549 140,525 1,337,074
NET POSITION - JANUARY 1 21,596,477 1,121,799 22,718,276
NET POSITION - DECEMBER 31 22,793,026$ 1,262,324$ 24,055,350$
171
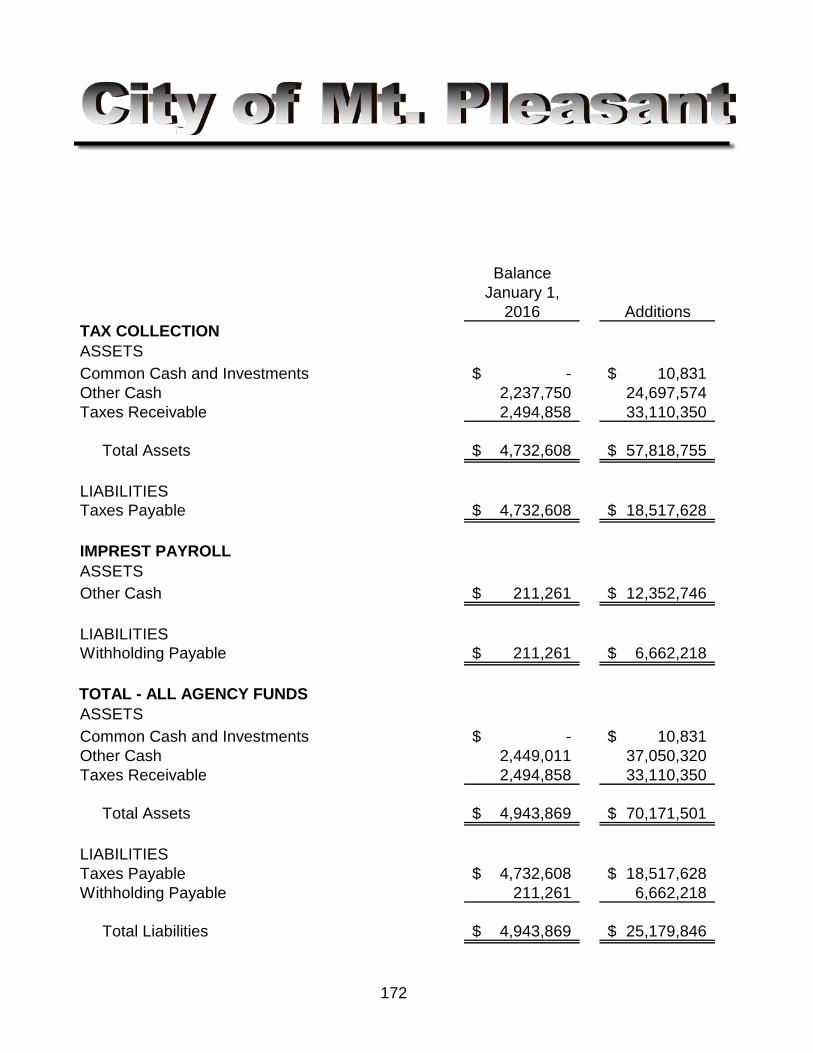
BalanceJanuary 1,
2016 AdditionsTAX COLLECTIONASSETSCommon Cash and Investments -$ 10,831$ Other Cash 2,237,750 24,697,574 Taxes Receivable 2,494,858 33,110,350 Total Assets 4,732,608$ 57,818,755$
LIABILITIESTaxes Payable 4,732,608$ 18,517,628$
IMPREST PAYROLLASSETSOther Cash 211,261$ 12,352,746$
LIABILITIESWithholding Payable 211,261$ 6,662,218$
TOTAL - ALL AGENCY FUNDSASSETSCommon Cash and Investments -$ 10,831$ Other Cash 2,449,011 37,050,320 Taxes Receivable 2,494,858 33,110,350 Total Assets 4,943,869$ 70,171,501$
LIABILITIESTaxes Payable 4,732,608$ 18,517,628$ Withholding Payable 211,261 6,662,218
Total Liabilities 4,943,869$ 25,179,846$
172
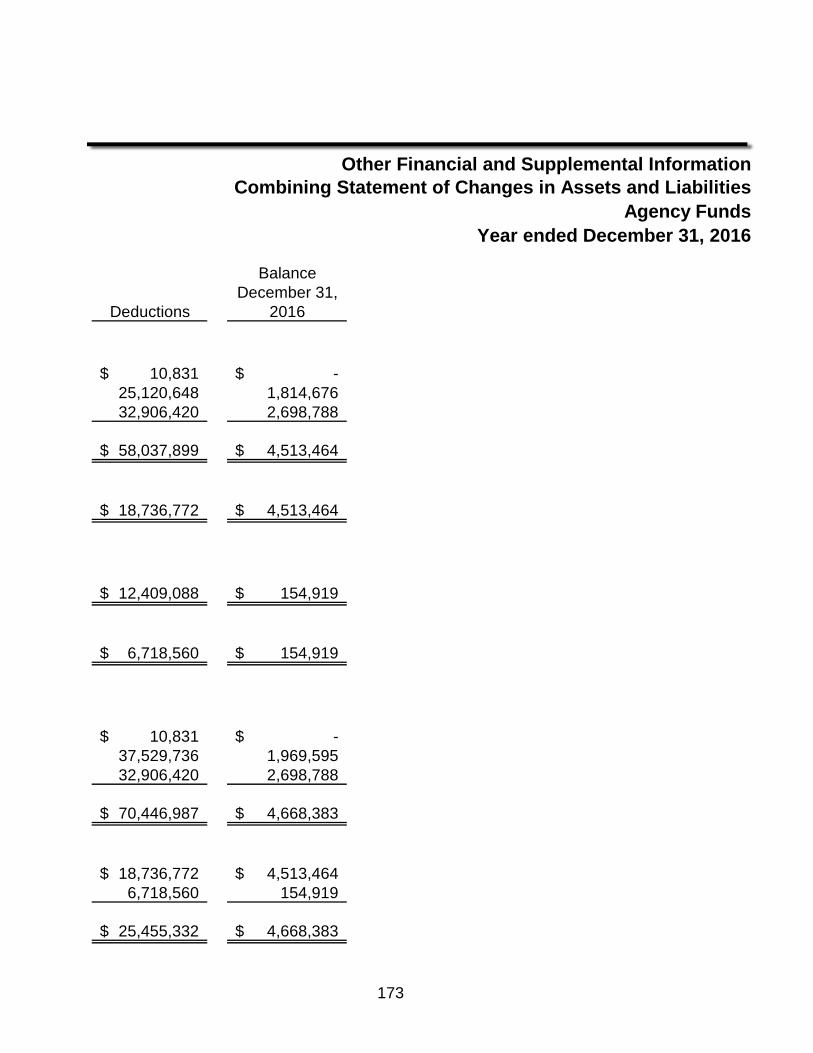
Other Financial and Supplemental InformationCombining Statement of Changes in Assets and Liabilities
Agency FundsYear ended December 31, 2016
BalanceDecember 31,
Deductions 2016
10,831$ -$ 25,120,648 1,814,676 32,906,420 2,698,788
58,037,899$ 4,513,464$
18,736,772$ 4,513,464$
12,409,088$ 154,919$
6,718,560$ 154,919$
10,831$ -$ 37,529,736 1,969,595 32,906,420 2,698,788
70,446,987$ 4,668,383$
18,736,772$ 4,513,464$ 6,718,560 154,919
25,455,332$ 4,668,383$
173

174
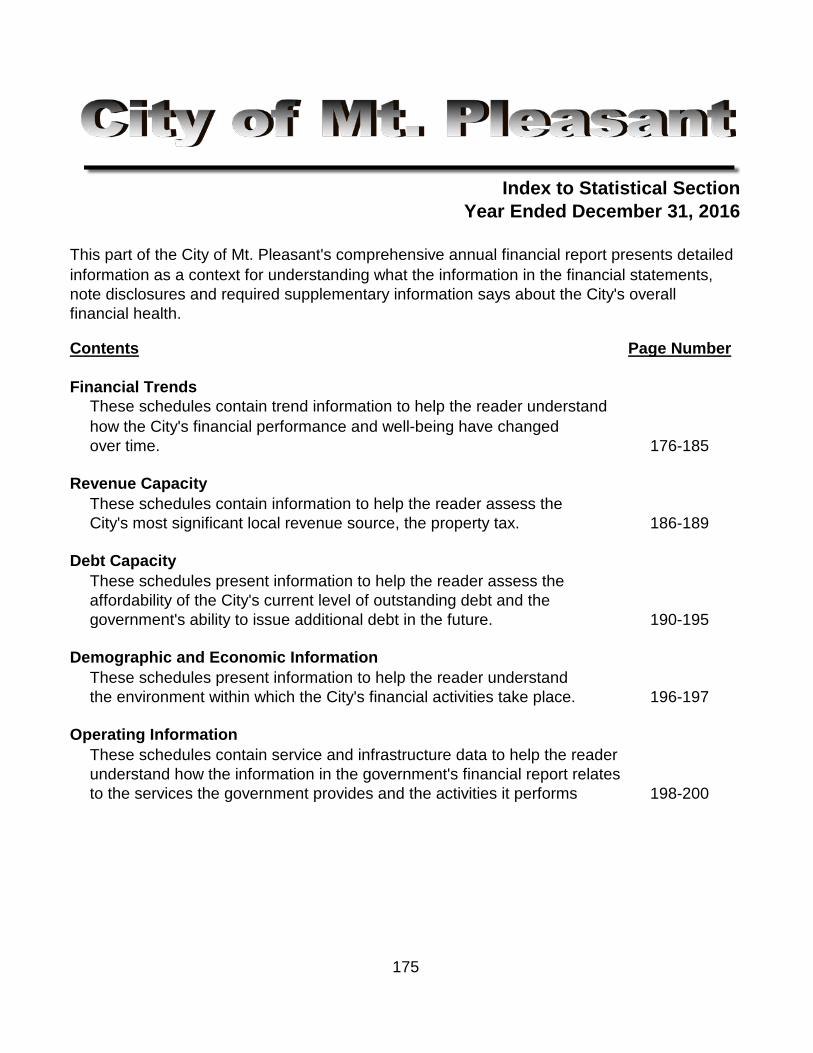
Index to Statistical SectionYear Ended December 31, 2016
This part of the City of Mt. Pleasant's comprehensive annual financial report presents detailedinformation as a context for understanding what the information in the financial statements,note disclosures and required supplementary information says about the City's overallfinancial health.
Contents Page Number
Financial TrendsThese schedules contain trend information to help the reader understandhow the City's financial performance and well-being have changedover time. 176-185
Revenue CapacityThese schedules contain information to help the reader assess theCity's most significant local revenue source, the property tax. 186-189
Debt CapacityThese schedules present information to help the reader assess theaffordability of the City's current level of outstanding debt and the government's ability to issue additional debt in the future. 190-195
Demographic and Economic InformationThese schedules present information to help the reader understandthe environment within which the City's financial activities take place. 196-197
Operating InformationThese schedules contain service and infrastructure data to help the readerunderstand how the information in the government's financial report relatesto the services the government provides and the activities it performs 198-200
175
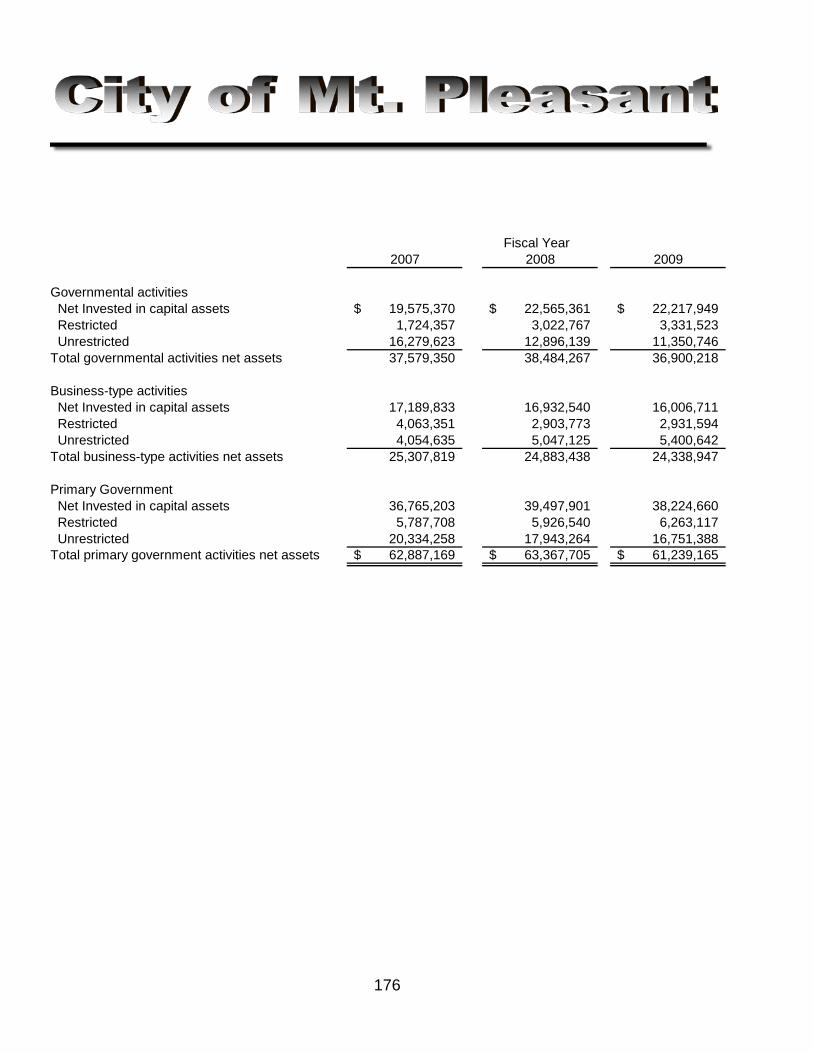
2007 2008 2009
Governmental activities Net Invested in capital assets 19,575,370$ 22,565,361$ 22,217,949$ Restricted 1,724,357 3,022,767 3,331,523 Unrestricted 16,279,623 12,896,139 11,350,746 Total governmental activities net assets 37,579,350 38,484,267 36,900,218
Business-type activities Net Invested in capital assets 17,189,833 16,932,540 16,006,711 Restricted 4,063,351 2,903,773 2,931,594 Unrestricted 4,054,635 5,047,125 5,400,642 Total business-type activities net assets 25,307,819 24,883,438 24,338,947
Primary Government Net Invested in capital assets 36,765,203 39,497,901 38,224,660 Restricted 5,787,708 5,926,540 6,263,117 Unrestricted 20,334,258 17,943,264 16,751,388 Total primary government activities net assets 62,887,169$ 63,367,705$ 61,239,165$
176
Fiscal Year
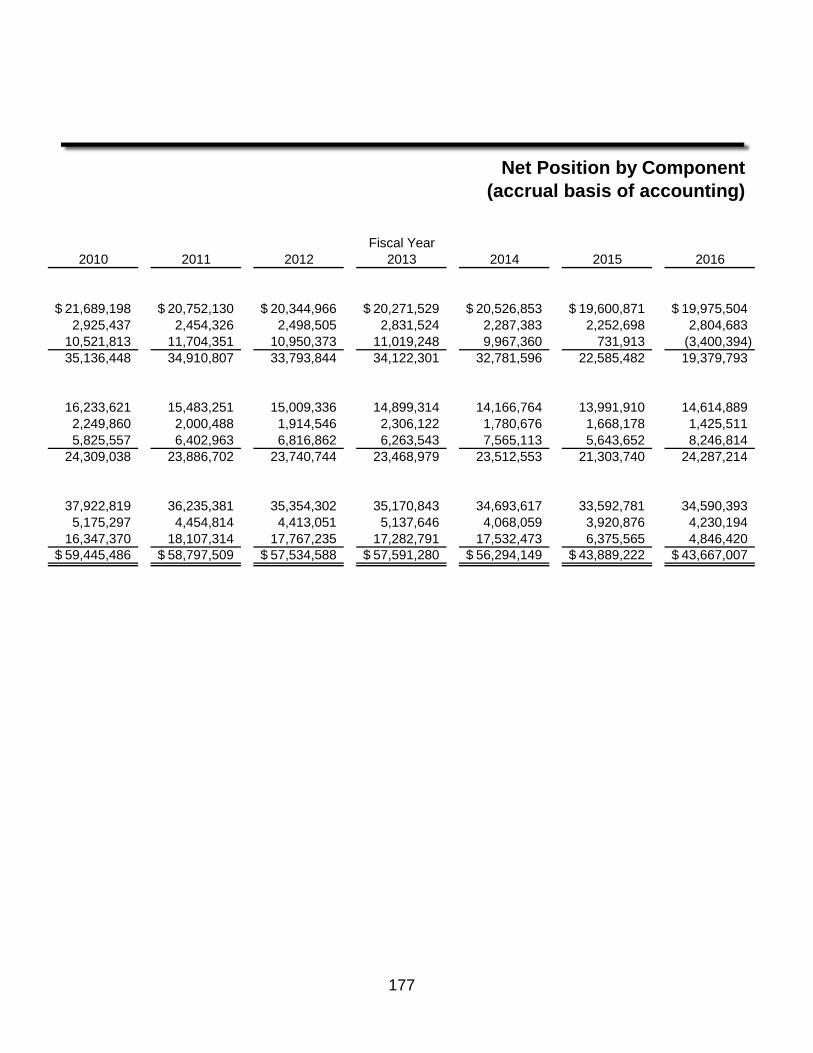
Net Position by Component(accrual basis of accounting)
2010 2011 2012 2013 2014 2015 2016
21,689,198$ 20,752,130$ 20,344,966$ 20,271,529$ 20,526,853$ 19,600,871$ 19,975,504$ 2,925,437 2,454,326 2,498,505 2,831,524 2,287,383 2,252,698 2,804,683
10,521,813 11,704,351 10,950,373 11,019,248 9,967,360 731,913 (3,400,394) 35,136,448 34,910,807 33,793,844 34,122,301 32,781,596 22,585,482 19,379,793
16,233,621 15,483,251 15,009,336 14,899,314 14,166,764 13,991,910 14,614,889 2,249,860 2,000,488 1,914,546 2,306,122 1,780,676 1,668,178 1,425,511 5,825,557 6,402,963 6,816,862 6,263,543 7,565,113 5,643,652 8,246,814
24,309,038 23,886,702 23,740,744 23,468,979 23,512,553 21,303,740 24,287,214
37,922,819 36,235,381 35,354,302 35,170,843 34,693,617 33,592,781 34,590,393 5,175,297 4,454,814 4,413,051 5,137,646 4,068,059 3,920,876 4,230,194
16,347,370 18,107,314 17,767,235 17,282,791 17,532,473 6,375,565 4,846,420 59,445,486$ 58,797,509$ 57,534,588$ 57,591,280$ 56,294,149$ 43,889,222$ 43,667,007$
177
Fiscal Year
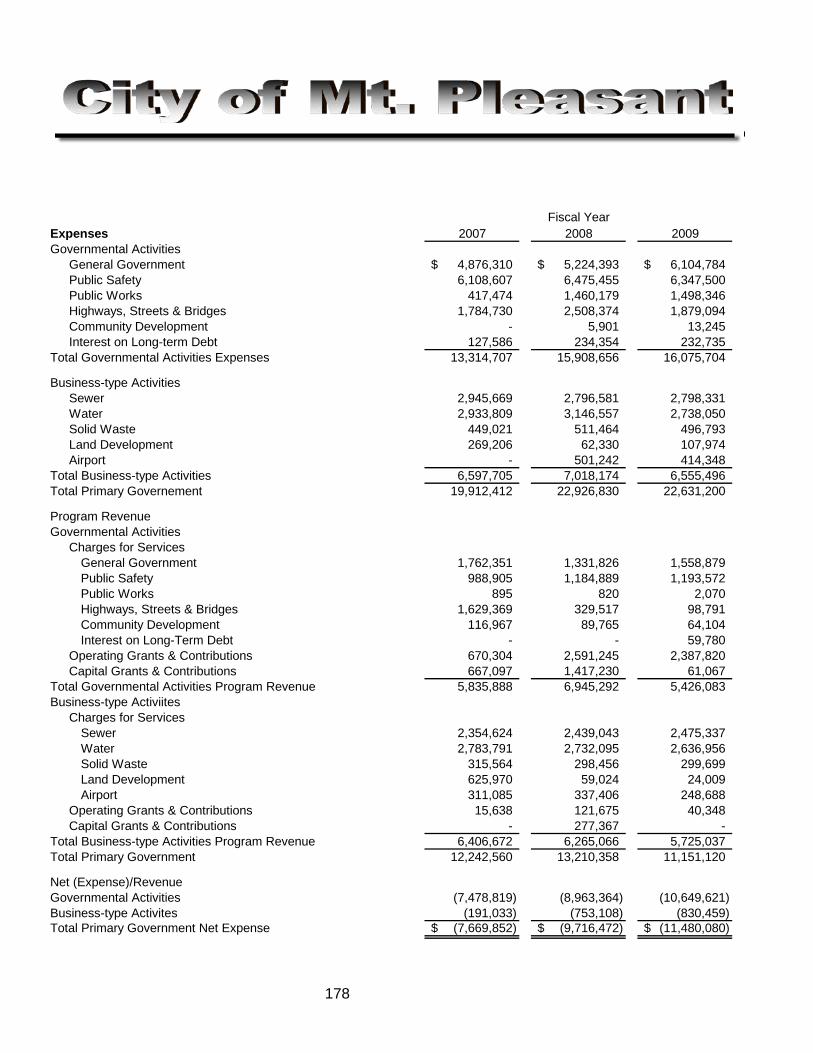
Expenses 2007 2008 2009Governmental Activities
General Government 4,876,310$ 5,224,393$ 6,104,784$ Public Safety 6,108,607 6,475,455 6,347,500 Public Works 417,474 1,460,179 1,498,346 Highways, Streets & Bridges 1,784,730 2,508,374 1,879,094 Community Development - 5,901 13,245 Interest on Long-term Debt 127,586 234,354 232,735
Total Governmental Activities Expenses 13,314,707 15,908,656 16,075,704
Business-type ActivitiesSewer 2,945,669 2,796,581 2,798,331 Water 2,933,809 3,146,557 2,738,050 Solid Waste 449,021 511,464 496,793 Land Development 269,206 62,330 107,974 Airport - 501,242 414,348
Total Business-type Activities 6,597,705 7,018,174 6,555,496 Total Primary Governement 19,912,412 22,926,830 22,631,200
Program RevenueGovernmental Activities
Charges for ServicesGeneral Government 1,762,351 1,331,826 1,558,879 Public Safety 988,905 1,184,889 1,193,572 Public Works 895 820 2,070 Highways, Streets & Bridges 1,629,369 329,517 98,791 Community Development 116,967 89,765 64,104 Interest on Long-Term Debt - - 59,780
Operating Grants & Contributions 670,304 2,591,245 2,387,820 Capital Grants & Contributions 667,097 1,417,230 61,067
Total Governmental Activities Program Revenue 5,835,888 6,945,292 5,426,083 Business-type Activiites
Charges for ServicesSewer 2,354,624 2,439,043 2,475,337 Water 2,783,791 2,732,095 2,636,956 Solid Waste 315,564 298,456 299,699 Land Development 625,970 59,024 24,009 Airport 311,085 337,406 248,688
Operating Grants & Contributions 15,638 121,675 40,348 Capital Grants & Contributions - 277,367 -
Total Business-type Activities Program Revenue 6,406,672 6,265,066 5,725,037 Total Primary Government 12,242,560 13,210,358 11,151,120
Net (Expense)/RevenueGovernmental Activities (7,478,819) (8,963,364) (10,649,621) Business-type Activites (191,033) (753,108) (830,459) Total Primary Government Net Expense (7,669,852)$ (9,716,472)$ (11,480,080)$
178
Fiscal Year
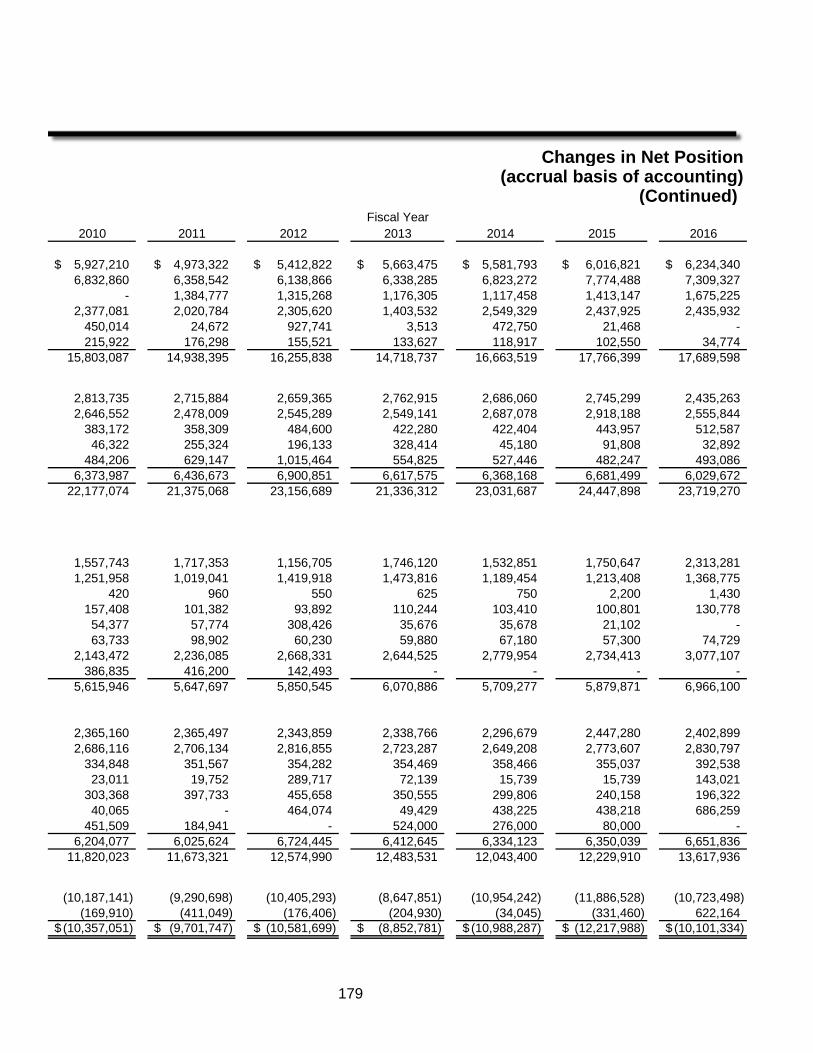
Changes in Net Position(accrual basis of accounting)
(Continued)
2010 2011 2012 2013 2014 2015 2016
5,927,210$ 4,973,322$ 5,412,822$ 5,663,475$ 5,581,793$ 6,016,821$ 6,234,340$ 6,832,860 6,358,542 6,138,866 6,338,285 6,823,272 7,774,488 7,309,327
- 1,384,777 1,315,268 1,176,305 1,117,458 1,413,147 1,675,225 2,377,081 2,020,784 2,305,620 1,403,532 2,549,329 2,437,925 2,435,932
450,014 24,672 927,741 3,513 472,750 21,468 - 215,922 176,298 155,521 133,627 118,917 102,550 34,774
15,803,087 14,938,395 16,255,838 14,718,737 16,663,519 17,766,399 17,689,598
2,813,735 2,715,884 2,659,365 2,762,915 2,686,060 2,745,299 2,435,263 2,646,552 2,478,009 2,545,289 2,549,141 2,687,078 2,918,188 2,555,844
383,172 358,309 484,600 422,280 422,404 443,957 512,587 46,322 255,324 196,133 328,414 45,180 91,808 32,892
484,206 629,147 1,015,464 554,825 527,446 482,247 493,086 6,373,987 6,436,673 6,900,851 6,617,575 6,368,168 6,681,499 6,029,672
22,177,074 21,375,068 23,156,689 21,336,312 23,031,687 24,447,898 23,719,270
1,557,743 1,717,353 1,156,705 1,746,120 1,532,851 1,750,647 2,313,281 1,251,958 1,019,041 1,419,918 1,473,816 1,189,454 1,213,408 1,368,775
420 960 550 625 750 2,200 1,430 157,408 101,382 93,892 110,244 103,410 100,801 130,778 54,377 57,774 308,426 35,676 35,678 21,102 - 63,733 98,902 60,230 59,880 67,180 57,300 74,729
2,143,472 2,236,085 2,668,331 2,644,525 2,779,954 2,734,413 3,077,107 386,835 416,200 142,493 - - - -
5,615,946 5,647,697 5,850,545 6,070,886 5,709,277 5,879,871 6,966,100
2,365,160 2,365,497 2,343,859 2,338,766 2,296,679 2,447,280 2,402,899 2,686,116 2,706,134 2,816,855 2,723,287 2,649,208 2,773,607 2,830,797
334,848 351,567 354,282 354,469 358,466 355,037 392,538 23,011 19,752 289,717 72,139 15,739 15,739 143,021
303,368 397,733 455,658 350,555 299,806 240,158 196,322 40,065 - 464,074 49,429 438,225 438,218 686,259
451,509 184,941 - 524,000 276,000 80,000 - 6,204,077 6,025,624 6,724,445 6,412,645 6,334,123 6,350,039 6,651,836
11,820,023 11,673,321 12,574,990 12,483,531 12,043,400 12,229,910 13,617,936
(10,187,141) (9,290,698) (10,405,293) (8,647,851) (10,954,242) (11,886,528) (10,723,498) (169,910) (411,049) (176,406) (204,930) (34,045) (331,460) 622,164
(10,357,051)$ (9,701,747)$ (10,581,699)$ (8,852,781)$ (10,988,287)$ (12,217,988)$ (10,101,334)$
179
Fiscal Year
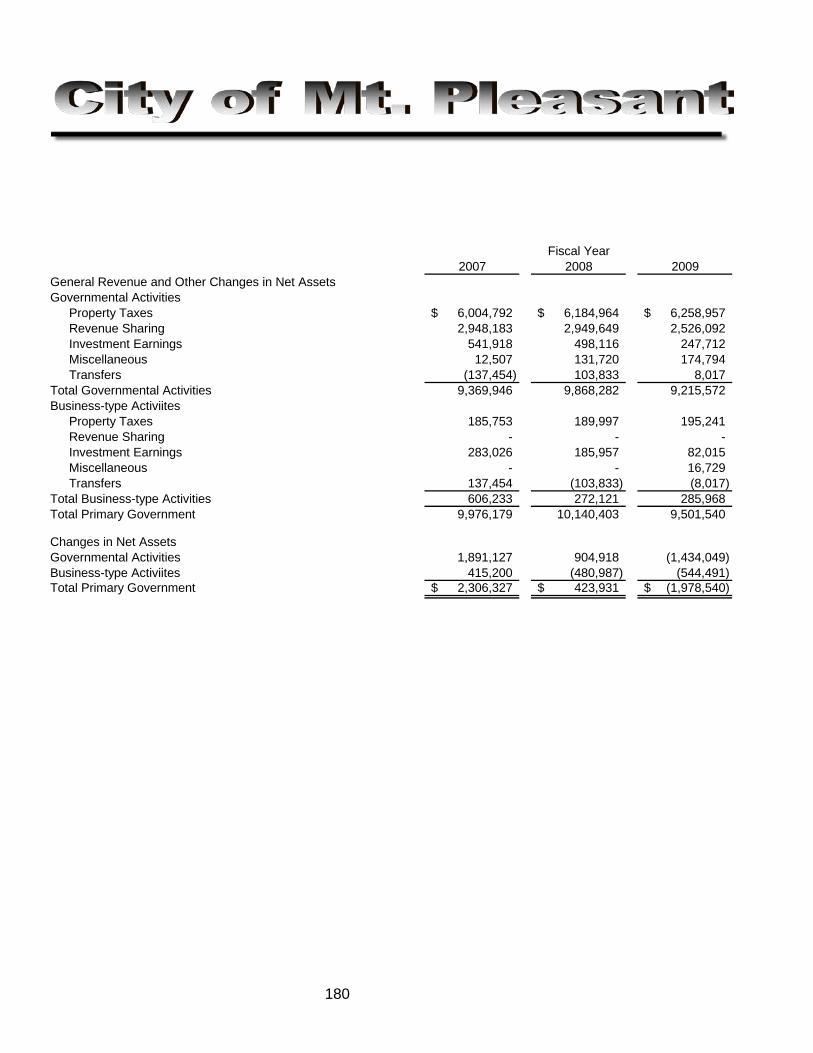
2007 2008 2009General Revenue and Other Changes in Net AssetsGovernmental Activities
Property Taxes 6,004,792$ 6,184,964$ 6,258,957$ Revenue Sharing 2,948,183 2,949,649 2,526,092 Investment Earnings 541,918 498,116 247,712 Miscellaneous 12,507 131,720 174,794 Transfers (137,454) 103,833 8,017
Total Governmental Activities 9,369,946 9,868,282 9,215,572 Business-type Activiites
Property Taxes 185,753 189,997 195,241 Revenue Sharing - - - Investment Earnings 283,026 185,957 82,015 Miscellaneous - - 16,729 Transfers 137,454 (103,833) (8,017)
Total Business-type Activities 606,233 272,121 285,968 Total Primary Government 9,976,179 10,140,403 9,501,540
Changes in Net AssetsGovernmental Activities 1,891,127 904,918 (1,434,049) Business-type Activiites 415,200 (480,987) (544,491) Total Primary Government 2,306,327$ 423,931$ (1,978,540)$
180
Fiscal Year
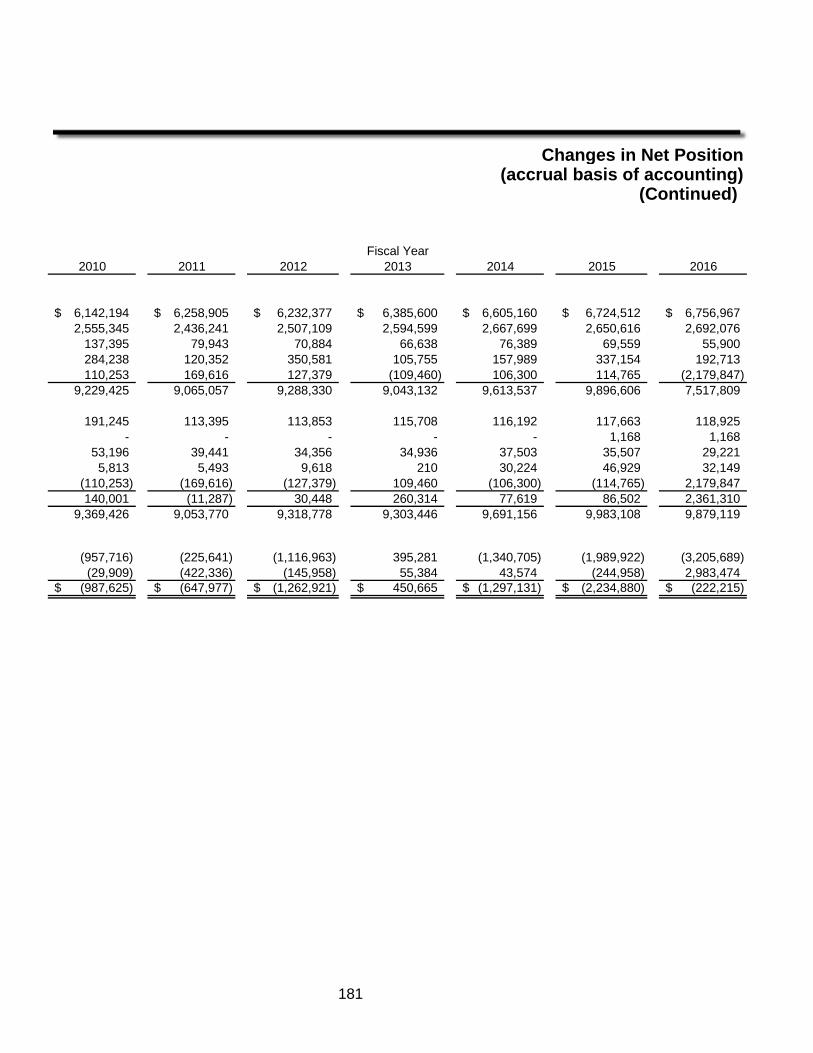
Changes in Net Position(accrual basis of accounting)
(Continued)
2010 2011 2012 2013 2014 2015 2016
6,142,194$ 6,258,905$ 6,232,377$ 6,385,600$ 6,605,160$ 6,724,512$ 6,756,967$ 2,555,345 2,436,241 2,507,109 2,594,599 2,667,699 2,650,616 2,692,076
137,395 79,943 70,884 66,638 76,389 69,559 55,900 284,238 120,352 350,581 105,755 157,989 337,154 192,713 110,253 169,616 127,379 (109,460) 106,300 114,765 (2,179,847)
9,229,425 9,065,057 9,288,330 9,043,132 9,613,537 9,896,606 7,517,809
191,245 113,395 113,853 115,708 116,192 117,663 118,925 - - - - - 1,168 1,168
53,196 39,441 34,356 34,936 37,503 35,507 29,221 5,813 5,493 9,618 210 30,224 46,929 32,149
(110,253) (169,616) (127,379) 109,460 (106,300) (114,765) 2,179,847 140,001 (11,287) 30,448 260,314 77,619 86,502 2,361,310
9,369,426 9,053,770 9,318,778 9,303,446 9,691,156 9,983,108 9,879,119
(957,716) (225,641) (1,116,963) 395,281 (1,340,705) (1,989,922) (3,205,689) (29,909) (422,336) (145,958) 55,384 43,574 (244,958) 2,983,474
(987,625)$ (647,977)$ (1,262,921)$ 450,665$ (1,297,131)$ (2,234,880)$ (222,215)$
181
Fiscal Year
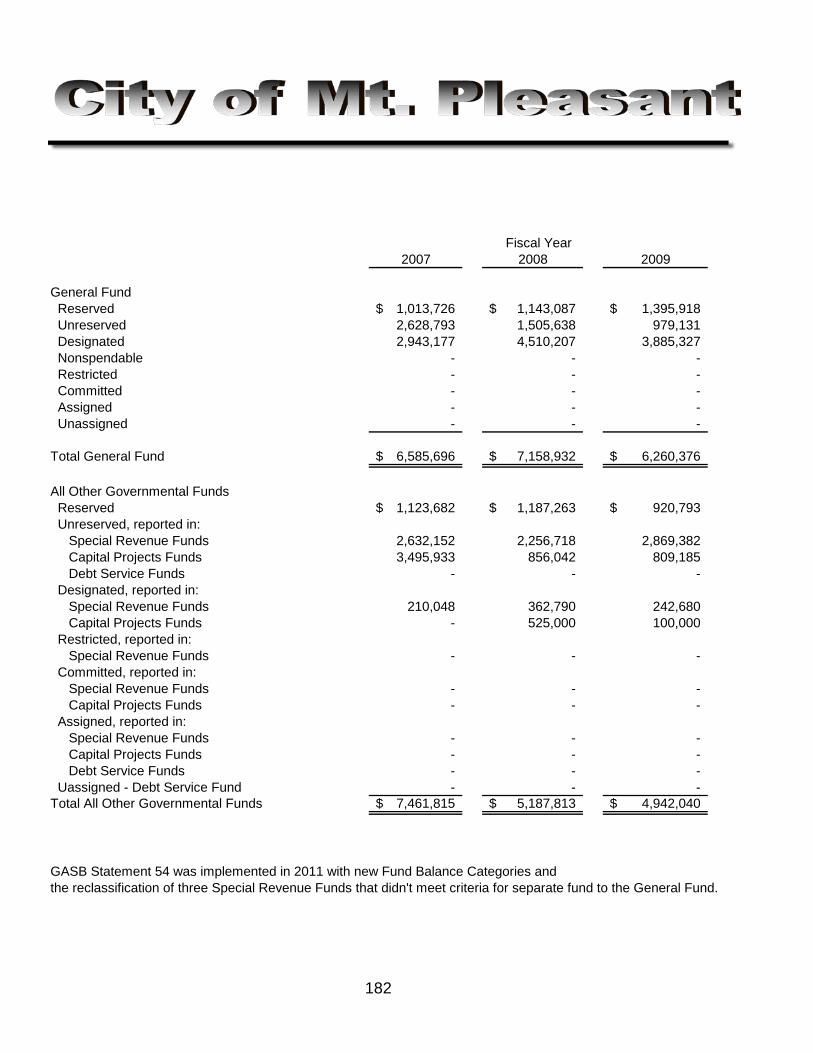
2007 2008 2009
General Fund Reserved 1,013,726$ 1,143,087$ 1,395,918$ Unreserved 2,628,793 1,505,638 979,131 Designated 2,943,177 4,510,207 3,885,327 Nonspendable - - - Restricted - - - Committed - - - Assigned - - - Unassigned - - -
Total General Fund 6,585,696$ 7,158,932$ 6,260,376$
All Other Governmental Funds Reserved 1,123,682$ 1,187,263$ 920,793$ Unreserved, reported in: Special Revenue Funds 2,632,152 2,256,718 2,869,382 Capital Projects Funds 3,495,933 856,042 809,185 Debt Service Funds - - - Designated, reported in: Special Revenue Funds 210,048 362,790 242,680 Capital Projects Funds - 525,000 100,000 Restricted, reported in: Special Revenue Funds - - - Committed, reported in: Special Revenue Funds - - - Capital Projects Funds - - - Assigned, reported in: Special Revenue Funds - - - Capital Projects Funds - - - Debt Service Funds - - - Uassigned - Debt Service Fund - - - Total All Other Governmental Funds 7,461,815$ 5,187,813$ 4,942,040$
GASB Statement 54 was implemented in 2011 with new Fund Balance Categories andthe reclassification of three Special Revenue Funds that didn't meet criteria for separate fund to the General Fund.
Fiscal Year
182

Fund Balances of Governmental Funds(modified accrual basis of accounting)
2010 2011 2012 2013 2014 2015 2016
1,155,909$ -$ -$ -$ -$ -$ -$ 859,676 - - - - - -
3,380,327 - - - - - - - 424,420 414,420 376,960 367,080 449,770 395,330 - 541,697 475,275 415,789 388,014 213,102 542,173 - 361,380 365,837 368,621 362,834 369,089 286,202 - 5,633,395 6,090,290 5,921,185 5,639,817 5,614,842 1,738,705 - 444,638 621,489 976,077 1,104,135 1,334,427 2,525,213
5,395,912$ 7,405,530$ 7,967,311$ 8,058,632$ 7,861,880$ 7,981,230$ 5,487,623$
905,249$ -$ -$ -$ -$ -$ -$
2,659,954 - - - - - - 550,005 - - - - - -
- - - - - - -
172,703 - - - - - - 218,400 - - - - - -
- 1,777,660 1,894,162 2,205,787 1,764,077 1,927,409 2,123,308
- 156,803 159,848 165,148 170,923 180,101 187,064 - 726,659 833,370 787,460 810,756 914,271 1,221,165
- 1,029 19,698 89,731 1,509 1,227 18,129 - 210,085 133,472 62,790 77,293 - - - - 49,268 127,210 - 106,588 62,148 - (22,302) - - - - -
4,506,311$ 2,849,934$ 3,089,818$ 3,438,126$ 2,824,558$ 3,129,596$ 3,611,814$
Fiscal Year
183
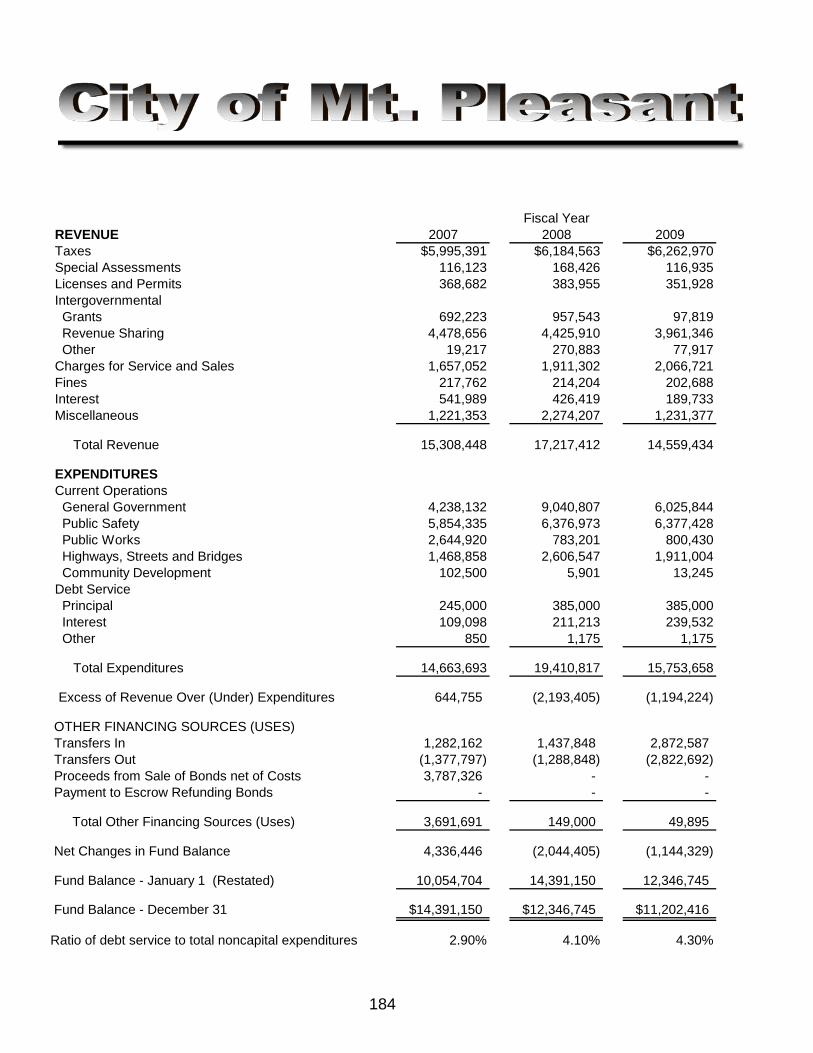
REVENUE 2007 2008 2009Taxes $5,995,391 $6,184,563 $6,262,970Special Assessments 116,123 168,426 116,935Licenses and Permits 368,682 383,955 351,928Intergovernmental Grants 692,223 957,543 97,819 Revenue Sharing 4,478,656 4,425,910 3,961,346 Other 19,217 270,883 77,917Charges for Service and Sales 1,657,052 1,911,302 2,066,721Fines 217,762 214,204 202,688Interest 541,989 426,419 189,733Miscellaneous 1,221,353 2,274,207 1,231,377
Total Revenue 15,308,448 17,217,412 14,559,434
EXPENDITURESCurrent Operations General Government 4,238,132 9,040,807 6,025,844 Public Safety 5,854,335 6,376,973 6,377,428 Public Works 2,644,920 783,201 800,430 Highways, Streets and Bridges 1,468,858 2,606,547 1,911,004 Community Development 102,500 5,901 13,245Debt Service Principal 245,000 385,000 385,000 Interest 109,098 211,213 239,532 Other 850 1,175 1,175
Total Expenditures 14,663,693 19,410,817 15,753,658
Excess of Revenue Over (Under) Expenditures 644,755 (2,193,405) (1,194,224)
OTHER FINANCING SOURCES (USES) Transfers In 1,282,162 1,437,848 2,872,587 Transfers Out (1,377,797) (1,288,848) (2,822,692) Proceeds from Sale of Bonds net of Costs 3,787,326 - - Payment to Escrow Refunding Bonds - - -
Total Other Financing Sources (Uses) 3,691,691 149,000 49,895
Net Changes in Fund Balance 4,336,446 (2,044,405) (1,144,329)
Fund Balance - January 1 (Restated) 10,054,704 14,391,150 12,346,745
Fund Balance - December 31 $14,391,150 $12,346,745 $11,202,416
Ratio of debt service to total noncapital expenditures 2.90% 4.10% 4.30%
184
Fiscal Year
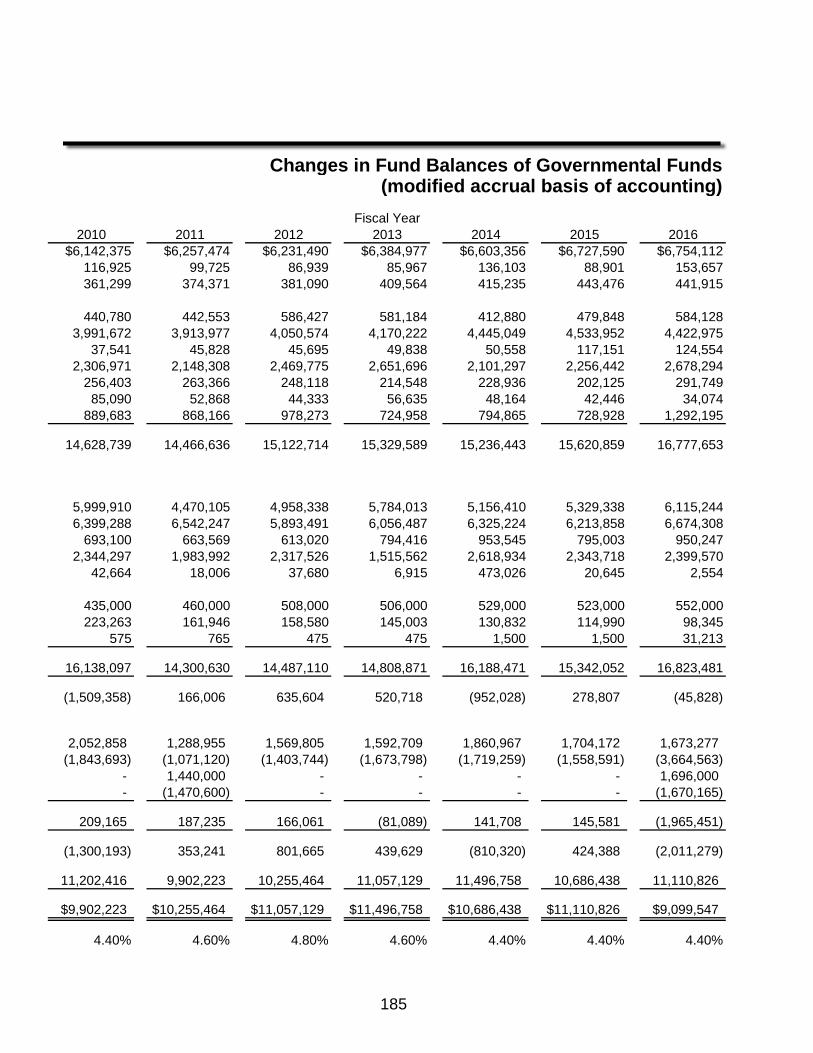
Changes in Fund Balances of Governmental Funds(modified accrual basis of accounting)
2010 2011 2012 2013 2014 2015 2016$6,142,375 $6,257,474 $6,231,490 $6,384,977 $6,603,356 $6,727,590 $6,754,112
116,925 99,725 86,939 85,967 136,103 88,901 153,657361,299 374,371 381,090 409,564 415,235 443,476 441,915
440,780 442,553 586,427 581,184 412,880 479,848 584,1283,991,672 3,913,977 4,050,574 4,170,222 4,445,049 4,533,952 4,422,975
37,541 45,828 45,695 49,838 50,558 117,151 124,5542,306,971 2,148,308 2,469,775 2,651,696 2,101,297 2,256,442 2,678,294
256,403 263,366 248,118 214,548 228,936 202,125 291,74985,090 52,868 44,333 56,635 48,164 42,446 34,074
889,683 868,166 978,273 724,958 794,865 728,928 1,292,195
14,628,739 14,466,636 15,122,714 15,329,589 15,236,443 15,620,859 16,777,653
5,999,910 4,470,105 4,958,338 5,784,013 5,156,410 5,329,338 6,115,2446,399,288 6,542,247 5,893,491 6,056,487 6,325,224 6,213,858 6,674,308
693,100 663,569 613,020 794,416 953,545 795,003 950,2472,344,297 1,983,992 2,317,526 1,515,562 2,618,934 2,343,718 2,399,570
42,664 18,006 37,680 6,915 473,026 20,645 2,554
435,000 460,000 508,000 506,000 529,000 523,000 552,000223,263 161,946 158,580 145,003 130,832 114,990 98,345
575 765 475 475 1,500 1,500 31,213
16,138,097 14,300,630 14,487,110 14,808,871 16,188,471 15,342,052 16,823,481
(1,509,358) 166,006 635,604 520,718 (952,028) 278,807 (45,828)
2,052,858 1,288,955 1,569,805 1,592,709 1,860,967 1,704,172 1,673,277(1,843,693) (1,071,120) (1,403,744) (1,673,798) (1,719,259) (1,558,591) (3,664,563)
- 1,440,000 - - - - 1,696,000 - (1,470,600) - - - - (1,670,165)
209,165 187,235 166,061 (81,089) 141,708 145,581 (1,965,451)
(1,300,193) 353,241 801,665 439,629 (810,320) 424,388 (2,011,279)
11,202,416 9,902,223 10,255,464 11,057,129 11,496,758 10,686,438 11,110,826
$9,902,223 $10,255,464 $11,057,129 $11,496,758 $10,686,438 $11,110,826 $9,099,547
4.40% 4.60% 4.80% 4.60% 4.40% 4.40% 4.40%
185
Fiscal Year
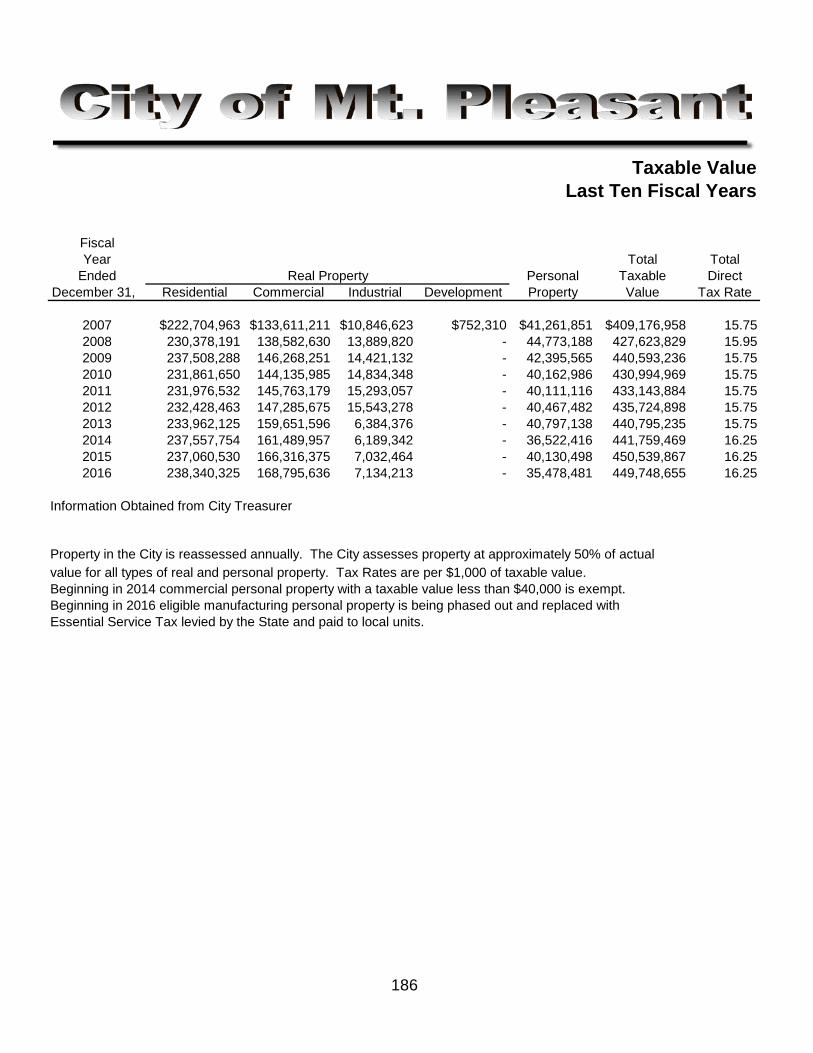
Taxable ValueLast Ten Fiscal Years
FiscalYear Total Total
Ended Personal Taxable DirectDecember 31, Residential Commercial Industrial Development Property Value Tax Rate
2007 $222,704,963 $133,611,211 $10,846,623 $752,310 $41,261,851 $409,176,958 15.752008 230,378,191 138,582,630 13,889,820 - 44,773,188 427,623,829 15.952009 237,508,288 146,268,251 14,421,132 - 42,395,565 440,593,236 15.752010 231,861,650 144,135,985 14,834,348 - 40,162,986 430,994,969 15.752011 231,976,532 145,763,179 15,293,057 - 40,111,116 433,143,884 15.752012 232,428,463 147,285,675 15,543,278 - 40,467,482 435,724,898 15.752013 233,962,125 159,651,596 6,384,376 - 40,797,138 440,795,235 15.752014 237,557,754 161,489,957 6,189,342 - 36,522,416 441,759,469 16.252015 237,060,530 166,316,375 7,032,464 - 40,130,498 450,539,867 16.252016 238,340,325 168,795,636 7,134,213 - 35,478,481 449,748,655 16.25
Information Obtained from City Treasurer
Property in the City is reassessed annually. The City assesses property at approximately 50% of actualvalue for all types of real and personal property. Tax Rates are per $1,000 of taxable value.Beginning in 2014 commercial personal property with a taxable value less than $40,000 is exempt.Beginning in 2016 eligible manufacturing personal property is being phased out and replaced withEssential Service Tax levied by the State and paid to local units.
Real Property
186
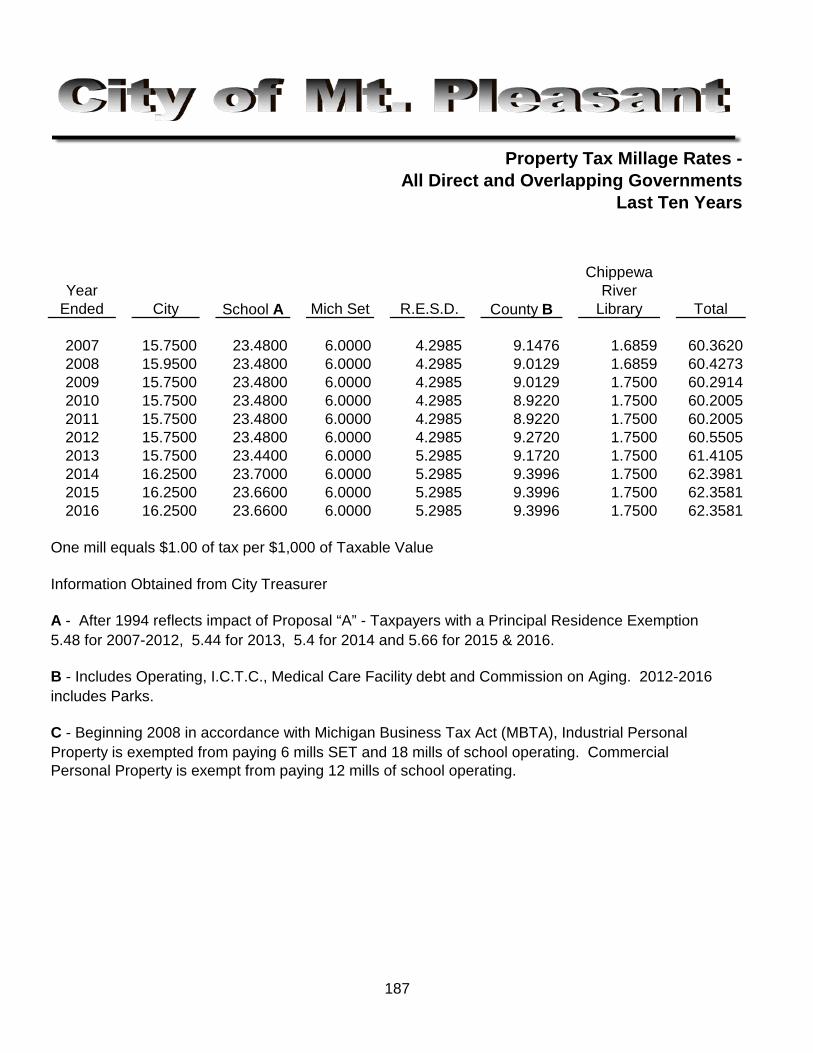
Property Tax Millage Rates -All Direct and Overlapping Governments
Last Ten Years
ChippewaYear River
Ended City School A Mich Set R.E.S.D. County B Library Total
2007 15.7500 23.4800 6.0000 4.2985 9.1476 1.6859 60.36202008 15.9500 23.4800 6.0000 4.2985 9.0129 1.6859 60.42732009 15.7500 23.4800 6.0000 4.2985 9.0129 1.7500 60.29142010 15.7500 23.4800 6.0000 4.2985 8.9220 1.7500 60.20052011 15.7500 23.4800 6.0000 4.2985 8.9220 1.7500 60.20052012 15.7500 23.4800 6.0000 4.2985 9.2720 1.7500 60.55052013 15.7500 23.4400 6.0000 5.2985 9.1720 1.7500 61.41052014 16.2500 23.7000 6.0000 5.2985 9.3996 1.7500 62.39812015 16.2500 23.6600 6.0000 5.2985 9.3996 1.7500 62.35812016 16.2500 23.6600 6.0000 5.2985 9.3996 1.7500 62.3581
Information Obtained from City Treasurer
A - After 1994 reflects impact of Proposal “A” - Taxpayers with a Principal Residence Exemption5.48 for 2007-2012, 5.44 for 2013, 5.4 for 2014 and 5.66 for 2015 & 2016.
B - Includes Operating, I.C.T.C., Medical Care Facility debt and Commission on Aging. 2012-2016includes Parks.
C - Beginning 2008 in accordance with Michigan Business Tax Act (MBTA), Industrial PersonalProperty is exempted from paying 6 mills SET and 18 mills of school operating. CommercialPersonal Property is exempt from paying 12 mills of school operating.
187
One mill equals $1.00 of tax per $1,000 of Taxable Value
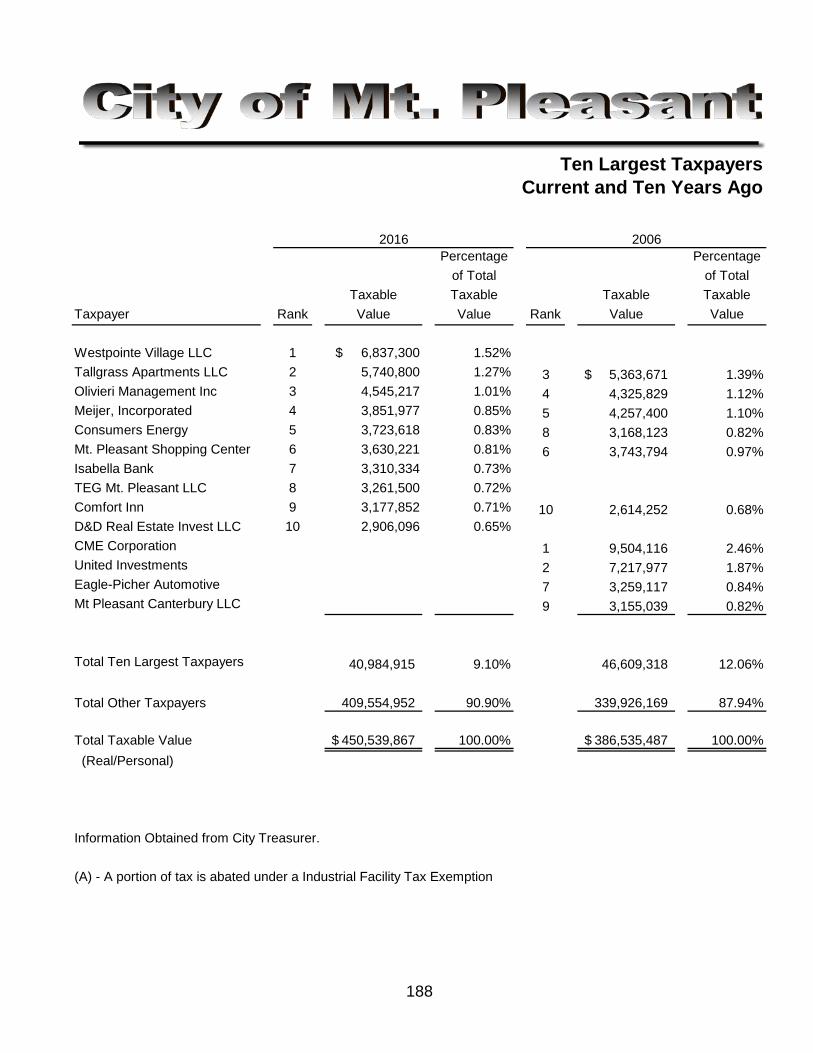
Ten Largest TaxpayersCurrent and Ten Years Ago
Percentage Percentageof Total of Total
Taxable Taxable Taxable Taxable Taxpayer Rank Value Value Rank Value Value
Westpointe Village LLC 1 $ 6,837,300 1.52%Tallgrass Apartments LLC 2 5,740,800 1.27% 3 5,363,671$ 1.39%Olivieri Management Inc 3 4,545,217 1.01% 4 4,325,829 1.12%Meijer, Incorporated 4 3,851,977 0.85% 5 4,257,400 1.10%Consumers Energy 5 3,723,618 0.83% 8 3,168,123 0.82%Mt. Pleasant Shopping Center 6 3,630,221 0.81% 6 3,743,794 0.97%Isabella Bank 7 3,310,334 0.73%TEG Mt. Pleasant LLC 8 3,261,500 0.72%Comfort Inn 9 3,177,852 0.71% 10 2,614,252 0.68%D&D Real Estate Invest LLC 10 2,906,096 0.65%CME Corporation 1 9,504,116 2.46%United Investments 2 7,217,977 1.87%Eagle-Picher Automotive 7 3,259,117 0.84%Mt Pleasant Canterbury LLC 9 3,155,039 0.82%
Total Ten Largest Taxpayers 40,984,915 9.10% 46,609,318 12.06%
Total Other Taxpayers 409,554,952 90.90% 339,926,169 87.94%
Total Taxable Value 450,539,867$ 100.00% 386,535,487$ 100.00% (Real/Personal)
Information Obtained from City Treasurer.
(A) - A portion of tax is abated under a Industrial Facility Tax Exemption
2016 2006
188
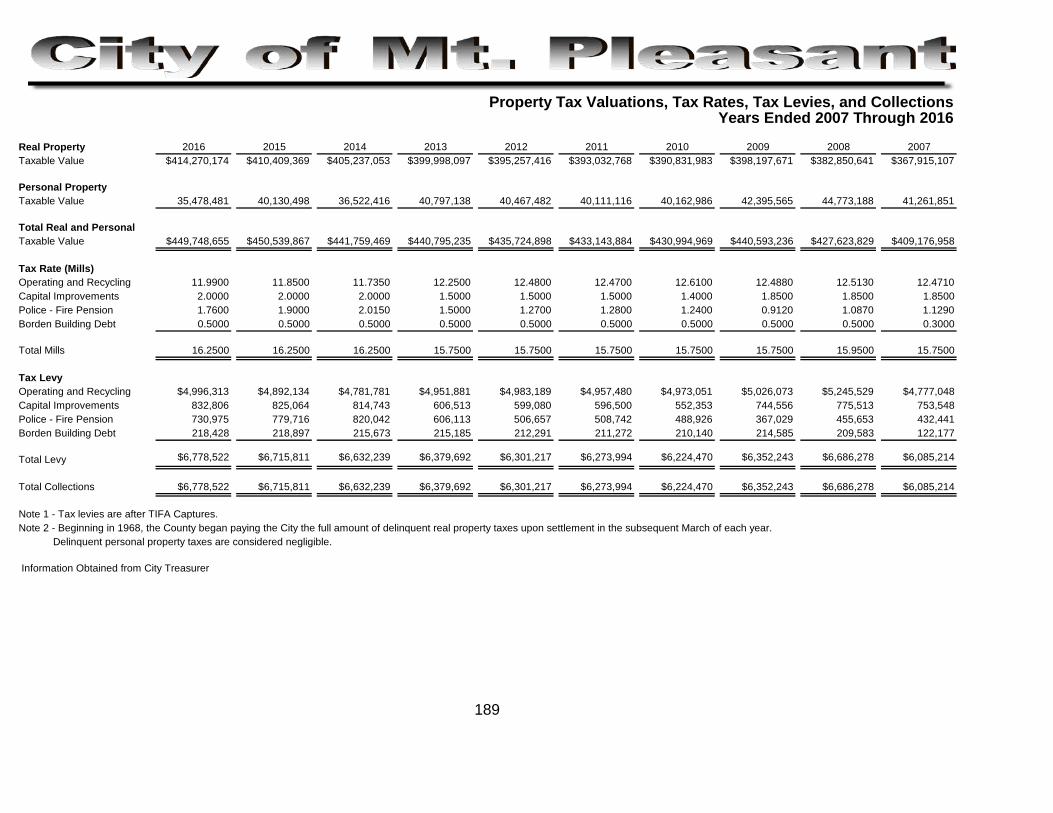
Property Tax Valuations, Tax Rates, Tax Levies, and CollectionsYears Ended 2007 Through 2016
Real Property 2016 2015 2014 2013 2012 2011 2010 2009 2008 2007Taxable Value $414,270,174 $410,409,369 $405,237,053 $399,998,097 $395,257,416 $393,032,768 $390,831,983 $398,197,671 $382,850,641 $367,915,107
Personal PropertyTaxable Value 35,478,481 40,130,498 36,522,416 40,797,138 40,467,482 40,111,116 40,162,986 42,395,565 44,773,188 41,261,851
Total Real and PersonalTaxable Value $449,748,655 $450,539,867 $441,759,469 $440,795,235 $435,724,898 $433,143,884 $430,994,969 $440,593,236 $427,623,829 $409,176,958
Tax Rate (Mills)Operating and Recycling 11.9900 11.8500 11.7350 12.2500 12.4800 12.4700 12.6100 12.4880 12.5130 12.4710Capital Improvements 2.0000 2.0000 2.0000 1.5000 1.5000 1.5000 1.4000 1.8500 1.8500 1.8500Police - Fire Pension 1.7600 1.9000 2.0150 1.5000 1.2700 1.2800 1.2400 0.9120 1.0870 1.1290Borden Building Debt 0.5000 0.5000 0.5000 0.5000 0.5000 0.5000 0.5000 0.5000 0.5000 0.3000
Total Mills 16.2500 16.2500 16.2500 15.7500 15.7500 15.7500 15.7500 15.7500 15.9500 15.7500
Tax LevyOperating and Recycling $4,996,313 $4,892,134 $4,781,781 $4,951,881 $4,983,189 $4,957,480 $4,973,051 $5,026,073 $5,245,529 $4,777,048 Capital Improvements 832,806 825,064 814,743 606,513 599,080 596,500 552,353 744,556 775,513 753,548Police - Fire Pension 730,975 779,716 820,042 606,113 506,657 508,742 488,926 367,029 455,653 432,441Borden Building Debt 218,428 218,897 215,673 215,185 212,291 211,272 210,140 214,585 209,583 122,177
Total Levy $6,778,522 $6,715,811 $6,632,239 $6,379,692 $6,301,217 $6,273,994 $6,224,470 $6,352,243 $6,686,278 $6,085,214
Total Collections $6,778,522 $6,715,811 $6,632,239 $6,379,692 $6,301,217 $6,273,994 $6,224,470 $6,352,243 $6,686,278 $6,085,214
Note 1 - Tax levies are after TIFA Captures.Note 2 - Beginning in 1968, the County began paying the City the full amount of delinquent real property taxes upon settlement in the subsequent March of each year. Delinquent personal property taxes are considered negligible.
Information Obtained from City Treasurer
189
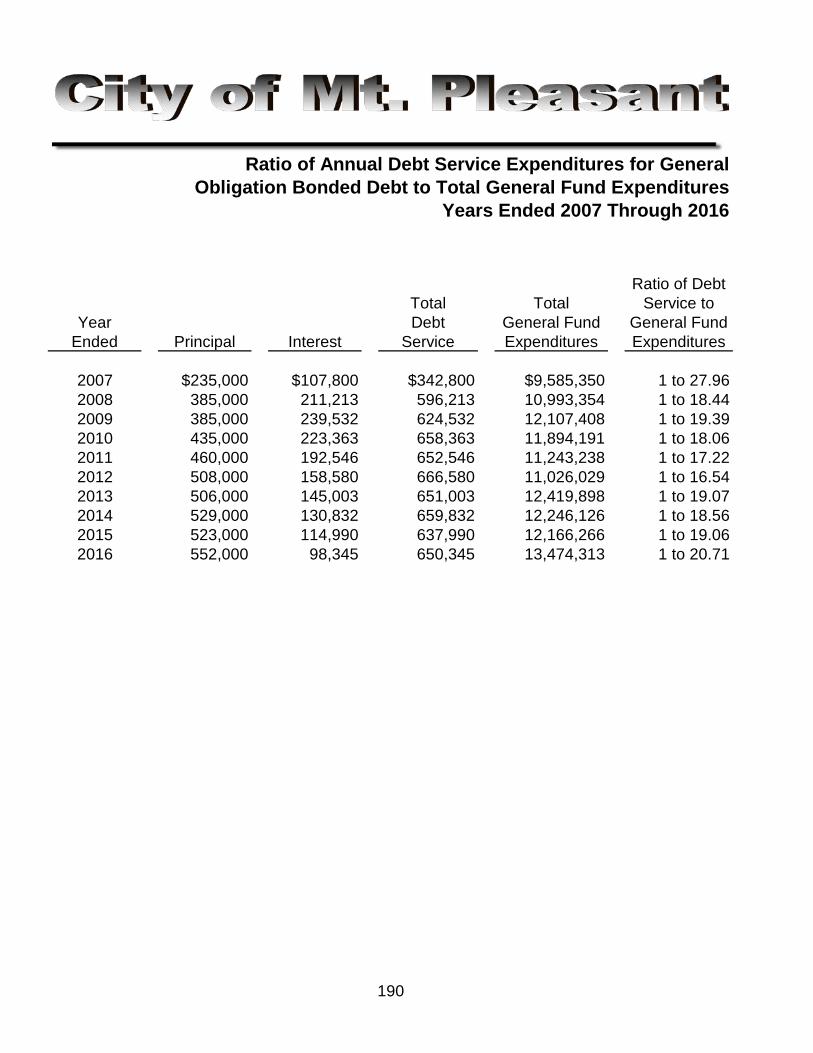
Ratio of Annual Debt Service Expenditures for GeneralObligation Bonded Debt to Total General Fund Expenditures
Years Ended 2007 Through 2016
Ratio of DebtTotal Total Service to
Year Debt General Fund General FundEnded Principal Interest Service Expenditures Expenditures
2007 $235,000 $107,800 $342,800 $9,585,350 1 to 27.962008 385,000 211,213 596,213 10,993,354 1 to 18.442009 385,000 239,532 624,532 12,107,408 1 to 19.392010 435,000 223,363 658,363 11,894,191 1 to 18.062011 460,000 192,546 652,546 11,243,238 1 to 17.222012 508,000 158,580 666,580 11,026,029 1 to 16.542013 506,000 145,003 651,003 12,419,898 1 to 19.072014 529,000 130,832 659,832 12,246,126 1 to 18.562015 523,000 114,990 637,990 12,166,266 1 to 19.062016 552,000 98,345 650,345 13,474,313 1 to 20.71
190
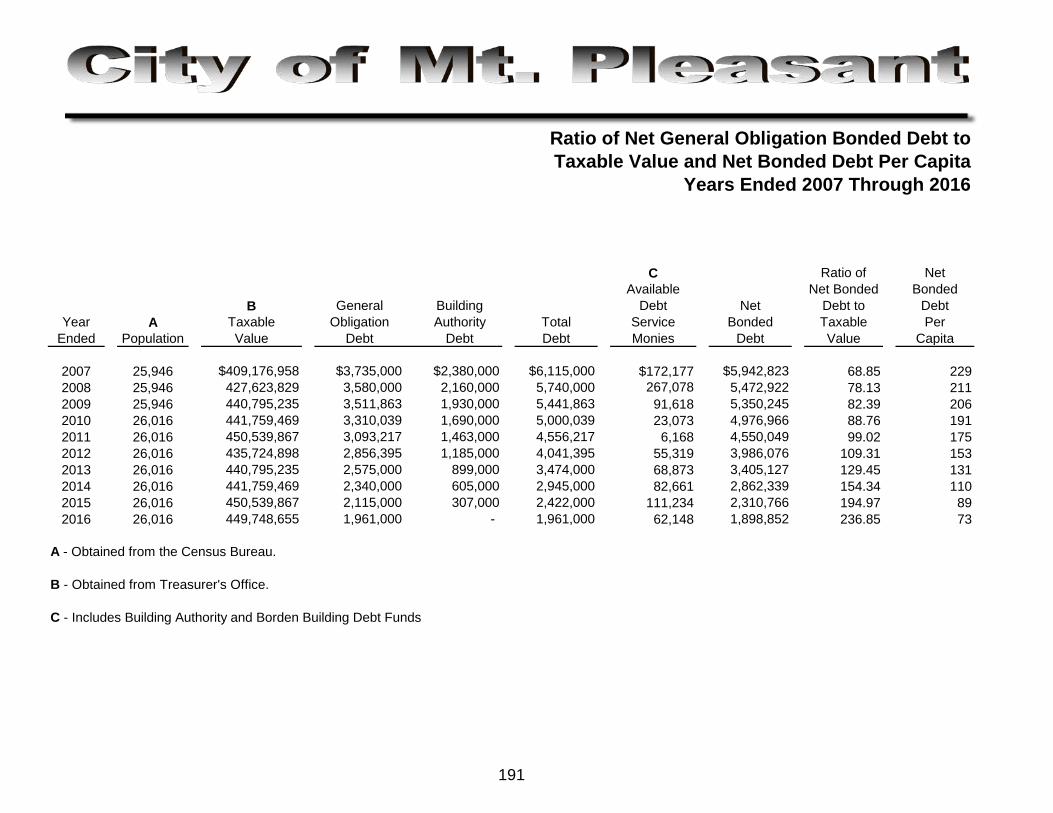
Ratio of Net General Obligation Bonded Debt toTaxable Value and Net Bonded Debt Per Capita
Years Ended 2007 Through 2016
C Ratio of NetAvailable Net Bonded Bonded
B General Building Debt Net Debt to DebtYear A Taxable Obligation Authority Total Service Bonded Taxable Per
Ended Population Value Debt Debt Debt Monies Debt Value Capita
2007 25,946 $409,176,958 $3,735,000 $2,380,000 $6,115,000 $172,177 $5,942,823 68.85 2292008 25,946 427,623,829 3,580,000 2,160,000 5,740,000 267,078 5,472,922 78.13 2112009 25,946 440,795,235 3,511,863 1,930,000 5,441,863 91,618 5,350,245 82.39 2062010 26,016 441,759,469 3,310,039 1,690,000 5,000,039 23,073 4,976,966 88.76 1912011 26,016 450,539,867 3,093,217 1,463,000 4,556,217 6,168 4,550,049 99.02 1752012 26,016 435,724,898 2,856,395 1,185,000 4,041,395 55,319 3,986,076 109.31 1532013 26,016 440,795,235 2,575,000 899,000 3,474,000 68,873 3,405,127 129.45 1312014 26,016 441,759,469 2,340,000 605,000 2,945,000 82,661 2,862,339 154.34 1102015 26,016 450,539,867 2,115,000 307,000 2,422,000 111,234 2,310,766 194.97 892016 26,016 449,748,655 1,961,000 - 1,961,000 62,148 1,898,852 236.85 73
A - Obtained from the Census Bureau.
B - Obtained from Treasurer's Office.
C - Includes Building Authority and Borden Building Debt Funds
191
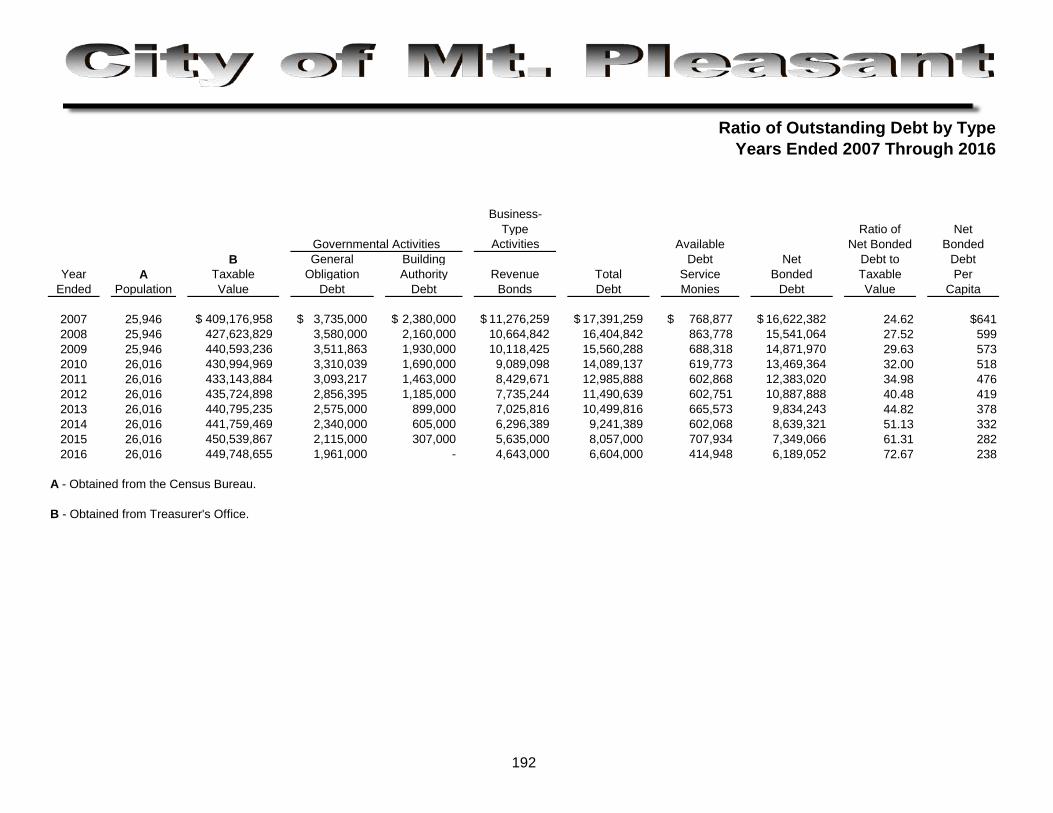
Ratio of Outstanding Debt by TypeYears Ended 2007 Through 2016
Business-Type Ratio of Net
Activities Available Net Bonded BondedB General Building Debt Net Debt to Debt
Year A Taxable Obligation Authority Revenue Total Service Bonded Taxable PerEnded Population Value Debt Debt Bonds Debt Monies Debt Value Capita
2007 25,946 409,176,958$ 3,735,000$ 2,380,000$ 11,276,259$ 17,391,259$ 768,877$ 16,622,382$ 24.62 $6412008 25,946 427,623,829 3,580,000 2,160,000 10,664,842 16,404,842 863,778 15,541,064 27.52 5992009 25,946 440,593,236 3,511,863 1,930,000 10,118,425 15,560,288 688,318 14,871,970 29.63 5732010 26,016 430,994,969 3,310,039 1,690,000 9,089,098 14,089,137 619,773 13,469,364 32.00 5182011 26,016 433,143,884 3,093,217 1,463,000 8,429,671 12,985,888 602,868 12,383,020 34.98 4762012 26,016 435,724,898 2,856,395 1,185,000 7,735,244 11,490,639 602,751 10,887,888 40.48 4192013 26,016 440,795,235 2,575,000 899,000 7,025,816 10,499,816 665,573 9,834,243 44.82 3782014 26,016 441,759,469 2,340,000 605,000 6,296,389 9,241,389 602,068 8,639,321 51.13 3322015 26,016 450,539,867 2,115,000 307,000 5,635,000 8,057,000 707,934 7,349,066 61.31 2822016 26,016 449,748,655 1,961,000 - 4,643,000 6,604,000 414,948 6,189,052 72.67 238
A - Obtained from the Census Bureau.
B - Obtained from Treasurer's Office.
192
Governmental Activities
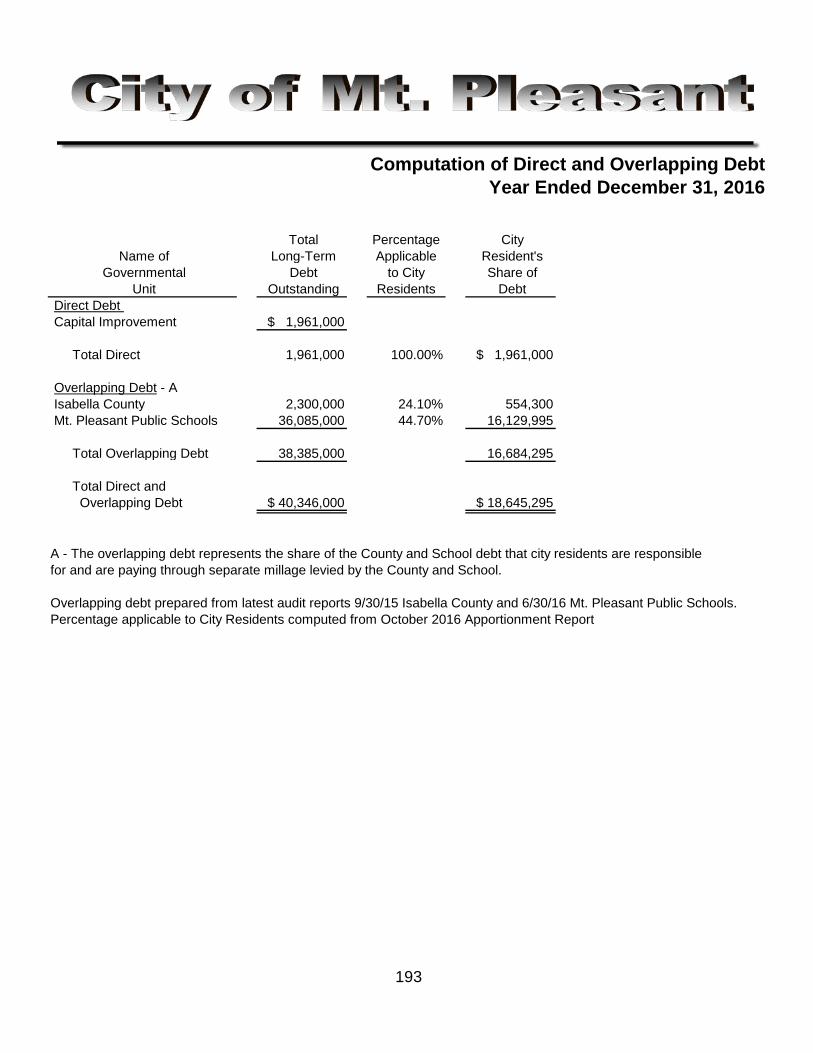
Computation of Direct and Overlapping DebtYear Ended December 31, 2016
Total Percentage City Name of Long-Term Applicable Resident's
Governmental Debt to City Share of Unit Outstanding Residents Debt
Direct Debt Capital Improvement $ 1,961,000
Total Direct 1,961,000 100.00% $ 1,961,000
Overlapping Debt - A Isabella County 2,300,000 24.10% 554,300 Mt. Pleasant Public Schools 36,085,000 44.70% 16,129,995
Total Overlapping Debt 38,385,000 16,684,295
Total Direct and Overlapping Debt $ 40,346,000 $ 18,645,295
A - The overlapping debt represents the share of the County and School debt that city residents are responsiblefor and are paying through separate millage levied by the County and School.
Overlapping debt prepared from latest audit reports 9/30/15 Isabella County and 6/30/16 Mt. Pleasant Public Schools. Percentage applicable to City Residents computed from October 2016 Apportionment Report
193
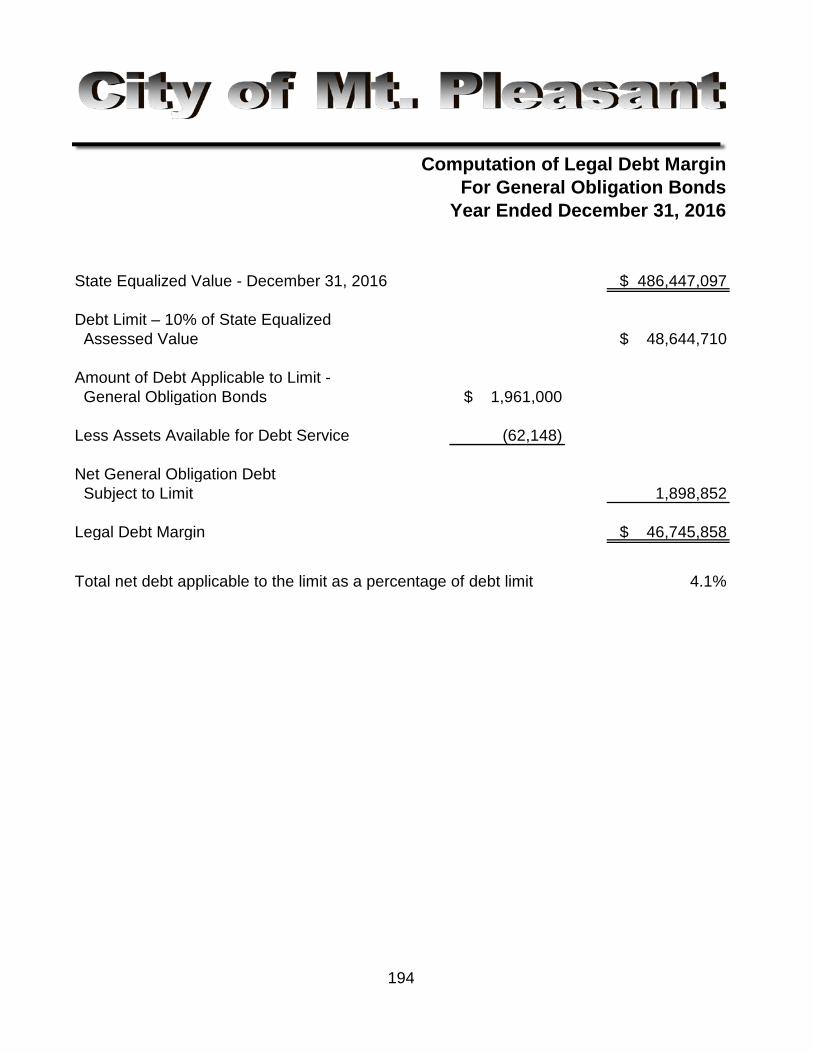
Computation of Legal Debt MarginFor General Obligation Bonds
Year Ended December 31, 2016
State Equalized Value - December 31, 2016 $ 486,447,097
Debt Limit – 10% of State Equalized $ 48,644,710
Amount of Debt Applicable to Limit - General Obligation Bonds $ 1,961,000
(62,148)
Net General Obligation Debt Subject to Limit 1,898,852
Legal Debt Margin $ 46,745,858
Total net debt applicable to the limit as a percentage of debt limit 4.1%
Assessed Value
Less Assets Available for Debt Service
194
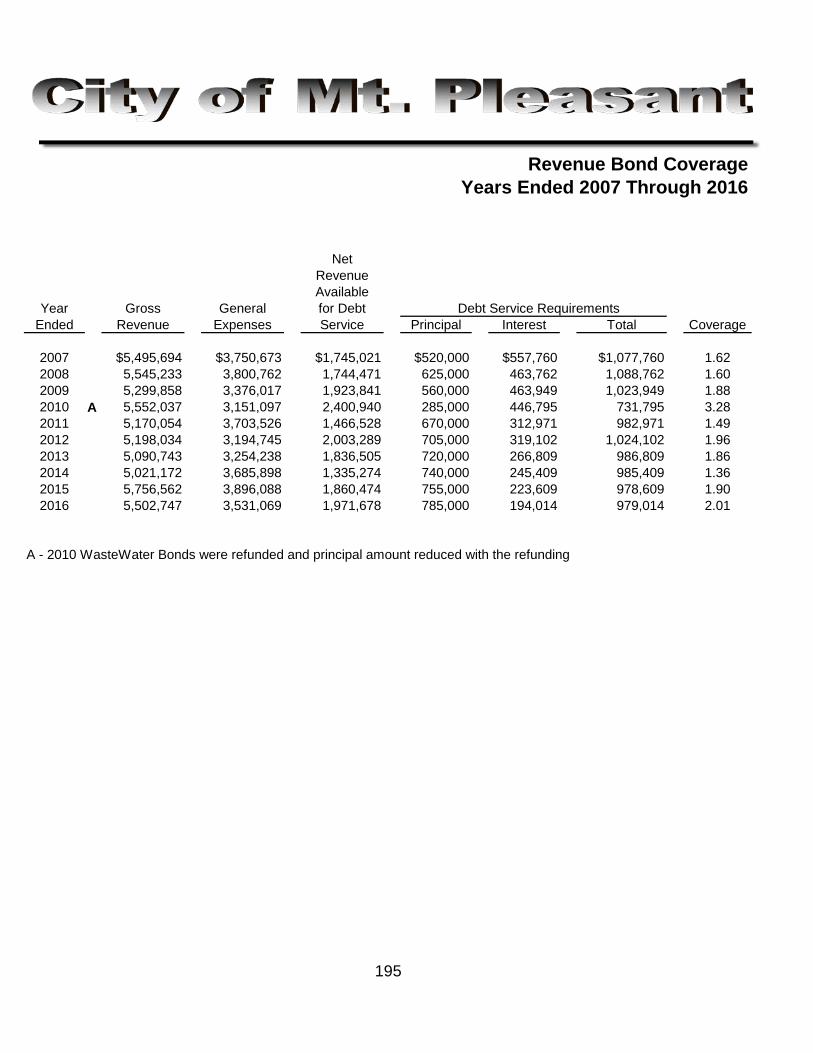
Revenue Bond CoverageYears Ended 2007 Through 2016
NetRevenueAvailable
Year Gross General for DebtEnded Revenue Expenses Service Principal Interest Total Coverage
2007 $5,495,694 $3,750,673 $1,745,021 $520,000 $557,760 $1,077,760 1.622008 5,545,233 3,800,762 1,744,471 625,000 463,762 1,088,762 1.602009 5,299,858 3,376,017 1,923,841 560,000 463,949 1,023,949 1.882010 A 5,552,037 3,151,097 2,400,940 285,000 446,795 731,795 3.282011 5,170,054 3,703,526 1,466,528 670,000 312,971 982,971 1.492012 5,198,034 3,194,745 2,003,289 705,000 319,102 1,024,102 1.962013 5,090,743 3,254,238 1,836,505 720,000 266,809 986,809 1.862014 5,021,172 3,685,898 1,335,274 740,000 245,409 985,409 1.362015 5,756,562 3,896,088 1,860,474 755,000 223,609 978,609 1.902016 5,502,747 3,531,069 1,971,678 785,000 194,014 979,014 2.01
A - 2010 WasteWater Bonds were refunded and principal amount reduced with the refunding
195
Debt Service Requirements
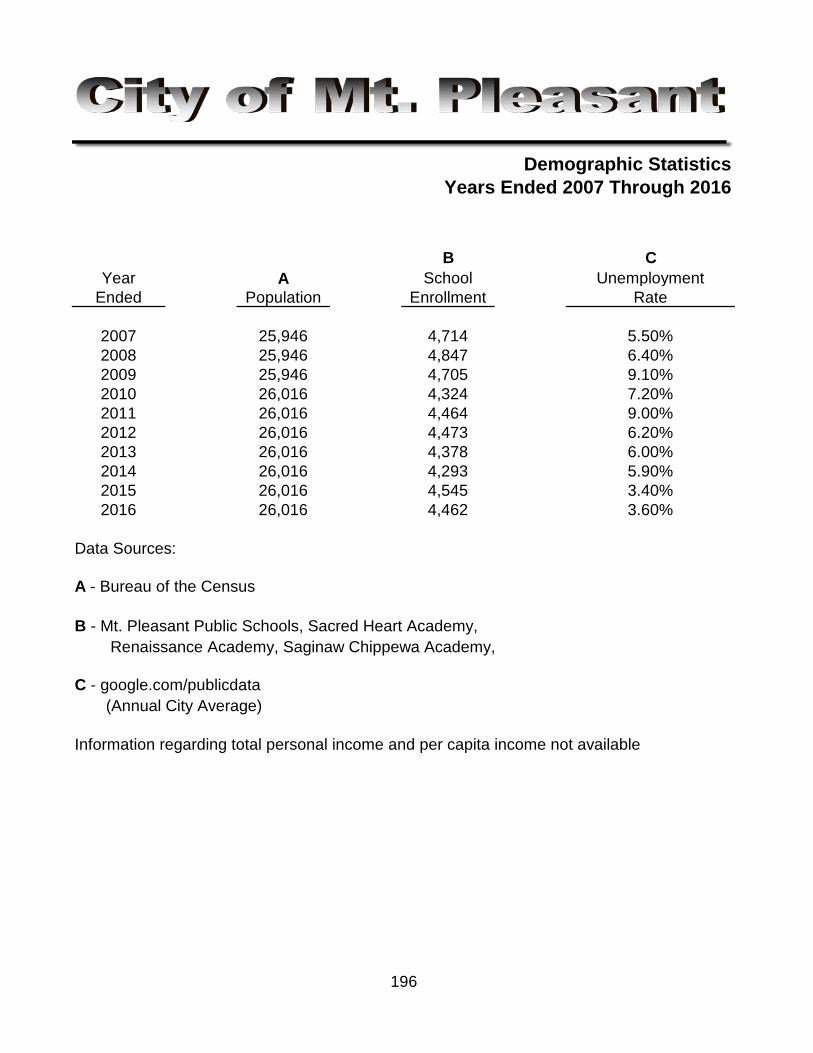
Demographic StatisticsYears Ended 2007 Through 2016
B CYear A School Unemployment
Ended Population Enrollment Rate
2007 25,946 4,714 5.50%2008 25,946 4,847 6.40%2009 25,946 4,705 9.10%2010 26,016 4,324 7.20%2011 26,016 4,464 9.00%2012 26,016 4,473 6.20%2013 26,016 4,378 6.00%2014 26,016 4,293 5.90%2015 26,016 4,545 3.40%2016 26,016 4,462 3.60%
Data Sources:
A - Bureau of the Census
B - Mt. Pleasant Public Schools, Sacred Heart Academy, Renaissance Academy, Saginaw Chippewa Academy,
C - google.com/publicdata (Annual City Average)
Information regarding total personal income and per capita income not available
196
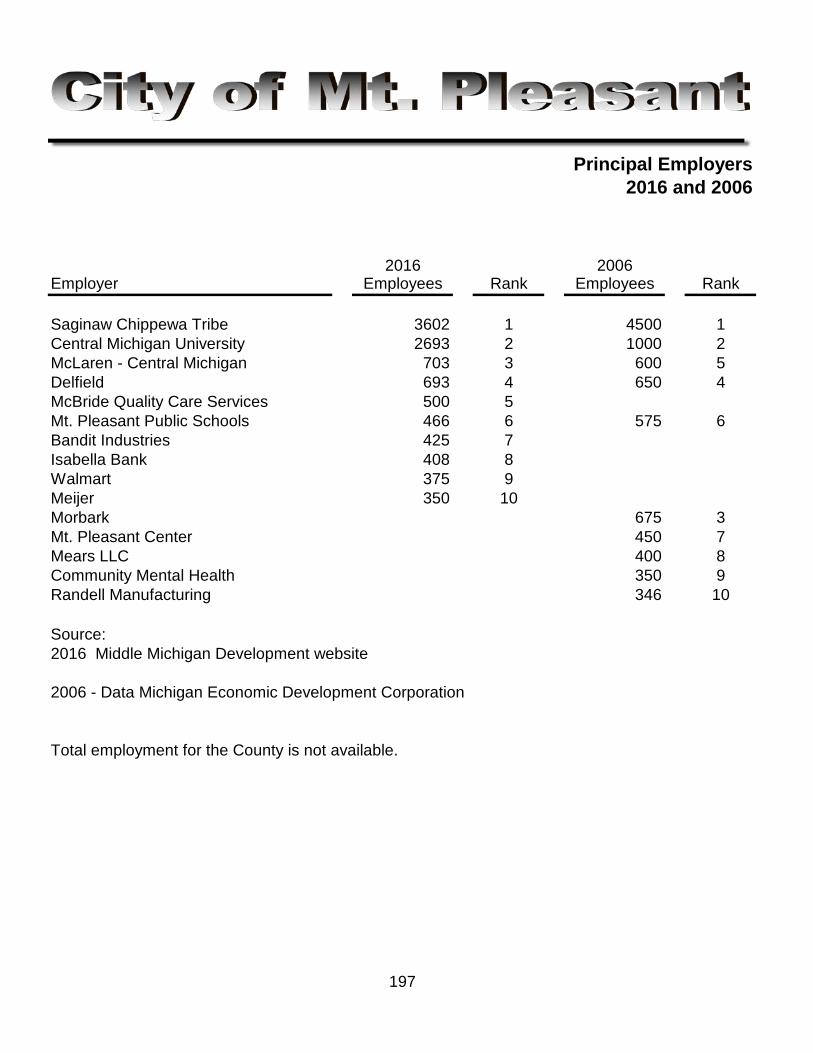
Principal Employers2016 and 2006
2016 2006Employer Employees Rank Employees Rank
Saginaw Chippewa Tribe 3602 1 4500 1Central Michigan University 2693 2 1000 2McLaren - Central Michigan 703 3 600 5Delfield 693 4 650 4McBride Quality Care Services 500 5Mt. Pleasant Public Schools 466 6 575 6Bandit Industries 425 7Isabella Bank 408 8Walmart 375 9Meijer 350 10Morbark 675 3Mt. Pleasant Center 450 7Mears LLC 400 8Community Mental Health 350 9Randell Manufacturing 346 10
Source:2016 Middle Michigan Development website
2006 - Data Michigan Economic Development Corporation
Total employment for the County is not available.
197
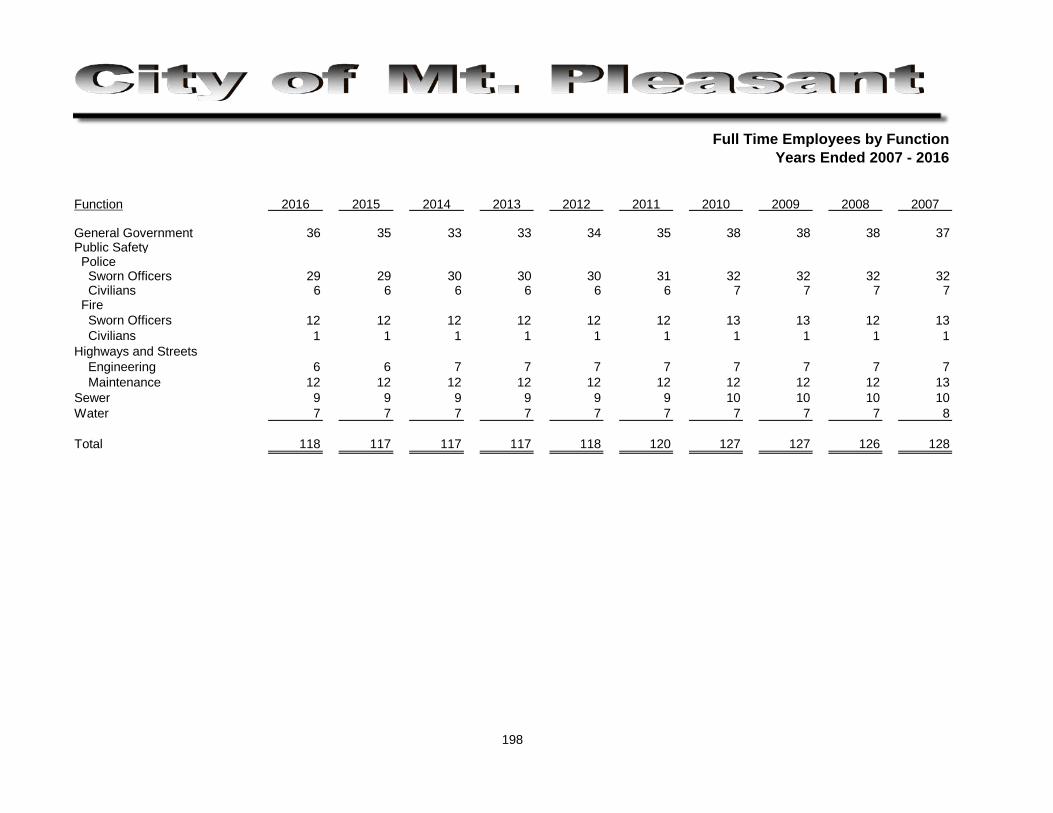
Full Time Employees by FunctionYears Ended 2007 - 2016
2016 2015 2014 2013 2012 2011 2010 2009 2008 2007
General Government 36 35 33 33 34 35 38 38 38 37
Sworn Officers 29 29 30 30 30 31 32 32 32 32 Civilians 6 6 6 6 6 6 7 7 7 7 Fire Sworn Officers 12 12 12 12 12 12 13 13 12 13 Civilians 1 1 1 1 1 1 1 1 1 1Highways and Streets Engineering 6 6 7 7 7 7 7 7 7 7 Maintenance 12 12 12 12 12 12 12 12 12 13Sewer 9 9 9 9 9 9 10 10 10 10Water 7 7 7 7 7 7 7 7 7 8
Total 118 117 117 117 118 120 127 127 126 128
Function
PolicePublic Safety
198
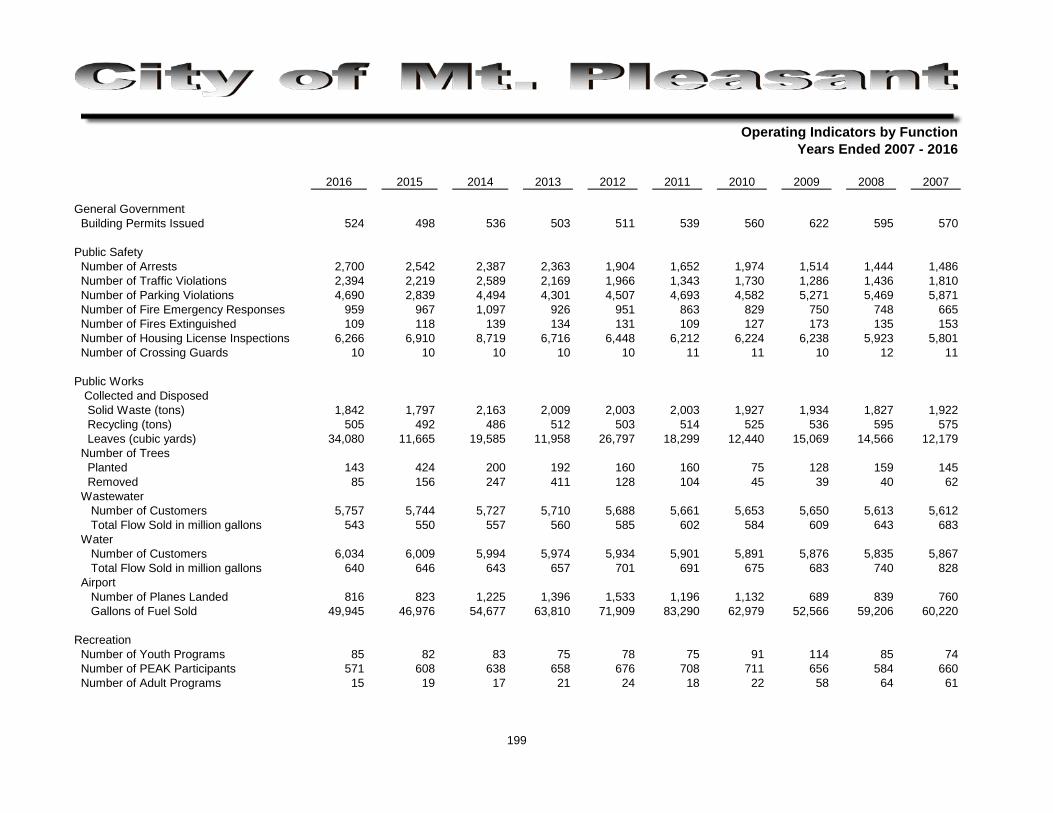
Operating Indicators by FunctionYears Ended 2007 - 2016
2016 2015 2014 2013 2012 2011 2010 2009 2008 2007
General Government Building Permits Issued 524 498 536 503 511 539 560 622 595 570
Public Safety Number of Arrests 2,700 2,542 2,387 2,363 1,904 1,652 1,974 1,514 1,444 1,486 Number of Traffic Violations 2,394 2,219 2,589 2,169 1,966 1,343 1,730 1,286 1,436 1,810 Number of Parking Violations 4,690 2,839 4,494 4,301 4,507 4,693 4,582 5,271 5,469 5,871 Number of Fire Emergency Responses 959 967 1,097 926 951 863 829 750 748 665 Number of Fires Extinguished 109 118 139 134 131 109 127 173 135 153 Number of Housing License Inspections 6,266 6,910 8,719 6,716 6,448 6,212 6,224 6,238 5,923 5,801 Number of Crossing Guards 10 10 10 10 10 11 11 10 12 11
Public Works Collected and Disposed Solid Waste (tons) 1,842 1,797 2,163 2,009 2,003 2,003 1,927 1,934 1,827 1,922 Recycling (tons) 505 492 486 512 503 514 525 536 595 575 Leaves (cubic yards) 34,080 11,665 19,585 11,958 26,797 18,299 12,440 15,069 14,566 12,179 Number of Trees Planted 143 424 200 192 160 160 75 128 159 145 Removed 85 156 247 411 128 104 45 39 40 62 Wastewater Number of Customers 5,757 5,744 5,727 5,710 5,688 5,661 5,653 5,650 5,613 5,612 Total Flow Sold in million gallons 543 550 557 560 585 602 584 609 643 683 Water Number of Customers 6,034 6,009 5,994 5,974 5,934 5,901 5,891 5,876 5,835 5,867 Total Flow Sold in million gallons 640 646 643 657 701 691 675 683 740 828 Airport Number of Planes Landed 816 823 1,225 1,396 1,533 1,196 1,132 689 839 760 Gallons of Fuel Sold 49,945 46,976 54,677 63,810 71,909 83,290 62,979 52,566 59,206 60,220
Recreation Number of Youth Programs 85 82 83 75 78 75 91 114 85 74 Number of PEAK Participants 571 608 638 658 676 708 711 656 584 660 Number of Adult Programs 15 19 17 21 24 18 22 58 64 61
199
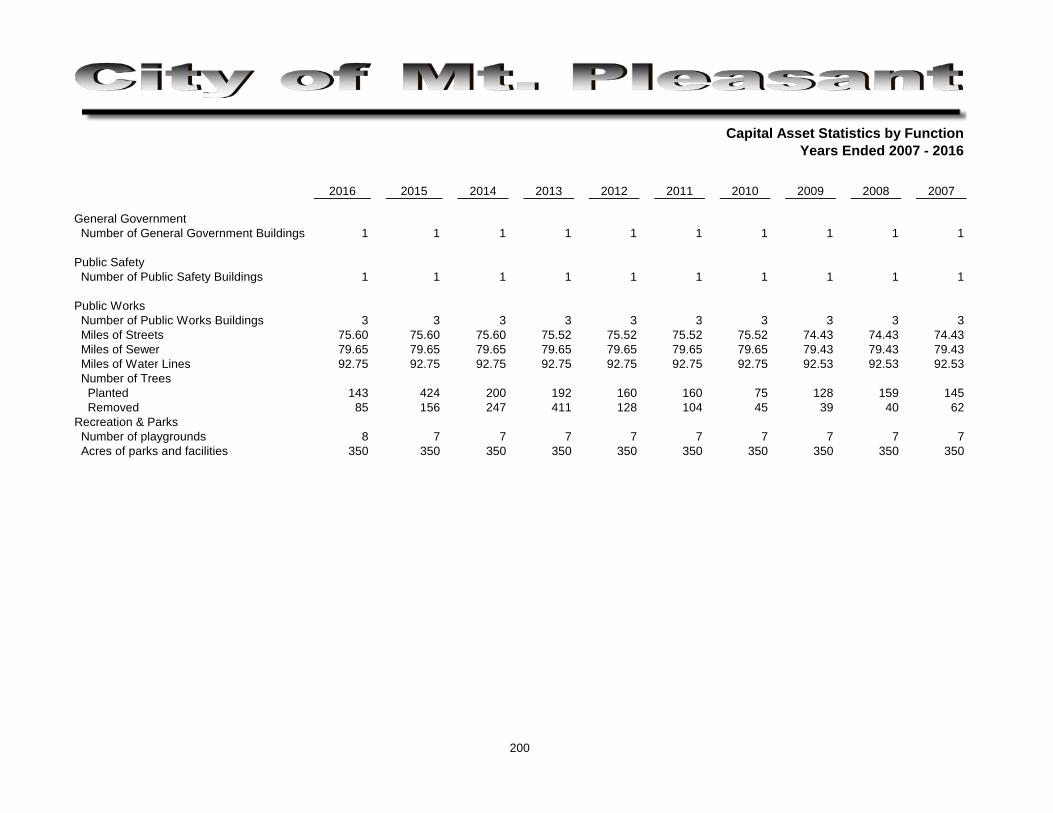
Capital Asset Statistics by FunctionYears Ended 2007 - 2016
2016 2015 2014 2013 2012 2011 2010 2009 2008 2007
General Government Number of General Government Buildings 1 1 1 1 1 1 1 1 1 1
Public Safety Number of Public Safety Buildings 1 1 1 1 1 1 1 1 1 1
Public Works Number of Public Works Buildings 3 3 3 3 3 3 3 3 3 3 Miles of Streets 75.60 75.60 75.60 75.52 75.52 75.52 75.52 74.43 74.43 74.43 Miles of Sewer 79.65 79.65 79.65 79.65 79.65 79.65 79.65 79.43 79.43 79.43 Miles of Water Lines 92.75 92.75 92.75 92.75 92.75 92.75 92.75 92.53 92.53 92.53 Number of Trees Planted 143 424 200 192 160 160 75 128 159 145 Removed 85 156 247 411 128 104 45 39 40 62Recreation & Parks Number of playgrounds 8 7 7 7 7 7 7 7 7 7 Acres of parks and facilities 350 350 350 350 350 350 350 350 350 350
200
Vredeveld Haefner LLC CPA’s and Consultants
4001 Granada Ct.
Grand Rapids, MI 49534
FAX (616) 828-0307
Specializing in services to governmental and nonprofit entities
INDEPENDENT AUDITORS’ REPORT ON INTERNAL CONTROL OVER FINANCIAL REPORTING AND ON COMPLIANCE AND OTHER MATTERS BASED ON AN AUDIT OF
FINANCIAL STATEMENTS PERFORMED IN ACCORDANCE WITH GOVERNMENT AUDITING STANDARDS
May 16, 2017
Honorable Mayor and Members of the City Commission City of Mt. Pleasant Mt. Pleasant, Michigan
We have audited, in accordance with the auditing standards generally accepted in the United States of America and the standards applicable to financial audits contained in Government Auditing Standards issued by the Comptroller General of the United States, the financial statements of the governmental activities, the business-type activities, the aggregate discretely presented component units, each major fund, and the aggregate remaining fund information of the City of Mt. Pleasant, Michigan, (the “City”) as of and for the year ended December 31, 2016, and the related notes to the financial statements, which collectively comprise the City’s basic financial statements, and have issued our report thereon dated May 16, 2017.
Internal Control Over Financial Reporting In planning and performing our audit of the financial statements, we considered the City’s internal control over financial reporting (internal control) to determine the audit procedures that are appropriate in the circumstances for the purpose of expressing our opinions on the financial statements, but not for the purpose of expressing an opinion on the effectiveness of the City’s internal control. Accordingly, we do not express an opinion on the effectiveness of the City’s internal control.
A deficiency in internal control exists when the design or operation of a control does not allow management or employees, in the normal course of performing their assigned functions, to prevent, or detect and correct, misstatements on a timely basis. A material weakness is a deficiency, or a combination of deficiencies, in internal control, such that there is a reasonable possibility that a material misstatement of the entity’s financial statements will not be prevented, or detected and corrected on a timely basis. A significant deficiency is a deficiency, or a combination of deficiencies, in internal control that is less severe than a material weakness, yet important enough to merit attention by those charged with governance.
Our consideration of internal control was for the limited purpose described in the first paragraph of this section and was not designed to identify all deficiencies in internal control that might be material weaknesses or, significant deficiencies. Given these limitations, during our audit we did not identify any deficiencies in internal control that we consider to be material weaknesses. However, material weaknesses may exist that have not been identified.
Compliance and Other Matters As part of obtaining reasonable assurance about whether the City’s financial statements are free of material misstatement, we performed tests of its compliance with certain provisions of laws, regulations, contracts, and grant agreements, noncompliance with which could have a direct and material effect on the determination of financial statement amounts. However, providing an opinion on compliance with those provisions was not an objective of our audit, and accordingly, we do not express such an opinion. The results of our tests disclosed no instances of noncompliance or other matters that are required to be reported under Government Auditing Standards.
201

Purpose of this Report The purpose of this report is solely to describe the scope of our testing of internal control and compliance and the results of that testing, and not to provide an opinion on the effectiveness of the City’s internal control or on compliance. This report is an integral part of an audit performed in accordance with Government Auditing Standards in considering the entity’s internal control and compliance. Accordingly, this communication is not suitable for any other purpose.
202