Embed Size (px)
Citation preview

SDMSDOCID 000218404 yj f,
Lj
FEASIBILITY TESTING OFIN SITU VITRIFICATION OFNEW BEDFORD HARBOR SEDIMENTS
M. A. H. Reimus
December 1988
Prepared forEbasco Services, IncorporatedArlington, Virginiaunder Contract 2311113449
and
REM III ProgramIssued by Ebasco Services Incorporatedunder Contract 68-01-7250 withthe U.S. Environmental Protection Agency
BattellePacific Northwest LaboratoriesRich!and, Washington 99352
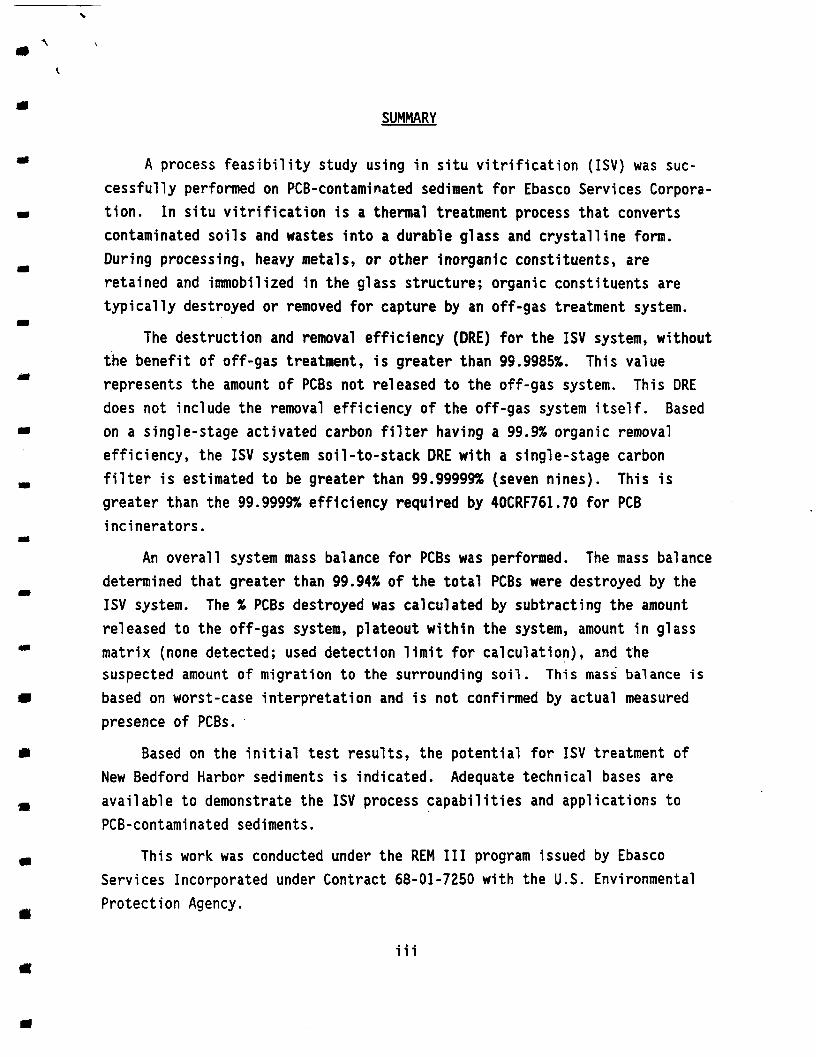
SUMMARY
A process feasibility study using in situ vitrification (ISV) was successfully performed on PCB-contaminated sediment for Ebasco Services Corporation. In situ vitrification is a thermal treatment process that convertscontaminated soils and wastes into a durable glass and crystalline form.During processing, heavy metals, or other inorganic constituents, areretained and immobilized in the glass structure; organic constituents aretypically destroyed or removed for capture by an off-gas treatment system.
The destruction and removal efficiency (ORE) for the ISV system, withoutthe benefit of off-gas treatment, is greater than 99.9985%. This valuerepresents the amount of PCBs not released to the off-gas system. This OREdoes not include the removal efficiency of the off-gas system itself. Basedon a single-stage activated carbon filter having a 99.9% organic removalefficiency, the ISV system soil-to-stack ORE with a single-stage carbonfilter is estimated to be greater than 99.99999% (seven nines). This isgreater than the 99.9999% efficiency required by 40CRF761.70 for PCBincinerators.
An overall system mass balance for PCBs was performed. The mass balancedetermined that greater than 99.94% of the total PCBs were destroyed by theISV system. The % PCBs destroyed was calculated by subtracting the amountreleased to the off-gas system, plateout within the system, amount in glassmatrix (none detected; used detection limit for calculation), and thesuspected amount of migration to the surrounding soil. This mass balance isbased on worst-case interpretation and is not confirmed by actual measuredpresence of PCBs.
Based on the initial test results, the potential for ISV treatment ofNew Bedford Harbor sediments is indicated. Adequate technical bases areavailable to demonstrate the ISV process capabilities and applications toPCB-contaminated sediments.
This work was conducted under the REM III program issued by EbascoServices Incorporated under Contract 68-01-7250 with the U.S. EnvironmentalProtection Agency.
i ii

ACKNOWLEDGMENTS
The author gratefully acknowledges Ebasco Services, Incorporated forproviding Battelle, Pacific Northwest Laboratories the opportunity to performthis study. E. C. Jordan Company facilitated this study and NHS, Inc. andControls for Environmental Pollution, Inc. performed analytical work in support of this study. Jim Jeffs, Tom Powell, and Bill Gerry completed testpreparations and operations, and coordinated sample preparations for thiswork. Craig Timmerman provided much-appreciated technical assistance and acritical review of this report. Kathy Borgeson edited the text, and DeDeJohnson and Annette Taylor completed the word processing.

CONTENTS
SUMMARY i i i
ACKNOWLEDGMENTS v
INTRODUCTION 1
CONCLUSIONS 3
PROCESS DESCRIPTION AND STATUS OF DEVELOPMENT 5
LARGE- AND PILOT-SCALE PROCESS SYSTEMS 11
LARGE-SCALE SYSTEM 11
Power System 12
Off-Gas Containment and Electrode Support Hood 15
Off-Gas Treatment System 17
Glycol Cooling System 20
Process Control Station 20
Off-Gas Support Equipment 21
PILOT-SCALE SYSTEM 22
Power System Design 22
Off-Gas Treatment System 23
TEST DESCRIPTION 29
SOIL AND SLUDGE CHARACTERIZATION 29
TEST EQUIPMENT AND SETUP 29
TEST OPERATIONS 37
TEST RESULTS 43
OFF-GAS CHARACTERIZATION 43
GLASS AND SURROUNDING SOIL CHARACTERIZATION 45
THERMAL DESTRUCTION AND REMOVAL EFFICIENCY 47
vii

SYSTEM MASS BALANCE - PCBs 49
ECONOMIC ANALYSIS AND LARGE-SCALE APPLICATION . 51
REFERENCES 55
APPENDIX A OFF-GAS SAMPLING A.I
APPENDIX B - ANALYTICAL RESULTS FROM CONTROL FOR ENVIRONMENTAL POLLUTION, INC B.I
APPENDIX C - SOIL AND GLASS ANALYTICAL RESULTS PROVIDED BY E. C. JORDAN CO C.I
viii

FIGURES
1 The Process of In Situ Vitrification 6
2 In Situ Vitrification Test Site 8
3 Large-Scale Process Equipment for In Situ Vitrification 12
4 Process Trailers for Large-Scale In Situ Vitrification 13
5 Scott-Tee Transformer Design for the Large-Scale System 14
6 Effect of Increased Number of Voltage Taps on AveragePower Output 15
7 Off-Gas Containment Hood for the Large-Scale System 16
8 Off-Gas System for Large-Scale In Situ Vitrification 18
9 Hood and Process Trailer for Pilot-Scale In SituVitrification 23
10 Design of Hood Feedthrough for Electrode Bus Bar 24
11 Off-Gas System Schematic for the Pilot-Scale ISV Process .... 25
12 Cutaway View of Pilot-Scale ISV Process Trailer and Hood .... 26
13 Removable Containment Module for the Off-Gas Treatment System . . 27
14 Tandem Nozzle Hydro-Sonic Scrubber 28
15 Engineering-Scale ISV Processing Container 32
16 ISV Test Configuration: Sediment Placement and ThermocoupleLocations 33
17 Particulate and Chloride Sampling Train 35
18 Organic Sampling Train 36
19 Vitrified Block Resulting from the ISV Process 38
20 Soil Sample Locations and Isotherms: Soil Sample Locationsas Labeled 39
21 Electrical Power Performance 41
22 ISV Melt Depth Progression 42
IX
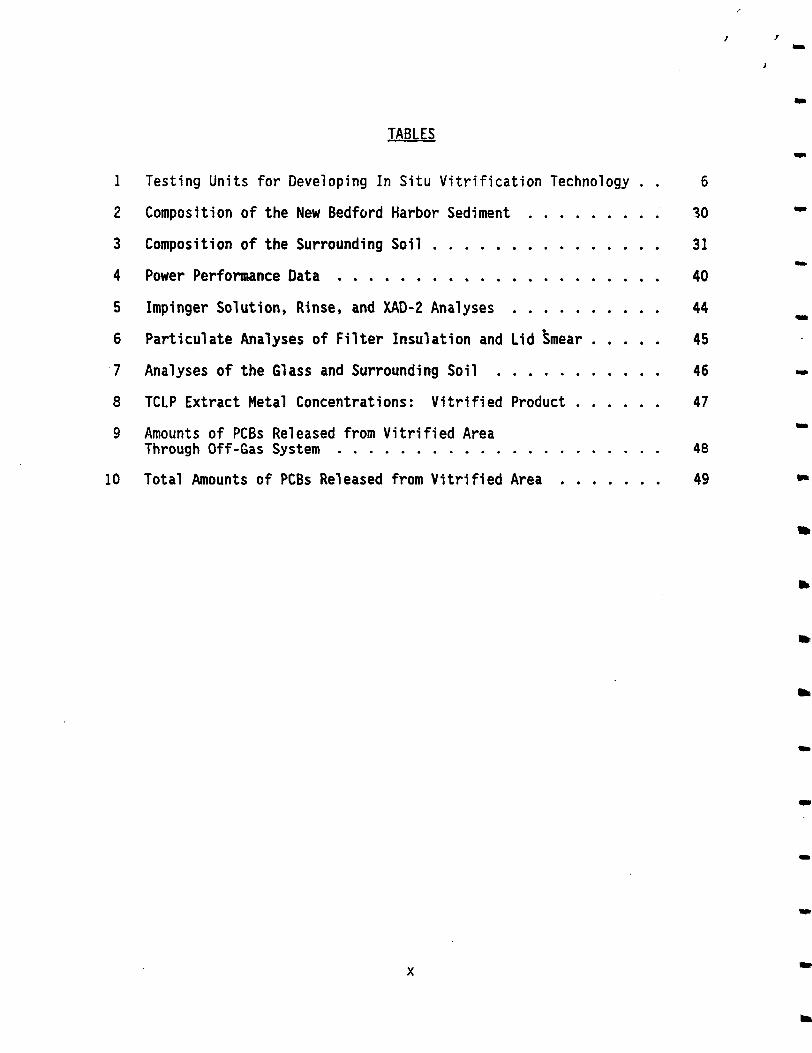
TABLES
1 Testing Units for Developing In Situ Vitrification Technology . . 6
2 Composition of the New Bedford Harbor Sediment 30
3 Composition of the Surrounding Soil 31
4 Power Performance Data 40
5 Impinger Solution, Rinse, and XAD-2 Analyses 44
6 Particulate Analyses of Filter Insulation and Lid Smear 45
7 Analyses of the Glass and Surrounding Soil 46
8 TCLP Extract Metal Concentrations: Vitrified Product 47
9 Amounts of PCBs Released from Vitrified AreaThrough Off-Gas System 48
10 Total Amounts of PCBs Released from Vitrified Area 49
INTRODUCTION
As management of hazardous materials gains increased attention in theUnited States and throughout the world, new, more effective technologies arebeing sought to immobilize and/or destroy the materials either in situ forpreviously disposed wastes, or at the waste generation site. New and proposed environmental regulations are making landfill disposal very costly andwill eventually limit land disposal. Furthermore, the extended liabilityassociated with future environmental impairment provides a significant corporate incentive to dispose and delist hazardous chemical wastes within theplant or waste site boundary.
Battelle, Pacific Northwest Laboratories (BNW), a division of BattelleMemorial Institute (BMI), has developed a remedial action process for contaminated soils that is significant in its application to these concerns.The process, called in situ vitrification (ISV), was initially developed todemonstrate a potential technology for disposal of soil contaminated withtransuranic waste, although recent tests have shown that many hazardouschemical wastes are also destroyed or immobilized as a result of the treatment. In situ vitrification was originally developed for the U.S. Departmentof Energy (DOE) by the Pacific Northwest Laboratory^. BMI has establisheda commercial company named Geosafe for application of the ISV process tochemically hazardous wastes. This report presents evidence that ISV also hasapplicability to New Bedford Harbor sediment, which is contaminated withpolychlorinated biphenyls (PCBs).
In situ vitrification is a thermal treatment process that converts contaminated soils into a chemically inert and stable glass and crystalline product. The ISV process could be applied to many contaminated soil sites. Theprocessing would be performed in place or on excavated soil/sludge; high
(a) The Pacific Northwest Laboratory is operated for the U.S. Department ofEnergy by Battelle Memorial Institute. Battelle, Pacific NorthwestLaboratories is a division of Battelle Memorial Institute.
temperature would destroy or remove organic contaminants, and the glass wouldencapsulate any inorganic contaminants. All these functions would be performed in one processing step.
This report presents the results of a bench-scale ISV treatability testconducted for the Ebasco Services Corporation. The primary objective of thisstudy was to determine the applicability of the ISV process to PCB-contaminated sediments from New Bedford Harbor. Testing results determinedthe amount of destruction of PCBs and that no residual PCBs were detected inthe vitrified product. Fractional release of PCBs to the off-gas treatmentsystem and Toxicity Characteristic Leaching Procedure (TCLP) test performanceof the vitrified material were also determined.
Based on the results of this report on PCB-contaminated sludges and ISVapplications to specific sites, ISV offers technical and economic improvements to state-of-the-art remedial action technology. With an understandingof the process design and functions, the waste manager can make sound judgments about the applicability of ISV to site-specific disposal problems.

CONCLUSIONS
Feasibility testing of the ISV process was successfully performed on NewBedford Harbor sediment contaminated with PCBs. Analyses of the test dataprovides the following conclusions regarding the performance of the ISV process:
• Plate-out of PCBs existed in the off-gas collection plenum at belowanalytical detection limits.
• Minimal migration of PCBs to the soil surrounding the vitrificationzone occurred. The largest detectable amount of PCBs is less than1 ppm, which is below a common level of concern; this detectableamount is based on the suspected presence of PCBs, limited by analytical detection techniques. Areas outside of the 100'C isothermalso need to be tested for confirmation of limits of migration.
• No detectable amount of PCBs is present in the vitrified product.
• TCLP testing resulted in leach extract that contained metal concentrations below the regulatory limits.
• Very small amounts (<2%) of Cd and Pb were volatilized by theprocess.
• The low levels of Cl released do not raise concern for off-gassystem corrosion. Further testing is recommended to determineamount of Cl remaining in glass and amount of Cl« in off-gas.
• The soil-to-off-gas destruction/removal efficiency (ORE) for theISV system is greater than 99.9985%. This value represents theamount of PCBs not released to the off-gas system and is based onanalytical detection limits. Based on a single-stage activatedcarbon filter having a 99.9% organic removal efficiency, the ISVsystem soil-to-stack ORE is estimated to be greater than 99.99999%(seven nines).
• The overall system PCB mass balance showed that greater than 99.94%of the total PCBs were destroyed by the ISV system. This valueaccounts for the limited amount of outward migration to the surrounding soil (based on suspected presence—limited by analyticaldetection techniques), as well as residuals in the vitrified product (based on detection limits) and the amount collected by theoff-gas system.
Initial testing indicates the potential for ISV treatment of New BedfordHarbor sediments. Based on the results of the feasibility test, adequatetechnical bases are available to demonstrate the ISV process capabilities andapplications to PCB-contaminated sediments.

PROCESS DESCRIPTION AND STATUS OF DEVELOPMENT
In situ vitrification has been developed as a remedial action processfor soils contaminated with hazardous chemical wastes and/or radionuclides.Figure 1 illustrates the operation of the ISV process. Four molybdenum(Mo)/graphite electrodes in a square array are inserted into the ground tothe desired treatment depth. Because soil is not electrically conductivewhen its moisture has been driven off, a conductive mixture of flakedgraphite and glass frit is placed among the electrodes to serve as a starterpath. An electrical potential is applied to the electrodes to establish anelectrical current in the starter path. The flow of current heats thestarter path and surrounding soil to well above the initial soil-meltingtemperatures of 1100'C to 1400°C. The graphite starter path is eventuallyconsumed by oxidation and the current is transferred to the molten soil,which is processed at temperatures between 1450°C and 1600"C. As the moltenor vitrified zone grows, it incorporates or encapsulates any radionuclidesand nonvolatile hazardous elements, such as heavy metals, into the glassstructure. The high temperature of the process destroys organic componentsby pyrolysis. The pyrolyzed byproducts migrate to the surface of the vitrified zone, where they combust in the presence of air. A hood placed over thearea being vitrified directs the gaseous effluents to an off-gas treatmentsystem.
The process can also accommodate a staging operation alternative. Inthis processing alternative, outlying materials are placed on the surface ofan area to be vitrified to increase the effective vitrification depth. SinceISV is a batch operation, this alternative will increase the amount of material vitrified in each batch setting, thereby improving the efficiency of theoperation.
Battelle, Pacific Northwest Laboratories began developing ISV technologyin 1980. Since that time, numerous experimental tests under a variety ofconditions and with a variety of waste types have been conducted (Bueltet al. 1987, Timmerman and Oma 1984, Timmerman et al. 1983, Buelt and Carter1986, Timmerman 1986). Table 1 describes the different scales of testing

FIGURE 1. The Process of In Situ Vitrification
TABLE 1. Testing Units for Developing In Situ Vitrification Technology
Equipment Size Electrode *
Separation, m Block Size
Tests Completed As of 10/31/88
Bench scale 0.11 1 to 10 kg 12 Engineering scale 0.23 to 0.36 0.05 to 1.0 t 26 Pilot scale 0.9 to 1.5 10 to 50 t 16 Large scale 3.5 to 5.5 400 to 800 t 5
units that BNW uses in developing and adapting ISV technology. The successful results of 59 bench-, engineering-, pilot-, and large-scale tests haveproven the general feasibility and widespread applications of the process.Also, economic studies have indicated that tremendous economies-of-scale areattainable with the ISV process (Oma et al. 1983). The technology has beenrefined to the point that it is now ready for technology transfer and commercialization for specific hazardous waste types.
The ISV process has been broadly patented within the United States,Canada, Japan, Great Britain, and France. BMI recently transferred a partially exclusive license to those patents to Geosafe Corporation for non-federal U.S. government, nonradioactive waste applications. Geosafe, located

in Kirkland, Washington, specifically provides commercial hazardous wasteremediation services to public and private customers using its proprietaryISV process.
The decision to proceed with the design, fabrication, and testino of theexisting large-scale unit was made on the basis of the extensive databasedeveloped as a result of engineering- and pilot-scale tests. The pilot-scaleunit demonstrated the process using radioactively spiked soils and provided.support for the decision to design and fabricate the large-scale system.Subsequent tests have been conducted with the bench-, engineering-, andpilot-scale units to determine processing behavior under various wasteconditions and to develop improved operating techniques.
The large-scale process equipment for transuranic (radioactive) contaminated soils has been fabricated and installed (Figure 2), and the large-scaleoperational acceptance tests and a large-scale verification test have beencompleted. The objective of these tests was to verify conformance of theprocess characteristics to the established functional design criteriarelevant to the large-scale radioactive test. The large-scale testingculminated in successful operation of the large-scale radioactive test on anactual radioactively contaminated soil site at Hanford in Washington state.
The extensive technical data for the ISV process establish the performance of the system and waste form, economics and safety, and waste siteapplications for radioactive and hazardous chemical wastes. These aspects ofthe process are summarized as follows:
• The minimum estimated depth limit of the large-scale ISV system is10 m in Hanford soils, independent of moisture content. Computermodel predictions show that melt depths in excess of 20 m should beattainable. Depths in excess of 5 m have been demonstrated.
• Radionuclides and heavy metals are sufficiently retained within themelt, and nitrates and organics are destroyed during processing.
• Generally, environmental regulations do not allow the direct evolution of the small percentage of heavy metals and organics thatescape from the vitreous mass during processing. Therefore, anoff-gas treatment system is included in the process to remove thecontaminants from the gaseous effluents.

00
FIGURE 2. In Situ Vitrification Test Site
I I f f f I I I

• A depth transmitter system has been developed for reliable monitoring of the vitrification zone depth during processing.
• A reference electrode design has been established for future ISVapplications. This design employs a Mo/graphite combination topromote subsidence of the surface of the melt below the originalsoil grade. Oxidation of Mo during processing is prevented by thegraphite collar, plus a fused coating of MoSi2 on the Mo electrodecore.
• Metal inclusions do not significantly affect the ISV process unlessa full electrical short circuit is approached.
• Cement inclusions are completely dissolved within the glass wasteform.
• In situ vitrification is capable of processing various soil typesthroughout the United States. Soils from nine different U.S. locations were found to be similar in the properties that could affectthe ISV process. Similar ISV processing capacity is anticipatedfor other worldwide soil types.
• The ISV waste form is expected to surpass established and proposedtoxicity tests. Leachability of vitrified soil has been measuredto establish and confirm these conditions.
• Soil moisture generally increases the time and power required tovitrify a waste site; however, the effect of moisture on the maximum attainable depths of ISV is small. Industrial sludges with atotal moisture content (amount of water in the soil) as high as70 wt% have been vitrified by ISV.

LARGE- AND PILOT-SCALE PROCESS SYSTEMS
Development and deployment of the large-scale ISV system is the ultimategoal of the ISV program because the large-scale system is less costly tooperate, and is more adaptable to numerous types of waste sites than thepilot-scale system. The cost of vitrifying a given waste volume with thelarge-scale system is one-seventh that for the pilot-scale system. Thelarge-scale system is more adaptable because its high-capacity off-gassystem, which can process off gas at a rate of 104 std m /min, is betterequipped to contain sudden gaseous releases from combustible and othergas-generating wastes. Nevertheless, the pilot-, engineering-, and bench-scale systems provide important data that are used to determine the performance of the large-scale system at a significantly reduced developmentcost. The existing large- and pilot-scale units owned by the U.S. Departmentof Energy and tested by Battelle Northwest under its contract to operate thePacific Northwest Laboratory are described in this section. Commercialremediation services for nonfederal, nonradioactive waste sites are currentlyavailable from Geosafe Corporation. The Geosafe large-scale sysem is verysimilar to the DOE system.
LARGE-SCALE SYSTEM
The large-scale system described in this section is designed to vitrifycontaminated soils with an electrode separation of up to 5.5 m on a side.The specific process description is for a system that could be applied tohighly contaminated portions of TRU-contaminated soil sites, caissons, andsolid waste burial sites. The ISV large-scale process equipment is shown inFigure 3. Controlled electrical power is distributed to the electrodes, andspecial equipment contains and treats the gaseous effluents. The processequipment required to perform these functions can be described most easily bydividing the equipment into six major components:
• electrical power supply
• off-gas hood
• off-gas treatment system
11

SUPPORT-TRAILER
ELECTRICAL SYSTEM4
GLYCOL COOUNG SYSTEM
FIGURE 3. Large-Scale Process Equipment for In Situ Vitrification
• glycol cooling system
• process control station
• off-gas support equipment.
Except for the off-gas hood, all of the components are contained in threetransportable trailers, as shown in Figure 4. They consist of an off-gastrailer, a process control trailer, and a support trailer. All threetrailers are mounted on wheels to accommodate a move to any site over acompacted ground surface. The off-gas hood and off-gas line, which areinstalled on the site to collect gaseous effluents, are dismantled and placedon a flat-bed trailer for transport. The effluents exhausted from the hoodare cooled and treated in the off-gas treatment system. The entire processis monitored and controlled from the process control station. Buelt andCarter (1986b) provide a detailed description and design basis for theprocess, but a brief summary is also provided here.
Power System
The power system for the ISV process uses a Scott-Tee® transformerconnection to convert three-phase electrical power to two single-phase loads(Lazar 1977). Each single-phase load is connected to two electrodes,arranged in a square pattern, as shown in Figure 5. The Scott-Tee
12

TO ELECTRODES AIR COOLERS
CIRCUIT PROTECTION
ELECTRICAL TRAILER GLYCOL LOOPS
AIR COMPRESSOR
HOLDING
PROCESS CONTROL
gg ooo a PROCESS CONTROL TRAILER
FROM HOOD SCRUBBER SYSTEM HEATER
HEPA FILTERS STACK I A
ACCESS AISLE
rCHZH CONDENSER
ACCESS AISLE
OFF-GAS TRAILER
FIGURE 4. Process Trailers for Large-Scale In Situ Vitrification
transformer was selected on the basis of its even distribution of currentwithin the molten soil, which produces a vitrified product almost square inshape to minimize the overlap between adjacent settings. The connection hasbeen employed during pilot- and engineering- scale tests and is commonly usedin the glass industry.
13

SCOTT TEE TRANSFORMER SECONDARY
VOLTAGE TAP
PRIMARY VOLTAGE TAP
SATURABLE. REACTOR
B,XT ' r^A,
v | S*^ IjlECTRODE
*2—-f~ B2
MOLTEN GLASS
FIGURE 5. Scott-Tee Transformer Design for the Large-Scale System
The vitrification zone continually grows as the ISV process is supplied-with power. This creates a constantly changing voltage/current relationship,which requires multiple voltage taps on the Scott-Tee transformer. The multiple taps allow for more efficient use of the power system by maintainingthe power factor (the phase relationship between current and voltage) nearmaximum, which is 3750 kW for the large-scale system. Figure 6 shows theincrease in the achievable average power input when using 16-voltage tapsrather than 4-voltage taps. Average power is 2900 kW when 4-voltage taps areused. With 16-voltage taps the average power has been increased to 3500 kW,which is much more efficient use of the maximum capabilities of the system.
To control the current and/or voltage being introduced into the electrodes, saturable reactors with their respective control windings are usedfor the large-scale system. The control scheme is to use two saturablereactors on the secondary side of the Scott-Tee transformer. This has theadvantage of independently controlling the power to each of the single-phase
14

POWER lie VOLTAGE TAPSI
3750 —
AVERAGE POWER H6 VOLTAGE TAPSI
AVERAGE POWER 14 VOLTAGE TAPSI
ISO 300 450 600 750
RUN TIME, h
FIGURE 6. Effect of Increased Number of Voltage Taps on Average Power Output
loads. However, the saturable reactors had to be designed to accommodate thefull voltage and current ranges caused by the variable resistance of the meltin this batch operation process. This requires multiple reactors for eachphase connected in series and/or parallel to be compatible with the range ofvoltage and current ratings.
The power supply system was specified to meet functional criteria determined by a mathematical model. From the mathematical simulations, a 3750-kWpower supply was selected for the large-scale system. The modeling predictions also stipulate that to meet the functional criteria, a load voltage ofbetween 4160 to 400 V must be supplied with a corresponding current capacityon each of the two secondary phases of between 450 and 4000 A, respectively.
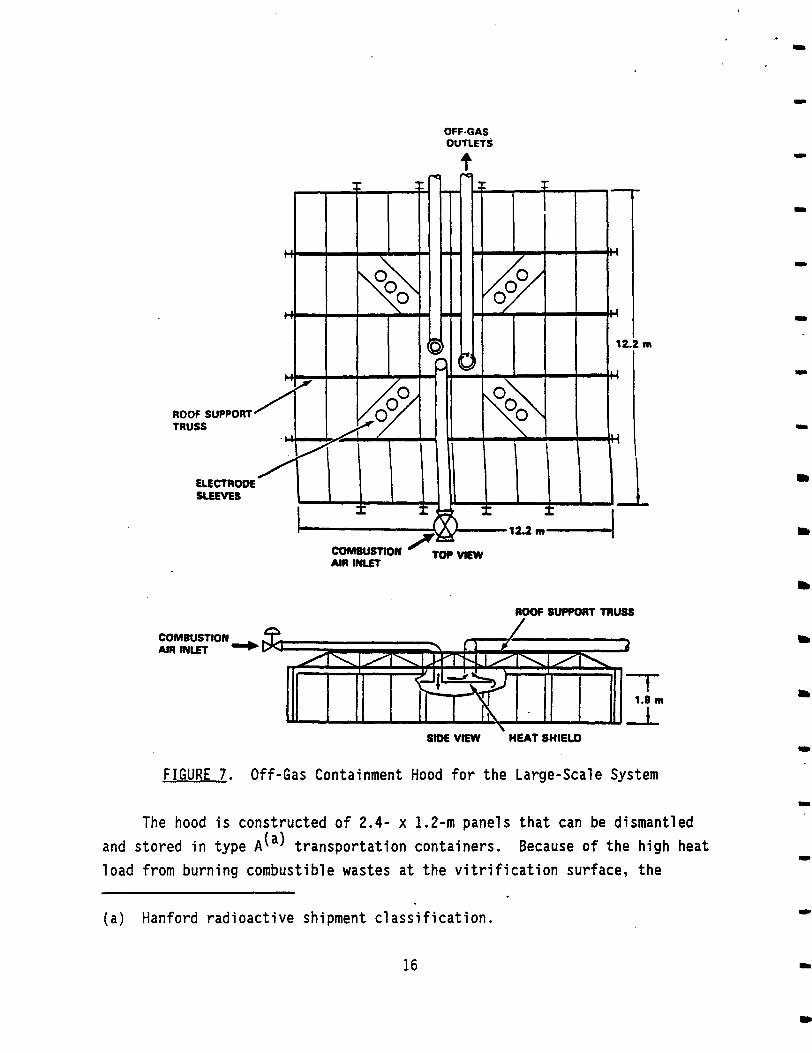
Off-Gas Containment and Electrode Support Hood
A stainless steel off-gas hood is placed over the vitrification zone tocontain any gaseous and radioactive effluents from the process and to directthem to the portable off-gas treatment system. The hood (shown in Figure 7)is kept under a slightly negative pressure (0.25- to 2.5-cm water).
15
cJFF-G.AS (DunETS
t
\ />
i l
^ ^ 12. i n
PI *« 1
X
ROOF SUPPORT' TRUSS
M mm^mm ^ %
ELECTRODE SLEEVES
X1 ^
•
^
i zh"'S • f
1 COMBUSTION ' T0p y^yy AIR INLET
ROOF SUPPORT TRUSS
COMBUSTION AIR INLET '
1.8m
SIDE VIEW HEAT SHIELD
FIGURE 7. Off-Gas Containment Hood for the Large-Scale System
The hood is constructed of 2.4- x 1.2-m panels that can be dismantledand stored in type A^ transportation containers. Because of the high heatload from burning combustible wastes at the vitrification surface, the
(a) Hanford radioactive shipment classification.
16

off-gas hood is constructed of materials that are capable of withstanding900°C. A npnwelded (bolted) hood design was favored for the large-scalesystem because thermal expansion from ambient temperature to 900°C creates>2.5-cm expansion in any direction. The panels are assembled in a manner torelieve stresses that might result from thermal expansion. The existing hoodis designed for a skin temperature of 550*C; higher combustible loadings inthe soil, for which the off-gas treatment system is designed, would require ahigh-temperature hood design.
The hood is sealed to the surface of the soil surrounding the zone to bevitrified by a flexible skirt of tightly woven, high-temperature resistantfiber covered with a few centimeters of dirt. The skirt maintains a sealduring processing, which normally tends to dry out the dirt around the hood,thereby increasing air inleakage.
The four Mo electrodes protrude through the hood at variable separationsof 3.5 m to 5.5 m on a side. They are surrounded by electrically insulatedsleeves that allow for the adjustment of the electrode position. The electrodes are supported by insulators above the sleeve. The insulators aredesigned to withstand any movement of the molten mass against the electrodescaused by convective currents and the gravitational or buoyant forces exertedon the electrodes.
Off-Gas Treatment System
The off-gas treatment system (see Figure 8) cools, scrubs, and filtersthe gaseous effluents exhausted from the hood. Its primary componentsinclude a gas cooler, two wet scrubber systems (tandem nozzle scrubbers andquenchers), two heat exchangers, two process scrub tanks, two scrub solutionpumps, a condenser, three mist eliminators (vane separators), a heater, ahigh-efficiency particulate air (HEPA) filter assembly, and a blower system.The HEPA filter assembly can be replaced with a dual-stage activated carbonadsorption assembly, if appropriate (e.g., PCB/organic waste remediation).
Due to the additional heat load from high concentrations of buried solidand liquid organic combustibles, off gases entering the off-gas trailer canbe expected to reach a maximum temperature of 750°C. To keep the size of the
17

STACK
COMTMMMWr MPOUU
FIGURE 8. Off-Gas System for Large-Scale In Situ Vitrification
heat exchange equipment manageable for a transportable facility, a gas cooleris provided to remove a major portion of the heat load from the off gasesbefore quenching. The gas cooler is a finned air-to-glycol heat exchanger.It is capable of transferring 1100 kW from the off gas to a glycol loop,cooling the gases to 300*C. The gas cooler can be bypassed by operatingthree 40-cm pneumatic-actuated butterfly valves.
From the gas cooler, the off gas is split and directed into two wetscrubber systems that operate in parallel. Two scrubber systems provide an
3operating flow range of between 30 and 104 std m/min. At flows less than
e60 std m3/min only °" system operates. The dual scrubber system also provides redundancy in the event of single-component failure. Each system iscomposed of a quench tower, a tandem nozzle scrubber, and a vane separator.The quencher reduces the gas temperature from 300'C to'66°C, and providessome scrubbing action to remove a portion of the particles and semivolatileradionuclides. The primary functions of the tandem nozzle scrubber are toremove any remaining particles that are >0.5 im dia, condense the remaining
18

semi volatile components, and provide additional cooling of the off gas. Thevane separator that follows each tandem nozzle scrubber is designed to removeall droplets >12 jum.
The scrub solution that is injected into the quenchers and tandem nozzlescrubbers is cooled through two single-stage heat exchangers before beingreturned to the process scrub tanks. Each heat exchanger can remove 120 kWfrom the scrub solution and transfer 120 kW of heat to the glycol solution.
Two independent scrub pumps recirculate the scrub solution from theprocess tanks to the wet scrubbers. Each pump can deliver 510 L/min with amaximum deliverable pressure of 680 kPa. In addition, the scrub pumps canflush out the gas cooler and off-gas piping that are not wetted by the wetscrubbers.
Following the scrubber systems, the off gas is recombined and cooled. Acondenser and mist eliminator provide additional decontamination of the offgas by condensing it and removing water droplets. The condenser transfers320 kW from the off gas into flowing glycol. The mist eliminator, a vaneseparator, removes droplets >12 pr\- Both the condenser and mist eliminatorare rated at 104 std m/min. Final decontamination of off-gas particulatesis achieved in the two-stage HEPA filter assemblies. The first stage iscomposed of two parallel housings, each capable of holding four 61-cm-high x30-cm-deep filters. With this arrangement, one filter set can be changed outwithout interfering with the continuous operation of the off-gas system.
The gaseous effluents are drawn through the off-gas system components byan induced draft system. The driving force is provided by a 149-kW (200-hp)blower that is capable of achieving 104 std m/min at 90°C and -229 cm ofwater. A back-up blower rated at one-quarter the capacity is available ifthe primary blower fails. The back-up blower is not intended to provideexcess combustion air, but rather to maintain a negative pressure on theoff-gas hood to prevent direct release of effluents until the process can besafely shut down. The back-up blower is automatically activated by theprocess control system when the main blower header vacuum is reduced below a
19

preset limit. After passing through the blower system, the off gases areexhausted to the stack, which is monitored continuously for radionuclides,NOX, and S02- The stack is removable and extends high enough to preventinterference with the off-gas and control trailer's heating, ventilating, anuair conditioning (HVAC) systems.
Glvcol Cooling System
Glycol cooling solution is pumped between the support trailer and off- "gas trailer to remove the heat from the gaseous effluents. The glycol isrecirculated between trailers through flexible jumpers by two pumps in twoindependent loops. The glycol recirculating through the heat exchangers andcondensers is kept separate from the glycol loop for the off-gas coolers.However, both loops are assembled in one glycol cooling assembly, which islocated on the support trailer. The assembly consists of two fan-cooledradiator systems, each dedicated to its respective glycol loop. The entireassembly removes 1600 kW at an ambient temperature of 38*C.
Process Control Station
The process control station consists of a distributed microprocessormonitoring and control system and a control console for the power supply.The process control station monitors and controls important process parameters and automatically activates back-up equipment or reroutes off-gas flowif certain equipment fails.
The distributed microprocessor control system consists of two processcontrol units and two operator interface units. The process control unitsare connected to critical and informational sensors located throughout theprocess. These include sensor readings from pressure elements, thermocouples, gas monitors, and flowmeters. In addition to monitoring keyparameters, the control system performs the following functions:
• control of the pressure drop across the scrubber systems by apneumatic flow control valve at the blower inlet
• control of the blower inlet vacuum with a separate pneumatic valvethat governs the magnitude of recycle through the main blower
• control of off-gas differential temperature across the heater
20
• control of negative pressure in the hood by controlling combustionair flow through a pneumatic valve
• automatic batch logic sequencing of specific operations in theevent of equipment failure (22 preprogrammed sequences areincluded).
As examples of the latter function, if power fails, the control systemautomatically restarts the off-gas system in a preprogrammed sequence onemergency generator power. If the pressure drop across the HEPA filtersexceeds predetermined levels, the system automatically activates the parallelHEPA filter assembly. If either hood vacuum or oxygen concentration isreduced below minimum operating criteria, the system engages the standbyscrubber system. And if the primary blower fails, the system automaticallyshuts down power to the electrodes and starts the back-up blower.
Although the control system is connected to sensors and to an automaticshutdown circuit on the electrode power supply system, it does not directlycontrol the power supply. A separate control console fulfills that function.The power supply controller provides the necessary saturation current to thesaturable reactors that govern the power to the electrodes. This controlmodule maximizes the efficiency of the electrode power system and provides aquick reduction in power in the event of off-standard conditions.
Off-Gas Support Equipment
Various support and back-up equipment are necessary to ensure the safeoperation of the off-gas system. This equipment provides electrical, water,and air services to the off-gas equipment. The support equipment includes a750-kVA transformer; a 750-kVA diesel generator; an air compressor; and aprocess water supply tank, pump, and agitator.
Other than the need for electrical power, the ISV process is entirelyself-contained. No outside water, sewer, or air services are required.Supply and waste waters are transported to the process trailer by tank truckon an as-needed or scheduled basis. The process is equipped with its own aircompressor for actuation of the pneumatic valves and its own water supplytank for scrub solution makeup.
21

Power to the off-gas process equipment is provided through the 750-kVAtransformer and distributed by the motor control center (MCC) from a 13.8-kVsupply. If power to the transformer is interrupted, a transfer switch in theMCC automatically activates standby 750-kVA diesel generator that is equipped with its own battery-powered cranking system. This generator providesemergency power to all off-gas system components, including the pumps andfans of.the glycol cooling assembly, scrub pumps, heater, blower system, aircompressor, and monitoring and control instrumentation. The MCC, located inthe control trailer, provides power to this equipment and to the power supplycontrol console and the supply pump and agitator for process water. The112-kVA transformer, which provides 240-V and 120-V power from the 480-Vsupply, is also in the control trailer. The 120-V power is also tied intothe emergency back-up power generator for emergency lighting.
PILOT-SCALE SYSTEM
The pilot-scale system uses four electrodes with a 1.2-m separation andconsists of a power control unit, an off-gas containment hood over the wastesite, and an off-gas treatment system that is housed in a portable semitrailer (see Figure 9). Prior to and after a radioactive test, this samesystem was used on six nonradioactive tests. A previous pilot-scale system(Oma et al. 1983) preceded the present pilot-scale design to provide scale-upfeasibility; however, it was not mobile or designed for radioactivematerials.
Power System Design
Like the large-scale unit, the pilot-scale p.ower system uses a Scott-Teeconnection to transform a three-phase input to a two-phase secondary load ondiagonally opposed electrodes in a square pattern. The 500-kW power supplymay be either voltage or current regulated. The alternating current primaryis rated at 480 V, 600 A, 3 phase, and 60 Hz. The three-phase input feeds aScott-Tee-connected transformer (see Figure 5) to provide a two-phasesecondary. The transformer has four separate voltage tap settings--1000 V,650 V, 430 V, and 250 V. Each voltage tap has a corresponding amperage rating of 250 A, 385 A, 580 A, and 1000 A and an off-gas treatment system. Like
22

FIGURE 9. Hood and Process Trailer for Pilot-Scale In Situ Vitrification
the large-scale unit, the hood is equipped with a heat shield installed underthe center top panel to protect the hood from heat that radiates from thepartially molten surface during processing.
The hood makes use of the flexible skirt to provide a seal to the surface of the soil surrounding the zone to be vitrified. The skirt extends-0.6 m away from the hood, allowing for a hood-to-ground seal when coveredwith a layer of soil.
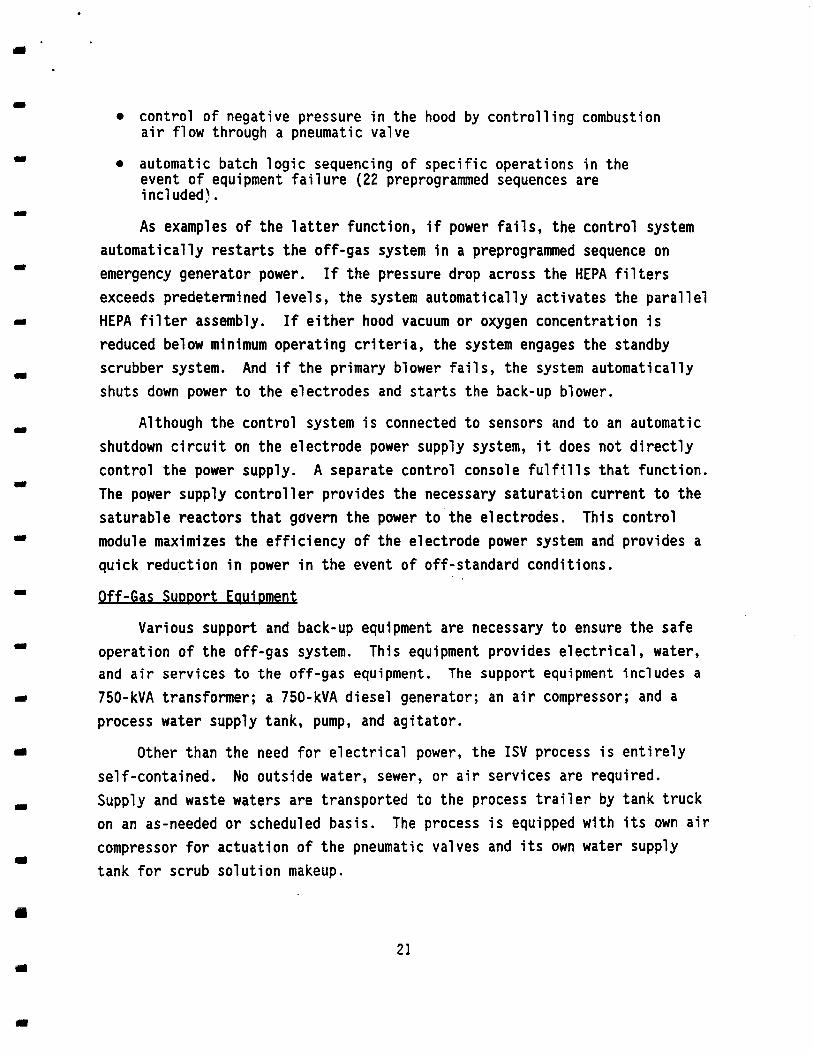
Electrical bus bars, which are extensions of the Mo electrodes, protrudethrough the hood and are surrounded by electrically insulated sleeves thatallow for the adjustment of the electrode positions. Figure 10 depicts onedesign of the insulated sleeves that was implemented during a pilot-scaleradioactive test.
Off-Gas Treatment System
The off-gas system is shown schematically in Figure 11. The off gaspasses through a venturi-ejector scrubber and separator, Hydro-Sonic® scrubber, separator, condenser, another separator, heater, two stages of HEPA
Hydro-Sonic scrubber is a registered trademark of Hydro Sonic Systems,Dallas, Texas.
23
INSULATOR Mo ELECTRODE
TIE-DOWN BAND BRACKET CLAMP
INSULATOR METALLIC SLEEVE
V-RETAINER
X
• ADJUSTABLE RANGE
FIGURE 10. Design of Hood Feedthrough for Electrode Bus Bar
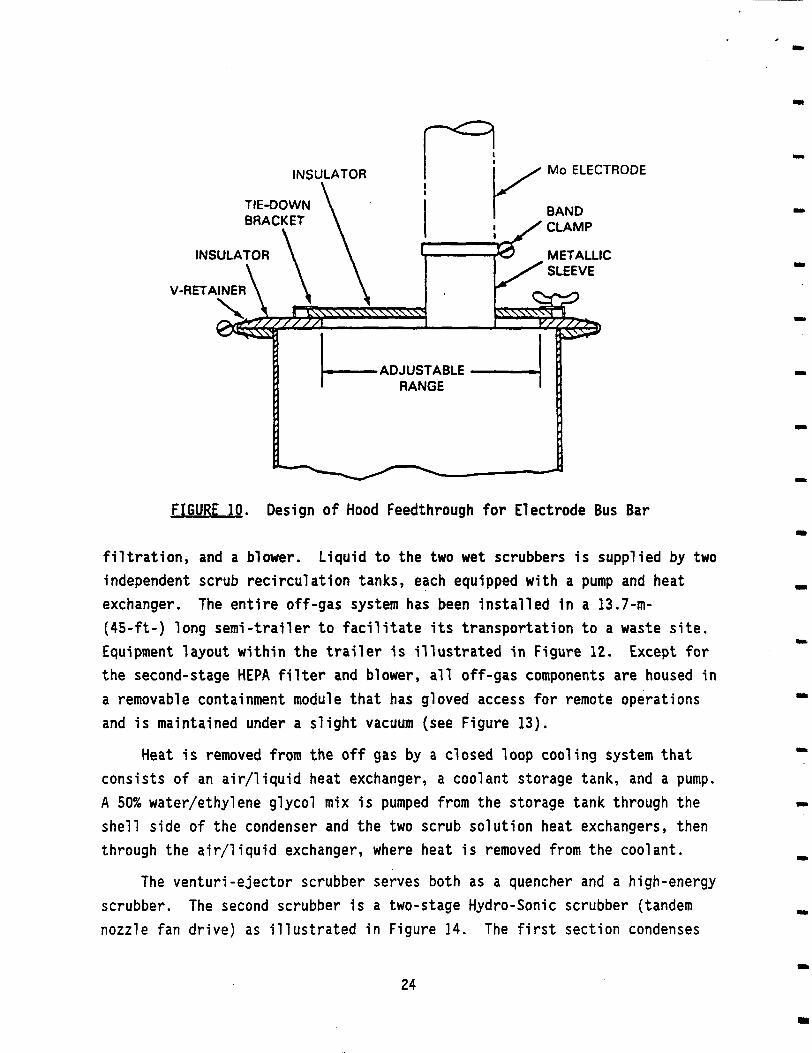
filtration, and a blower. Liquid to the two wet scrubbers is supplied by twoindependent scrub recirculation tanks, each equipped with a pump and heatexchanger. The entire off-gas system has been installed in a 13.7-m-(45-ft-) long semi-trailer to facilitate its transportation to a waste site.Equipment layout within the trailer is illustrated in Figure 12. Except forthe second-stage HEPA filter and blower, all off-gas components are housed ina removable containment module that has gloved access for remote operationsand is maintained under a slight vacuum (see Figure 13).
Heat is removed from the off gas by a closed loop cooling system thatconsists of an air/liquid heat exchanger, a coolant storage tank, and a pump.A 50% water/ethylene glycol mix is pumped from the storage tank through theshell side of the condenser and the two scrub solution heat exchangers, thenthrough the air/liquid exchanger, where heat is removed from the coolant.
The venturi-ejector scrubber serves both as a quencher and a high-energyscrubber. The second scrubber is a two-stage Hydro-Sonic scrubber (tandemnozzle fan drive) as illustrated in Figure 14. The first section condenses
24

l m i l
CONDENSER STACK
VENTURI EJECTOR SCRUBBER
81OWER
PUMP 1 PUMP 2
FIGURE 11. Off-Gas System Schematic for the Pilot-Scale ISV Process

COOLANT TANK WATER TANK AND POMP
AND PUMP AIR/OlYCOl \ VENTURI-EJECTOR
SCRUBBER HEAT EXCHANGER I t 1 OFF-GAS LINE
STACK HYDRO SONIC SCRUBBER
PORTABLE HOOD
SOOkVA ro en TRANSFORMER
DATA ACQUISITION SYSTEM
BLOWER
CONTAINMENT MODULE
FIGURE 12. Cutaway View of Pilot-Scale ISV Process Trailer and Hood
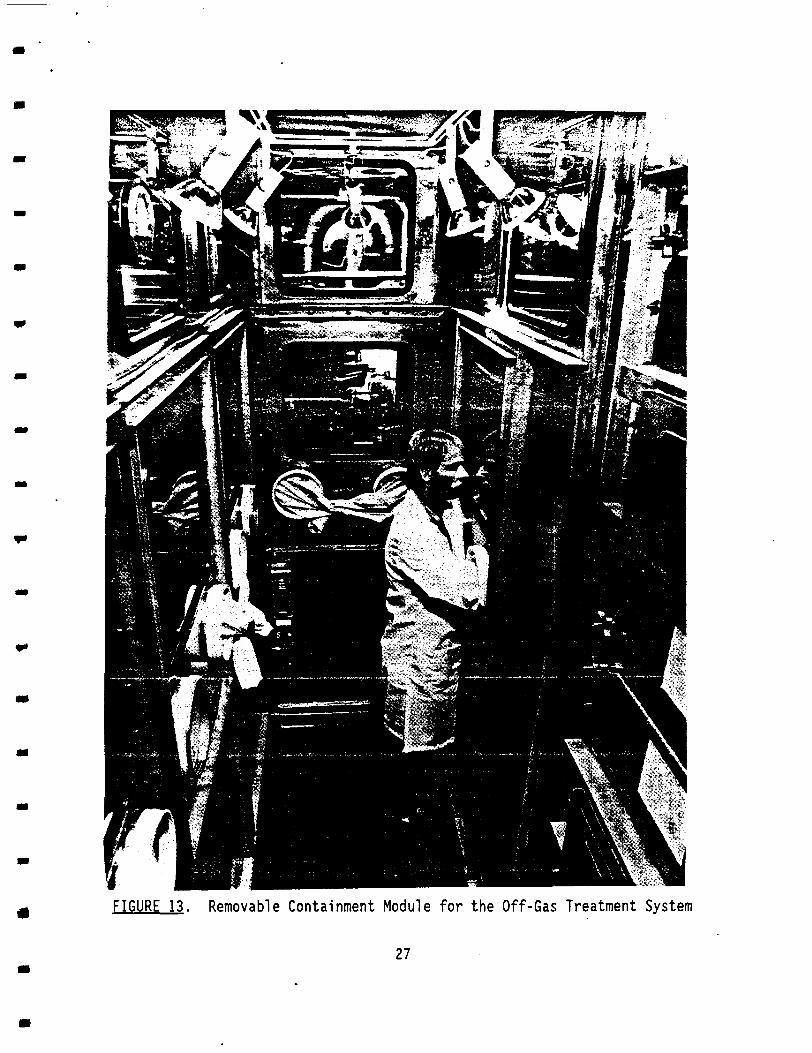
FIGURE 13. Removable Containment Module for the Off-Gas Treatment System
27

SUBSONIC NOZZLE
CAS
MUMNtENANCt OMM
MAINTENANCE MIST StAOt DRAIN
FIGURE 14. Tandem Nozzle Hydro-Sonic Scrubber (Hydro-Sonic Systems,Dallas, Texas)
vapors, removes larger particles, and initiates growth of the finer particlesso that they are more easily captured in the second stage. Particulate iscaptured when the gas is mixed with fine water droplets produced by sprayingwater into the exhaust of the subsonic nozzle. Mixing and droplet growthcontinue down the length of the mixing tube. Large droplets containing theparticulate are then removed by a vane separator and drained back into thescrub tank. The unit is designed to remove over 90% of all particulatesgreater than 0.5-/an dia when operated at a differential pressure of 127 cm ofwater. Removal efficiency increases with an increase in pressuredifferential.
Additional water is removed from the off-gas system by a condenser that2
has a heat exchange area of 8.9 m and a final separator. The gases are thenreheated to -25°C in a 30-kW heater to prevent condensate carryover to thefilters.
The first stage of filtration consists of two 61- x 61- x 29-cm (24- x24- x 11.5-in.) HEPA filters in parallel. During operation, one filter isused and the other remains as a back-up in case the generating filter becomesloaded. The primary filter can be changed out during operation. Thesecond-stage HEPA filter acts as a back-up if a first-stage filter fails.
28
TEST DESCRIPTION
This section describes the bench- and engineering-scale ISV test equipment and off-gas system used for the New Bedford Harbor test, plus the specific test setup and operations. The bench-scale test was conducted using theengi neering-scale processjing^ggritai per, off-gas system, and power supply tobetter simulate the power density, melt rate, and control of the larger-scale operational ISV systems.
SOIL AND SLUDGE CHARACTERIZATION
This section gives the compositions of the sludge and surrounding soilprocessed in the ISV test equipment. Table 2 lists the composition of thesludge. This analysis was provided by E. C. Jordan Co. Table 3 lists thecomposition of the Hanford soil, as oxides, used to surround the sludge inthe test. The composition of the soil indicates that enough glass-formingmaterials (i.e., Si02 and A OS) and flux (i.e., Na20 and l<20) are present toform a durable glass product at the ISV process temperature range (1200*C -2000°C).
TEST EQUIPMENT AND SETUP
The equipment used at BNW was a combination of a bench-scale sized testbed and the engineering-scale power supply and off-gas system. The actualvitrification took place in a|halved SB-gallon drum,\which was placed in theengineering-scale processing container. The sealed metal engineering-scaleprocessing container shown in Figure 15 measures 1.8 m (6 ft) in diameter by2.4 m (8 ft) tall. The processing container provided contaminated soil containment for the off-gas vacuum sealing. The single-phase engineering-scalepower supply consisted of a 10-kW transformer with four voltage taps (400,240, 160, and 80 volt), and silicon-controlled rectifier (SCR) control.
Two molybdenum electrodes, 1.27 cm (0.5 in.) in diameter with 3.81-cm-(1.5-in.) diameter graphite collars, were inserted 17.8 cm (7 in.) into thetest soil. The electrodes were spaced 12.7 cm (5 in.) apart. The modified55-gallon drum was electrically isolated. The top of the soil surface was
29

TABLE 2. Composition of the New Bedford Harbor Sediment
Semi-Volatile Organic Compounds1.3 - Dichlorobenzene1.4 - Dichlorobenzene4-Methylphenol1,2,4, - TrichlorobenzeneMophthalene2-Methylnaphthalene Acerwphthylene Acenaphthene Dibenzofuran Fluorene PhenanthreneAnthraceneDi-n-Butylphthalate FluoranthenePypeneButyIbenzyIphthalateBenzo (a) Anthracene bis (2-Ethylthexyl) Phthalate Chrysene Benzo (b) FluorantheneBenzo (k) FluorantheneBenzo (a) PyreneIndeno (1,2,3-cd) PyreneDibenz (a,h) AnthraceneBenzo (g,h,i) Perylene
Pestieides/PCBAroclor-1242Aroclor-1248Aroclor-1254
PCS CongenersMonochlorobi phenylsDichlorobiphenylsTrichlorobiphenylsTetrachIorobiphenylsPentachIorobiphenyIsHexachlorobi phenyls
Inorganic CompoundsAluminumArsenicBariumCadi inCalciumChromiumCopperIronLeadMagnesiumManganeseMercuryNickelPotassiumSeleniumSodiumThalliunVanadiumZinc
XSolidDilution Factor
Analytical CRDL(a> Method tig/kg »g/kg
330 19,000 330 55,000 330330 54,000 330330330330330330330330330330330330330330 59,000 330330 8,000 330330330330330
80 5,000,000 80
160 5,500,000
26,000 1,100,000 2,700,000 3,100,000 1,600,000
330,000
Analytical CRDLMethod mg/kg gg/kg
40 22,100 2 1540 2071 37
1,000 5,440 2 7865 1,520 20 24,400
P/F 1 1,150 1,000 8,230
3 194CV 0.04 2.4
8 1061,000
11,000 14,200
2104 3,250
31.1 100
(a) Contract-required Detection Limit.
30

TABLE 3. Composition^*) of the Surrounding Soil
Oxide Wt%A12°3 13.0B2°3 0.053BaO 0.068CaO 6.33Fe203 10.0
1.7MgO 2.96Mn02 0.193Na20 2.80NiO 0.077P205 0.429Si02 55.5SrO 0.044Ti02 1.92Zr02 0.041
TOTAL 95.1Moisture (wt%) 0
(a) Soil from the Hanfordsite was used to surround the sediment inthis test
covered with 5.1 cm (2 in.) of blanket insulation to minimize surface heatloss and promote melt surface subsidence during processing. A gap in theinsulation around each electrode provided a gas vent.
Type K thermocouples were incrementally positioned along the center!ineand the side of the test container to monitor the progress of the melt andthe surrounding soil temperature profiles (Figure 16). Not shown is an additional high-temperature type C thermocouple that was placed at the 11.4-cm(4.5-in.) centerline depth. The high-temperature thermocouple was used todetermine the operating melt temperature during ISV.
31

HIGHVOLTAG
FIGURE 15. Engineering-Scale ISV Processing Container
32

^^^^m ^MMBI
10" 8" 6" 0 I I | i 1 111 1 1 I
I I I11
••«.
• Insulation V2"
• 4" - •i ^-^*' Electrodes
^— *—- .—•• •i
6" - •v.•> Test Container
•8" - «,. . •> • • ^s^Sediment 10" - •• •>
12" Thermocouple ^^*
14" . Locations 9
16" - •
18" - •
20"
Top View - Sediment Placement Sediment Placement Boundary Shown
FIGURE 16. ISV Test Configuration: Sediment Placement and Thermocouple Locations (dimensions are in inches)
33

Figure 16 also shows the configuration of the sludge as positioned forthis test. The sediment was placed between the electrodes from 5.1 cm(2 in.) below the soil surface to a depth of 17.8 cm (7 in.). The cross-sectional area containing the electrodes and sediment mersured 7.6 cm (3 in.)by 16.5 cm (6.5 in.). The soil from the 17.8-cm (7-in.) to 50.8-cm (20-in.)depth was analyzed to monitor thermal migration effects to the surroundingsoil. The contaminated material within the vitrification zone was totallyconsumed by the ISV melt.
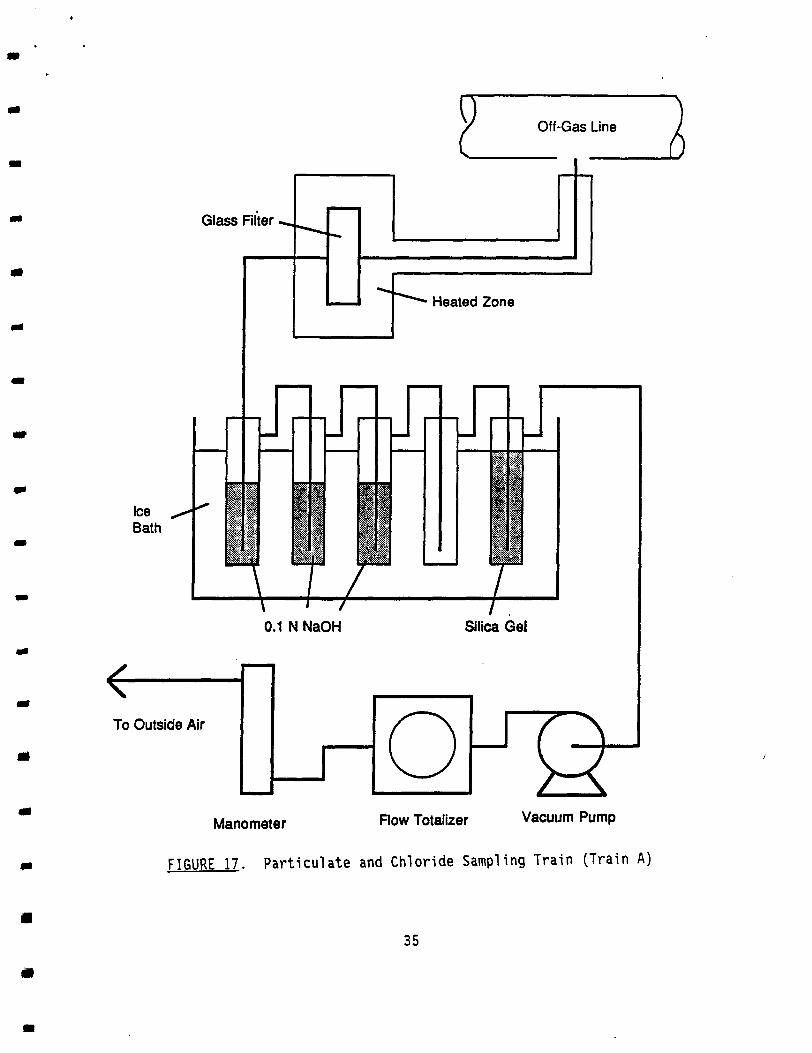
Off gas from the vitrification zone was representatively sampledthroughout the test with two sampling trains (Figures 17 and 18). The twosampling trains were designed to collect PCBs, dioxins, furans, and totalchlorides.
The first sampling train (Train A, Figure 17) consisted of an EPA Reference Method 5 sampling scheme (40CFR60, Appendix A). Participates were collected by drawing a representative sample from the 2-in. off-gas process linethrough a heated probe assembly leading into a glass fiber filter. The filter was housed in an oven compartment maintained at approximately 260°F.After exiting the filter/oven assembly, the gases were drawn through a seriesof three impingers containing a 0.1 N sodium hydroxide (NaOH) solution toscrub out chlorine radicals, such as HC1. A fourth empty impinger was placedin line to collect carry-over liquid/condensate, and the final impinger contained silica gel to trap water vapor. A control unit was used to monitorand control sampling rates, record sample volume, and track off-gas samplingtemperatures during the vitrification.
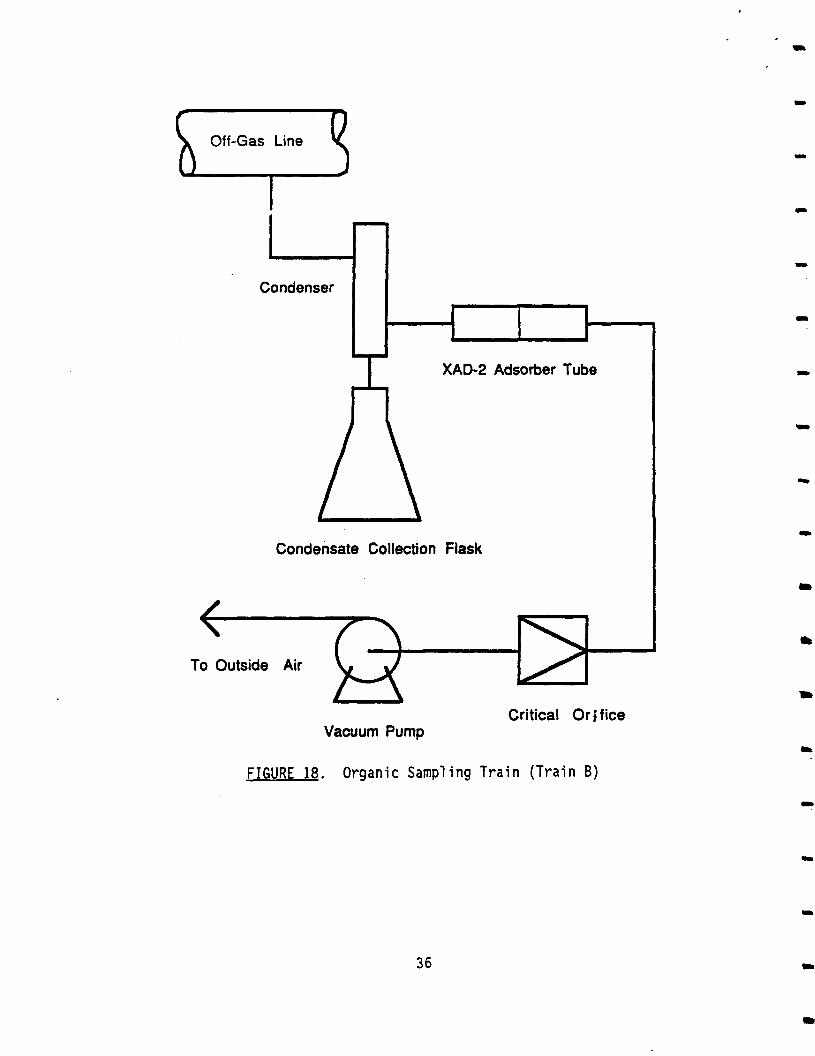
A second sampling train (Train B, Figure 18) was incorporated into theoff-gas line to collect PCBs, dioxins, and furans. This train consisted of aprobe leading into a condenser connected to a small impinger. A series oftwo XAD-2 sorbent tubes were placed down-stream of the impinger to collectorganics. Sampling flow rates were controlled by using a calibrated criticalorifice coupled to a diaphragm pump. Appendix A contains more details concerning the off-gas sampling.
34
Glass Filter
To Outside Air
Manometer How Totalizer Vacuum Pump
FIGURE 17. Participate and Chloride Sampling Train (Train A)
35
Off-Gas Line
Condenser
XAD-2 Adsorber Tube
Condensate Collection Flask
To Outside Air
Critical Orifice Vacuum Pump
FIGURE 18. Organic Sampling Train (Train B)
36

TEST OPERATIONS
The bench-scale ISV test was conducted in September 1988 to assess theapplicability of the ISV process for stabilizing RGB-contaminated sludges.Approximately 1.53 kg of RGB-contaminated sludge were vitrified. No operational problems were encountered during the test run. The high 1 0 contentof the sediment (69 wt%) did not appear to hinder the test operation. Vitrification processing proceeded to the 29.2-cm (11.5-in.) depth and produced an8.2-kg (18 Ib) block over a 3-hr period. This block was cylindrical andmeasured 15.7 cm (6.2 in.) in diameter across the middle and an average of13.0 cm (5.12 in.) across the top of the block (Figure 19).
Average off-gas flow during the test was 29 scfm. From this flow, arepresentative sample was drawn at 0.5 cfm (13 L/min) through the particulatesample train (Train A), and 1 L/min through the organic sample train(Train B) to analyze for off-gas releases during processing.
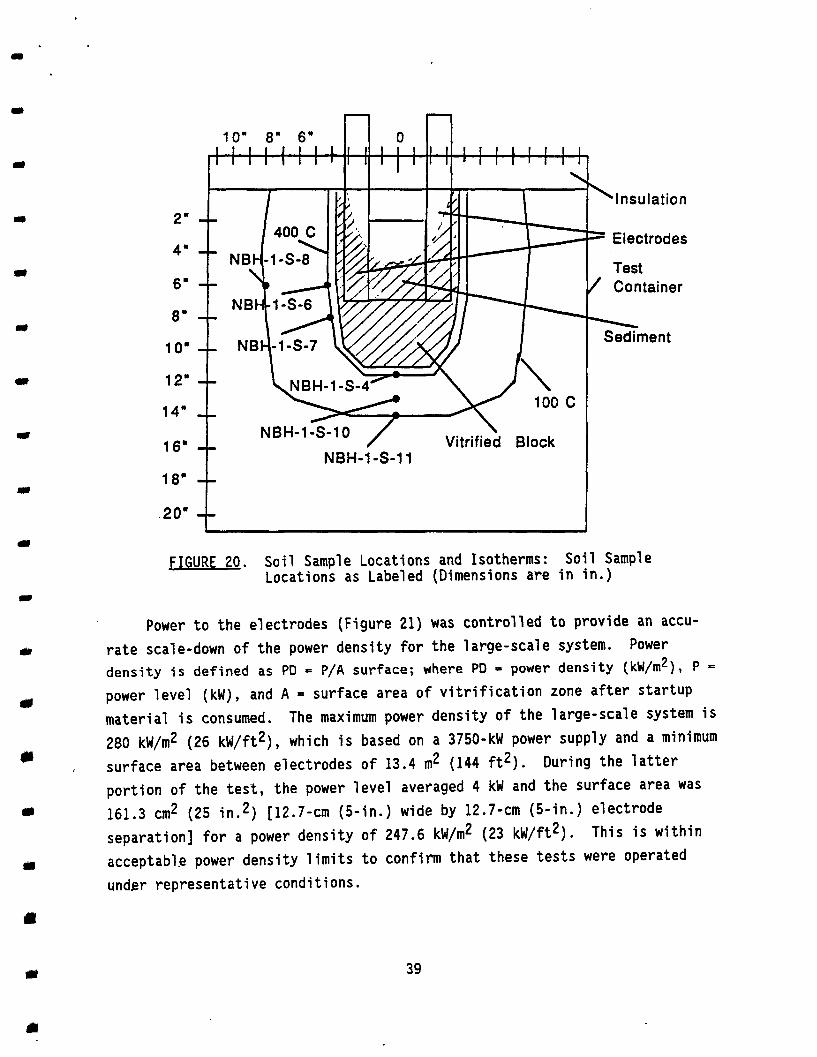
Figure 20 illustrates the 100°C and 400"C isobank locations in the soilsurrounding the vitrification zone, as determined from the thermocouple data.These bands are approximately 5.1 cm (2 in.) wide. The 400*C isoband islocated approximately 1 in. from the vitrified block; the 100"C isoband,12.7 cm (5 in.) from the block. These isobands represent regions wherecondensation and deposition of RGBs could occur during ISV processing.Condensation of RGB vapor occurs at 400°C (average RGB boiling point).Condensation/deposition of steam-stripped RGBs occurs at 100'C (condensationtemperature of steam). The isobands were used to determine appropriatesampling locations of the surrounding soil. These samples were used todetermine if RGB migration had occurred. The soil sample locations are alsoshown in Figure 20.
The high-temperature type C thermocouple data identified the actualoperating melt temperature of 1860*C - 2100°C.
Electrical power data are given in Table 4. Electrical power and meltdepth data for the ISV test are plotted in Figures 21 and 22, respectively.The total energy consumed for the test was 8.1 kWh. This provides an energy-to-mass ratio of 1.0 kWh/kg, which is within the normal range. Typicalratios measured for previous ISV tests have ranged from 0.8 to 1.1.

FIGURE 19. Vitrified Block Resulting from the ISV Process
38
10' 8" 6"
Insulation
Electrodes
Test / Container
Sediment NBH-1-S-7
NBH-1-S-4
NBH-1-S-10
NBH-1-S-11
FIGURE 20. Soil Sample Locations and Isotherms: Soil SampleLocations as Labeled (Dimensions are in in.)
Power to the electrodes (Figure 21) was controlled to provide an accurate scale-down of the power density for the large-scale system. Powerdensity is defined as PD = P/A surface; where PD - power density (kW/tn2), P =power level (kW), and A - surface area of vitrification zone after startupmaterial is consumed. The maximum power density of the large-scale system is280 kW/m2 (26 kW/ft2), which is based on a 3750-kW power supply and a minimumsurface area between electrodes of 13.4 m2 (144ft2). During the latterportion of the test, the power level averaged 4 kW and the surface area was161.3 cm2 (25 in.2) [12.7-cm (5-in.) wide by 12.7-cm (5-in.) electrodeseparation] for a power density of 247.6 kW/m2 (23 kW/ft2). This is withinacceptable power density limits to confirm that these tests were operatedunder representative conditions.
39

TABLE 4. Power Performance Data
Date Run Time (h) Amps Volts Watts Watt-Hours 12 Sep 0 10 56 560 0 12 Sep 0.07 18 F2 936 52 12 Sep 0.40 38 36 1368 380 12 Sep 0.75 40 24 960 407 12 Sep 0.92 100 22 2200 269 12 Sep 1.22 43 103 4386 988 12 Sep 1.28 38 91 3458 235 12 Sep 1.47 41 102 4182 726 12 Sep 1.53 50 95 4750 268 12 Sep 1.78 32 80 2560 914 12 Sep 2.12 36 84 3024 949 12 Sep 2.32 45 82 3690 671 12 Sep . 2.57 57 78 4446 1017 12 Sep 2.83 72 66 4752 1196
Total Power Consumed 8072
40

NEW BEDFORD HARBOR ISV BENCH-SCALE TEST
s a o cu
0.5 i i i
1.2 1.6 2 2.4 2.8
RUN TIME, HR
FIGURE 21. Electrical Power Performance

5
NEW BEDFORD HARBOR ISV BENCH-SCALE TEST
U
wEwQ
0 2.8
RUN TIME, HR
FIGURE 22. ISV Melt Depth Progression
I I i i i i r i i

TEST RESULTS
Following the test of the New Bedford Harbor sediment, analyses wereconducted on the off-gas emissions to obtain PCB release information, thesurrounding soil to determine PCB migration effects, and the vitrified blockto determine specific material retention within the block. All analyticaldata indicate the feasibility of processing the PCB-contaminated sediment byISV, in conjunction with the use of a wet scrubbing and sorption off-gastreatment system.
The bench-scale ISV test was performed over a 3-hour period and reacheda depth of 22.9 cm (9 in.) according to thermocouple measurements. The blockweighed 8.2 kg (18 Ib). Post-test measurements indicated that the block was29.2-cm (11.5-in.) deep with 12.7 cm (5 in.) of subsidence (see Figure 20).This 43% subsidence was caused by the densification of the soil and contaminants into the vitrified product during processing.
OFF-GAS CHARACTERIZATION
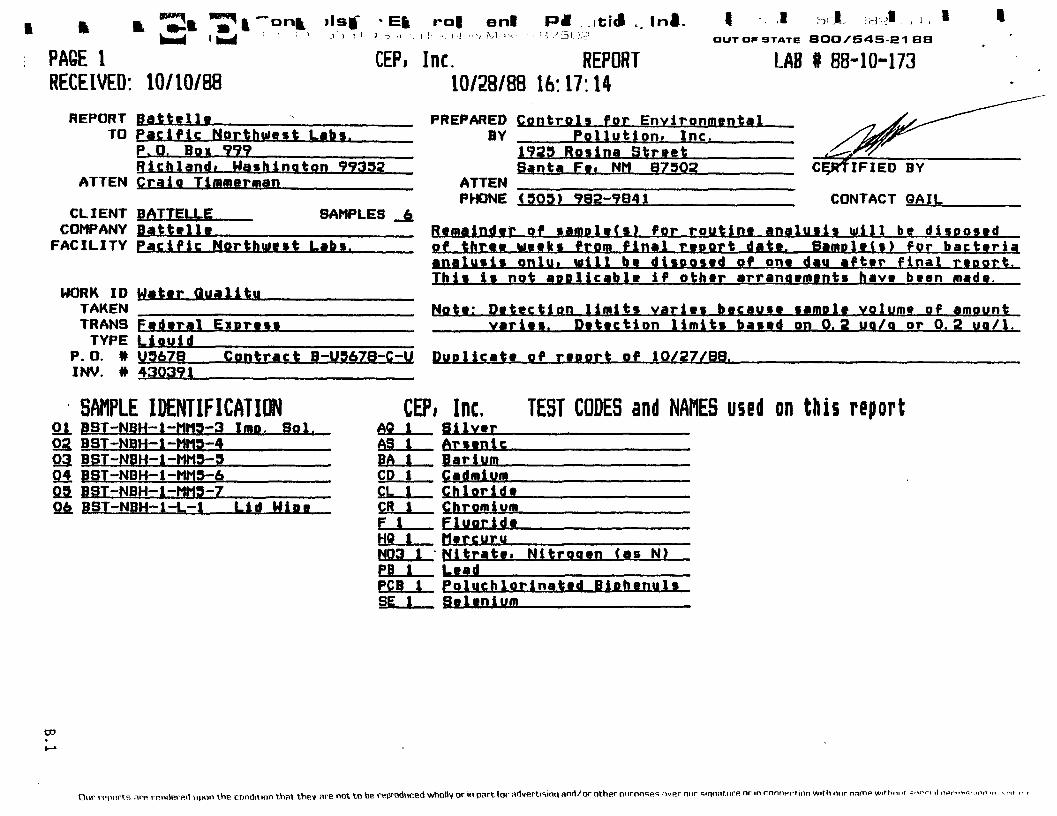
Off-gas stream sampling identified the amount of particulate releasedduring processing. The off-gas system component analyses for PCBs, dioxins,furan, chloride (Cl~), and metals are listed in Tables 5 and 6; scrub solution results and XAD-2 sorbent analyses in Table 5; and filter, lid smear,and insulation analyses in Table 6. Copies of the reports furnished by theanalytical laboratory (Controls for Environmental Pollution, Inc.) are givenin Appendix B.
All PCB, dioxin, and furan levels were reported to be below the detection limits of the analytical laboratory and are listed in Tables 5 and 6 as"less than" (<) quantities. These quantities vary for some of the componentsbecause of the sample volume or amount. The detection limits are based on0.2 /ig/g (ppm)'3' or 0.2 /ug/L (ppb)' ' depending on whether the sample was asolid or liquid. The exactness of the reported quantities is questionable.The PCB concentrations of the blank or reference solutions/filter are
(a) 1 jug/g = 1 ppm, 1 jig/kg * 1 ppb.(b) 1 /igM = 1 ppm, ljug/L = 1 ppb.
43

TABLE 5. Impinger Solution, Rinse, and XAD-2 Analyses
SampleDescription
PCBs, ppb
Dioxin, ppb
Furans ppb
CT, ppm
Impingersolution-300 ml
<2.0 NA NA 9.00
(0.1 N NaOH)
Impingersolution-75 ml
<5.0 NA NA 2.60
(0.1 N NaOH)Blank
•
Train A-lst rinse <2.0 NA NA NA (1:1 CH3OH/CH2C12)75 ml
Train A-2nd rinse <2.5 NA NA NA (1:1 CH3OH/CH2Cl2) 75 mL
Solvent Rinse Blank <2.5 NA NA NA (1:1 CH3OH/CH2C12) 75 ml
XAD-2 Sorbent Tube <0.2 <1.0 <1.0 NA
NA = not analyzed.
reported as quantities equal to or slightly greater than those of the samplescollected during the test. The low levels of Cl" detected do not raiseconcern for off-gas system corrosion. Further testing needs to be done todetermine the level of Cl" dissolved in the glass and the amount of Cl" givenoff in the form of Cl- through the off-gas system.
Analyses of the filter particulate, lid smear, and insulation samples(Table 6) show that small amounts of cadmium and lead are volatilized duringprocessing. The amounts of Cd and Pb volatilized are 1% and 2%, respectively, based on initial sediment concentrations of 37 ppb Cd and 1150 ppbPb. The particulate commonly consists mostly of entrained particles such asfine dust and smoke. The analyses of the lid wipe and insulation give lessthan 0.80- and 0.04-ppm PCB concentrations, respectively. No significantplate-out of PCBs occurred in the test processing container.
44

TABLE 6. Particulate Analyses of Filter Insulation and Lid Smear(a)
Lid Smear, Insulation, Filter
Material Filter, ua Blank, ua (com) (oom) PCBs <0.40 <0.60 <0.80 <0.04
Ag <2.00 <2.00As <2.00 <2.00Ba <20.00 <20.00
Cd 12.80 <0.20Cr <2.0 <2.0F 0.23 0.35
Hg <0.08 <0.08Pb 640.00 5.80Se <2.00 <2.00
Total wt. of particulate collected: 0.271 g
(a) Lid smear and insulation analyzed for PCBs only.
GLASS AND SURROUNDING SOIL CHARACTERIZATION
Analyses of the vitrified (glass) product and samples of soil surrounding the vitrified block indicate that minimal migration of PCBs to the surrounding soil occurred. Table 7 gives the results of analysis for PCBs inone sample of glass and six samples of soil surrounding the vitrified block.This analytical work was provided by E.C. Jordan Co. Copies of the analytical reports are given in Appendix C. Detectable amounts of PCBs were notpresent in the glass or in half of the soil samples. The suspected presenceof very small amounts of PCBs (<0.5 ppm), and only as Aroclor 1232, wereidentified in soil samples located in the general area of the 100°C soilisotherm (see Figure 20). The amounts of PCBs suspected (250 ppb, maximum)are well below the 40 CFR 761 clean-up level limit for nonrestricted accessareas (10 ppm), and below other levels of concern commonly interpreted to bebetween 1 and 2 ppm. This indicates that PCB migration outside the vitrification zone was not a significant problem. For additional confirmation,testing of soil outside the 100'C isotherm should be performed. The PCBlevels reported are within a factor of three of the reported detectionlimits, and thus some caution should be applied toward the datainterpretation.
45

TABLE 7. Analyses of the Glass and Surrounding Soil
Pestlcides/PCB CRDL(a) ua/kd NBH-l-G-2 NBH-l-S-4
Concentration (uq/kq) NBH-l-S-11 NBH-l-S-6 NBH-l-S-8 NBH-l-S-7 NBH-l-S-10
Aroclor-1016 Aroclor-1221 Aroclor-1232
80 80 80
33 U(b)33 U 33 U
33 U 33 U 33 U
34 U 34 Ulrl 120 X*c'
33 U 33 U 33 U
34 U 34 U 250 X.
33 U 33 U 33 U
33 U 33 U 150 U
Aroclor-1242 80 33 U 33 U 34 U 33 U 34 U 33 U 33 U Aroclor-1248 80 33 U 33 U 34 U 33 U 34 U 33 U 33 U Aroclor-1254 160 67 U 67 U 67 U 67 U 67 U 67 U 67 U
01 Aroclor-1260 160 67 U 67 U 67 U 67 U 67 U 67 U 67 U
Percent Solid 100 100 100 100 100 100 100 Dilution Factor 1 1 1 1 1 1 1
(a) Contract-required detection limit.(b) U = Below detection limit.(c) X = Positive Identification of Aroclor pattern could not be made. Presence is suspected.
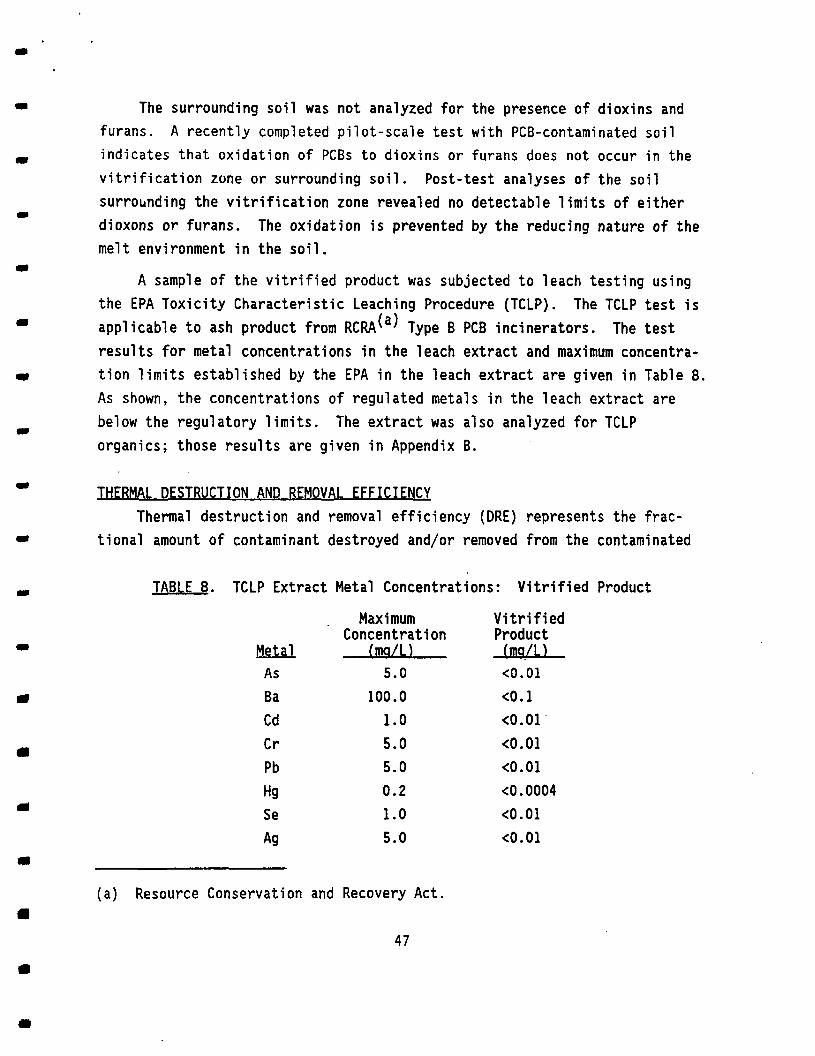
The surrounding soil was not analyzed for the presence of dioxins andfurans. A recently completed pilot-scale test with PCB-contaminated soilindicates that oxidation of PCBs to dioxins or furans does not occur in thevitrification zone or surrounding soil. Post-test analyses of the soilsurrounding the vitrification zone revealed no detectable limits of eitherdioxons or furans. The oxidation is prevented by the reducing nature of themelt environment in the soil.
A sample of the vitrified product was subjected to leach testing usingthe EPA Toxicity Characteristic Leaching Procedure (TCLP). The TCLP test isapplicable to ash product from RCRA^3' Type B PCB incinerators. The testresults for metal concentrations in the leach extract and maximum concentration limits established by the EPA in the leach extract are given in Table 8.As shown, the concentrations of regulated metals in the leach extract arebelow the regulatory limits. The extract was also analyzed for TCLPorganics; those results are given in Appendix B.
THERMAL DESTRUCTION AND REMOVAL EFFICIENCY
Thermal destruction and removal efficiency (ORE) represents the fractional amount of contaminant destroyed and/or removed from the contaminated
TABLE 8. TCLP Extract Metal Concentrations: Vitrified Product
Maximum VitrifiedConcentration Product
Metal (ma/U (mq/L)As 5.0 <0.01Ba 100.0
Cd 1.0 <0.01Cr 5.0 <0.01Pb 5.0 <0.01
Hg 0.2 <0.0004Se 1.0 <0.01
Ag 5.0 <0.01
(a) Resource Conservation and Recovery Act.
47

matrix. The ORE is defined for incinerators that burn hazardous waste in
40 CFR 264, and is determined from the following equation:'3'
ORE - tWin - Wout)x 1QQ% (J)
Win
where Win - mass feed rate of the principal hazardous constituent in thewaste stream feeding the incinerator (or mass of constituent inthe waste to be treated).
Wout - mass emission rate of the principal hazardous constituent inexhaust emissions prior to release to the atmosphere (or mass ofconstituent released in the off -gas).
Table 9 lists the amounts of PCBs released to the off -gas system andexisting on the process container and lid insulation as a result of plate-out. Since detectable amounts of PCBs were not found in the off -gas samplingsystem, lid smear, and insulation, the off -gas system release and plate-outwere calculated based on the detection limits furnished by the analyticallaboratory.
The % ORE for the ISV system is greater than 99.9985%. This valuerepresents the amount of PCBs not released to the off -gas system and is basedon PCB analytical detection limits. This % ORE, as calculated for thissystem, does not include the removal efficiency of the off -gas system itself.
TABLE 9. Amounts of PCBs Released from Vitrified Area through Off-Gas System
Source Amount Released, uqOrganic Sampling Train <198.83(Train B analysis)
Insulation Plate-Out <104.01
Engineering-Scale <126.67Processing ContainerPlate-Out
(a) 40 CFR 264.343(a)( l ) .
48

A single-stage activated carbon filter has a 99.9% organic removal efficiency(Charcoal Services Corporation). The ISV system soil-to-off-gas % ORE with asingle-stage carbon filter is estimated to be greater than 99.99999 (sevennines). This is greater than the 99.9999% efficiency required by 40 CFR761.70 for PCB incinerators. The carbon filters routinely used in thelarger-scale ISV system are double-stage filters. With removal efficienciesof 99.9% per stage, the ISV system % ORE with a double-stage carbon filter isestimated to be greater than "9 nines."
SYSTEM MASS BALANCE - PCBs
An overall system mass balance for PCBs was performed. The amounts ofPCBs released to the off-gas system, existing on the process container andlid insulation as a result of plate-out, present in the glass matrix, andpresent in the surrounding soil due to migration are listed in Table 10. Theoff-gas and plate-out components were presented in the ORE discussion above.Since detectable amounts of PCBs were not found in the glass matrix (vitrified block), the amount of PCBs present was calculated based on the detectionlimits furnished by the analytical laboratory. The maximum amounts of PCBspresent in the soil surrounding the vitrified material were calculated usingthe largest concentration of PCBs suspected in the soil (250 ppb).
TABLE 10. Total Amounts of PCBs Released from Vitrified Area
Source Amount Released, ua Organic Sampling Train(Train B analysis)
<198.83
Insulation Plate-Out <104.01
Engineering-ScaleProcessing Container Plate-Out
<126.67
Glass Matrix 1,312
Soil Surrounding VitrifiedProduct: to 100 "C Isoband
16,320
(see Figure 20.)
49

The overall mass balance for the ISV system shows that greater than99.94% of the PCBs were destroyed by the process. The % PCBs destroyed wascalculated by subtracting the amount released to the off-gas system, plate-out within the system (none detected; detection limit used for calculation),amount in 3!ass matrix (none detected; detection limit used for calculation),and the limited amount of migration to the surrounding soil (based onsuspected presence limited by analytical detection techniques). The amountof PCBs released to the soil was assumed to be the amount contained in thevolume of surrounding soil up to the 100*C isothermal band. This amount wascalculated as a conservative case, with the maximum suspected concentrationof PCBs detected (250 ppb) used to calculate the amount of PCBs present inthis soil volume. A greater understanding of PCB behavior should be morethoroughly pursued in larger-scale tests.
50

ECONOMIC ANALYSIS AND LARGE-SCALE APPLICATION
Bench-scale testing of ISV's capability to treat wastes produces conservative results compared to actual large-scale ISV performance on thewastes. Prior tests have indicated that ISV performance in all areasimproves with increasing scale. Relative to the effectiveness of the processto destroy/remove PCBs, the effectiveness improves with increased scalebecause of the greatly increased melt depth and dwell time (i.e., exposuretime of hazardous materials to the melt temperature). Process economics alsoimprove directly with scale in that thermal losses are minimized and indirectlabor input (e.g., time spent moving the hood and placing electrodes) isminimized compared to direct labor input (time spent monitoring vitrificationoperations).
Projected costs for ISV at New Bedford Harbor must be supplied on asite-specific basis. In 1988, Battelle transferred the rights of ISV fornonfederal government, chemical hazardous wastes to Geosafe Corporation inKirkland, Washington. Consequently, site-specific costs for ISV applicationto New Bedford sediments must be supplied by Geosafe.
Previous estimates for vitrifying contaminated soil have been providedfor generic, federal applications (Buelt et al. 1987). The cost informationprovided in that reference should be considered preliminary and not directlyapplicable to the site-specific cost projections for the New Bedford sediments. However, the reference does provide a basis for estimating costs forapplying ISV at federal contaminated soil sites. These costs include estimates of capital amortization as well as labor, electrical energy, and materials to support ISV operations.
The conditions of the New Bedford sediments have been input to an ISVmathematical model described by Buelt et al. (1987). The model accounts forsoil moisture and soil and glass densities associated with New Bedford sediments to predict the melt shape and energy requirements for vitrifying thesediments to a 5-m depth. The model predicts energy requirements of1.04 kWh/kg, which is corroborated by the bench-scale test result of1.0 kWh/kg. The maximum and average block widths are 7.8 and 6.8 m,respectively, meaning the center point of each setting should be placed 6.8 m
APPENDIX D
51

apart with 0.5-m overlap with each adjacent setting. Each setting of fourelectrodes spaced 4.5 m apart vitrifies 250 m of sediment in 106 h. Consequently, allowing for 16 h between settings for equipment moves and allowingfor a 70% total operating efficiency, the model predicts that 10,000 m
3(13,000 yd ) of contaminated sediments could be vitrified in 40 settings overa 9-month period with a single unit. Alternatives to this configuration suchas vitrifying repetitive batches of sediments in a single setting can beprovided by Geosafe.
Utilization of ISV at the New Bedford Site will require that the sediments be dredged and located onshore for processing. The sediments may beprocessed by ISV either at, above, or below grade. In order to achieve goodproduction economics, it will be necessary to place the sediments at a depthin the range of 4.6 to 15.2 m. Since depths of 5 m have been demonstratedwith existing equipment, it would be advisable to maintain sediment depths atthe lower end of this, range. It may be desirable to place a shallow (i.e.,30 to 60 cm) layer of clean soil over the sediment prior to processing tominimize release of vaporized PCBs during startup.
There may be economic incentive to allow some gravity dewatering and airdrying prior to processing. The technology is capable of processing fullysaturated sediments; however, there is an economic penalty associated withthe energy required to vaporize and remove the water. The effect of possiblemechanical dewatering on total costs should be explored before committing toa final operational plan.
The large-scale ISV system (of present design) is capable of processing3
4 to 6 tons/h to treat a single setting volume of 382 to 765 m , depending onconfiguration. Increased production rates can be achieved for large-volumeapplications by using more than one large-scale machine or by using speciallydesigned equipment with greater throughput capability. There is no physicalor technological condition limiting scale to the present large-scale configuration. Rather, this equipment was sized so that it would fit ontrailers suitable to classify it as mobile equipment. It is possible todesign larger-scale equipment if specific site conditions warrant. Individual setting size and processing rate capabilities could also be increased;this would result in further economies of scale.
52

Large-scale ISV processing equipment enjoys some inherent reliabilityfeatures that most other technologies do not. Since the process involveselectric melting, there is a minimum of moving equipment parts associatedwith applying energy to the contaminated soil. The only moving equipmentassociated with the energy application system is the transformer coolingfans. This feature is considered a very significant advantage compared toother thermal processes employing burners or other moving equipment items inhigh-temperature zones, or in contact with high-temperature waste materials.
The off-gas treatment system uses conventional unit process equipmentthat will be required by any thermal treatment process, assuming that theywill all have to collect and treat off-gases. This equipment will bedesigned to be readily serviceable and replaceable. The off-gas treatmentsystem is technologically simple so that adequate margins of safety andreliability are easily obtained.
It is not expected that utilization of ISV will require any greatdifficulty in the construction area. It is noted that the residual glassmonoliths produced should be suitable for deli sting as hazardous materialsand could be left in place, where processed. If for some reason it wasnecessary to remove the monoliths, they would have to be broken intotransportable sizes; this would require additional costs. It is conceivablethat the monolith segments could be returned to the harbor without imposingany risk of heavy metal leaching at rates above acceptable limits. Theresidual material should quality for land disposal at any location afterdelisting. It is obvious that the lowest cost option would be to leave it inplace where produced. The residual product is expected to have excellentstrength properties, and thus should be capable of supporting constructionabove it (i.e., parking lot, buildings).
It is also noted that the residual product will be of much lower volumethan the starting sediment volume. Because of the high water content, it isexpected that a volume reduction of 40% to 60% may be achieved. The volumereduction will result in subsidence in the processing area. If the processing is done at grade level, it may be desirable to backfill with cleansoil to restore grade and to allow vegetation to grow. The depth of the
53

residual product surface can be controlled by controlling the startingelevation of the sediment for processing.
Equipment availability is not considered to limit the technology. Theequipment consists of an assembly of major subsystems that are procured fromvendors specializing in certain areas (e.g., electrical transformers, glycolradiators, scrubbers). It is possible to assemble large numbers of systemssimultaneously; the rate is dependent only upon the availability of subsystemcomponents. It is not expected that any subsystem component will have adelivery lead time in excess of 6 months.
Treatment and handling of secondary scrubber and filter wastes is notexpected to pose a problem for ISV processing. Ideally, as part of thetreatment process, any contaminated scrubber solution and filter materialsshould be placed into the next available setting. In this way essentiallyall of the PCBs and heavy metals at the site will be either destroyed (PCBs)or immobilized (heavy metals). Only a very small amount of secondary wasteresulting from the last ISV setting at the site would require final disposal.That amount would be insignificant compared to the large quantities ofhazardous wastes processed. That final secondary waste could be readilydisposed in some other ISV setting or sent to conventional treatmentfacilities.
Battelle believes the bench-scale testing corroborates that ISV technology is applicable for use on the New Bedford harbor sediments. For additional information and details, refer to Buelt et al. (1987). This documentis very comprehensive and addresses many areas of concern regarding ISVprocess implementation.
54

REFERENCES
Buelt, J. L., and J. G. Carter. 1986. In Situ Vitrification Large-ScaleOperational Acceptance Test Analysis. PNL-5828, Pacific Northwest Laboratory, Richland^ Washington.
Buelt, J. L., and J. G. Carter. 1986b. Description and Capabilities of theLarge-Scale In Situ Vitrification Process. PNL-5738, Pacific Northwest Laboratory, Richland, Washington.
Buelt, J. L., and S. T. Freim. 1986. Demonstration of In Situ Vitrificationfor Volume Reduction of Zirconia/Lime Sludges. Prepared for Teledyne WahChang, Albany, Oregon, under Contract 2311205327. Pacific Northwest Laboratories, Richland, Washington.
Buelt, J. L., C. L. Timmerman, K. H. Oma, V. F. FitzPatrick, and J. G.Carter. 1987. In Situ Vitrification of Transuranic Waste: An UpdatedSystems Evaluation and Applications Assessment. PNL-4800 Suppl. 1, PacificNorthwest Laboratory, Richland, Washington.
Charcoal Services Corporation, "High Efficiency Gas Adsorbers," CharcoalServices Corporation, Bath, North Carolina. Bulletin No. 283A.
Lazar, I. 1977. "Making the choice Among Dry, Liquid, and Gas Transformers." Specifying Engineer 37:130-131.
Oma, K. H., D. R. Brown, J. L. Buelt, V. F. FitzPatrick, K. A. Hawley, G. B.Mellinger, B. A. Napier, D. J. Silviera, S. L. Stein, and C. L. Timmeroian.1983. In Situ Vitrification of Transuranic Wastes: Systems Evaluations andApplications Assessment. PNL-4800, Pacific Northwest Laboratory, Richland,Washington.
Timmennan, C. L. 1986. In Situ Vitrification of PCB-Contaminated Soils.EPRI CS-4839, Electric Power Research Institute, Palo Alto, California.
Timmennan, C. L., R. A. Brouns, J. L. Buelt, and K. H. Oma. 1983. "In SituVitrification: Pilot-Scale Development." Nuclear and Chemical Waste Management. 4:267.
Timmerman, C. L. and K. H. Oma. 1984. An In Situ Vitrification Pilot-ScaleRadioactive Test. PNL-5240, Pacific Northwest Laboratory, Richland,Washington.
55

APPENDIX A
OFF-GAS SAMPLING

TARGET SHEET
() OVERSIZE
()
(x) OTHER
Description:Doc ID: 288685
IF YOU HAVE
CENTER AT (617) 918 - 1440
THE MATERIAL DESCRIBED BELOW WAS NOT SCANNED BECAUSE:
NON-PAPER MEDIA
Site: New Bedford Harbor Appendix A: Off-Gas Sampling
THE OMITTED MATERIAL CONTAINS CONFIDENTIAL BUSINESS INFORMATION (CBI) AND IS AWAITING DETERMINATION.
ANY QUESTIONS, PLEASE CALL THE OSRR RECORDS AND INFORMATION

APPENDIX B
ANALYTICAL RESULTS FROM CONTROL FOR ENVIRONMENTAL POLLUTION. INC.
ils§ • Eft ro| enl P* itiJ ,. Inl. I -. ,1 rid. Jo) ,'I , i ,ft •1 ) i I I -$ ., 1 P . I J ..-/ |\1 ;x ' ' ' i ''3 ("!,;-> OUT OF STATE 800/343-3188
PAGE 1 CEP, Inc. REPORT LAB I BB-lO-173RECEIVED: 10/10/88 10/28/88 16:17:14
REPORT Battell* PREPARED Controls for EnvironmentalTO Pacific Northuiest Labs. BY Pollution* Inc.
P.O. Box 999 1925 Rosina StreetRichland* Washington 99352 Santa Fe. NM 97502 CERTIFIED BY
ATTEN Craio Timmerman ATTENPHONE (303) 982-9841 CONTACT GAIL
CLIENT BATTELLE SAMPLESCOMPANY Battelle Remainder of sample(s) for routine analuiis mill be disposed
FACILITY Pacific Northiuest Labs. of three weeks from final report date. 8ample<»> for bacteri.analysis onlUf mill be disposed of one dau after final report.This is not applicable if other arrangements have been made.
WORK ID Water QualityTAKEN Note: Detection limits varies because sample volume of amountTRANS Federal Express varies. Detection limits based on 0.2 uq/g or 0. 2 uo/1.TYPE Liouid
P. O. * U3&78 Contract B-U567B-C-U Duplicate of report of 10/27/88.INV. # 430391
SAMPLE IDENTIFICATION CEPi Inc. TEST CODES and NAMES used on this reportOJ. B8T-NBH-1-MM3-3 Imp. Sol. A? Silver62 B5T-NBH-1-MM5-4 43 Arsenic03 B5T-NBH-1-MM3-3 PA Parium04 B8T-NBH-1-MM3-6 CD Cadmium
B3T-NBH-l-MMg-7 PU ChlorideBST-NBH-l-L-1 Lid Wipe CR Chromium
F I FluorideHO \L MercuruNQ3 1 Nitrate. Nitroaen (as N)PR \L LeadPCB 1 Poluchlorina^ed BiphenulsSE 1 Selenium
Our i npm-f; nrR rR™te-ei1 upon the conditmo that they are not to be reproduced wholly or 10 part for advertisinq and/or other nnrno-;ps over our s.nnar.urR m- in rnnnprhnn with nur ns

Controls for Environmental Pollution, Inc. '. j -,!,,:- 505, JH _' MM
• ' < I -j 1 ' I -1 )' ', 1 I • IN ] i ' , I V • r l 7 TO ' OUT OP STATE BOO / 545-S 1 SB
PAGE 2
SAMPLE IDENTIFICATION DATE CQLLECTE1BST-NBH-1-MM3-3 Imp. Sol. not specified
BST-NBH-1-MM3-4 not specified
BST-NBH-1-MM9-9 not specified
BST-NBH-1-MM9-& not specified
BST-NBH-1-MM9-7 not specified
BBT-NBH-l-L-1 Lid Wipe not specified
REPORT OF ANALYSIS
TYPE OF ANALYSISSilverArsenicBariumCadmiumChlorideChromiumFluorideMercuryNitrogen, Nitratt (as N>LeadPoll/chlorinated BiphenylsSelenium
SilverArsenicBariumCadmiumChlorideChromiumFluorideMercuryNitrogen. Nitrate (as N)LeadPolychlor inated BiphenylsSelenium
Polychlorinated Biphenyls
Polychlorinated Biphenyls
Polychlorinated Biphenyls
Polychlorinated Biphenyls
mo/liter<0. 01<O. 01<O.1<0. 0019.0<0. 01<0. 090. 00060.1<0. 01<2. 0<0. 01
<0. Ol<0. 01<0.1<0. 0012. 6<0. Ol<0. 05<0. 0004<O.1<0. 01«. 0<0. 01
<2. O
<2. 5
<2. 9
<O. S
LAB ft BB-lO-173
(ug/liter)
(ug/liter)
(ug/liter)
(ug/liter)
(ug/liter)
(ug/gram)
CO
1 1 1 1in thl tinn t'i r-rt mbt f 1 , 1 1 ' ' f

I I I, Inet. . • • - SLDo -J f J J h i l l
=' * ' '• ''- ' ' '• fxi -•' • ' •' • ! '~"');2 ' OUT •STATE aOO/5-45-ai BS
PAGE 1 CEP, Inc. REPORT LAB • 88-10-172 RECEIVED: 10/10/88 10/28/88 16:32:40
REPORT Battelle PREPARED Controls for EnvironmentalTO Pacific Northwest Labs. BY Pollution. Inc.
P. 0. Bo» 999 1929 Rosina StreetRichland. Washington 99382 Santa F». NM B7502 CERTIFIED BY
ATTEN Jerome Sic inner ATTENPHONE (5OS) 982-9841 CONTACT GAIL
CLIENT BATTELLE SAMPLES _£COMPANY Battelle Remainder of satnple(s) for routine analusis uiill be disposed
FACILITY Pacific Northuiest Labs. of three ueeks from final report date. Sampled? for bacteriaanalusis onlu» mill be disposed of one dau after final report.This is not applicable if other arrangements have been made.
WORK ID Hater QualituTAKENTRANS Federal ExpressTYPE Particulate Filter
P. O. # U367B Contract B-U367B-C-UINVOICE under separate cover
SAMPLE IDENTIFICATION CEPi Inc. TEST CODES and NAMES used on this reportB3T-NBH-1-MM5-1 AQ A Silver
Q2 B3T-NBH-1-MM5-2 AS A ArsenicBA A BariumCD A CadmiumCR A ChromiumF A FluorideHQ A MercuruN03 A Nitrate. Nitrogen <as N)PB A LeadpCB 3 Poluchlorinated BiphenulsSE A Selenium
CO * to
i rs HT P inirirTprliinnn rhp rnnriitmn that rhpv ,irp not to hp rpnrnrturprl wholh/nnonart fnraHi.prri<-,nn

iControls for Environmental Pollution, Inc. ^ 5' J ~> J i i >c > i ] ' > i i i i , i i * i J ' 5'_> ' OUT OF STATE BOO/545-S1BB
PAGE 2 REPORT OF ANALYSIS
SAMPLE IDENTIFICATION DATE COLLECTED TYPE OF ANALYSIS BST-NBH-1-MM9-1 not specified Silver
Arsenic <2. O <a. o
Barium Cadmium
<ao. o 12. B
Chromium <2. O Fluoride O. 23 Mercury Nitrogen, Nitrate (as N) Lead
<O. 08 O. 13
640 PCB's <0. 4 Selenium <2. O
BST-NBH-1-MM3-2 not specified Silver Arsenic
<2. O <2. O
Barium <20. 0 Cadmium <0. 2 Chromium <2. O Fluoride 0.33 Mercury Nitrogen. Nitrate (as N) Lead
<0. OS 0.81 9.8
PCB's <0. 6 Selenium <2. 0
LAB ft 88-10-172
CO
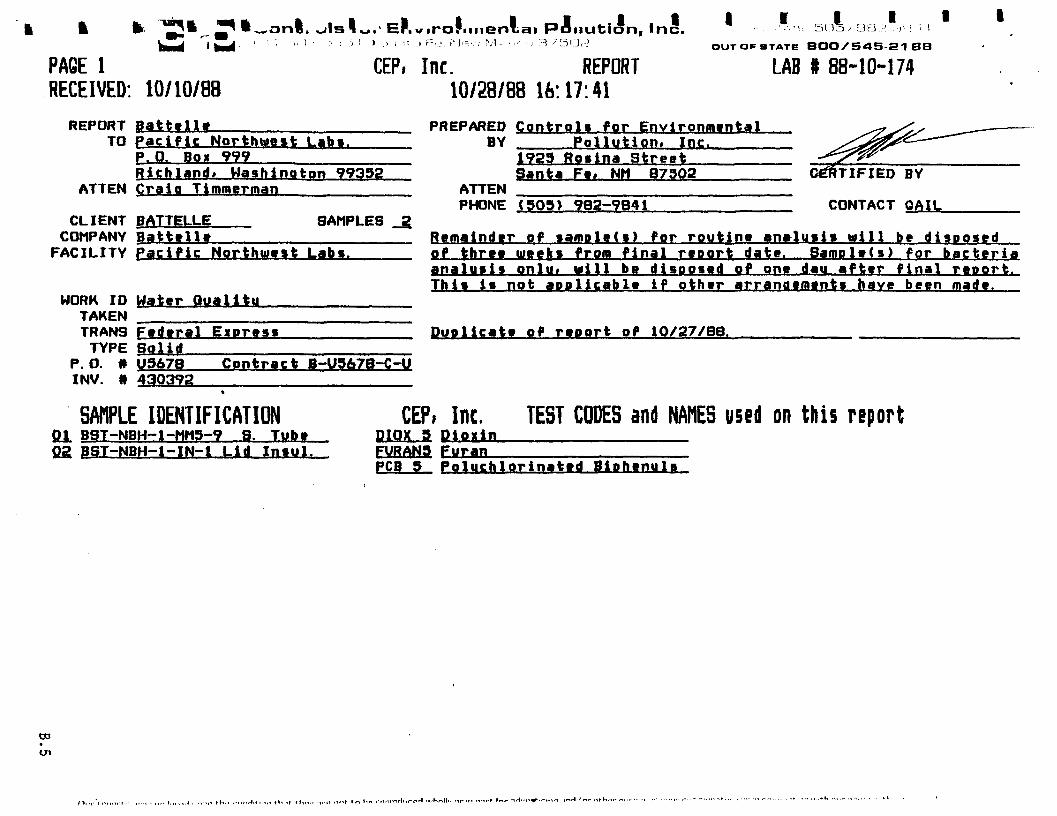
— <on v*.- EP. irironnen.cii Poiiuti on, Inc. P^2*^. * it I r~. .. l % J r ; > , M - ..... I '3 / <_5 I J< _> OUT OF STATE BOO / 545-S 1 SB j^J '"j ^
PAGE I CEP, Inc. REPORT LAB I 88-10-174RECEIVED: 10710/88 10/28/88 16:17:41
REPORT Battelle PREPARED Controls for Environment*! TO pacific Northwest Lab«. BY Pollution, Inc.
P. 0. Box 999 1953 Roiina Street Richland> Uashinoton 99355 Santa Ft. NM B7502 CERTIFIED BY
ATTEN Craig Timmerman ATTEN PHONE (3O3) 9B2-9B41 CONTACT GAIL
CLIENT BATTELLE SAMPLES _2 COMPANY Battelltr Remainder of sampled) for routine analysis mill be disposed
FACILITY Pacific Northui«»t Labs. of three weeks from final reporfr date. Sample(s) for bacteriaanalusis onlu» mill be disposed of one dau after final report.This is not applicable if other arrangements have been made.
WORK ID Water QualityTAKENTRANS F»d»ral E«pres« Duplicate of report of 10/27/BS.TYPE Solid
P. O. ft U9678 Contract B-U5A7B-C-UINV. ft 430392
SAMPLE IDENTIFICATION CEPi Inc. TEST CODES and NAMES used on this report01 B3T-NBH-1-MM5-9 8. Tube DIOX 5 Dioiinfi2 B5T-NBH-1-IN-1 Lid Insul. FURAN3 Furan
PCB 5 Poluchlorinated Biohenuls
C30
cn

Controls for Environmental Pollution, Inc. •5( ) ) K - t ' i i
OUT OF STATE BOO/F45-21 BB
PAGE 2 REPORT OF ANALYSIS LAB # MO-174
SAMPLE IDENTIFICATION BST-NBH-1-MM5-9 S. Tub*
DATE COLLECTEDnot specified
TYPE OF ANALYSIS Dioxin
uq/samole <1. 0
Furan <1. 0 PCB'» CO. 2
BST-NBH-l-IN-1 Lid Insol. not specified PCB's CO. 04 <ug/gram)
DO
er>
inpixs pniltf V are I he reil jd whl 1 P3I tW, „ Jerfl*>l" » • ,/OP Otf.r mn nnr P* t r HUP qi* ir» MI »» fir 111* HIIMMI ftnn Wirn nnr inmr. \*n, , MI t- i it « t « - . - " -« »
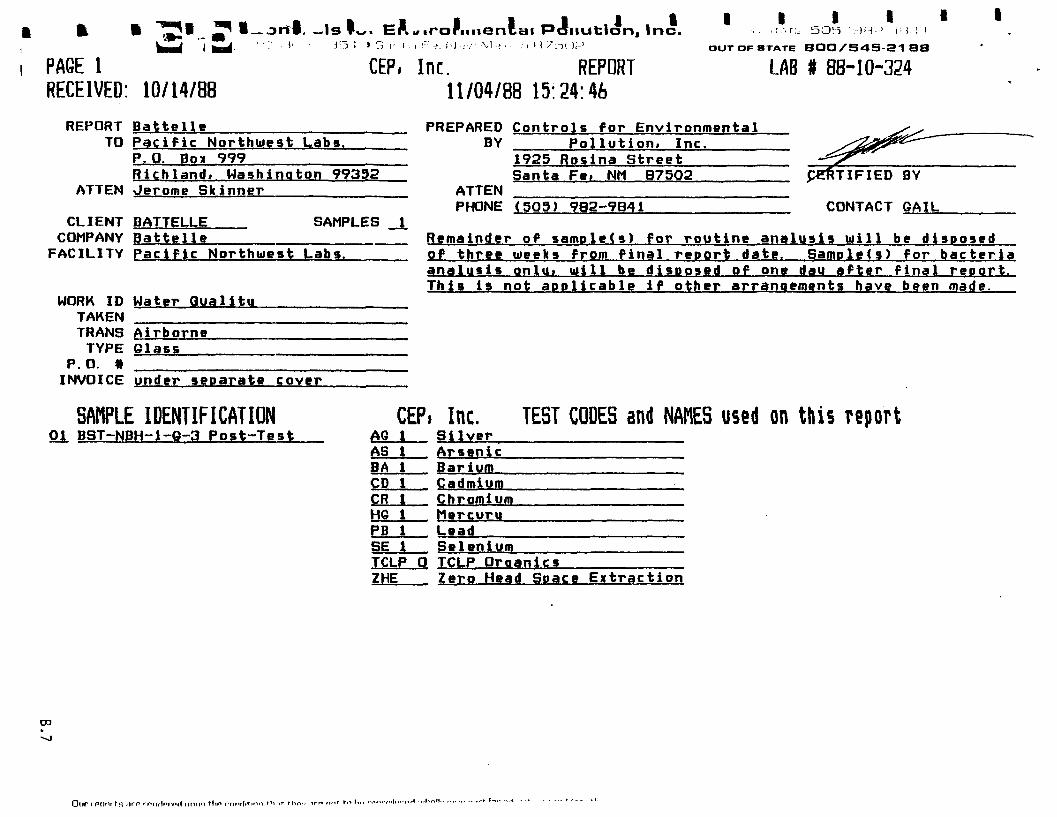
M • A ft ft
— Is I—. Er\»irorifiienCai Pollution, Inc. - • so;5 IH : i • 1' ' ' J-3 1 » 3 i- r . , f -:. f - j j .-.. M > . . , , H /3GL:? OUT OF STATE BOO/5<»S-ai BB
PAGE I CEP, Inc. REPORT LAB I 88-10-324 RECEIVED: 10/14/B8 11/04/88 15:24:46
REPORT Battelle PREPARED Controls for EnvironmentalTO Pacific Northuiest Labs. BY Pollution. Inc.
P. 0. Box 999 1955 Rosina StreetR ichland, Washington 99352 Santa Fe. NM B75Q2 CERTIFIED BY
ATTEN Jerome Skinner ATTENPHONE (5Q9) 985-9841 CONTACT GAIL
CLIENT BATTELLE SAMPLESCOMPANY Battelle Remainder of samole<s) for routine analysis uiill be disposed
FACILITY Pacific Northuiest Labs. of three uieefcs from final report date. Sample(s) for bacteriaanalusis onlu> uill be disposed of one dau after final report.This is not a p p l i c a b l e if other arrangements have been made.
WORK ID Water QualituTAKENTRANS AirborneTYPE Glass
P. O. *INVOICE under separate cover
SAMPLE IDENTIFICATION CEPi Inc. TEST CODES and NAMES used on this reportQi BST-NBH-l-Q-3 Post-Test AG Silver
AS ArsenicBA BariumCD CadmiumCR ChromiumHO MercuruPD LeadSE 1I SeleniumTCLf» 0 TCLP OraanicsZHE Zero Head Space Extraction
CD
Our i Pimr r s ;irp i rnilprpi! ilnn'i thn i
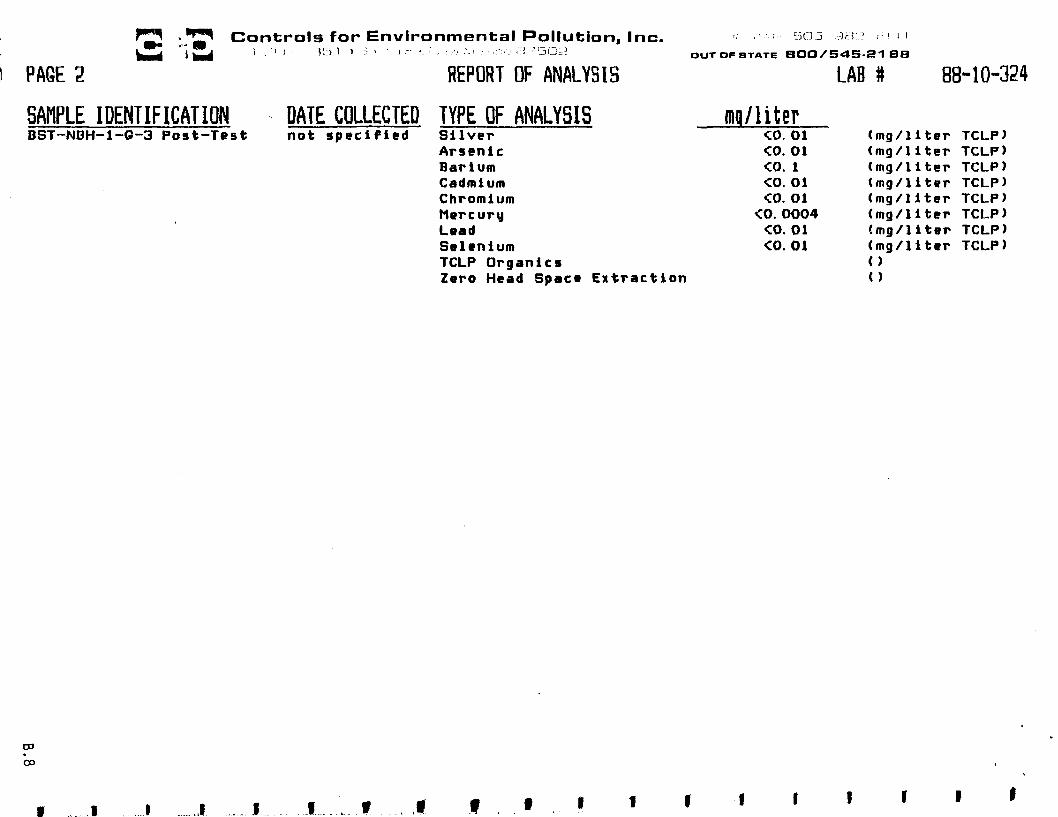
Controls for Environmental Pollution, Inc. i . coUj 1H ' j t 1 I
i ' I )' 3 I > > I ; ' i ''5C=J OUT OF STATE BOO/545-21 SB
PAGE 2 REPORT OF ANALYSIS
SAMPLE IDENTIFICATION DATE COLLECTED TYPE OF ANALYSIS BST-NBH-l-G-3 Post-Test not specified Silver
Arsenic Barium Cadmium Chromium Mercury Lead Selenium TCLP Organics Zero Head Space Extraction
mq/liter<0. Ol<0. 01<0. 1<O. Ol<0. 01
<O. 0004<O. Ol<0. 01
LAB ft 88-10-324
(mg/liter TCLP)(mg/liter TCLP)(mg/liter TCLP)(mg/liter TCLP)(mg/liter TCLP)(mg/liter TCLP)(mg/liter TCLP)(mg/liter TCLP)
DO•
oo

i i i t«. • M ft i 1 1 I I * * * • jjjj ^ g^ V.ancT'o<s for Environmental Pollution, Inc. • . • . - . - - 5G5/'£J.rjy UH I I
OUT OF STATE BOO/545-21
PAGE 3 CEP, Inc. REPORT LAB t 88-10-324 RECEIVED: 10/14/88 Results by Sample
SAMPLE ID BST-NBH-l-C-3 Post-Test FRACTION Q1B TEST CODE TCLP 0 NAME TCLP QrqanicsDate & Time Collected not specified Category SOLID
CAS # Compound name Regulatory Result Limit (mg/L)
111-44-4 Bis<2-chloroethyl)ether O. 05 <5.7 75-48-7 o-Cresol 1O. O 1O8-39-4 m-Cresol 10.0 106-44-5 p-Cresol 10.0 87-86-5 Pentachlorophenol 3.6 1O8-95-2 Phenol 14.4 <14. 4 58-9O-2 2. 3i 4i 6-Tttrach1orophenol 1. 5 <10. 0 95-95-4 2.4,5-Trichlorophenol 5.8 <10. 0 88-06-2 2f4,6-Trichlorophenol O. 30 <2.7 121-14-2 2.4-Dinitrotolu»n» O. 13 <5.7 118-74-1 Hexachlorobemtna O. 13 <i. 9 87-66-3 Hexachlorobutadiene O. 72 • <0. 9 67-72-1 Hexachloro»than» 4.3 <1. 6 98-95-3 Nitrobenzen* O. 13 <i. 9 57-74-9 Chlordan* O. 03 <0. 28 72-2O-8 Endrin O. 003 <0. 12 76-44-8 Heptachlor O. 001 <0. 06 58-89-9 Lindan* 0. 06 <0. O8 72-43-5 Methoxychlor 1. 4 <2.0 8OO1-35-2 Toxaphene O. 07 94-75-7 2,4-D 1. 4 <1. 0 93-76-5 Si 1vex O. 14 <0. 1 95-5O-1 1»2-Dichlorobeniene 4. 3 1O6-46-7 1.4-Dichlorobeniene 1O. 8 <4.4
NOTES AND DEFINITIONS FOR THIS REPORT
All results reported in mq/liter unless otherwise specified.•
VO
Our rppnrf s ni
03

Controls for Environmental Pollution, Inc. ir i .!..i 5O'5 '-JHJ J. i I I ' ; , ! ", i i i i , . i i- • <•[ -v '/. - i ', 7C5',1 -'
OUT OF STATE SOO/S<45-S1 SS
PAGE 4 CEP, Inc. REPORT LAB t 88-10-324RECEIVED: 10/14/88 Results by SampleSAMPLE ID BST-NBH-l-G-3 Post-Test FRACTION 01B TEST CODE ZHE NAME Zero Head Space Extraction_
Date & Time Collected not specified Category SOLID
CAS # Compound name Regulatory Result Limit (mg/L)
1O7-13-1 Acrylonitrile 5. 0 JSULfi 71-43-2 Benzene 0.07 <^. 4 73J-50-4 Carbon disulfide 14. 4 <5. 0 56-23-5 Carbon tetrachloride 0. O7 <2. B 1OB-90-7 Chlorobenzene 1. 4 67-66-3 Chloroform 0. O7 107-06-2 1,2-Dichlorethane 0. 40 75-35-4 1.1-Dichloroethylene 0. 10 B 78-83-1 Isobutanol 36. 0 <10. 0 75-09-2 Methylenechloride 8. 6 <2. B 78-73-3 Methylethyl ketone 7. 2 <6. 0 110-86-1 Pyridine 5. 0 <15. 0 63O-20-6 If If I f 2-Tetrachloroethane 1O. 0 <6. 0 79-34-5 1«1>2f2-Tetrachloroethane 1. 3 <6. 9 127-18-4 Tetrachloroethylene 0. 10 1O8-88-3 Toluene 14. 4 <6. 0 71-55-6 1.1*1-Trichloroethane 30. 0 <3.B 79-00-5 I f If2-Trichloroethane 1. 2 <5. 0 79-01-6 Trichloroethylene 0. 07 75-01-4 Vinyl chloride 0. 05 <10. 0
NOTES AND DEFINITIONS FOR THIS REPORT
All results reported in uo/liter unless otherwise specified.
.„!
APPENDIX C
SOIL AND GLASS ANALYTICAL RESULTS PROVIDED BY E. C. JORDAN CO.

TRANSMITTAL KEMORAKDUM
4959-21
DATE: October 31, 19SB
TO: Mary Ann Reimus, Battelle-NW, FAX 509-376-1867
FROM: Douglas C. Allan, E.G. Jordan
SUBJECTS USEPA-CLP Results for Battelle-NW Vitrification Bench-Test Program
Attached with this memo are the results of the USEPA contractlaboratory program (CLP) analyses for PCBs in vitrified NewBedford Harbor sediment.
I was informed by my CLP tracking people that the labresponsible for the metals analysis has been having equipmentproblems. Therefore, the results of these analyses will bedelayed. We are currently attempting to get a commitment fromthat lab for completion of the analyses.
If you,have any questions regarding these results, please, do nothesitate to contact me.
C.I

NBH20-PA Page 1 31-oct-aa
APPENDIX TABLE PROJECT: New Bedford Harbor
SAMPLE LOCATION: NBH-1-G-Z NBH-1-S-4 NBH-1-S-6 WH-1-S-8 NBH-1-S-7 NBH-1-S-10SNO NUMBER: 4163A-07 4163A-06 4163A-05 4163A-04 4163A-03 4163-02 4163A-01
MATRIX: SOU SOIL SOIL SOU SOIL SOIL SOIL
CROLPESTICIDES/PCS
A>oclor-10t6 80 33 O 33 0 3« U 33 U 34 U 33 U 33 UAroclor-1221 00 35 U 33 U 34 U 33 U 34 U 33 U 33 UAroclor-1232 BO 33 U 33 U 120 X 33 U 250 X 33 U 150 XAroclor-1242 BO 330 33 U 34 U 33 U 34 U 33 U 33 UAroctor-1248 80 33 U 33 U 34 U 33 U 34 U 33 U 33 UAroctor-1254 160 67 O 67 U 67 U 67 U 67 U 67 U 67 UAroclor-1260 160 6711 67 U 67 U 67 U 67 U 67 U 67 U
Percent Solid 100 100 100 100 100 100 100Dilution Factor 1 1 1 1 1 1 1
O X « Positive Identification of Arochlor pattern cculd not be wide. Presence Is suspecte^.ro
f i *

"BUM-PS fag* 1 3i'Oct-M
SUMMARY TABLE PROJECT: Mew Bedford HarborX
SAMPLE LOCATION: HBH-1-G-2 NBH-1-5-4 NBH-1-5-11 NBH-1-S-6 NBH-1-S-8 HBH-1-S-7 UBH-1-S-10SMO NUMBER: 4163A-07 4163A-06 A163A-05 4163A-04 4163A-03 4163-02 4163A-01
MATRIX: SOIL SOU SOIL SOIL SOIL SOIL SOIL*»
CRDL PESTICIOES/PCB ug/kg
Aroclor-1Z3Z 80 - 120 X - Z50 X - ISO X
Percent Solid 100 100 100 100 100 100 100 Dilution Factor 1 1 1 1 1 1 1
X « Positive identification of Arochlor pattern could not be Made. Presence it tuspected.
o CO

TRANSMITTAL MEMORANDUM
4959-21
DATS: November 14, 1988
TO: Mary Ann Reimus, Battelle-NW, FAX 509-376-1867
FROM: Douglas Allen, E.G. Jordan
SUBJECT: USEPA-CLP Results for Battelle-NW vitrification Bench-Test Program
Attached with this memo are the results of the USEPA contractlaboratory program (CLP) analyses for metals in vitrified NewBedford Harbor sediment.
If you have any questions regarding these results, pleasecontact Steve Turner at B.C. Jordan (207-774-5401 X726).
C.4
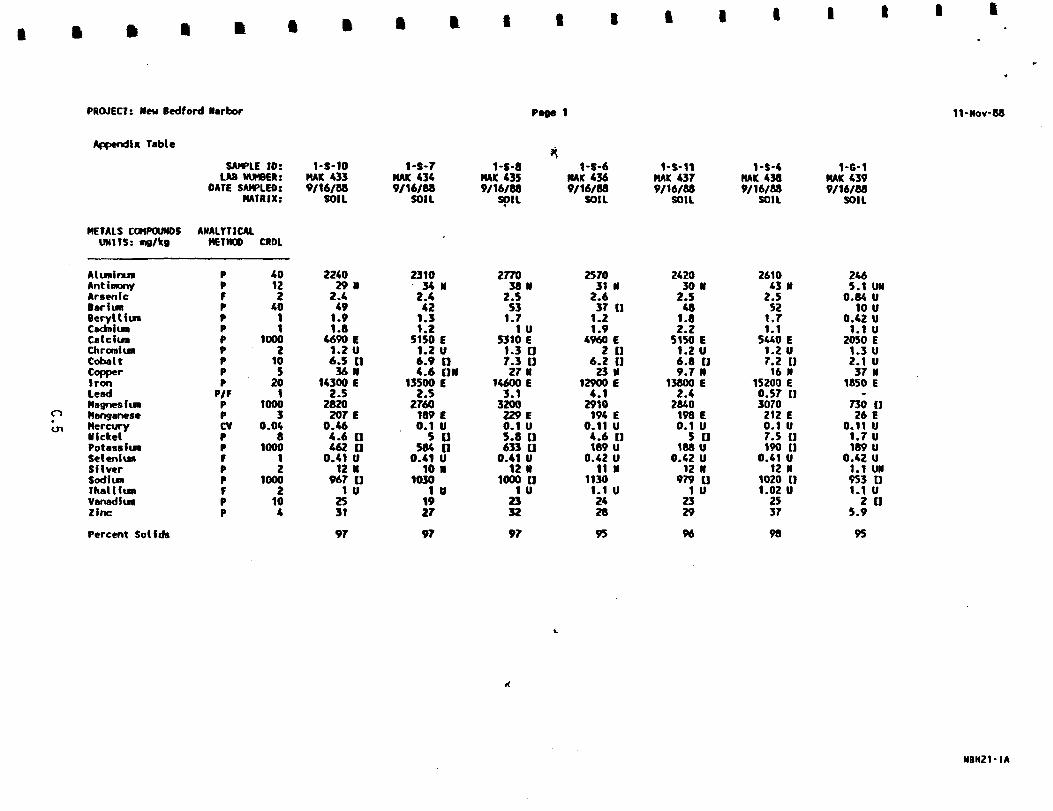
PROJECT: New Bedford Harbor Page 1 ll-Nov-88
Appendix Table
SAMPLE 10: 1-S-10 1-S-7 1-S-8 1-S-6 1-S-11 1-S-4 1-G-1 LAB NUMBER: MAK 433 MAK 434 MAK 435 MAK 436 MAK 437 NAK 438 MAK 439
DATE SAMPLED: MATRIX:
9/16/88 SOIL
9/16/88 SOIL
9/16/88 SOIL
9/16/88 SOIL
9/16/88 SOIL
9/16/88 SOIL
9/16/88 SOIL
METALS COMPOUNDS ANALYTICAL UNITS: mg/kg METHOD CRDl
Aluminum 40 2240 2310 2770 2570 2420 2610 246 Antimony Arsenic
12 2
29 N 2.4
34 N 2.4
38 N 2.5
31 N 2.6
30 N 2.5
43 N 2.5
5.1 UN 0.84 U
Barium Beryl Hum Cadnium
40Ii
49 1.9 1.8
42 1.3 1.2
53 1.7 1 U
37 U 1.2 1.9
48 1.8 2.2
52 1.7 1.1
10 U 0.42 U 1.1 U
Calcium Chromium Cobalt Copper Iron
1000 2 105 20
4«90 E 1.2 U 6.5 tl 36 N
14300 E
5150 E 1.2 U 6.9 II 4.6 ON
13500 E
5310 E 1.3 O 7.3 O 27 N
14600 E
4960 E 2 []
6.2 U 23 N
12900 E
5150 E 1.2 U 6.8 [J 9.7 N
13800 E
5440 E 1.2 U 7.2 H 16 N
E15200
2050 E 1.3 U 2.1 U 37 N
1850 E
O
leadMagnesium Manganese Mercury Nickel Potassium Selenium
P F
•V
1 10003
0.04 8
10001
2.5 2820 207E 0.46 4.6 tl 462 11 0.41 U
2.5 2760 189 E 0.1 U 5 U
584 [1 0.41 U
3.1 3200 229E 0.1 U 5.8 [] 633 U 0.41 U
4.1 2910 194 E 0.11 U 4.6 II 189 U 0.42 U
2.4 2840 198 E 0.1 U 5 U
188 U 0.42 U
I)
E U
0.57 3070 212 0.1 7.5 O 190 tl
0.41 U
730 O 26 E
0.11 U 1.7 U 189 U 0.42 U
Silver 2 12 N 10 N 12 N 11 N 12 N 12 N 1.1 UN Sodium 1000 967U 1030 1000 U 1130 979 U 1020 II 953 tl Thallium 2 1 U 1 U 1 U 1.1 U 1 U 1.02 U 1.1 U Vanadium Zinc
10 4
25 31
19 27
23 32
24 28
23 29
25 37
2 tl 5.9
Percent Solids 97 97 97 95 96 98 95
NBH21-IA

PROJECT: Hew Bedford Harbor Peg* 1 U-Nov-88
Validation Table
SAMPLE ID: 1-5-10 1-S-7 1-8-8 1-S-6 1-S-11 1-S-4 1-0-1 LAB NUMBER: MAK 433 MAK 434 MAK 435 MAK 436 MAK 437 MAK 438 MAK 439
DATE SAMPLED: MATRIX:
9/16/88 SOIL
9/16/88 SOU
9/16/88 SOU
9/16/88 SOU
9/16/88 SOIL
9/16/88 SOIL
9/16/88 SOIL
METALS COMPOUNDS ANALYTICAL UNITS: ing/kg METHOD CRDL
Aluninu* 40 2240 2310 2770 2570 2420 2610 246 Antimony Arsenic
12 2
29 2.4
34 J 2.4
38 J 2.5
31 J 2.6
30 J 2.5
43 4 2.5
5.1 UJ 0.84 U
6ar in* Beryllium Cadmium
40 ] t
49 1.9 1.8
42 1.3 1.2
53 1.7 1 U
37 0 1.2 1.9
48 1.8 2.2
52 1.7 1.1
1U U 0.42 U 1.1 U
Calcium Chromiun
1000 2
4690 1.2
5150 J 1.2U
5310 J 1.3 tl
4960 J2 n 5150 J
1.2 U 5440 J 1.2 U
2050 J 1.3 U
Cobalt Copper Iron
105 20
6.5 36
14300
6.9U 4.6 UJ
13500 J
7.3 I) 27 J
14600 J
6.2 U 23 J
12900 J
6.8 f) 9.7 J
13800 J
7.2 O 16
15200 J
2.1 U 37 J
1850 J
o01
leadMagnesium Manganese
Mercury Nickel
Potassium Selenium Silver Sodium Thallium
f f
CV
1 1000 3
0.04 8
10001 2
1000 2
2.5 2820 20? 0.46 4.6 462 0.41 12 967
1
2.S 2760 189 J 0.1U5 n
584 11 0.41 U 10 J
1030 1 U
3.1 3200 229 J 0.1 U 5.8 11 633 tl 0.41 U 12 J
1000 (1 1 U
4.1 2910 194 J
0.11 U 4.6 I) 189U 0.42 U 11 J
1130 1.1 U
2.4 2840 198 J 0.1 U 5 U
188 U 0.42 U
12 J 977 II
1 U
0.57 [1 3070 212 J 0.1 U 7.5 0 190 (1
0.41 U 12 J
1020 a 1.02 U
0.58 730 26
0.11 U 1.7 U 189 U
0.42 U 1.1 UR 953 O 1.1 U
(1 (1 J
Vanadium 10 25 19 J 23 J 24 J 23 J 25 4 2 IJJ Zinc 4 31 27 32 28 29 37 5.9
Percent Solids 97 97 97 95 96 98 95
NBHZMV
f i * « I
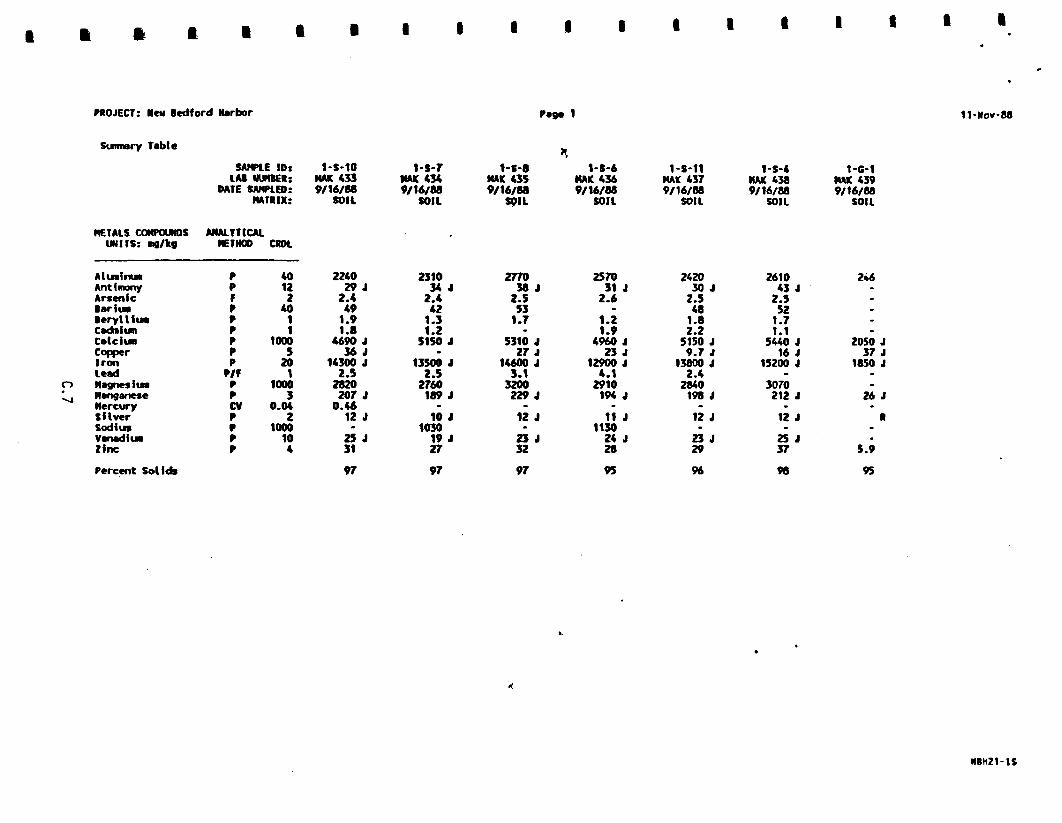
PROJECT: Men Bedford Harbor Page 1 11-Nov-M
Suitnary Table
SAMPLE ID: 1-S-10 i-s-r l-f-8 1-S-6 1-S-11 1-S-4 1-G-1 LAI NUMBER: NAK 433 HAIC 434 MAK 435 MAK 436 NAK 437 NAK 438 NAK 439
DATE SAMPLED: MATRIX:
9/16/88 SOU
9/16/88 SOIL
9/16/88 SOIL
9/16/88 SOIL
9/16/88 SOIL
9/16/88 SOIL
9/16/88 SOIL
METALS CONPOUNOS AHAL1 fTICAL UNITS: ng/kg ME1 MOD CRDL
Alininuii 40 2240 2310 2770 2570 2420 2610 Antimony Arsenic
12 2
29 J 2.4
34 J 2.4
38 J 2.5
31 J 2.6
30 J 2.5
43 J 2.5
•ariu* •erylltiM Cadhiiun
40 1 f
49 1.9 1.8
42 1.3 1.2
53 1.7 1.2
1.9
48 1.8 2.2
52 1.7 1.1
Calciua Copper Iron
1000 5 20
4690 J 36 J
14300 J
5150 J
13500 J
5310 J 27 J
14600 J
4960 J 23 J
12900 J
5150 J 9.7 J
13800 t
5440 J 16 J
15200 J
20SO J 37 J
1850 J l«ad P f 1 2.5 2.5 3.1 4.1 2.4
O Magnesiim Manganese Mercury Silver
EV
1000 J
0.04 2
2820 207 J 0.46
12 J
2760 189 J
10 J
3200 229 J
12 J
2910 194 J
11 J
2840 198 »
12 J
3070 212 J
12 J
26 J *
• Sodiui 1000 1030 1130 VanaditM 10 25 J 19 i 23 J 24 J 23 J 25 J Zinc 4 31 27 32 28 29 37 5.9
Percent Solids 97 97 97 95 96 98 95
NBH21-IS

APPENDIX D
PRELIMINARY ISV COST ESTIMATE PREPARED BY GEOSAFE CORPORATION

>FEB 02 '89 10:35 GEOSAFE CORP627-6608 P.3
GEOSAFE CORPORATIONPRELIMINARY I8V COST ESTIMATE
1. DEFINITIONS
Date; January 31, 1989
y-ifcg Mama* New Bedford Harbor Superfund Site
site Location; New Bedford, Massachusetts
2. ASSUMPTIONS t
Contaminants/Concentrations: PCBs - < 20,000 pptn (total)Other organics - < 200 ppmHeavy metals - < 100 ppm
Insignificant
Required Cleanup Levelst PCBs - 99.9999% DRE
Soil Type/Composition: Sediment (no chemicalcomposition provided)
Energy/Mass Ratio: Approximately 1.0 kwh/kg
soil Moisture Content; Sediment provided with partialdewatering complete. [50% (volume)water and 50% solids; 38% (weight)water and 62% solids]. Furtherdewatering does not occur in stagedtrench.
Soil Permeabilitv: Not pertinent? to be staged abovewater table
Depth to Groundwnter: Not pertinent; to be staged abovewater table
Recharge Rate: Not pertinent; to be staged abovewater table
to be Treated; Case 1 - 10,000 yd3 as dewateredCase 2 - 50,000 yd, as dewateredCase 3 - 500,000 yd3 as dewatered
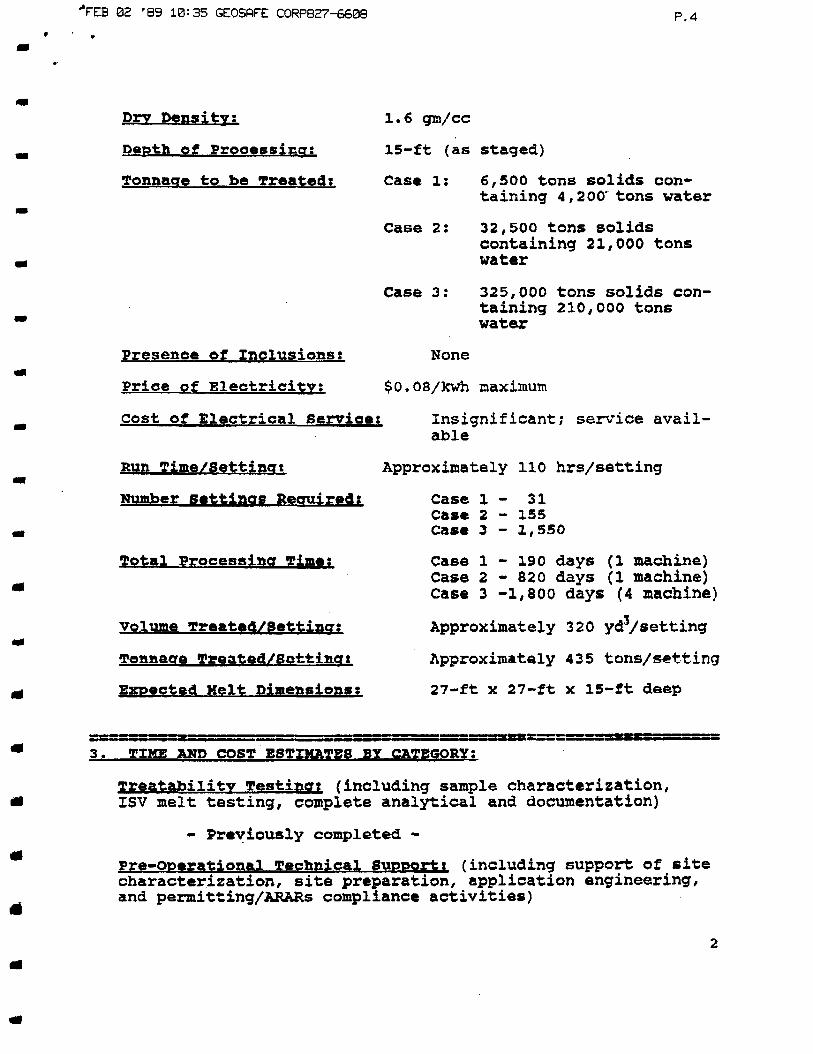
02 '89 10:35 GEOSPFE CORPB27-6608 P.4
Dry 1.6 grn/cc
Depth of Processing i 15-ft (as staged)
Tonnage to be Treated; Case 1: 6,500 tons solids containing 4,200'tons water
Case 2: 32,500 tons solidscontaining 21,000 tonswater
Case 3: 325,000 tons solids containing 210,000 tonswater
Presence of Inclusions; None
Price of Electricity: $0.08/kwh maximum
cost of Electrical Servie< L Insignificant; service available
Run Time/Setting: Approximately 110 hrs/setting
er Settings Reguire-d; Case 1 - 3 1Case 2 - 155Case 3 - 1,550
Total Processing Time; Case 1-190 days (1 machine)Case 2-820 days (1 machine)Case 3 -1,800 days (4 machine)
volume Treated/ Sett ing; Approximately 320 yd3/setting
Tonnaae Treated/Setting! Approximately 435 tons/setting
Expected Kelt Dimensions; 27-ft x 27-ft x 15-ft deep
3. TIME AKD COST ESTIMATES BY CATEGORY;
Treatability Testing; (including sample characterization,ISV melt testing, complete analytical and documentation)
- Previously completed -
Pre-Qperational Technical Support; (including support of sitecharacterization, site preparation, application engineering,and permitting/ARARs compliance activities)

02 '89 10:36 GEOSAFE CORP827-6608 P.5
Support provided on hourly rate basis (typical $65/hr) forspecific technical support requested* Note that Geosafe isin process of applying for national TSCA permit for PCBsand has much documentation applicable to ARARs complianceneeds.
Mobilization/Demobilization? (including transport of equipment, onsite erection, readiness testing, post-project decontamination, disassembly, and transport to base location)
Cases l and 2: $211,000 (possibility of $70-80,000 creditif equipment is next mobilized to another EPA sitewithout >30-day delay). Mobilization time is <l-week;demobilization time is < 10 days.
Case 3: $844,000 (4-machines required to meet project's5-yr completion deadline); same mobilisation anddemobilization times estimates as for cases 1 and 2.Possible demobilization credit of $70-80,000 permachine that is mobilized to another EPA site within30-days.
Vitrification operations: (including all direct costs ofopcurationc . . . burrSrmrtrt 1 »V»n-r. waferi ft!«. P! f»rt*ri r POWP.T. nffgas treatment, movement between settings, equipment amortization and maintenance)
case 1: $33O/ton
Case 2: $310/ton
Case 3: $290/ton
Post-Operational Technical Support: (including support of siterestoration, post-project sampling/monitoring, and delistingactivities)
Support provided on hourly rate basis (typical $65/hr) forspecific technical support requested.
4. COSTS HOT INCLUDED!
Site characterization, site preparation, permitting/regulatory compliance, excavation and staging of materials forprocessing (if any), site restoration, delisting, secondarywaste disposal, any other non-ISV related costs.

p.6 ""FEE 02 '89 10=36 GEOSSFE coRP827-6608
5. COST
Moisture content; Each 10% (by weight) reduction inmoisture may reduce cost by $12-16/ton
Price of Electricity;. Each $0.02/Jcwh reduction in price ofpower may reduce cost by $27-32/ton(note: such reduction is consideredpossible to obtain)
Depth of Processing; Each 5-ft additional staging depth mayreduce cost by $16-l9/ton
Other; Possible credit of approximately $5,000/setting ifelectrode casing placement work can be included instaging contract.