Embed Size (px)
Citation preview

I F A S S O I L & W A T E R S C I E N C E Issue No: 7 April, 2008
UF/IFAS NUTRIENT MANAGEMENT EDUCATION CORE GROUP
Editors:
Rao Mylavarapu Susan Curry
E-MAIL:
[email protected] [email protected]
Inside This Issue:
Lakewatch Program . . . . . . . . . . . . . . . . . . . . . . . . . . . . . . . . . . . . . . 3 Statewide Best management Practice (BMP) Leadership Team . . . . . 4 Evaluation of irrigation BMP in South Florida . . . . . . . . . . . . . . . . . .6 Peanut Water Use and Irrigation in the Suwannee Basin . . . . . . . . . . 8 Evaluating Methods to Mitigate Soil Compaction
in Urban Landscapes . . . . . . . . . . . . . . . . . . . . . . . . . . . . . . . . . . . . . 11
What’s New in UF-IFAS Citrus Nutrition Recommendations? . . . . .12
Dr. Rao Mylavarapu, Soil and Water Science Department, 2169 McCarty Hall, Box 110290, University of Florida, Gainesville, Florida 32611, Phone: 352-392-1951, Fax: 352-392-3902. Email: [email protected] http://nutrients.ifas.ufl.edu

Nutrient Management Education Core Group Background
Federal, state and regional agencies are working towards formulating regulations for agricultural operations to reduce nonpoint nutrient source pollution for water quality protection. Several of our IFAS faculty are currently involved with these agencies for developing Interim BMPs for various commodities. In all cases these efforts are interdisciplinary requiring frequent interaction among the UF/IFAS faculty statewide. Several of us felt the need for a stronger coordination among IFAS faculty in responding to these needs. The creation and successful functioning of the Nutrient Management Core Group will enhance the credibility of UF/IFAS faculty and educational resources and create a nodal point for liaison with all the agencies and public that are interested in the issue. Several land grant institutions have formed similar core groups or self-directed teams and have developed educational material. We will interact with these institutions to benefit from their expertise and experience. Over 50 faculty met in October 1999 and after long discussions formed the IFAS Nutrient Management Core Group, coordinated by Rao Mylavarapu, Soil and Water Science. In February of 2001, this group coordinated the FDEP319 Prioritization meeting in Gainesville. This meeting was attended by state agencies and water management districts, growers, many commodity organizations and IFAS faculty and administration. All comments from this meeting were compiled in an electronic newsletter and distributed to all participants throughout the state. The Core Group has been publishing newsletters regularly showcasing successful nutrient management programs in IFAS.

Page 3 Issue No: 7
Florida Lakewatch Program
Peter G. Kalogridis, CPAg
Florida has over 7700 lakes larger than 10 acres and approximately 100,000 water bodies of any size. However detailed scientific information exists for less than 10% of these lakes. Consequently, researchers and government agencies charged with managing these lakes have little data on which to base their management strategies. In response to the need for data collection Dr. Daniel E. Canfield, Jr. in 1986 started using volunteers to collect data on nutrients, primarily nitrogen and phosphorus, in Florida lakes. He called the program Florida LAKEWATCH. In 1991 the Florida Legislature recognized the importance of the program and established Florida LAKEWATCH in the state statues (Florida Statute 1004.49) and for more than 20 years LAKEWATCH has recruited and trained volunteers to facilitate the successful collection of data on hundreds of Florida water bodies. The program is administered through the University of Florida’s Institute of Food Agricultural Sciences at the Department of Fisheries and Aquatic Sciences. LAKEWATCH is now one of the largest lake monitoring programs in the nation with over 1200 trained citizens monitoring over 600 lakes in more than 40 Florida counties. The purpose of this program is to collect water chemistry data from Florida lakes in order to build a long-term water chemistry database for lake management. LAKEWATCH also provides citizens with educational materials to help foster a better understanding of Florida lakes. It also provides a network for people to work directly with lake management professionals allowing parties to learn from each other. The data collected from monthly water sampling is made available to all citizen participants upon their request. However Florida LAKEWATCH maintains a policy of strict neutrality in specific lake management decisions and is bound by statute that while all data collected under program can be accessed by regulatory agencies it cannot
be used under any circumstances in any regulatory proceedings. This restriction on regulatory enforcement action provides a forum for stakeholders in watersheds where the potential for TMDL development can participate in this program to establish BMAP parameters with a reasonable assurance of equitable collaboration from all participants within the watershed prior to BMAP implementation. Florida LAKEWATCH provides periodic reports summarizing the annual data collections sampled by Florida LAKEWATCH citizen volunteers. These report summaries include data for water chemistry, bacteria, mercury, bathymetric mapping, aquatic plant data, electrofishing, trawl summaries and aquatic bird population surveys. Information about the Lakewatch program can be accessed from the Florida LAKEWATCH website at http://lakewatch.ifas.ufl.edu.

Page 4 UF/IFAS Nutrient Management Education Core Group
Statewide Best Management Practice (BMP) Leadership Team
T. Obreza, Soil & Water Science
A Brief History of the UF-IFAS BMP Program Definitions. According to the Florida Department of Agriculture and Consumer Services (FDACS), a BMP is “a practice or combination of practices determined by the coordinating agencies, based on research, field-testing, and expert review, to be the most effective and practicable on-location means, including economic and technological considerations, for improving water quality in agricultural and urban discharges.” An environmental issue related to BMPs is the Total Maximum Daily Load (TMDL), which according to USEPA, “specifies the maximum amount of a pollutant that a water body can receive and still meet water quality standards, and allocates pollutant loadings among point and non-point pollutant sources.” In order to meet the standards set by the federal Clean Water Act, each state must set TMDLs for impaired surface water bodies that will allow for their continued designated use (e.g. drinking, fishing, swimming, etc.). Using BMPs to meet TMDLs. While some states decided to take a regulatory route with agricultural producers to meet TMDLs, in the 1990s Florida decided to go with a voluntary approach. The idea is that TMDLs can be achieved if agricultural and horticultural producers across the state incorporate BMP programs into their operations. This monumental task required a substantial commitment by UF-IFAS to provide the needed research and education components. UF-IFAS gets involved. In 2000, the first comprehensive commodity-related BMP manual was issued: “Water Quality/Quantity BMPs for Indian River Area Citrus Groves.” Faculty at the Indian River Research and Education Center (IRREC) were closely involved as this manual was assembled by a steering committee and technical work groups composed of state agencies, producer and ag industry groups, the environmental community, and UF-IFAS representatives. Dr. Brian Boman of IRREC, who led the IFAS Indian River citrus BMP education effort, subsequently coordinated the compilation of citrus BMP manuals and education
programs for the Gulf and Peace River growing regions. In 2002, Dr. Boman was named statewide leader for UF-IFAS programs covering BMP manual development, education, and implementation. Additional BMP manuals soon followed for commodities such as vegetables, row crops, forages, nurseries, turf and landscape, and cow/calf production. Expansion of Leadership. UF-IFAS BMP education and implementation programs have grown tremendously during the past 5 years. Due to this expansion and broadening of tasks, Dr. Tom Obreza of the Soil and Water Science Dept. and Dr. Eric Simonne of the Horticultural Sciences Dept. joined Dr. Boman in the fall of 2007 to form a statewide BMP leadership team. The guiding principles of this team are: ♦ Improve coordination of IFAS BMP research and
extension programs.
♦ Communicate better with our clientele about IFAS activities.
♦ Improve communication with IFAS administrative leadership about BMP work and program needs.
All of the above will lead to better program efficiency, which will mean more useful work done per dollar spent.
Proposed IFAS BMP Teams
In order to facilitate organization of IFAS BMP research and extension activities, the leadership team proposes formation of the following BMP teams:
♦ Production Agriculture and Horticulture
♦ Nursery, Trees, Greenhouse
♦ Citrus
♦ Vegetables
♦ Agronomic Row Crops
♦ Deciduous and Tropical Fruits
♦ Urban and General
(Continued on page 5)
Page 5 Issue No: 7
♦ Landscape, FYN, all Turf
♦ Soil/Plant/Water/Nutrient Relationships
♦ Socio-Economic
♦ Modeling
♦ Organic/Sustainable Systems
♦ Livestock
♦ Cow/Calf, Forages, Hay
♦ Dairy and Poultry
♦ Equine
♦ Other
♦ Forestry/Silviculture
♦ Everglades Agricultural Area Issues and Lake Okeechobee
IFAS BMP Leadership Team Responsibilities
1.Coordinate and publicize IFAS research and extension programs dealing with BMP development, implementation, and verification.
2.Foster effectiveness of IFAS BMP teams:
♦ Identify BMP program needs from research to extension.
♦ Help coordinate team proposals for BMP work.
♦ Assist FDACS and other agencies in reviewing proposals.
♦ Organize an annual BMP workshop to:
♦ Report new research results.
♦ Determine extension needs.
♦ Recommend future direction.
♦ Facilitate incorporation of new BMP-related knowledge into IFAS recommendations via the Plant Nutrient Oversight Committee.
♦ Meet with the BMP Research and Education Coordinating Committee to assure good program continuity.
♦ Help set priorities for the new IFAS Science Writer.
♦ Periodically report to IFAS Administrative Council and unit leaders.
Our First Workshop When: May 20-21, 2008 Where: Mid-Florida REC, Apopka Theme: “Keeping Water and Nutrients in the Root Zone of Florida’s Horticultural Crops” Commodities:
♦ Vegetables
♦ Citrus
♦ Turf and Landscape
♦ Nursery, Trees, Greenhouse
♦ Deciduous and Tropical Fruits
General program topics:
♦ Irrigation scheduling methods and tools.
♦ Fertilizer use efficiency.
♦ Variable rate fertilization.
♦ Production system limitations.
♦ Plant and soil nutrient monitoring.
♦ Growing media effects on water and nutrient-holding capacity.
♦ Soil amendments to improve water and nutrient-holding capacity.
♦ Reducing impacts of unavoidable leaching and runoff.
♦ Commodity-Specific Topics
♦ Current situation for commodity.
♦ Irrigation and nutrient management strategies.
♦ Production system effects on water and nutrient use efficiency.
♦ Potential practices to reduce water and nutrient losses.
♦ Zero discharge systems – Concept to reality.
♦ Vision: What does the industry need to do better?
Research needed.
Future issues.
(Continued from page 4)
Page 6 UF/IFAS Nutrient Management Education Core Group
Evaluation of irrigation BMP in South Florida K. W. Migliaccio, B. Schaffer, Y. C. Li, E. Evans, J. H. Crane, Tropical REC;
and R. Muñoz-Carpena, Agricultural & Biological Engineering
The rapid growth in the demand for water for agricultural, industrial and urban uses in south Florida has prompted concerns regarding the adequacy of supplies and has led to implementation of many water conservation programs. One such program, designed for agriculture, is the Florida Best Management Practice (BMP) program. [More information on the Florida BMP program can be found through the Florida Department of Agriculture and Consumer Services – Office of Agricultural Water Policy]. This program identifies a list of practices that have resulted in water conservation when implemented in agricultural production systems. However, many of these practices have not been scientifically evaluated for their water conservation benefits considering the soil, climate, and hydrology of south Florida, nor have the economic implications been considered.
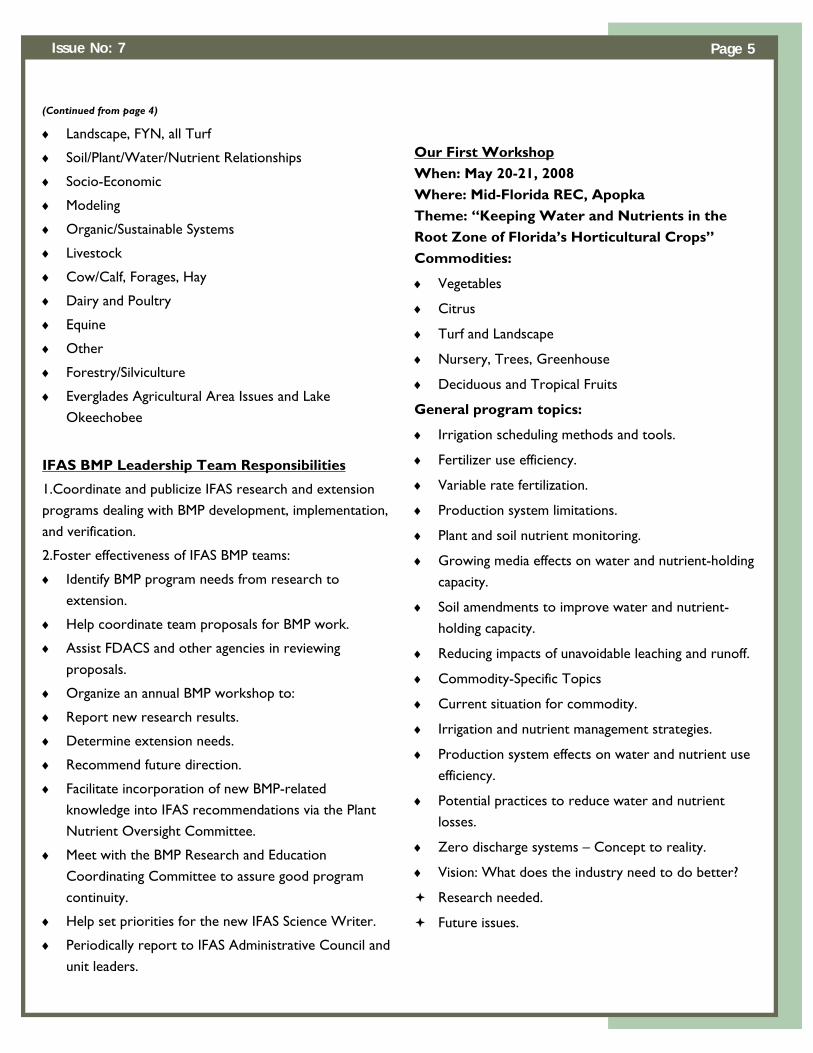
A BMP that has shown substantial water quality and quantity benefits in many locations with various production systems is the use of soil moisture sensors, such as tensiometers, to schedule irrigation (Figure 1). To evaluate the use of tensiometers in a nursery production system, royal palm (Roystonea elata) production using tensiometer automated irrigation was compared to that of traditional grower practices considering water savings, crop yield, and an economic analysis. This was accomplished by implementing the following irrigation
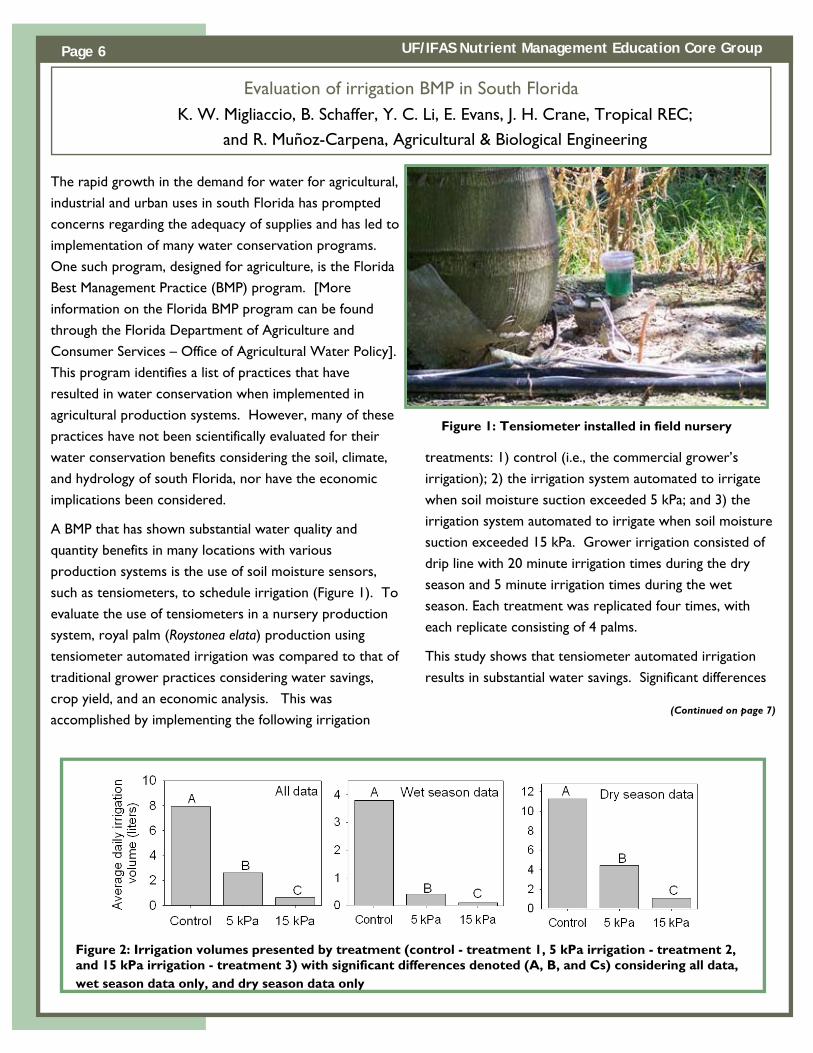
treatments: 1) control (i.e., the commercial grower’s irrigation); 2) the irrigation system automated to irrigate when soil moisture suction exceeded 5 kPa; and 3) the irrigation system automated to irrigate when soil moisture suction exceeded 15 kPa. Grower irrigation consisted of drip line with 20 minute irrigation times during the dry season and 5 minute irrigation times during the wet season. Each treatment was replicated four times, with each replicate consisting of 4 palms.
This study shows that tensiometer automated irrigation results in substantial water savings. Significant differences
(Continued on page 7)
Figure 1: Tensiometer installed in field nursery
Figure 2: Irrigation volumes presented by treatment (control - treatment 1, 5 kPa irrigation - treatment 2, and 15 kPa irrigation - treatment 3) with significant differences denoted (A, B, and Cs) considering all data, wet season data only, and dry season data only

Page 7 Issue No: 7
were present for the three different irrigation treatments (Figure 2). The 5 kPa setting resulted in 67% less water volume used as compared to the control treatment. The 15 kPa setting indicated even greater water savings as compared to the control treatment with 92% less water volume used.
The water savings were particularly noteworthy since no differences were observed among treatments for the palm size [i.e., diameters (Table 1) and heights (Table 2)] or palm nutrient content (Table 3), which was a direct indication of crop yield. The minimal amount of water used by the 15 kPa tensiometer treatment suggests that the palms may be receiving water from sources other than rainfall and irrigation, such as capillary rise from the shallow groundwater table.
Economic analyses indicated that all practices (considering a 10-yr investment and 2-ha implementation) have a net savings to the commercial grower. Thus, implementation of tensiometer automated irrigation is not only environmentally advantageous but also economical for the commercial grower (Figure 3).
The use of soil moisture devices to automate irrigation was shown to be a beneficial BMP for south Florida field nursery production. Additional studies are being conducted in south Florida considering tropical fruits and turf/landscape irrigation using similar automated soil moisture sensors. Through documentation of specific BMP benefits, it is expected that greater implementation will occur resulting in greater water savings.
(Continued from page 6)
Treatment a Diameter at 30.5 cm with standard
deviation (cm)
Diameter at 61.0 with standard deviation (cm)
Height with standard
deviation (cm)
1 17.0 + 3.3 13.6 + 2.4 159.5 + 23.4
2 16.3 + 4.0 12.8 + 2.2 160.5 + 24.6
3 17.5 + 3.2 13.2 + 2.0 155.9 + 21.8 a No significant differences were found among treatments
Table 1: Palm initial measurements for diameters and height presented as means with standard deviations for each treatment
Treatment a
Diameter at 30.5 cm with stan-
dard deviation (cm)
Diameter at 61.0 with standard deviation (cm)
Height with standard
deviation (cm)
1 68.4 + 8.7 54.5 + 9.8 478.2 + 28.9 2 66.7 + 13.7 53.9 + 13.3 462.9 + 61.5 3 71.2 + 6.7 56.7 + 6.8 467.7 + 33.3
a No significant differences were found among treatments
Table 2: Palm final measurements presented as means with standard deviations for each treatment
Treat-ment a
C with standard deviation (kg/kg) b
N with standard deviation
(g/kg)
P with standard deviation (mg/kg)
1 0.445 + 0.008 1852 + 202 1380 + 294
2 0.442 + 0.006 1926 + 153 1467 + 223
3 0.444 + 0.006 1999 + 332 1439 + 206 a No significant differences were found among treatments b kg/kg refers to kg of C per kg of dried plant tissue
Table 3: Carbon (C), nitrogen (N), and phosphorus (P) tissue concentration means and standard deviations for each treatment
Figure 3: Present value of net flow for implementing the practices associated with each treatment over a 2 ha field for 10 years

Page 8 UF/IFAS Nutrient Management Education Core Group
Introduction
Many farms in Florida’s Lower Suwannee River Basin produce peanuts under irrigation, accounting for a large portion of the total irrigation water used in the basin each year. Many producers report that their irrigated fields produce no more peanuts than non-irrigated land, while other producers report a yield response to irrigation of 1000 lbs/acre or more. Possible explanations for this discrepancy include 1) Irrigated fields tend to be farmed more intensively, so the soils may have lower production potential; 2) The irrigation strategy used is insufficient to support a yield increase; 3) The crop may be well-suited to periodic dry conditions that often occur in sandy soils; 4) Typical summer rainfall patterns are sufficient to support a yield of non-irrigated peanuts that is comparable with irrigated peanuts.
Objectives
1. Evaluate peanut yield response to irrigation on a typical sandy soil in the Lower Suwannee River Basin.
2. Demonstrate the utility of soil moisture sensors to measure plant-available water in peanut production, and establish baseline management recommendations for area farmers adopting this technology.
3. Examine and describe the economics of peanut irrigation and crop response.
Methods
The field was a 2-acre wedge-shaped area under a center pivot irrigation system. Dry fertilizer (0-7-28 analysis) was broadcast at 400 lbs/acre before planting. ‘Georgia Green’ peanut seed was no-till planted into a burned-down rye cover crop on 10 May 2007. A target seed spacing of 6 seeds per foot of row was planted on conventional 30-inch rows. Plant population after seed germination was 4 to 5 plants per row foot. Gypsum was applied at 1 ton/acre 35 days after planting. A typical 14-day fungicide spray schedule was used that included Chlorothalonil and
Provost (2:1 mixture of tebuconazole and prothioconazole) applications. The field had no history of peanut production. Tomato spotted wilt virus was prevalent during the season, which was probably influenced by the low plant population, previous crop history of tobacco and vegetable production, and a susceptible variety.
The planting was divided into three adjacent wedge-shaped plots that received three irrigation treatments based on a soil water holding capacity of 1.5” within a 24” root zone.
♦ Treatment 1 – Non-irrigated. Irrigation water was applied only within the first 40 days to encourage seed germination and to activate pesticides.
♦ Treatment 2 – Reduced irrigation. Treatment began after soil moisture was brought to field capacity by rainfall. When crop evapotranspiration (ET) reduced available root zone soil moisture to 0.3 inches, an irrigation volume of 0.4 inches was applied. This treatment theoretically maintained soil moisture below 50% plant-available water. Using this method, irrigation events were initiated prior to onset of wilting.
♦ Treatment 3 – Full irrigation. Treatment began after soil moisture was brought to field capacity by rainfall. When crop ET reduced available soil moisture to 0.75 inches, an irrigation volume of 0.75” was applied. This treatment was based on a checkbook method using reference ET, percentage plant groundcover, and water applied. It essentially maintained soil moisture above 50% plant-available water.
Several soil moisture sensors were installed and used to document variation in soil moisture to understand variation between sensors. Peanuts were harvested on Sep 19-20 from ten sub-plots delineated within each main
(Continued on page 9)
Peanut Water Use and Irrigation in the Suwannee Basin Mace Bauer, IFAS BMP Team, Live Oak; Tom Obreza, Rotem Shahar, Soil and Water Science;
and David Wright, Agronomy

Page 9 Issue No: 7
irrigation plot. Per-acre yields were estimated by weighing the raw peanuts and dividing by the amount of land area harvested. Peanut samples were submitted for grading, but they were not appropriately dried and were not graded in a timely manner, resulting in moldy samples. Grade results were therefore not assumed to be a reliable estimate of peanut quality.
Results and Discussion
Peanut response to irrigation. The growing season included two rainfalls greater than 3.5 inches per event (Table 1). These accumulations accounted for 45% of the total rainfall received during the season. There were minor differences in total irrigation applied to the full and reduced irrigation treatments. We expected only small differences in these treatments because they were not selected to apply different total amounts of water, but to utilize slightly more available soil moisture before initiating irrigation events. During long periods without rainfall, these treatments received essentially the same total
irrigation volume. Actual differences between treatments were 1.37 inches in July and 1.38 inches in August, summing to the total difference of 2.75 inches for the entire the crop season.
Reference documents indicate that the seasonal ET of peanut is 22.0 inches. The reduced and full irrigation treatments received 22.3 and 25.0 inches of rain plus irrigation, respectively. However, rainfalls on June 5 and
Aug 2-3 did not contribute 7.25 inches of stored soil water because the volumes were greater than the soil water holding capacity.
Crop yields were similar to those achieved by producers in the region (Table 2). There were significant yield differences between irrigation treatments, including a yield benefit of 1210 lbs/acre for reduced irrigation compared with no irrigation. An additional yield benefit of 620 lbs/acre was realized from full irrigation. Realizing that a wide variation of contract prices exists for producers in the region, economic analysis was based on a premium of $100/ton above base. Additional economic analysis was
(Continued from page 8)
Table 1. Irrigation and rainfall volume and timing.
Time Full Irrigation Reduced irrigation Non-Irrigated Rainfall
----------------------------------- inches -----------------------------------
May 10 - Jun 20 1.70 1.70 1.70 6.30†
Jun 20 - Jul 1 0.00 0.00 0.00 0.95
Jul 2.17 0.80 0.00 4.42
Aug 3.48 2.10 0.00 4.71†
Sep 1 - Harvest 0.40 0.40 0.00 0.90
Total 7.75 5.00 1.70 17.28
†June 5, 3.50-inch rain; Aug 2-3, 3.75-inch rain.
Treatment Yield †Economic value Total irrigation ‡Gain from input
lbs/acre $/acre inches $/acre
Non-irrigated 2770 623 1.7
Reduced irrigation 3980 895 5.0 250
Full irrigation 4600 1035 7.7 101
†Assumes base price of $350/ton plus $100/ton premium.
‡Assumes fuel costs only for irrigation. Cost of $5/acre-inch irrigation based on diesel fuel cost of $2.40/gal.
Table 2. Peanut yield and economic analysis of irrigation treatments.

Page 10 UF/IFAS Nutrient Management Education Core Group
based on irrigation costs of $5/acre-inch of irrigation, which was gleaned from a survey of producers at a diesel fuel cost of $2.40/gal.
Soil moisture behavior. Analysis of the soil moisture sensor data is incomplete, but the values of significance (field
capacity, 50% available water depletion, and wilting point) will be determined. Figs. 1 and 2 show how soil moisture changed throughout the season for the non-irrigated and full irrigation treatments. A line is drawn in each figure at 12% volumetric water content (irrigation trigger point) for comparison.
Interestingly, for the non-irrigated treatment, soil moisture was entirely depleted at the 12 and 20-inch depths by about July 7, suggesting a root zone depth of at least 20 inches. Rainfall in late July and the early August increased soil moisture at those depths. It took 7 to 10
days for the crop to fully deplete moisture residing in the upper 20 inches of soil.
Data from the full irrigation treatment were equally interesting. Water uptake from the 12 and 20-inch depths was relatively low in that treatment. It appeared that with our irrigation methodology, irrigations correlated with a soil moisture depletion of about 12% at 4 inches, 16% at 12 inches, and little depletion at 20 inches. These soil
moisture contents were different from those observed at commercial farms. Irrigation may have been greater than actual crop water use until about September 1, when crop ET was reduced due to crop maturity. Further evaluation of soil moisture sensor data is in progress.
Conclusions
♦ Irrigation resulted in peanut yield increases from 44 to 66% compared with a non-irrigated control.
♦ Yield differences between irrigation treatments were significant.
♦ The yield gain due to full irrigation under our growing conditions was 1830 lbs/acre, which translated to a positive economic potential of more than $350 per acre after fuel cost was considered.
♦ Using these economic considerations, it appears that adopting a complete, science-based irrigation schedule is worthwhile.
♦ Soil moisture sensing equipment may simplify the adoption of an irrigation schedule if irrigation trigger points are better understood.
♦ Dry weather during the 2007 growing season most likely increased the importance of irrigation.
Fig. 1. Soil moisture 4, 12, and 20 inches deep in the non-irrigated treatment.
Fig. 2. Soil moisture 4, 12, and 20 inches deep in the full irrigation treatment.

Page 11 Issue No: 7
Soil compaction is often one of the indirect consequences of residential home construction. Homeowners desire beautiful home lawns and landscapes. When soils are compacted, the ability of plants to establish and thrive can be physically impacted, often leading to poor plant quality or even plant death. Homeowners can mistake plant issues caused by soil compaction for nutritional or water issues. As a result, they often apply fertilizers, pesticides and irrigation water in an attempt to achieve their desired level of landscape appeal. When soils are compacted, the ability of water to infiltrate is also decreased. That means irrigation and rain water can end up as urban runoff. This runoff is capable to transporting the added fertilizers and pesticides directly to our sensitive water bodies.
Dr. Shober’s research group is searching for cost effective ways to mitigate soil compaction before new residential landscapes are installed. A current research project is
evaluating the impact of shallow soil tillage, soil aeration, and amendment of the soil with organic matter (composted cow manure) on soil compaction in new residential landscapes. Twenty-four landscape plots were established on compacted sandy soil and were planted with St. Augustinegrass turf and mixed ornamentals. The research project also evaluates the impact of tillage, aeration, and organic matter treatments on plant quality and establishment and nutrient losses in runoff and leachate. Results from this research project will be used to create BMPs for soil management in new residential landscape prior to planting.
Evaluating Methods to Mitigate Soil Compaction in Urban Landscapes
Amy L. Shober, Gulf Coast REC
Photo: Compaction of the soil to approximately 1.8 g/cm3.
Photo: Removing topsoil and grading the site
Photo: Installation of leachate collectors
Photo: Mixed landscape plots received tillage, aeration, or organic amendment treatments. Plant quality and
growth, soil compaction, and nutrient losses will be evaluated for 18 months.

Page 12 UF/IFAS Nutrient Management Education Core Group
For the past 12 years, the publication titled “Nutrition of Florida Citrus Trees” (also known as SP 169) has been the one and only source for UF-IFAS citrus fertilizer recommendations. Although this publication has served growers well, it was produced just as the Florida citrus industry was entering the era of Best Management Practices (BMPs). Much has happened since that time, including:
♦ Extensive research on the fate of nitrogen and potassium in the citrus production system;
♦ Phosphorus soil test calibration;
♦ Improved understanding of soil characteristics and their relation to tree growth;
♦ Implementation of precision agriculture practices;
♦ Changes in fertilizer sources used;
♦ Increased foliar fertilization;
♦ Better irrigation scheduling techniques;
♦ Organic citrus production;
♦ Recovery from hurricanes;
♦ New diseases to deal with; and
Creation of regional citrus BMP manuals in response to water quality concerns.
With all of these things rapidly occurring, it became clear that SP 169 needed a serous overhaul. About 2 years ago, the authors of this article spearheaded an effort to produce an updated version of UF-IFAS nutrient management recommendations. Our new publication retains the same title but will have a new publication code, SL 253 (Fig. 1). Additional contributing authors include Gene Albrigo, Brian Boman, Mary Collins, Jim Ferguson, Steve Futch, Ed Hanlon, Larry Parsons, and Arnold Schumann. The scope has been expanded to include topics not previously discussed in comprehensive IFAS citrus fertilization manuals. Thus, SL 253 runs about 100
pages compared with SP 169 at 61 pages. It includes new information and updated recommendations crystallized from 60+ citrus research and extension publications produced by UF-IFAS faculty since 1995.
SL 253 consists of 14 chapters, 7 appendices, 47 illustrations, 24 tables, and 40 color plates. Here is a sample of what citrus growers will see when they open the new publication:
Chapter 1 introduces the publication and states its objective: To provide background information and recommendations to develop a sound citrus nutrition program that optimizes financial returns while sustaining yields and maintaining soil and water quality. This chapter provides a historical perspective of Florida citrus tree nutrition, gives credit to the workers who have brought us to this point, and sets the stage for the BMP era.
Chapter 2 identifies production areas, describes typical soil types, and outlines the land preparation needed to plant citrus. Considerable discussion is devoted to soil physical and chemical characteristics important to citrus nutrient management and the definition of soils vulnerable to nutrient losses. The importance of soil pH, liming, and organic matter are also discussed.
Chapter 3 talks about general soil fertility and citrus tree nutrition. Essential nutrients are identified and their behavior in the soil and the tree are detailed. There is a general discussion of how each nutrient is typically supplied to citrus and how much of each is needed by a tree. Finally, there is a concise summary of how specific nutrients and irrigation affect fruit quality.
Chapter 4 describes how soil and leaf tissue testing should be used as citrus nutrient management tools. The benefits of each type of testing are described, and the steps needed to establish a successful testing program are clearly outlined. Interpretations for both soil and leaf analysis values are shown in easy-to-read tables, along with suggested actions to take if a leaf or soil sample value is out of the desired range. The pros and cons of
What’s New in UF-IFAS Citrus Nutrition Recommendations? Thomas Obreza, Kelly Morgan, Soil & Water Science;
and Mongi Zekri, Hendry County Extension

Page 13 Issue No: 7
traditional sampling vs. sampling for use with precision-agriculture practices are also considered.
Chapter 5 discusses how precision agriculture practices like field electrical conductivity measurements, ultrasonic canopy measurements, citrus yield mapping, and precision nutrient application can be used to improve citrus nutrient management.
Chapter 6 reviews the characteristics and use of a wide variety of fertilizer sources and formulations, including solid, solution, suspension, slow-release, and controlled-release materials. There is also a section describing nutrient sources used for organic citrus production.
Chapter 7 describes methods of applying dry and liquid fertilizers. There is particular emphasis on fertigation as a nutrient delivery method, including equipment needs, backflow prevention, fertilizer salt-out, avoiding emitter plugging, injection calculations, and safety. Since the practice of foliar fertilization has increased in Florida citrus groves, tips about this application method are mentioned.
Chapter 8 provides the latest IFAS-recommended fertilizer rates and timing. Nitrogen management guidelines are separated into non-bearing (first 3 years in grove), young bearing (years 4–7), and mature bearing (years 8+) trees. The maximum recommended N rate for a mature orange grove is now based on projected fruit yield or soluble solids yield rather than a set maximum per-acre rate of 200 lbs (240 lbs for an exceptionally-producing grove) as before. A yield-based rate will enable growers to fine-tune their N rates with the help of leaf N analysis and other grove characteristics. Recommended N rates for grapefruit have not changed. A leaching rain rule was established that allows extra N application in the event of a 3+ inch rain within 72 hours after a normal fertilizer application. Chapter 8 also provides a P fertilizer recommendation based on both leaf and soil test data. Phosphorus application is not recommended unless it is justified by low soil and leaf P tests. Potassium, Ca, Mg, and micronutrient fertilizer recommendations remain essentially unchanged from SP 169. Particular situations
that justify foliar N, P, or K applications are discussed, and specific recommendations are provided.
Chapter 9 brings in irrigation as a factor that can improve nutrient uptake if water is managed properly. Irrigation scheduling, the latest instruments available to measure soil moisture, and water budgeting are discussed. An example is provided that shows how to estimate the longest time a
micro-irrigation system can be run without leaching fertilizer.
Chapter 10 discusses environmental issues related to Florida citrus production, the BMP era, and characteristics of a successful BMP program.
Chapter 11 covers special situations not previously discussed in detail, including scions, rootstocks, soils high in copper, calcareous soils, saline soils and water, using
(Continued from page 12)
Fig. 1. The cover of the new UF-IFAS citrus nutrition publication, SL 253.

Page 14 UF/IFAS Nutrient Management Education Core Group
Rao Mylavarapu PO Box 110290
University of Florida Gainesville, FL 32611
Phone: 352-392-1951 Fax: 352-392-3092
Email: [email protected]
IFAS SOIL & WATER
SCIENCE
nutrients.ifas.ufl.edu
This newsletter was created to disseminate information on current projects in the
Nutrient Management area. If you would like to submit an article for inclusion in a future
newsletter please contact:
Susan Curry PO Box 110290
Soil & Water Science University of Florida Gainesville, FL 32611
(352) 392-1951
reclaimed water for irrigation, fertilization strategies for damaged trees, nutritional deficiencies enhanced by environmental or pathological factors, and organic citrus production.
Chapter 12 provides reference citations for the articles that provided new information and recommendations found in SL 253, while Chapter 13 is a glossary of nutrient management terms.
Chapter 14 includes the appendices that contain detailed information on soil physical and chemical characteristics, nutrient concentrations, salt index, and solubility of fertilizer materials, common fertilizer solutions, a fertilizer formulation example, an example of how to determine the fertilizer application rate and schedule for a typical grove, and a key to citrus
nutrient deficiency symptoms.
The color plates section shows nutrient deficiency symptoms on leaves, twigs, and fruit as well as examples of salt damage, biuret toxicity, and spray burn. Finally, several images of leaves showing citrus greening symptoms are shown to help avoid confusion with nutrient deficiency.
The best part about the new publication is that it will be made available to citrus growers free of charge. The Florida Dept. of Agriculture and Consumer Services, Office of Ag Water Policy is producing 1000 hard copies for us, and we express our appreciation to them for their help. Alternatively, the publication will be available through the UF-IFAS EDIS system, so you can look for it at http://edis.ifas.ufl.edu.
(Continued from page 13)