Embed Size (px)
Citation preview

International Journal of Advanced Scientific Research and Management, Volume 3 Issue 10, Oct 2018
www.ijasrm.com
ISSN 2455-6378
205
Unravelling the Brand Attractiveness
Quotient In Processed Food Industry
Dr Rinalini Pathak Kakati1 and Anubhuti Deorah
2
1 Professor, Department of Business Administration, Gauhati University,
Guwahati-781014, Assam, India
2
Senior Research Fellow, Department of Business Administration,
Gauhati University, Guwahati-781014, Assam, India
Abstract
When there is extreme competition for market
share among brands be it a Local, a National or a
Global brand, how does a Local brand assess its
attractiveness? This paper focuses on assessing the
Attractiveness Quotient of a local brand, national
and global brands in the Ready to Eat Noodles
product category of the Processed Food Industry.
Four appeals are used to unravel the Brand
Attractiveness, viz. Emotional, Rational,
Aspirational and Communicational Appeals. A
total of 41 variables are gauged under these
appeals, comprising of Familiarity, Distinct
Advantage, Bond, Happiness, Visibility,
Popularity, Clarity, Cost Justified, Satisfaction, etc.
These 41 variables are grouped into nine factors
through factor analysis. Responses of more than
150 consumers have been collected. The study not
only gauges the various appeals, but also calculates
a comprehensive Brand Attractiveness Quotient of
the three brands and even presents a pictorial
depiction of where the Local Brand stands vis-à-vis
the National and Global brands. The findings reveal
that the Global brand has the highest mean values
across individual appeals followed by the Local
Brand and then the National Brands. But in case of
overall Brand Attractiveness Global Brand is again
the highest, followed by National and then Local
Brands.
Keywords: Brand Attractiveness, Local Brand,
National Brand, Global Brand, Processed Food
Industry, Noodles.
1. Introduction
The main purpose of any product or service
marketer today is to attract its customers towards
their Brand and to shine among the sea of Brands
available in the market. The market today is well
penetrated with not only Local and National Brands
but also Global and Multi National Players, pausing
a great threat to survival for the small Local
Brands, especially in products with less or no
differentiation. So now it is vital to understand
where one’s brand attractiveness lies in comparison
to their competitors. This will help Brands to
leverage themselves over other brands, and make
themselves more attractive by highlighting these
areas or features. In cluttered markets, like that of
FMCG or Processed Food Industry, building brand
effectively can only provide a strategic upper hand.
The ability to manage this brand effectively affects
a company’s growth and profitability in long run
and builds consumer loyalty directly than any other
strategic decision. Many studies relating to
different aspects of branding like positioning,
measuring brand equity, growth etc. have enriched
the literatures with well-developed models and
relationships among factors affecting branding
issues. A new area which has been relatively
untouched upon by researchers is Brand
Attractiveness. Most of the studies focus on
physical attractiveness of the brands (Till,Busier,
2000; Underwood, 2003; Klein 2003). In India
studies on Brand Attractiveness have been done by
Trust Advisory Ltd (TRA, 2013) which states
brand attractiveness as a powerful, intangible
force, which goes much beyond the physical
aesthetics of a brand and which irresistibly draws
audiences towards itself.
The Processed Food industry has major big global
and national players and they have entered the nook
and corner of India. Looking at the immense
market growth opportunity, local players are trying
to enter this competitive segment. Considering the

International Journal of Advanced Scientific Research and Management, Volume 3 Issue 10, Oct 2018
www.ijasrm.com
ISSN 2455-6378
206
above facts, this study examines the brand
attractiveness of a product belonging to Consumer
Foods- Ready to eat Noodles category. It evaluates
the brand attractiveness quotient of the product
(Noodles) for a global brand, national brand and
local brand and charts the strategic perspective for
the local brand. The study also formulates four
hypotheses to find whether significant differences
exist in the brand appeals under attractiveness
quotient. .
In India, packaged food industry has witnessed an
exponential growth over past few years. The Indian
and Retail industry market size is estimated
USD258 billion for 2015; and is expected to reach
USD482 billion by 2020 (IBEF, 2017). With
increasing investment in FDI, global brands like
Danone , Heinz , Twinings Nestle, Nepal’s CG
Foods (WaiWai noodles), Kraft Foods, etc. are
found across major cities and towns in India. .
Further looking into demand potential , even local
/regional brands have immersed leading to
unbeatable competition amongst the brands The
fight amongst these brands to increase their brand
equity is not only felt in major metros but also in
other geographically remote areas of India like the
North East Region of India (NER).
Considering the above facts, this study examines
the brand attractiveness of a product belonging to
Consumer Foods- Ready to eat Noodles category. It
evaluates the brand attractiveness quotient of the
product (Noodles) for a global brand, national
brand and local brand and charts the strategic
perspective for the local brand.
2. Literature Review
A thorough review of the present body of literature
on various branding aspect of Local, National and
Global brands focusing on Packaged Goods
Industry was conducted. Also comparative analysis
of Global, National and Local Brands w.r.t.
different branding aspects was done. Some of the
notable studies are presented in this section.
Batra, Ramaswamy, Alden, Steenkamp and
Ramachander (2000) mentions that Brand
Attractiveness of brand perceived as having non-
local origin, are attitudinally preferred to brands
seen as local, for reasons not only of perceived
quality but also of social status. This research was
conducted for developing countries to see if brands
which were not locally produced (particularly
Western origin) were favored than products
perceived as locally produced and branded. Till and
Busier (2000) presented two studies. These studies
inspected attractiveness role and proficiency in
the"match-up hypothesis". Pérez, Alcañiz and
Herrera (2009) examined the impact of Corporate
Social Responsibility (CSR) on consumer-company
identification (C-C identification). It was seen that
CSR generated brand attractiveness by refining
brand prestige, coherence and uniqueness thereby
increasing buying intensions. Nagashima, Akira
(1970), White&Marmet (1980),
Obenniller&Spangenberg (1989), Papadopoulos,
Nicolas, Heslop, Garby&Avlonitis (1987),
Parameswaran, Ravi & Attila (1987), Reierson,
Curtis (1966), Roth, Martin & Romeo (1992),
Shimp& Snyder (1990), Schooler, Robert &Sunoo
(1969, 1971), Shimp, Terence, Sainiee& Madden
(1993), Stephens, Keith, Fox & Leonard (1985),
Tse, David &Gorn (1993) have studied various
influence of Country of origin (COO) effect on
brand attractiveness and product evaluations. Lewis
and Stubbs (1999) investigated five firms from UK
Food and Beverage sector. They found that national
and global brands are trying to capture market by
tailoring their brands for regional market, while
regional brands are looking to expand.
As research in this domain evolves more depth and
sophistication has been seen in the literature. But it
is seen that a broader enquiry in the domain of
brand attractiveness and consumer behavior is
lacking. Gao, Pan, Tse, and Kin, Yim (2006) have
done a country specific (China) analysis to study
market share performance of foreign and domestic
brands, considering three sets of factors, (a) brands’
competitive advantages, (b) external market
environment and (c) brand existence time period.
Benedict, Steenkamp, Batra, Alden (2003) studied
perceived brandglobalness (PBG) and its influence
on brand attractiveness leading to purchase.
Sculling and Kapferer (2004) saw that due to the
emphasis on building global brands and
restructuring of brand portfolios, many effective
local brads were removed. Bronnenberg, Dhar and
Dube (2007) specifically studied the consumer
packaged food industry across U.S regional
markets. They observed that the geographical
variation in market shares, perceived quality levels
and local players’ presence is so high that there is
no relevance of a national/ global brand. Ataman,
Mela and Heerde (2007) did a study in France
markets, an extension study of Bronnenberg, Dhar,
and Dube (2007) which was done in US markets
which highlighted the impact of geographic
variation. Dewsnap and Jobber (2000) specifically
studied the Consumer Packaged Goods companies.
They found that these companies need to have
strong holds in retail trade, relationship an
collaborative marketing within the marketing
functions are the need of the hour, especially
between trade customer-focused sales personnel
and brand-focused marketing personnel. Feldman
(2011) in his study, reports about making brands,
more attractive for retailers and licensees. Spiegler,
Hildebrand and Michahelles (2012) argue that

International Journal of Advanced Scientific Research and Management, Volume 3 Issue 10, Oct 2018
www.ijasrm.com
ISSN 2455-6378
207
players have recently introduced the use online
social media platform in their businesses; also,
there has been spurt of outdoor displays in public
places. The focus thus now is how both social
media and outdoor advertising can be used to
attract potential and existing customers and make
strong relationships with the brand in question.
3. Theoretical Framework
This study draws partially the theoretical
framework of TRA model published in Brand
Attractiveness Report (2013). The model mainly
works on two aspects Brand Trust and Brand
Attractiveness. This study after modifications
needed for the specific product category under
study, has adapted 41variables from the original 36
Trait Matrix. The Trust Advisory (TRA) Pvt. Ltd, a
Comniscient Group company has developed two
proprietary matrices: Brand Trust and Brand
Attractiveness. It has done an extensive study on
measuring Brand Attractiveness in India. Over
several years TRA conducted detailed interviews
and interactions with psychologists and
communication experts to understand the
physiology of attraction and concluded on a 36
Trait Matrix, the primary ingredients that constitute
all attractions. These ingredients arouse out of four
Attractiveness Appeals- Rational, Emotional,
Aspirational and Communication, and get woven
into the Attractiveness Quotient.Each of the four
appeals plays vital role in building brand
attractiveness. While some brands may possess one
or more of these appeals, having a balanced mix of
all four appeals creates a brand that possesses an
elusive quality to create a sustained attractiveness.
This is a quality that is greatly coveted by all
brands as it helps to engage consumers holistically
and for a prolonged period of time.
4. Methodology
4.1 Research design
This study makes use of descriptive research
design. The past studies carried out in India and
abroad have already identified the various factors
that affect brand attractiveness. In this study,
attempt has been to identify the differences in
brand attractiveness appeals for different brands in
the Consumer Food – Ready to eat Noodles
category. The 3 brands selected for the study are (i)
Yummy, the local brand manufactured by AA
Nutritions, (ii)Yippee, the national brand from ITC
and (iii) Maggi, the global brand from Nestle. The
selections of these brands are based on market
share and availability in Greater Guwahati where
the study has been conducted. Survey method has
been employed for data collection by administering
a structured questionnaire. The sample size
consisted of 150 customers and the sampling
technique used has been judgment sampling. The
respondents’ had been briefed about the
questionnaire format of the study initially before
undertaking the survey. Close observation of
consumers at the departmental stores and grocery
stores had been done to study their purchase
behavior of the considered brands.
This study has used the Brand Attractiveness
Model published in the report published by TRA
(2013) with modifications considering the nature of
product under study.
Table 1: Variables studied under each appeal
4.2 Questionnaire
A format of the questionnaire to test the four
appeals is given in Appendix I. The Questionnaire
administered has two parts: Screener
Questionnaire- This was administered to qualify
consumers and Main Questionnaire: The main
questionnaire constitute of 41 attributes which have
been divided into four sections based on the four
appeals to be studied under the objective. The
respondents were asked to rate all 41 attributes on a
7 point Likert Scale (1 for strongly disagree to 7 for
strongly agree).
4.3 Scaling techniques
Consumers’ were asked to rate their degree of
agreement or disagreement on an assortment of 41
attributes of a brand. For this reason the Likert
Scale was used. This measurement is very difficult
as it is hidden in consumers subconscious answer is
either agree or disagree (i.e. positive or negative), a
7 point scale is decoded where 1 means strongly
disagree, 7 means strongly agree and 4 means
neither agree nor disagree: neutral response.
Respondents were asked to avoid the mid neutral
response i.e. acquiescence response bias.Content,
criterion and construct validity are followed
through.
4.4 Scale Reliability and Validity for Ready to Eat
Noodles Brands
ASPIRATIONAL APPEAL
Familiar Memory Expectation Logical Satisfaction Clarity Interactive
Recognition Happy Positive Feedback Track Pride Attraction Meets all Standards
Delivers Alertness Understandable Visibility Connection Posters Packaging
Association Confidence Positive Experience Popularity Compliments Promotions Stands Out
Distinct Advantage Comforting Market Standard Value For Money Acknowledgement Trust
Bond Presentable Cost Justified Engagement
Systematic Availability Fashionable
EMOTIONAL APPEAL RATIONAL APPEAL COMMUNICATION APPEAL

International Journal of Advanced Scientific Research and Management, Volume 3 Issue 10, Oct 2018
www.ijasrm.com
ISSN 2455-6378
208
The reliability and validity of the scale and data
collected was conducted. The variables under each
appeal were gauged. The scale was tested for
internal reliability of scale and sub-scale items.
According to various authors (Churchill, 1979;
Peter, 1981; and Malhotra, 2004), a multi-item
scale should be evaluated for accuracy and
applicability, and emphasis should be on
developing measures, which have desirable,
reliable and valid properties. The measure followed
was, reliability with Cronbach’s alpha, which is
defined as the average of all possible split- half
coefficients resulting from different ways of
splitting the scale items (Cronbach, 1951) (Table
2).
Table 2: Reliability and Equivalence of Appeals
for Ready to Eat Noodles Brands
Emotional Appeal, Rational Appeal, Aspirational
Appeal and Communication Appeal, all achieved a
high Cronbach’s alpha coefficient, suggesting high
reliability (greater than 0.6 as recommended by
Nunally and Bernstein, 1994). 0.9 is seen as a good
value for alpha. The overall Cronbach’s alpha
coefficient for 41 variables was .981. Hotelling’s t-
squared test confirmed that the mean of different
variables under the four appeals vary significantly
from each other at 1 per level. This indicates that
there is no equivalence between all the 41 variables
and they are all different and possess unique
characteristics. All t-values were significant at 0.5
level of significance.
4.5 Hypothesis Formulation
Based on the four appeals, the following hypothesis
has been formulated. Testing of these hypotheses
will give greater validity to our findings.
H0: There is no significant differences in
Emotional, Rational, Aspirational and
Communication Appeals among the global,
national and local brand.
H1: There is significant differences in Emotional,
Rational, Aspirational and Communication Appeals
among the global, national and local brand
5. Analysis and Findings
Out of the sample size of 150, only 120 completely
filled questionnaires have been retrieved, hence the
final analysis is based on the sample of 120
consumers.
5.1 Factor Analysis
The first step consists of factor analysis in order to
reduce the underlying variables affecting an appeal.
Factor analysis has been carried out separately for
each appeal for all the three brands together as
given by the Rotated Component Matrix in Table 3.
From the above Rotated Factor Matrices, under
Emotional Appeal: two factors, Rational Appeal:
three factors, Aspirational Appeal: two factors and
Communication Appeal: two factors have been
extracted. By grouping the factor loadings with
factor scores more than │0.5│, the factors have
been named as discussed below.
Table 3a: The Rotated Component Factor Matrix
for Emotional and Rational Appeals
Emotional Appeal: Familiar, Recognition, Delivers,
Association, Distinct advantage and Bond fall
under first factor. These variables talk about
awareness of the brand among consumers hence it
has been attributed as Brand Knowledge as used by
Keller (1998). Happy, Memory Alertness,
Confidence and Comforting variables form the
second factor under Emotional appeal. This group
of variables reflects the image of the brand so the
nomenclature Brand Image as used by Keller
(1998) has been given to Factor 2.
Emotional 11 0.94 40.3 3.929 10-349 0.000
Rational 14 0.952 60.348 4.486 13-345 0.000
Aspiration 7 0.916 1.593 0.253 6-354 0.008
Communication 9 0.933 22.683 2.464 8-350 0.010
Overall 41 0.981 125.106 2.708 41-315 0.000
Cronbanch’s
Alpha
Hotellingt
SquaredF -Value df
p -
ValueAppeal
No. of
Items
1 2 1 2 3 1 2 1 2
Familiar 0.813 Expectation 0.81 Satisfaction 0.783 Clarity 0.77
Recognition 0.705 Understandable 0.71 Compliments 0.758 Posters/ Billboards 0.74
Delivers 0.816 Market Standard 0.69 Acknowledgement 0.637 Interactive 0.63
Association 0.646 Systematic 0.71 Fashionable 0.857 Meets All Standard 0.65
Distinct advantage 0.741 Logical 0.56 Pride 0.78 Packaging 0.63
Bond 0.75 Popularity 0.78 Connection 0.857 Stands-Out 0.78
Happy 0.58 Value For Money 0.75 Engagement 0.602 Attraction 0.687
Memory 0.84 Cost Justified 0.82 Promotions 0.921
Alertness 0.81 Availability 0.57 Trust 0.659
Confidence 0.82 Positive Feedback 0.59
Comforting 0.73 Positive Experience 0.55
Presentable 0.79
Track 0.57
Visibility 0.82
Extraction Method: Principal Component Analysis.
Rotation Method: Varimax with Kaiser Normalization.a
a. Rotation converged in 3 to a maximum of 6 iterations.
Emotional Appeal Rational Appeal Aspirational Appeal Communicational Appeal
Component and
Factor Loadings
Component and
Factor Loadings
Component and
Factor Loadings
Component and
Factor Loadings
International Journal of Advanced Scientific Research and Management, Volume 3 Issue 10, Oct 2018
www.ijasrm.com
ISSN 2455-6378
209
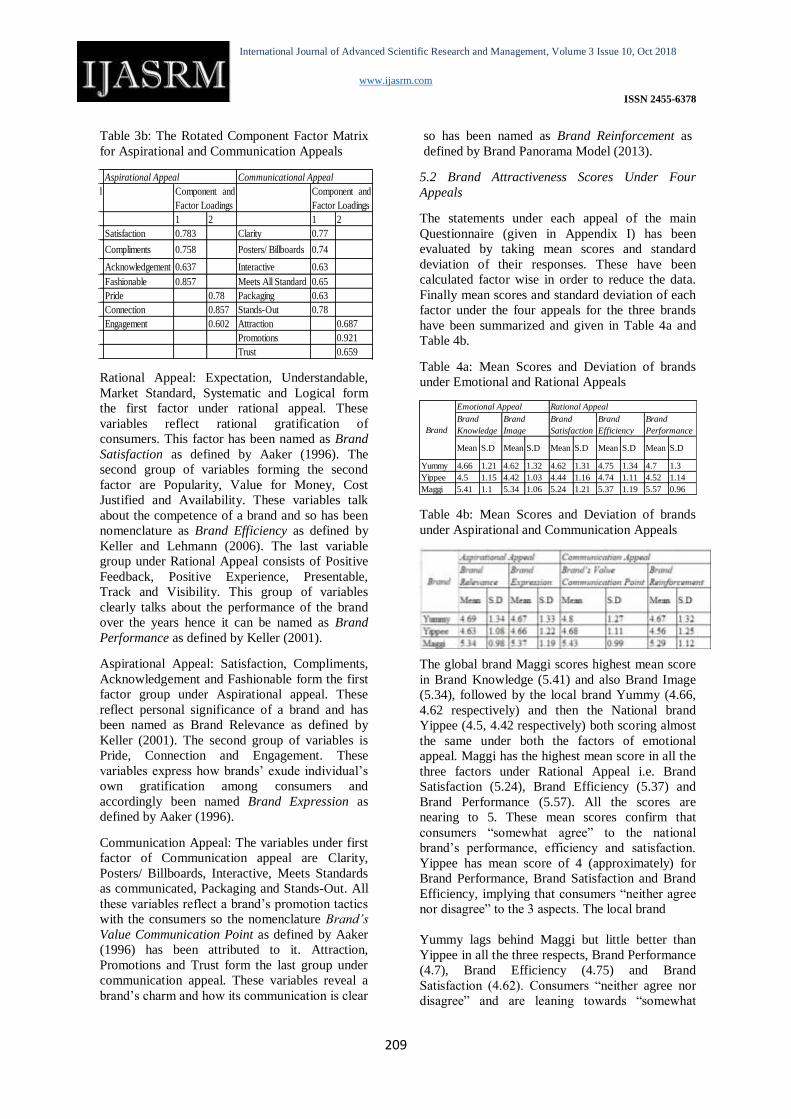
Table 3b: The Rotated Component Factor Matrix
for Aspirational and Communication Appeals
Rational Appeal: Expectation, Understandable,
Market Standard, Systematic and Logical form
the first factor under rational appeal. These
variables reflect rational gratification of
consumers. This factor has been named as Brand
Satisfaction as defined by Aaker (1996). The
second group of variables forming the second
factor are Popularity, Value for Money, Cost
Justified and Availability. These variables talk
about the competence of a brand and so has been
nomenclature as Brand Efficiency as defined by
Keller and Lehmann (2006). The last variable
group under Rational Appeal consists of Positive
Feedback, Positive Experience, Presentable,
Track and Visibility. This group of variables
clearly talks about the performance of the brand
over the years hence it can be named as Brand
Performance as defined by Keller (2001).
Aspirational Appeal: Satisfaction, Compliments,
Acknowledgement and Fashionable form the first
factor group under Aspirational appeal. These
reflect personal significance of a brand and has
been named as Brand Relevance as defined by
Keller (2001). The second group of variables is
Pride, Connection and Engagement. These
variables express how brands’ exude individual’s
own gratification among consumers and
accordingly been named Brand Expression as
defined by Aaker (1996).
Communication Appeal: The variables under first
factor of Communication appeal are Clarity,
Posters/ Billboards, Interactive, Meets Standards
as communicated, Packaging and Stands-Out. All
these variables reflect a brand’s promotion tactics
with the consumers so the nomenclature Brand’s
Value Communication Point as defined by Aaker
(1996) has been attributed to it. Attraction,
Promotions and Trust form the last group under
communication appeal. These variables reveal a
brand’s charm and how its communication is clear
so has been named as Brand Reinforcement as
defined by Brand Panorama Model (2013).
5.2 Brand Attractiveness Scores Under Four
Appeals
The statements under each appeal of the main
Questionnaire (given in Appendix I) has been
evaluated by taking mean scores and standard
deviation of their responses. These have been
calculated factor wise in order to reduce the data.
Finally mean scores and standard deviation of each
factor under the four appeals for the three brands
have been summarized and given in Table 4a and
Table 4b.
Table 4a: Mean Scores and Deviation of brands
under Emotional and Rational Appeals
Table 4b: Mean Scores and Deviation of brands
under Aspirational and Communication Appeals
The global brand Maggi scores highest mean score
in Brand Knowledge (5.41) and also Brand Image
(5.34), followed by the local brand Yummy (4.66,
4.62 respectively) and then the National brand
Yippee (4.5, 4.42 respectively) both scoring almost
the same under both the factors of emotional
appeal. Maggi has the highest mean score in all the
three factors under Rational Appeal i.e. Brand
Satisfaction (5.24), Brand Efficiency (5.37) and
Brand Performance (5.57). All the scores are
nearing to 5. These mean scores confirm that
consumers “somewhat agree” to the national
brand’s performance, efficiency and satisfaction.
Yippee has mean score of 4 (approximately) for
Brand Performance, Brand Satisfaction and Brand
Efficiency, implying that consumers “neither agree
nor disagree” to the 3 aspects. The local brand
Yummy lags behind Maggi but little better than
Yippee in all the three respects, Brand Performance
(4.7), Brand Efficiency (4.75) and Brand
Satisfaction (4.62). Consumers “neither agree nor
disagree” and are leaning towards “somewhat
1 2 1 2 3 1 2 1 2
Familiar 0.813 Expectation 0.81 Satisfaction 0.783 Clarity 0.77
Recognition 0.705 Understandable 0.71 Compliments 0.758 Posters/ Billboards 0.74
Delivers 0.816 Market Standard 0.69 Acknowledgement 0.637 Interactive 0.63
Association 0.646 Systematic 0.71 Fashionable 0.857 Meets All Standard 0.65
Distinct advantage 0.741 Logical 0.56 Pride 0.78 Packaging 0.63
Bond 0.75 Popularity 0.78 Connection 0.857 Stands-Out 0.78
Happy 0.58 Value For Money 0.75 Engagement 0.602 Attraction 0.687
Memory 0.84 Cost Justified 0.82 Promotions 0.921
Alertness 0.81 Availability 0.57 Trust 0.659
Confidence 0.82 Positive Feedback 0.59
Comforting 0.73 Positive Experience 0.55
Presentable 0.79
Track 0.57
Visibility 0.82
Extraction Method: Principal Component Analysis.
Rotation Method: Varimax with Kaiser Normalization.a
a. Rotation converged in 3 to a maximum of 6 iterations.
Emotional Appeal Rational Appeal Aspirational Appeal Communicational Appeal
Component and
Factor Loadings
Component and
Factor Loadings
Component and
Factor Loadings
Component and
Factor Loadings
Mean S.D Mean S.D Mean S.D Mean S.D Mean S.D Mean S.D Mean S.D Mean S.D Mean S.D
Yummy 4.66 1.21 4.62 1.32 4.62 1.31 4.75 1.34 4.7 1.3 4.69 1.34 4.67 1.33 4.8 1.27 4.67 1.32
Yippee 4.5 1.15 4.42 1.03 4.44 1.16 4.74 1.11 4.52 1.14 4.63 1.08 4.66 1.22 4.68 1.11 4.56 1.25
Maggi 5.41 1.1 5.34 1.06 5.24 1.21 5.37 1.19 5.57 0.96 5.34 0.98 5.37 1.19 5.43 0.99 5.29 1.12
Brand’s Value
Communication Point
Brand
ReinforcementBrand
Aspirational Appeal Communication Appeal
Brand
Relevance
Brand
Expression
Rational Appeal
Brand
Knowledge
Brand
Image
Brand
Satisfaction
Brand
Efficiency
Brand
Performance
Emotional Appeal

International Journal of Advanced Scientific Research and Management, Volume 3 Issue 10, Oct 2018
www.ijasrm.com
ISSN 2455-6378
210
agree” w.r.t. all the three factors. The global brand
Maggi scores highest mean score in Brand
Relevance (5.34) and in Brand Expression (5.37)
followed by the local brand Yummy and Yippee
has the least mean score. The local brand Yummy
scores little better than the global brand, its Brand
Relevance (4.69) is found to be marginally better
than Brand Expression (4.67) aspect. Though the
difference hardly matters. Consumers lean towards
“somewhat agree” and connect positively towards
Yummy’s Expression and Relevance. The global
brand Maggi yet again has the highest mean score
in all the factors under Communication Appeal i.e.
Brand’s Value Communication Point (5.43) and
Brand Reinforcement (5.29). These mean scores
confirm that consumers “somewhat agree” to the
global brand’s value communication and
reinforcement. The national brand Yippee has
mean score of 4.68 and 4.56 respectively for both
the factors, implying that the consumers are leaning
towards some agreement or are indifferent towards
these factors of the brand. The local brand Yummy
scores 4.67 for Brand Reinforcement and 4.8 for
Brand’s Value Communication Point. Furthermore,
it is nearing positive feelings in both respect.
The Standard Deviations reflect the consistency in
responses of the consumers. The above table
reflects that the consumers are most consistent
w.r.t. Maggi and Yippee, and least consistent in
responses of Yummy. This has implication in
calculation of Brand Attractiveness.
5.3 t Test
To test whether the three brands differ significantly
for all the four Appeals, “One Sample t test” has
been performed for each factor belonging to the
appeals.
Table 5a: One Sample t test Results for Emotional
and Rational Appeals
Table 5b: One Sample t test Results for Aspiration
and Communication Appeals
The findings of “One Sample t test” given in Table
5a and Table 5b, shows that the calculated p value
≤ 0.000 for all the factors. This imply that all the
four appeals are significant at 5% level of
significance suggesting that there exists significant
differences among the global, national and local
brand’s regarding the four appeals.
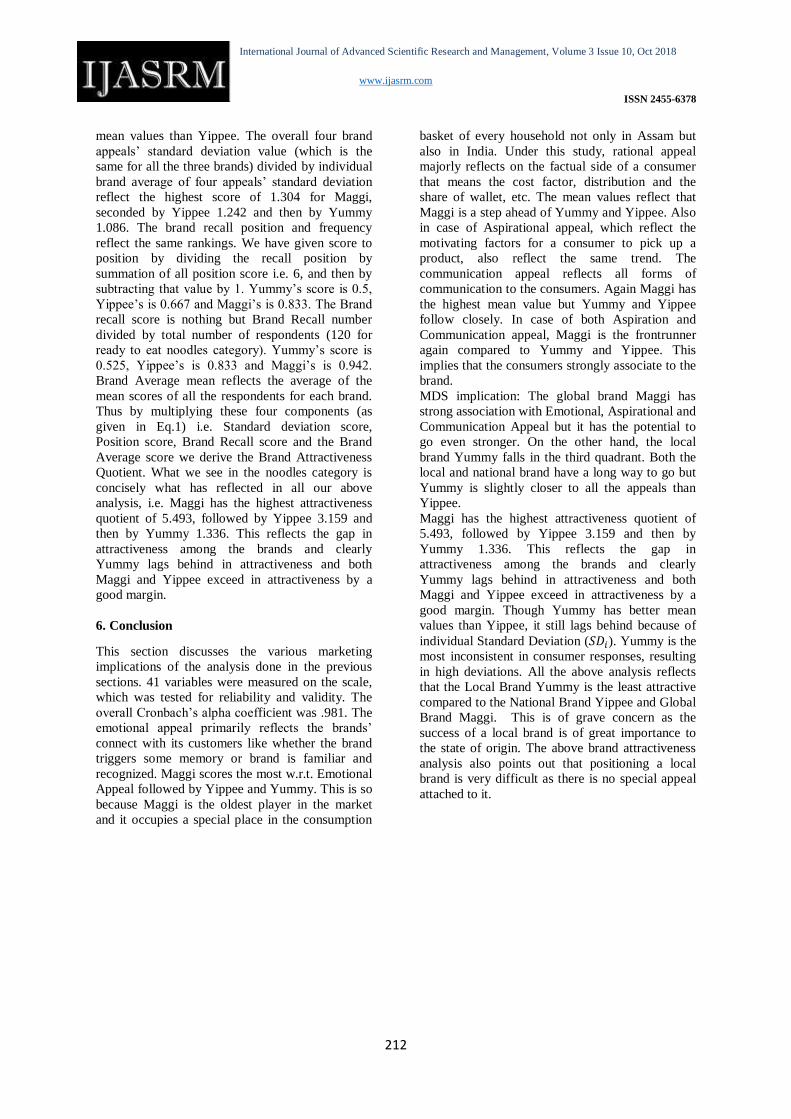
5.4 Multi-Dimensional Scale for the four Appeals
To further understand the brand attractiveness,
multidimensional scaling also has been performed
as given in Table 6, 7 and Figure 1. The Wilks’
Lamda value is 0.866 (p≤ 0.000), implying that the
data is fit for multi-dimensional scaling. By
plotting the values given in Table 7, the Figure 1
has been obtained. The X axis is represented by
Emotional Appeal, Rational, Aspirational and
Communication Appeal. The appeals are denoted
by orange lines, whereas the Brands are denoted by
blue lines. It is clear from the diagram that global
brand Maggi has strong association with
Emotional, Aspirational and Communication
Appeal but it has the potential to go even stronger.
On the other hand, the local brand Yummy falls in
the third quadrant. The national brand, Yippee
seems to also lag behind in any association with the
four appeals. Both the local and national brand
have a long way to go but Yummy is slightly closer
to all the appeals than Yippee.
Table 6: Wilks’ Lambda
Test of
Function(s)
Wilks'
Lambda
Chi-
square df Sig.
1 through 2 .866 51.264 8 .000
2 .994 2.036 3 .565
tSig.(2-
tailed)t
Sig.(2-
tailed)t
Sig.(2-
tailed)t
Sig.(2-
tailed)t
Sig.(2-
tailed)t
Sig.(2-
tailed)t
Sig.(2-
tailed)t
Sig.(2-
tailed)t
Sig.(2-
tailed)
Yummy 42.3 0.000 38.2 0.0 38.7 0.000 38.9 0.000 39.5 0.000 38.5 0.000 38.4 0.000 41.38 0.000 38.8 0.000
Yippee 43.1 0.000 47 0.0 42 0.000 46.8 0.000 43.3 0.000 46.9 0.000 41.9 0.000 46.09 0.000 40.1 0.000
Maggi 53.8 0.000 55 0.0 47.3 0.000 49.4 0.000 63.5 0.000 59.5 0.000 49.3 0.000 59.92 0.000 51.6 0.000
Brand
Aspirational Appeal Communication Appeal
Brand
Relevance
Brand
Expression
Brand’s Value
Communication Point
Brand
Reinforcement
Emotional Appeal Rational Appeal
Brand
Knowledge Brand Image
Brand
Satisfaction
Brand
Efficiency
Brand
Performance

International Journal of Advanced Scientific Research and Management, Volume 3 Issue 10, Oct 2018
www.ijasrm.com
ISSN 2455-6378
211
Table 7: Structure Matrix and Group Centroid
DIMENSIONS X axis values Y axis
values
Emotional Appeal .949* 0.085
Rational Appeal .944* 0.223
Aspirational Appeal .740* 0.63
Communication
Appeal .753
* 0.263
Yummy -0.172 -0.101
Yippee -0.36 0.08
Maggi 0.532 0.021
Pooled within-groups correlations between
discriminating variables and standardized canonical
discriminant functions.
Variables ordered by absolute size of correlation
within function.
*Largest absolute correlation between each variable
and any discriminant function
Figure 1: Multi-Dimensional Scaling for Ready to
Eat Noodles Brands
5.5 Brand Attractiveness Quotient of the three
Brands
This study draws partially the method of
calculation of Brand Attractiveness Quotient used
in TRA Brand Trust Report (2013). Some
adaptations have been done based on the questions
included in the questionnaire. The Attractiveness
Quotient has been calculated based on the
following parameters:
o Brand Recall: The number of times a
brand’s name occurs
o Position score: Calculated on the basis of
respondent’s recall preference.
o Suitability score given to each brand with
relation to the specific attribute, measured
as the Standard Deviation of the brand’s
suitability to the overall suitability
Standard Deviation
o Brand Average suitability, measured as the
mean of the brand’s suitability for each
attribute
For our study we have used the same quotient
(described mathematically in an equation) stated
above with some modifications, according to the
suitability of the study (TRA Brand Trust Report,
2013). The equation used comprises of all the four
parts Brand Recall, Position Score, Standard
deviation suitability score and the Brand Average
suitability score. This can be represented
mathematically as Eq. (1):
Where,
: Represents overall 4 brand appeals’
standard deviation value (cumulative)
: Represents all ith brand appeals’
standard deviation
: Represents ith
brand recall frequency
to total respondents
: Represents ith brand relative position
score
: Represents ith
brand appeals’ average
value
The following table represents the same for the
three brands:
Table 8: Attractiveness Quotient of the three
Brands
is 1.415 which represents the grand average of
overall standard deviations of four appeals for all
the three brands taken together. The ith brand
appeals’ standard deviation ( ) is for Yummy,
Yippee and Maggi are 1.3029, 1.1392 and 1.085 -
this means that Maggi has the least deviations in
responses among the consumers followed by
Yippee and then Yummy. This is the reason why
reflect the order of Maggi, followed by Yippee
and then Yummy, even though Yummy has higher
Yummy 1.415 1.3029 1.086 3 0.5 63 0.525 4.685 1.336
Yippee 1.415 1.1392 1.242 2 0.667 100 0.833 4.578 3.159
Maggi 1.415 1.085 1.304 1 0.833 113 0.942 5.368 5.493
Brand
Recall
Frequency
Brand
Recall
Score
Brand
Average
Brand
Attractiveness
Quotient
Position
Score
BrandRecall
Position
International Journal of Advanced Scientific Research and Management, Volume 3 Issue 10, Oct 2018
www.ijasrm.com
ISSN 2455-6378
212
mean values than Yippee. The overall four brand
appeals’ standard deviation value (which is the
same for all the three brands) divided by individual
brand average of four appeals’ standard deviation
reflect the highest score of 1.304 for Maggi,
seconded by Yippee 1.242 and then by Yummy
1.086. The brand recall position and frequency
reflect the same rankings. We have given score to
position by dividing the recall position by
summation of all position score i.e. 6, and then by
subtracting that value by 1. Yummy’s score is 0.5,
Yippee’s is 0.667 and Maggi’s is 0.833. The Brand
recall score is nothing but Brand Recall number
divided by total number of respondents (120 for
ready to eat noodles category). Yummy’s score is
0.525, Yippee’s is 0.833 and Maggi’s is 0.942.
Brand Average mean reflects the average of the
mean scores of all the respondents for each brand.
Thus by multiplying these four components (as
given in Eq.1) i.e. Standard deviation score,
Position score, Brand Recall score and the Brand
Average score we derive the Brand Attractiveness
Quotient. What we see in the noodles category is
concisely what has reflected in all our above
analysis, i.e. Maggi has the highest attractiveness
quotient of 5.493, followed by Yippee 3.159 and
then by Yummy 1.336. This reflects the gap in
attractiveness among the brands and clearly
Yummy lags behind in attractiveness and both
Maggi and Yippee exceed in attractiveness by a
good margin.
6. Conclusion
This section discusses the various marketing
implications of the analysis done in the previous
sections. 41 variables were measured on the scale,
which was tested for reliability and validity. The
overall Cronbach’s alpha coefficient was .981. The
emotional appeal primarily reflects the brands’
connect with its customers like whether the brand
triggers some memory or brand is familiar and
recognized. Maggi scores the most w.r.t. Emotional
Appeal followed by Yippee and Yummy. This is so
because Maggi is the oldest player in the market
and it occupies a special place in the consumption
basket of every household not only in Assam but
also in India. Under this study, rational appeal
majorly reflects on the factual side of a consumer
that means the cost factor, distribution and the
share of wallet, etc. The mean values reflect that
Maggi is a step ahead of Yummy and Yippee. Also
in case of Aspirational appeal, which reflect the
motivating factors for a consumer to pick up a
product, also reflect the same trend. The
communication appeal reflects all forms of
communication to the consumers. Again Maggi has
the highest mean value but Yummy and Yippee
follow closely. In case of both Aspiration and
Communication appeal, Maggi is the frontrunner
again compared to Yummy and Yippee. This
implies that the consumers strongly associate to the
brand.
MDS implication: The global brand Maggi has
strong association with Emotional, Aspirational and
Communication Appeal but it has the potential to
go even stronger. On the other hand, the local
brand Yummy falls in the third quadrant. Both the
local and national brand have a long way to go but
Yummy is slightly closer to all the appeals than
Yippee.
Maggi has the highest attractiveness quotient of
5.493, followed by Yippee 3.159 and then by
Yummy 1.336. This reflects the gap in
attractiveness among the brands and clearly
Yummy lags behind in attractiveness and both
Maggi and Yippee exceed in attractiveness by a
good margin. Though Yummy has better mean
values than Yippee, it still lags behind because of
individual Standard Deviation ( ). Yummy is the
most inconsistent in consumer responses, resulting
in high deviations. All the above analysis reflects
that the Local Brand Yummy is the least attractive
compared to the National Brand Yippee and Global
Brand Maggi. This is of grave concern as the
success of a local brand is of great importance to
the state of origin. The above brand attractiveness
analysis also points out that positioning a local
brand is very difficult as there is no special appeal
attached to it.

International Journal of Advanced Scientific Research and Management, Volume 3 Issue 10, Oct 2018
www.ijasrm.com
ISSN 2455-6378
213
Appendix I-
Screener Questionnaire
Name: _____________________ Email/ Phone no. ____________
Gender: M F
Age (in years): 13-19 20-30 30-3 35-40 40 +
Marital Status: Married Single Divorced
Family Size: <4 4-6 6-8 >8
Do you purchase the day to day grocery items for your household?
YES NO
Are you also the decision maker of the same?
YES NO
Name 9 Noodles brands which you can recall now: (3 multinational brands, 3 national brands and 3 local/ regional brands)
Brand 1 Brand 2 Brand 3
Multinational
National
Local/ Regional
Main Questionnaire Please indicate how much you agree or disagree with each of the following statements for each of the 3 brands separately:
Key to answer:
SCALE 1 2 3 4 5 6 7
MEANING Strongly
Disagree
Disagree Somewhat
Disagree
Neither
Agree
nor
Disagree
Somewhat
Agree
Agree Strongly
Agree

International Journal of Advanced Scientific Research and Management, Volume 3 Issue 10, Oct 2018
www.ijasrm.com
ISSN 2455-6378
214
ATTRIBUTES
1. It is a familiar brand 1 2 3 4 5 6 7 1 2 3 4 5 6 7 1 2 3 4 5 6 7
2. You can recognize the products that the
brand offers1 2 3 4 5 6 7 1 2 3 4 5 6 7 1 2 3 4 5 6 7
3. The brand delivers on its potential (in
comparison with others)1 2 3 4 5 6 7 1 2 3 4 5 6 7 1 2 3 4 5 6 7
4. Feeling of association (the sense of self)
with the brand1 2 3 4 5 6 7 1 2 3 4 5 6 7 1 2 3 4 5 6 7
5. The brand provides a distinct advantage
on usage, compared with others. 1 2 3 4 5 6 7 1 2 3 4 5 6 7 1 2 3 4 5 6 7
6. There is a connection/ bond established
with the brand. 1 2 3 4 5 6 7 1 2 3 4 5 6 7 1 2 3 4 5 6 7
7. You are happy with the brand at all levels
put together (i.e., cost, distinctiveness, and
taste)
1 2 3 4 5 6 7 1 2 3 4 5 6 7 1 2 3 4 5 6 7
8. Brand triggers memory and thoughts 1 2 3 4 5 6 7 1 2 3 4 5 6 7 1 2 3 4 5 6 7
9. Brand exudes alertness 1 2 3 4 5 6 7 1 2 3 4 5 6 7 1 2 3 4 5 6 7
10. Brand reflects confidence 1 2 3 4 5 6 7 1 2 3 4 5 6 7 1 2 3 4 5 6 7
11. The brand’s appearance is comforting
(brand presence is soothing)1 2 3 4 5 6 7 1 2 3 4 5 6 7 1 2 3 4 5 6 7
12. The brand qualities match your
expectation from the product1 2 3 4 5 6 7 1 2 3 4 5 6 7 1 2 3 4 5 6 7
13. Heard positive feedback of the brand from
peers/ users of the brand1 2 3 4 5 6 7 1 2 3 4 5 6 7 1 2 3 4 5 6 7
14. The brand is easy to understand 1 2 3 4 5 6 7 1 2 3 4 5 6 7 1 2 3 4 5 6 7
15. Experience is always positive with the
brand whenever it comes in contact (used,
seen or spoken about
1 2 3 4 5 6 7 1 2 3 4 5 6 7 1 2 3 4 5 6 7
16. The brand adheres to Market standard 1 2 3 4 5 6 7 1 2 3 4 5 6 7 1 2 3 4 5 6 7
17. The brand is always well presented 1 2 3 4 5 6 7 1 2 3 4 5 6 7 1 2 3 4 5 6 7
18. The brand follows a systematic process in
its action1 2 3 4 5 6 7 1 2 3 4 5 6 7 1 2 3 4 5 6 7
19. The actions taken by the brand is
understandable1 2 3 4 5 6 7 1 2 3 4 5 6 7 1 2 3 4 5 6 7
20. The brand demonstrates a good track
record1 2 3 4 5 6 7 1 2 3 4 5 6 7 1 2 3 4 5 6 7
21. The brand’s visibility has increased over
the years1 2 3 4 5 6 7 1 2 3 4 5 6 7 1 2 3 4 5 6 7
22. The brand has become popular over the
years1 2 3 4 5 6 7 1 2 3 4 5 6 7 1 2 3 4 5 6 7
23. The brand meets ‘Value for money’
proposition/ right price bracket1 2 3 4 5 6 7 1 2 3 4 5 6 7 1 2 3 4 5 6 7
24. The cost of product is justified with
respect to the value provided (Is it worth the
money?)
1 2 3 4 5 6 7 1 2 3 4 5 6 7 1 2 3 4 5 6 7
25. The brand is easily accessible 1 2 3 4 5 6 7 1 2 3 4 5 6 7 1 2 3 4 5 6 7
26. Owning the brand, makes you satisfied 1 2 3 4 5 6 7 1 2 3 4 5 6 7 1 2 3 4 5 6 7
27. Owning the brand, makes you proud 1 2 3 4 5 6 7 1 2 3 4 5 6 7 1 2 3 4 5 6 7
28. Feeling of connection with the brand 1 2 3 4 5 6 7 1 2 3 4 5 6 7 1 2 3 4 5 6 7
29. Usage of the brand, gets you compliments 1 2 3 4 5 6 7 1 2 3 4 5 6 7 1 2 3 4 5 6 7
30. When you spoke about the brand to your
peers, acknowledgement was received1 2 3 4 5 6 7 1 2 3 4 5 6 7 1 2 3 4 5 6 7
31. The brand gives priority to continuous
engagement with its audience.1 2 3 4 5 6 7 1 2 3 4 5 6 7 1 2 3 4 5 6 7
32. The brand appeals to your fashionable
side1 2 3 4 5 6 7 1 2 3 4 5 6 7 1 2 3 4 5 6 7
33. The brand message is clear 1 2 3 4 5 6 7 1 2 3 4 5 6 7 1 2 3 4 5 6 7
34. While shopping at Airport/ Big Bazaar/
other modern retail shops, the corner
dedicated to the brand attracted you
1 2 3 4 5 6 7 1 2 3 4 5 6 7 1 2 3 4 5 6 7
35. The posters/ billboards of brand are
attractive 1 2 3 4 5 6 7 1 2 3 4 5 6 7 1 2 3 4 5 6 7
36. The promotional offers the brand are
useful1 2 3 4 5 6 7 1 2 3 4 5 6 7 1 2 3 4 5 6 7
37. The brand gives priority on building trust
with stakeholders.1 2 3 4 5 6 7 1 2 3 4 5 6 7 1 2 3 4 5 6 7
38. The brand action arises from interactive
engagement.1 2 3 4 5 6 7 1 2 3 4 5 6 7 1 2 3 4 5 6 7
39. The brand meets all the standards (taste,
fragrance, appearance, etc.) as promised in all
its communication (TV, Radio, Print, etc.)
1 2 3 4 5 6 7 1 2 3 4 5 6 7 1 2 3 4 5 6 7
40. The brand packaging attracts you 1 2 3 4 5 6 7 1 2 3 4 5 6 7 1 2 3 4 5 6 7
41. The brand packaging stands out amongst
its competitors1 2 3 4 5 6 7 1 2 3 4 5 6 7 1 2 3 4 5 6 7
YUMMY MAGGI YIPPEE

International Journal of Advanced Scientific Research and Management, Volume 3 Issue 10, Oct 2018
www.ijasrm.com
ISSN 2455-6378
215
ATTRIBUTES
1. It is a familiar brand 1 2 3 4 5 6 7 1 2 3 4 5 6 7 1 2 3 4 5 6 7
2. You can recognize the products that the
brand offers1 2 3 4 5 6 7 1 2 3 4 5 6 7 1 2 3 4 5 6 7
3. The brand delivers on its potential (in
comparison with others)1 2 3 4 5 6 7 1 2 3 4 5 6 7 1 2 3 4 5 6 7
4. Feeling of association (the sense of self)
with the brand1 2 3 4 5 6 7 1 2 3 4 5 6 7 1 2 3 4 5 6 7
5. The brand provides a distinct advantage
on usage, compared with others. 1 2 3 4 5 6 7 1 2 3 4 5 6 7 1 2 3 4 5 6 7
6. There is a connection/ bond established
with the brand. 1 2 3 4 5 6 7 1 2 3 4 5 6 7 1 2 3 4 5 6 7
7. You are happy with the brand at all levels
put together (i.e., cost, distinctiveness, and
taste)
1 2 3 4 5 6 7 1 2 3 4 5 6 7 1 2 3 4 5 6 7
8. Brand triggers memory and thoughts 1 2 3 4 5 6 7 1 2 3 4 5 6 7 1 2 3 4 5 6 7
9. Brand exudes alertness 1 2 3 4 5 6 7 1 2 3 4 5 6 7 1 2 3 4 5 6 7
10. Brand reflects confidence 1 2 3 4 5 6 7 1 2 3 4 5 6 7 1 2 3 4 5 6 7
11. The brand’s appearance is comforting
(brand presence is soothing)1 2 3 4 5 6 7 1 2 3 4 5 6 7 1 2 3 4 5 6 7
12. The brand qualities match your
expectation from the product1 2 3 4 5 6 7 1 2 3 4 5 6 7 1 2 3 4 5 6 7
13. Heard positive feedback of the brand from
peers/ users of the brand1 2 3 4 5 6 7 1 2 3 4 5 6 7 1 2 3 4 5 6 7
14. The brand is easy to understand 1 2 3 4 5 6 7 1 2 3 4 5 6 7 1 2 3 4 5 6 7
15. Experience is always positive with the
brand whenever it comes in contact (used,
seen or spoken about
1 2 3 4 5 6 7 1 2 3 4 5 6 7 1 2 3 4 5 6 7
16. The brand adheres to Market standard 1 2 3 4 5 6 7 1 2 3 4 5 6 7 1 2 3 4 5 6 7
17. The brand is always well presented 1 2 3 4 5 6 7 1 2 3 4 5 6 7 1 2 3 4 5 6 7
18. The brand follows a systematic process in
its action1 2 3 4 5 6 7 1 2 3 4 5 6 7 1 2 3 4 5 6 7
19. The actions taken by the brand is
understandable1 2 3 4 5 6 7 1 2 3 4 5 6 7 1 2 3 4 5 6 7
20. The brand demonstrates a good track
record1 2 3 4 5 6 7 1 2 3 4 5 6 7 1 2 3 4 5 6 7
21. The brand’s visibility has increased over
the years1 2 3 4 5 6 7 1 2 3 4 5 6 7 1 2 3 4 5 6 7
22. The brand has become popular over the
years1 2 3 4 5 6 7 1 2 3 4 5 6 7 1 2 3 4 5 6 7
23. The brand meets ‘Value for money’
proposition/ right price bracket1 2 3 4 5 6 7 1 2 3 4 5 6 7 1 2 3 4 5 6 7
24. The cost of product is justified with
respect to the value provided (Is it worth the
money?)
1 2 3 4 5 6 7 1 2 3 4 5 6 7 1 2 3 4 5 6 7
25. The brand is easily accessible 1 2 3 4 5 6 7 1 2 3 4 5 6 7 1 2 3 4 5 6 7
26. Owning the brand, makes you satisfied 1 2 3 4 5 6 7 1 2 3 4 5 6 7 1 2 3 4 5 6 7
27. Owning the brand, makes you proud 1 2 3 4 5 6 7 1 2 3 4 5 6 7 1 2 3 4 5 6 7
28. Feeling of connection with the brand 1 2 3 4 5 6 7 1 2 3 4 5 6 7 1 2 3 4 5 6 7
29. Usage of the brand, gets you compliments 1 2 3 4 5 6 7 1 2 3 4 5 6 7 1 2 3 4 5 6 7
30. When you spoke about the brand to your
peers, acknowledgement was received1 2 3 4 5 6 7 1 2 3 4 5 6 7 1 2 3 4 5 6 7
31. The brand gives priority to continuous
engagement with its audience.1 2 3 4 5 6 7 1 2 3 4 5 6 7 1 2 3 4 5 6 7
32. The brand appeals to your fashionable
side1 2 3 4 5 6 7 1 2 3 4 5 6 7 1 2 3 4 5 6 7
33. The brand message is clear 1 2 3 4 5 6 7 1 2 3 4 5 6 7 1 2 3 4 5 6 7
34. While shopping at Airport/ Big Bazaar/
other modern retail shops, the corner
dedicated to the brand attracted you
1 2 3 4 5 6 7 1 2 3 4 5 6 7 1 2 3 4 5 6 7
35. The posters/ billboards of brand are
attractive 1 2 3 4 5 6 7 1 2 3 4 5 6 7 1 2 3 4 5 6 7
36. The promotional offers the brand are
useful1 2 3 4 5 6 7 1 2 3 4 5 6 7 1 2 3 4 5 6 7
37. The brand gives priority on building trust
with stakeholders.1 2 3 4 5 6 7 1 2 3 4 5 6 7 1 2 3 4 5 6 7
38. The brand action arises from interactive
engagement.1 2 3 4 5 6 7 1 2 3 4 5 6 7 1 2 3 4 5 6 7
39. The brand meets all the standards (taste,
fragrance, appearance, etc.) as promised in all
its communication (TV, Radio, Print, etc.)
1 2 3 4 5 6 7 1 2 3 4 5 6 7 1 2 3 4 5 6 7
40. The brand packaging attracts you 1 2 3 4 5 6 7 1 2 3 4 5 6 7 1 2 3 4 5 6 7
41. The brand packaging stands out amongst
its competitors1 2 3 4 5 6 7 1 2 3 4 5 6 7 1 2 3 4 5 6 7
YUMMY MAGGI YIPPEE

International Journal of Advanced Scientific Research and Management, Volume 3 Issue 10, Oct 2018
www.ijasrm.com
ISSN 2455-6378
216
Acknowledgement
This research work wouldn’t have been possible
without the contributions of the HOD, Faculty and
Staff of the MBA Dept., Gauhati University. We
would like to thank all the consumer respondents
for taking out the time to fill in the survey. We
would also thank our families for their support.
References
[1] AA Nutritions.
http://www.yummyfoods.co.in/, Accessed
Feb 10, 2016.
[2] Aaker D A, Building Strong Brands. The
Free Press, (1996).
[3] Ataman M B, Mela C F and Heerde H J,
Consumer Packaged Goods in France:
National Brands, Regional Chains, and Local
Branding. Journal of Marketing Research,
Vol 44(Issue 1): 14-20, (2007).
[4] Batra R, Ramaswamy V, Alden D L ,
Steenkamp J B E M and Ramachander S,
Effects of Brand Local and Nonlocal Origin
on Consumer Attitudes in Developing
Countries. Journal of Consumer Psychology,
9(2), 83-95, (2000).
[5] Benedict J, Steenkamp, J B E M, Batra R and
Alden D L, How Perceived Brand
Globalness (PBG) Creates Brand Value.
Journal of International Business Studies,
Vol. 34, No. 1, pp. 53-65, (2003).
[6] Brand Panaroma (LLC), The Impact of
Consumer-Brand Relationships on Market
Value. Brand Panaroma from Insight to
Outlook, (2013).
[7] Bronnenberg B J, Dhar S K and Dube J P,
Consumer Packaged Goods (CPG) in the
United States: National Brands, Local
Branding. Journal of Marketing Research,
Vol. 44, No. 1, pp. 4-13, (2007).
[8] Bronnenberg B J, Dhar S K and Dube J P,
National Brands, Local Branding:
Conclusions and Future Research
Opportunities. Journal of Marketing
Research, Vol. 44, No. 1, pp. 26-32, (2007).
[9] Churchill G A, A Paradigm for Developing
Better Measures of Marketing Constructs.
Journal of Marketing Research, Vol XVI
(February), 64-73, (1979).
[10] Collinson S and Rugman A M, The
Regional Nature of Japanese Multinational
Business. Journal of International Business
Studies, Vol. 39, No. 2, pp. 215-230, (2008).
[11] Cronbach L J, Coefficient alpha and the
internal structure of tests. Psychometrika, 16,
297- 334, (1951).
[12] Currás-Pérez R, Bigné-Alcañiz E and
Alvarado-Herrera A, The Role of Self-
[13] Definitional Principles in Consumer
Identification with a Socially Responsible
Company. Journal of Business Ethics, Vol.
89, No. 4, pp. 547-564, (2009).
[14] Dewsnap B and Jobber D, The Sales-
Marketing Interface in Consumer Packaged-
Goods Companies: A Conceptual
Framework. The Journal of Personal Selling
and Sales Management, 20(2), 109-119,
(2000).
[15] Douglas S P, Craig C S and Nijssen E J,
Integrating Branding Strategy across
Markets: Building International Brand
Architecture. Journal of International
Marketing, Vol. 9, No. 2 (2001), pp. 97-114,
(2001).
[16] Feldman A, How to Make a Brand More
Attractive to Licensees and Retailers.
LMCA, (2016).
[17] Gao G Y, Pan Y, Tse D K and Yim C K,
Market Share Performance of Foreign and
Domestic Brands in China. Journal of
International Marketing, 14(2), 32-51,
(2006).
[18] India Brand Equity Foundation (IBEF), Food
Processing. www.ibef.org, Accessed August
2017, (2017).
[19] Indian Tobacco Company (ITC).
http://www.itcportal.com/businesses/fmcg/fo
ods/yippee.aspx, Accessed Jan 23, 2016.
[20] Indian Tobacco Company (ITC).
http://www.sunfeastyippee.com/, Accessed
Jan 23, 2016.
[21] IS Advisors, FMCG Sector in India:
Strategic Review (Budget 2013-14), (2013).
[22] Schuiling I and Kapferer J N, Real
Differences between Local and International
Brands: Strategic Implications for
International Marketers. Journal of
International Marketing, Vol. 12, No. 4, 97-
112, (2004).
[23] Keller K L, Building customer-based brand
equity: A blueprint for creating strong
brands. Journal of Marketing Management,
10, 15-19, (2001).
[24] Keller K L and Aaker D A, Corporate-level
marketing: The impact of credibility on a
company's brand extensions. Corporate
Reputation Review, l, 356-378, (1998).
[25] Keller K L, Brand Synthesis: The
Multidimensionality of Brand Knowledge.
The Journal of Consumer Research, Vol. 29,
No. 4, pp. 595-600, (2003).

International Journal of Advanced Scientific Research and Management, Volume 3 Issue 10, Oct 2018
www.ijasrm.com
ISSN 2455-6378
217
[26] Keller K L, Strategic Brand Management:
Building, Measuring, and Managing Brand
Equity. 4th Edition, Pearson, (2006).
[27] Keller K L and Lehmann D R, Brands and
Branding: Research Findings and Future
Priorities. Marketing Science, 25 (6), 740–
59, (2006).
[28] Keller K L, Parameswaran M G and Jacob I,
Strategic Brand Management. 3rd
Edition,
Pearson, (2011).
[29] Kerner N and Pressman G, Chasing Cool
Theory: Standing Out in Today’s Cluttered
Marketplace. Atria Books, (2007).
[30] Kothari C R, Research Methodology:
Methods & Technique. 2nd
Edition, New Age
International (P) Ltd, (2004).
[31] Kothari C R, Quantitative Techniques. 3rd
edition, Vikas Publishing House, (2009).
[32] Lewis C and Stubbs S, National Expansion
of British regional brands: parallels with
internationalization. Journal of Product &
Brand Management, Vol. 8, Issue: 5, 369-
386, (1999).
[33] Malhotra K N. Measurement and Scaling:
Non - Comparative Scaling Techniques. In:
Marketing Research: An Applied
Orientation, Fourth Edition, Pearson
Education, 254-277, (2005).
[34] Malhotra N K and Dash S, Marketing
Research: An Applied Orientation. 6th
Edition, Pearson India, (2010).
[35] Ministry of food processing India (MOFPI),
Annual Reports. Government of India,
(2004- 2014).
[36] Nagashima A, A Comparison of Japanese
and U.S. Attitudes toward Foreign Products.
Journal of Marketing, Vol. 34, 68-74, (1970).
[37] Nestle. https://www.nestle.in/brands/maggi2-
minutenoodles, Accessed Jan. 20, 2016.
[38] Niffenberger P, White J and Marmet G, How
British Retail Managers View French and
American Products. European Journal of
Marketing, 14(8), 493-498, (1980).
[39] Nunnally J C and Bernstein I H,
Psychometric theory. 3rd
edition, New York:
McGraw Hill, (1994).
[40] Obenniller C and Spangenberg E. Exploring
the effects of country of origin labels: An
information processing framework. In:
Thomas K. Srull, editor, Advances in
consumer research, Provo, Utah: Association
for Consumer Research, Vol. 16, 454-59,
(1989).
[41] Papadopoulos N G, Heslop L A, Garby F and
Avlonitis G, Does 'country of origin' matter?
Some findings from a cross-cultural study of
consumer views about foreign products.
Report No. 87-104. Cambridge, Mass.:
Marketing Science Institute, (1987).
[42] Parameswaran R and Attila Y, A cross-
national comparison of consumer research
measures. Journal of International Business
Studies, 18(1), 35-49, (1987).
[43] Pérez R C, Alcañiz E B and Herrera A A,
The Role of Self-Definitional Principles in
Consumer Identification with a Socially
Responsible Company. Journal of Business
Ethics, 89(4), 547-564, (2009).
[44] Peter J P, Construct Validity: A Review of
Basic Issues and Marketing Practices.
Journal of Marketing Research, Vol XVIII
(May), 133-145, (1981).
[45] PwC report, Innovation in FMCG. PwC,
(2013).
[46] Reierson C, Are foreign products seen as
national stereotypes? Journal of Retailing, 42
(Fall), 33-40, (1966).
[47] Riezebos R and Grinten J V D, Positioning
the Brand: An inside out approach. 3rd
Edition, Routledge, (2012).
[48] Roth M S and Jean B R, Matching product
category and country image perceptions: A
framework for managing country-of-origin
effects. Journal of International Business
Studies, 23(3), 477-97, (1992).
[49] Rugman A M and Verbeke A, A Perspective
on Regional and Global Strategies of
Multinational Enterprises. Journal of
International Business Studies, Vol. 35, No.
1 (Jan., 2004), 3-18, (2004).
[50] Saeed S, Carape L, Shimp T and Snyder D
(1990). Consumers' cognitive structures for
countries and their products. Enhancing
knowledge development in marketing. In
William Bearden et al., editors, Enhancing
knowledge development in marketing, Vol. 1
(Summer), 43, (1990).
[51] Schooler, Robert D and Sunoo D H,
Consumer Perceptions of International
Products: Regional vs. National Labelling.
Social Science Quarterly, 49(4), 886-890,
(1969, 1971).
[52] Schuiling I and Kapferer J N, Real
Differences between Local and International
Brands: Strategic Implications for
International Marketers. Journal of
International Marketing, Vol. 12, No. 4, 97-
112, (2004).
[53] Sengupta S, Brand Positioning: Strategies for
Competitive Advantage. 2nd
Edition, Tata
McGraw-Hill, (2005).
[54] Shimp, Terence A, Samiee S. and Madden T,
Countries and their products: A cognitive
structure perspective. Journal of the

International Journal of Advanced Scientific Research and Management, Volume 3 Issue 10, Oct 2018
www.ijasrm.com
ISSN 2455-6378
218
Academy of Marketing Science, 21 (Fall),
323-30, (1993).
[55] Spiegler E D, Hildebrand C and Michahelles
F. Increasing Brand Attractiveness and Sales
through Social Media Comments on Public
Displays – Evidence from a Field
Experiment in the Retail Industry.
Proceedings of the 10th
international
conference on Pervasive Computing,
ResearchGate, (2012).
[56] Stephens, Keith T, Fox H W and Leonard M
J. A comparison of preferences concerning
the purchase of domestic vs. imports. In
Naresh K. Malhotra, editor, Developments in
marketing science, Coral Gables, Fl.:
Academy of Marketing Science, 8, 100-104,
(1985).
[57] The Trust Advisory Pvt. Ltd. (2013). The
Brand Trust Report, Comniscient Group,
(2013).
[58] The World Food India 2017. MOFPI Annual
Report, http://www.mofpi.nic.in,
www.worldfoodindia.nic.in, Accessed July,
2017, (2016-2017)
[59] Till B D and Busier M, The Match-up
Hypothesis: Physical Attractiveness,
Expertise, and the Role of Fit on Brand
Attitude, Purchase Intent and Brand Beliefs.
Journal of Advertising, Vol. 29 (No. 3), 1-13,
(2000).
[60] Tse D K and Gorn G J, An Experiment on
the Salience of Country-of-Origin in the Era
of Global Brands. Journal of International
Marketing, 1(1), 57-76, (1993).
[61] Underwood R L and Klein N M, Packaging
as Brand Communication: Effects of Product
Pictures on Consumer Responses to the
Package and Brand. Journal of Marketing
Theory and Practice, Vol. 10, No. 4, pp. 58-
68, (2002).
[62] Underwood R L, The Communicative Power
of Product Packaging: Creating Brand
Identity via Lived and Mediated Experience.
Journal of Marketing Theory and Practice,
Vol. 1, (2003).