Embed Size (px)
Citation preview

ISSN 2321 - 2535

Published By
Shri Vaishnav Institute of Management
Scheme No 71, Gumasta Nagar
Madhya Pradesh, Indore, India
Pin code 452009, Phone: 0731-2789925, 2780011
www.svimi.org
Copyright: Shri Vaishnav Institute of Management Indore, India.
All efforts are made to ensure correctness of the published information. However, Shri
Vaishnav Institute of Management Indore is not responsible for any errors caused due to
oversight or otherwise. The views expressed in this publication are purely personal judgments
of the authors and do not reflect the views of Shri Vaishnav Institute of Management Indore.
All efforts are made to ensure that published information is free from copyright violations.
However, authors are personally responsible for any copyright violation.

Chief Patron
Mr. Purushottamdas Pasari
Chairman
Mr. Kailash Chandra Agar
Secretary
Patron Dr. J.S.Panwar
Director, Shri Vaishnav Institute of Management, Indore
Editorial Board
Members
Prof. P. N. Mishra
Professor, Institute of Management Studies, Devi Ahilya University,
Indore
Prof. Nageshwar Rao
Professor, Pt. J. N. Institute of Business Management, Vikram University,
Ujjain.
Prof. Rajendra Prasad Das
Director, Institute of Management, Pt. R. S. University Raipur
Prof. P. K. Jain
Director, F.M.S MLS University, Udaipur
Prof. B. A. Prajapati
North Gujrat University,Patan
Prof. G. C. Maheshwari
M.S.University, Baroda, Gujarat
Prof. H. J. Jani Director MBA Program, Sardar Patel University, Anand Gujrat
Prof. Renuka Garg Professor & Head, Department of Business & Industrial
Management, South Gujarat University, Surat
Prof. Hemant Trivedi Professor, Marketing Strategies, School of Petroleum Management, Gandhi
Nagar
Prof. Pramod Paliwal Professor, Marketing, School of Petroleum Management,
Gandhi Nagar
Chief Editor Dr. Manasranjan Dashmishra, Associate Professor
Editor Dr. Sonal Chaudhary, Associate Professor
Editorial Team Dr. Manohar Kapse, Associate Professor
Dr. Vishnu Mishra, Associate Professor
Ms. Anuradha Pathak, Assistant Professor
Ms. Shruti P Maheshwari, Assistant Professor
Mr. Arnav Chowdhury, Assistant Professor
Technical Team
Mr. Shailesh Maheshwari, Assistant Professor
Mr. Manish Sharma, Computer Operator
Ms. Archana Dwivedi, Computer Operator

Editorial
SVIM e-journal of Applied Management is a double-blind peer-reviewed, open-
access journal published by Shri Vaishnav Institute of Management, Indore. The
journal carries research papers and analytical articles pertaining to the following
areas: strategic management, financial management, human resource
management, entrepreneurship, services, corporate governance, marketing, e-
business, information technology management, production & operations
management, decision analysis, management research methods and managerial
economics, etc.
The journal provides an academic platform for professionals and researchers to
contribute and share their research work with the larger academic fraternity. SVIM
e-journal of Applied Management carries original and full-length research papers /
articles that reflect the latest research and developments in both theoretical and
practical domain of business and management. The journal is published in online
version with free access and downloading facility. We have received a good
number of papers for this inaugural issue which were reviewed by an expert
committee and only 10 papers were recommended for publishing.
We congratulate all the authors for meticulously writing the papers that have gone
into this inaugural issue of the journal. We thankfully acknowledge the co-
operation, guidance and suggestions received from the expert review committee,
publications committee and other colleagues who have helped directly or
indirectly in bringing out this first volume in time. We also take this opportunity
to thank the Educational Board and Management of SVIM, especially Shri
Purushottamdasji Pasari, Chairman, Shri Kailashchandraji Agar, Secretary, and
the Director Prof. (Dr.) J.S. Panwar for having encouraged and supported us at
every stage.
We are also thankful to Shri V.S. Murthy, Administrative Officer- SVIM and
other technical staffs for their able support.
Dr. Manasranjan Dashmishra
Chief Editor

Contents Page No
Tata Corus Deal: How successful it is Till 2013?
Authors: Ankesh Mundra, Dr. D. T. Manwani
6-12
Recent Trends in Medical Tourism- Global View
Authors: Dr. C. Jothibaskara Mohan
13-19
An Empirical Analysis of Retail Purchase Behaviour to Develop Retail
Marketing Strategy for Global Retailers
Authors: Dr. Rupali Pramanik, Dr.Shakti Prakash, Dr.Gyan Prakash
20-38
Consumption Pattern of Soft Drinks and Fruit Juices: A Comparative Study
Authors: Dr. Simranjeet Kaur Sandhar, Dheeraj Nim, Shikha Agrawal
39-49
A Study of Employee Absenteeism in Hare Ram Cotton Mill of Chhindwara
Authors: Rajshree Barmase, Dr. Harish Shukla
50-63
Summary of the Thesis A Study on Job Discrimination –A Social Exclusion
(With Special Reference To Entry Level Managers)
Authors: Dr Neha Arora
64-78
Changing Patterns of Human Resource Development in Globalization
Authors: Madhuri Aggarwal Akash Datta
79-93
The Role of Contract Farming In Employment & Income Generation of
Farmers & Rural Development In India
Authors: Shailendra Kumar Singh
94-107
E- Commerce: A Key towards Automation
Authors: Kirti Lalwani
108-123
A Study of Glocalization Concept As A Current Trend in Indian Economy.
Authors: Deepti Sharma
124-135

Consumption Pattern of Soft Drinks and Fruit Juices: A Comparative Study ISSN 2321 - 2535
SVIM e-Journal of Applied Management Volume I Issue I January-June 2013 Page 39
Consumption Pattern of Soft Drinks and Fruit Juices: A
Comparative Study
Dr. Simranjeet Kaur Sandhar1 Dheeraj Nim2 Shikha Agrawal3
Abstract
Soft Drinks were common preference among all the individuals before juices were being introduced. With the changing lifestyle and income levels, people are shifting their consumption patterns and have therefore become more health conscious thus leading to increase in demand of juices.
The study focused on the preference and consumption pattern of soft drink and fruit juice on the basis of different age group of people living in Indore city. The study starts with determining the major factors affecting the consumption pattern of soft drinks and fruit juices, and ends up with the conclusion as per the state of mind of the average rational human being. The study concludes that there exists a significant difference between the consumption pattern of the soft drinks and fruit juices in all age groups. The study also remarked the frequency of consuming fruit juices is more than that of soft drinks due to health consciousness of people.
Introduction:
The beverage market is worth $55 billion worldwide. Today’s consumers are concerned
with overall health and wellness. As a result, there is significant impact on food and
beverage purchases. Many studies have shown that consumers are as concerned with
good health as they are about maintaining a high quality of life. The soft drink industry is
training people to seek out new products, even the big guys are coming out with limited-
edition flavors, and consumers are beginning to see that there is more flavor activity going
on in the category. Whether that really nets anybody any sales gains is another thing, but
it is teaching consumers to seek out and try new products. It is also trying to create some
excitement there.
In spite of several challenges and restrictions faced by this industry, it is a ‘roll’ like
never before. Customer preferences may have shifted, but they are still always on the
look out for a can of ‘coke’ or a new ‘flavored’ drink to quench their thirst.
1 Associate Professor, Indore Institute of Science & Technology, Opposite IIM, Rau, Indore. Ph: 8959304002,
[email protected] 2 Assistant Professor, Indore Institute of Science & Technology, Opposite IIM, Rau, Indore. Ph: 9755049750,
[email protected] 3 Sr. Corporate Trainer, Swami Vivekanand College of Engineering, Near Toll Naka, Khandwa Road Indore. Ph: +91-
9926013399, [email protected]

Consumption Pattern of Soft Drinks and Fruit Juices: A Comparative Study ISSN 2321 - 2535
SVIM e-Journal of Applied Management Volume I Issue I January-June 2013 Page 40
The size of the Indian food processing industry is around $ 65.6 billion, including
$20.6 billion of value added products. Of this, the health beverage industry is valued at
$230 million (The Great Indian Bazaar). A health aware nation and a rising interest in
maintaining and improving human life are just a few reasons why fruit and vegetable
demand has risen. Campaigns such as "5 A Day" promoted by the World Health
Organization (WHO) encourage people to consume five fruits or vegetables per day. The
food industry has responded to this demand by developing fresh and nutritional products
with conservation techniques that extend the shelf life of the product (Deliza, 1999).
Recent studies have shown that consumers from the developing countries spend almost
40% of their income on food and beverages. On the other hand consumers in developed
countries allocate only about one quarter of their income on these goods (Selvanathan &
Selvanathan, 2003); (Chen, 2001).
The three largest consumed categories of packaged foods are packed tea, biscuits
and soft drinks. The total soft drink (carbonated beverages and juices) market is
estimated at 284 million crates a year or $1 billion (The Great Indian Bazaar). The market
is highly seasonal in nature with consumption varying from 25 million crates per month
during peak season to 15 million during off-season. The market is predominantly urban
with 25 per cent contribution from rural areas. Coca cola and Pepsi dominate the Indian
soft drinks market.
Today the majority of fruit juice products target children; however there is a need
for a nutritional drink for the adult. The purpose of this study is to develop a better
understanding of consumer’s consumption pattern of soft drinks and fruit juice as well as
the factors that affect these preferences.
Literature Review:
Most of the studies conducted on the customer satisfaction of beverage have been
reviewed in the subsequent section.
Gopi & Arasu, (2012) focused on factor analysis model and its application to
identify consumer preferences for a popular soft drink product in Dharmapuri. The results
depicted that the consumers’ preferences were characterized by four-factors: branding,
validation and prices, packaging and taste, respectively. Rotational factors successfully
extracted the factor of branding as the dominant factor. According to

Consumption Pattern of Soft Drinks and Fruit Juices: A Comparative Study ISSN 2321 - 2535
SVIM e-Journal of Applied Management Volume I Issue I January-June 2013 Page 41
Hutchings (2003), intensifying the fruit colors could strengthen expectation for the
juice flavor. Consumers with high environmental interests were more likely to pay a
premium for a fruit juice with organic ingredients and a nutritional index on the label
(Bonilla, 2010).
Mevlüt Gül, (2012) posited that product types (orange, sour cherry etc.) were
determined as the most important factor on consumers’ fruit juice purchasing preferences
with the rate of 28.34%. Other important factors were found as price level (16.83%),
having an international quality and food safety certificates (16.14%), being organic or not
(15.21%), production methods (13.06%) and containing sugar additive or not (10.43%).
The qualification set of fruit juice which maximizes consumer satisfaction was determined
as “the orange juice which is 100% fruit juice, without sugar additive, organic and has
international quality and food safety certificates and affordable price”.
The scientific studies about fruit juice consumption and consumer preferences are
very limited. One of them is the study which performed in Adana urban area, and socio-
economic factors’ effects on households’ fruit juice consumption are evaluated in this
study by using Tobit model (Ozdes, 1999). In another study which was performed by
using conjoint analysis, consumer behaviors and competition in meat and milk sector in
Erzurum were evaluated (Topçu, 2006). Besides this, fruit juice consumption’s
relationships with demographical variables, such as age, race and diets, were evaluated
in some studies in Germany and USA (Lorinczi, 2009). Moreover, Luckow and Delahunty
(Luckow, 2004) revealed their evaluations in their survey in 2004 about the consumers’
preferences about orange juice containing functional components.
Dhuna and Mukesh (1984) conducted a study to analyze the pattern of
consumption of soft drinks. A sample of 150 respondents was surveyed regarding their
consumption habits. Analysis revealed that 54 per cent of consumption was in summer
and 46 per cent during other seasons. It was found that about 26 per cent of the
respondents were regular consumers and the rest consumed soft drinks occasionally.
Shanmugasundaram (1990) studied soft drink preference in Vellore town of North
Arcot district in Tamil Nadu. The study revealed that the most preferred soft drink among
respondents was Gold Spot (26%) followed by Limca (24.8%), Sprint (22.8%) and
Thums-up (20.8%). It was found that taste was the main factor for preference of particular

Consumption Pattern of Soft Drinks and Fruit Juices: A Comparative Study ISSN 2321 - 2535
SVIM e-Journal of Applied Management Volume I Issue I January-June 2013 Page 42
brand and, among the media; television played a vital role in influencing consumer to go
for particular brand.
Namasivayam and Vijayakumar (2003) reported the consumption of carbonated
soft drinks in selected urban centres in Tamil Nadu. The study revealed that out of 360
respondents, 20.83 per cent of the respondents had the habit of drinking soft drinks
during travel, 16.66 per cent near home and 16.55 per cent in the bus stand.
Respondents aged less than 26 years consumed more soft drinks invariably in all places.
Among these sample respondents, 70.6 per cent were male and 29.4 per cent were
female. It was also found that 37.22 per cent respondents were students in college/
universities and consumed more soft drinks compared to other categories.
Objectives of the Study:
To develop and standardize a measure for studying the consumption pattern of
soft drinks & fruit juices.
To find out the underlying factors affecting consumption pattern of soft drinks &
fruit juices.
To analyze the preference of people (of different age groups) on consumption
patterns of soft drinks & fruit juices.
To open new vistas for further research.
Research Methodology:
The present study is exploratory in nature with survey method being used to
complete the study. The population of the study includes consumers / buyers of soft
drinks and fruit juices. The sample elements of the study were the individual respondents
(Male & Female) with the sample size of 200 respondents. Random sampling technique
was applied to select the sample from the market. Self designed Questionnaire was used
to collect the data for the study. The data was analyzed through the following tools:
1. Internal consistency was established through items to total correlation.
2. Reliability computed to check the questionnaire through Cronach’s (alpha), Split
half, Guttman, Parallel and Strict parallel method.
3. Factor Analysis was applied to identify the factors underlying consumption pattern
of soft drinks and fruit juices.
4. Z - Test was applied to evaluate the significant difference between consumption
pattern of consumers of different age groups consuming soft drinks and fruit juices.

Consumption Pattern of Soft Drinks and Fruit Juices: A Comparative Study ISSN 2321 - 2535
SVIM e-Journal of Applied Management Volume I Issue I January-June 2013 Page 43
Result and Observations:
Item to Total Correlation: Firstly Consistency of the entire items in the questionnaire
was computed by applying item to total correlation analysis. Under this correlation of
every item with total is measured and computed value is compared with the standard
value ( i.e.0.1379) if the computed value is found less than the standard value then the
statement is dropped & will be termed as inconsistent and if the computed value is more
than standard value the statement will termed as consistent.
Table 1: Item to total correlation analysis for consumption pattern of soft drinks
Item Value of r Consistency Accepted/ Dropped
1. I consume soft drink when I feel thirsty 0.466503 Consistency Accepted
2. I consume soft drinks only in parties & celebrations. 0.31904 Consistency Accepted
3. I consume soft drinks without any reason (just like that). 0.559799 Consistency Accepted
4. Price with quantity induces me to buy soft drinks. 0.492195 Consistency Accepted
5. As a health drink I buy soft drink. 0.486237 Consistency Accepted
6. As a status symbol I buy soft drink. 0.463015 Consistency Accepted
7. The taste of it induces me to buy soft drink. 0.684725 Consistency Accepted
8. The variety induces me to buy soft drink. 0.736873 Consistency Accepted
9. Season influences me to buy soft drink. 0.559149 Consistency Accepted
Table 2: Item to total correlation analysis for consumption pattern of fruit juices
Item Value of r Consistency Accepted/ Dropped
10. I consume Fruit juices when I feel thirsty 0.545803 Consistency Accepted
11. I consume Fruit juices only in parties & celebrations. 0.332555 Consistency Accepted
12. I consume Fruit juices without any reason (just like that). 0.583548 Consistency Accepted
13. Price with quantity induces me to buy Fruit juices 0.545476 Consistency Accepted
14. As a health drink I buy Fruit juices. 0.579008 Consistency Accepted
15. As a status symbol I buy Fruit juices. 0.539946 Consistency Accepted
16. The taste of it induces me to buy Fruit juices. 0.687846 Consistency Accepted
17. The variety induces me to buy Fruit juices. 0.641332 Consistency Accepted
18. Season influences me to buy Fruit juices. 0.65663 Consistency Accepted
The Item to total Correlation was more than the standard value for all the factors
affecting the consumption pattern of soft drinks and fruit juices (refer table 1 & 2), so all
the factors are found consistent in the correlation.
Reliability Measures: Reliability test was carried out using SPSS Software and the test
measures are given below.

Consumption Pattern of Soft Drinks and Fruit Juices: A Comparative Study ISSN 2321 - 2535
SVIM e-Journal of Applied Management Volume I Issue I January-June 2013 Page 44
Table 3: Reliability Measure on consumption pattern
Validity:
Face Validity of questionnaires was tested and it was found to be very high.
Factor Analysis: Factor analysis was carried out using SPSS software on consumption
pattern of soft drinks and fruit juices.
Table 4: Factors with various items analyzed for consumption pattern of Soft
drinks.
Factors Eigen value
Convergence of variance Loadings Total
% of variance
Customer Preferences
2.522
28.021
16. The taste of it induces me to buy soft drink. 0.791
17. The variety induces me to buy soft drink. 0.767
18. Season influences me to buy soft drink 0.711
9. I consume soft drinks without any reason (just like that).
0.656
7. I consume soft drink when I feel thirsty 0.404
13. Price with quantity induces me to buy soft drinks. 0.380
Societal Concerns
1.456
16.177
15. As a status symbol I buy soft drink. 0.745
14. As a health drink I buy soft drink. 0.610
8. I consume soft drinks only in parties & celebrations.
0.550
Table 5: Factors with various items analyzed for consumption pattern of Fruit
Juices
Factors
Eigen value
Convergence of variance Loadings Total % of variance
Customer Preferences
2.590
28.777
22. The taste of induces me to buy Fruit juices. 0.774
23. The variety induces me to buy Fruit juices. 0.770
20. As a health drink I buy Fruit juices 0.750
12. I consume Fruit juices without any reason (just like that).
0.630
24. Season influences me to buy Fruit Juice 0.421
Logical Concerns
1.712
19.024
11. I consume Fruit juices only in parties & celebrations.
0.760
10. I consume Fruit juices when I feel thirsty. 0.552
19. Price with quantity induces me to buy fruit juices. 0.527
21. As a status symbol I buy fruit juices. 0.502
Measure Soft Drinks Fruit Juices
Cronbach’s Alpha 0.676 0.735
Split half 0.697 0.704
Guttman 0.686 0.738
Parallel Estimated 0.676 0.735
Unbiased 0.679 0.737
Strict Parallel Estimated 0.638 0.676
Unbiased 0.643 0.681
Consumption Pattern of Soft Drinks and Fruit Juices: A Comparative Study ISSN 2321 - 2535
SVIM e-Journal of Applied Management Volume I Issue I January-June 2013 Page 45
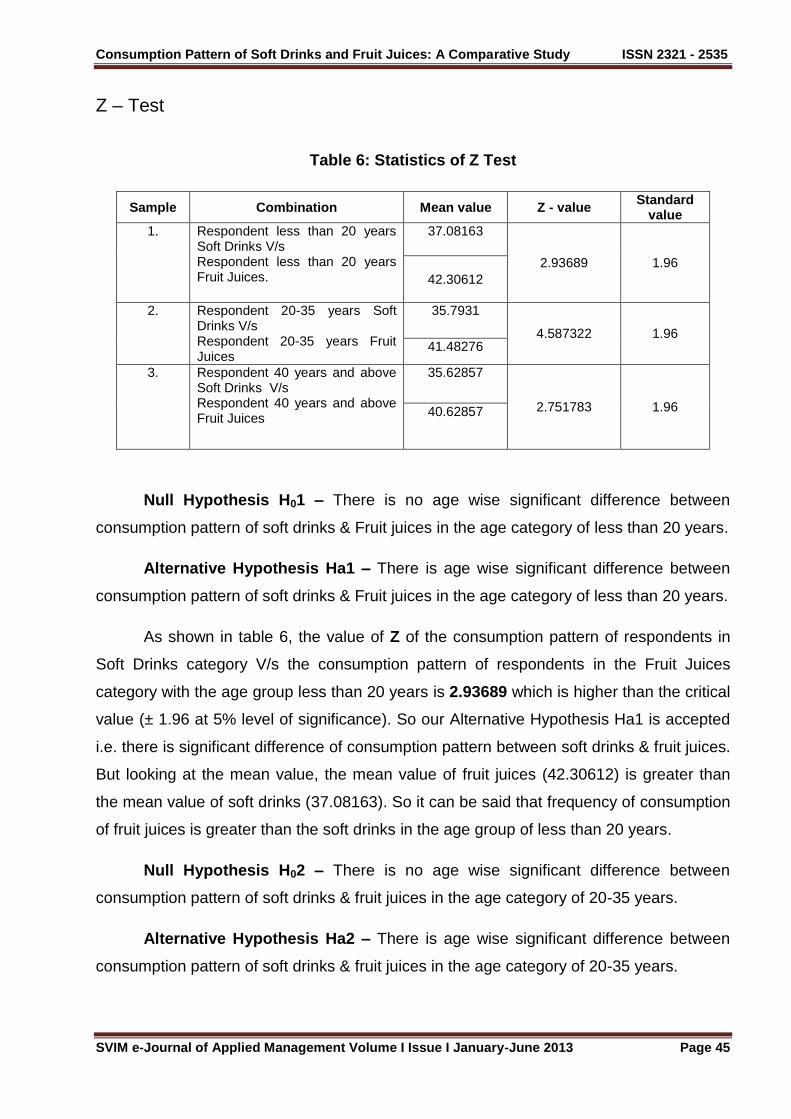
Z – Test
Table 6: Statistics of Z Test
Sample Combination Mean value Z - value Standard
value
1. Respondent less than 20 years Soft Drinks V/s Respondent less than 20 years Fruit Juices.
37.08163
2.93689
1.96
42.30612
2. Respondent 20-35 years Soft Drinks V/s Respondent 20-35 years Fruit Juices
35.7931
4.587322
1.96 41.48276
3. Respondent 40 years and above Soft Drinks V/s Respondent 40 years and above Fruit Juices
35.62857
2.751783
1.96 40.62857
Null Hypothesis H01 – There is no age wise significant difference between
consumption pattern of soft drinks & Fruit juices in the age category of less than 20 years.
Alternative Hypothesis Ha1 – There is age wise significant difference between
consumption pattern of soft drinks & Fruit juices in the age category of less than 20 years.
As shown in table 6, the value of Z of the consumption pattern of respondents in
Soft Drinks category V/s the consumption pattern of respondents in the Fruit Juices
category with the age group less than 20 years is 2.93689 which is higher than the critical
value (± 1.96 at 5% level of significance). So our Alternative Hypothesis Ha1 is accepted
i.e. there is significant difference of consumption pattern between soft drinks & fruit juices.
But looking at the mean value, the mean value of fruit juices (42.30612) is greater than
the mean value of soft drinks (37.08163). So it can be said that frequency of consumption
of fruit juices is greater than the soft drinks in the age group of less than 20 years.
Null Hypothesis H02 – There is no age wise significant difference between
consumption pattern of soft drinks & fruit juices in the age category of 20-35 years.
Alternative Hypothesis Ha2 – There is age wise significant difference between
consumption pattern of soft drinks & fruit juices in the age category of 20-35 years.

Consumption Pattern of Soft Drinks and Fruit Juices: A Comparative Study ISSN 2321 - 2535
SVIM e-Journal of Applied Management Volume I Issue I January-June 2013 Page 46
Similarly, the Z value of the consumption pattern of respondents in soft drinks
category V/s the consumption pattern of respondents in the fruit juices category with the
age group between 20 - 35 years is 4.587322 which is higher than the critical value (±
1.96 at 5% level of significance). So our Alternative Hypothesis Ha2 is accepted i.e. there
is significant difference between consumption pattern of soft drinks & Fruit juices in the
age category between 20 - 35 years. But their mean value depicts that the consumption
frequency of fruit juices (41.48276) is greater than that of the soft drinks (35.7931).
Null Hypothesis H03 – There is no age wise significant difference between
consumption pattern of soft drinks & Fruit juices in the age category of 40 years and
above.
Alternative Hypothesis Ha3 – There is age wise significant difference between
consumption pattern of soft drinks & Fruit juices in the age category of 40 years and
above.
The Z table results also depict that the value of Z of the consumption pattern of
respondents in soft drinks category V/s the consumption pattern of respondents in the
fruit juices category with the age group of 40 years and above is 2.751783 which is higher
than the critical value (± 1.96 at 5% level of significance). So our Alternative Hypothesis
Ha3 is accepted i.e. there is significant difference between consumption pattern of soft
drinks & Fruit juices in the age category of 40 years and above. The mean value of fruit
juices (40.62857) is greater than the mean value of soft drinks (35.62857). So it can be
said that the consumption frequency of fruit juices is greater than that of soft drinks in this
category.
Implications & Suggestions:
This study intended to be a useful contribution to the companies to understand which
factors are more responsible for the “consumption pattern” of soft drinks & fruit juices and
can make necessary changes to their marketing strategies whenever is required. It is also
intended to be useful contribution to the promotion of the soft drinks & fruit juices.
As a last objective, the study has opened various areas to conduct an extensive research
considering more geographical, demographical parameters. The study can also be
Consumption Pattern of Soft Drinks and Fruit Juices: A Comparative Study ISSN 2321 - 2535
SVIM e-Journal of Applied Management Volume I Issue I January-June 2013 Page 47
conducted taking different variables into account like satisfaction level, buying behavior
etc. as well as seasonal drinks.
Conclusions:
With the increased importance of health and nutrition, changing life styles and
higher incomes, the Indian food market offers numerous opportunities for new products
and product modifications. The purpose of this study was to develop a better
understanding of consumption pattern of soft drinks and fruit juices of consumers at
Indore city. Results from descriptive statistics for the survey indicated that 42% of the
respondents prefer Soft Drinks and 58% of the respondents prefer fruit juices. Through
the survey it was conveyed that weekly consumption of soft drinks is lower than the
weekly consumption of fruit juices. The majority of the respondents consume soft drinks
and fruit juices at the time of parties & celebrations. The basis of soft drinks consumption
is its taste, price and an aid to put off thirst and for that of fruit juices is the health
consciousness of consumers. An important finding that emerged out of the survey was
that 61% of the respondents think that advertisements affect their purchases and 39% of
the respondents think that advertisements do not affect their purchases. The study
concludes that there exists a significant difference between the consumption pattern of
the soft drinks and fruit juices in all age groups. The study also remarked the frequency of
consuming fruit juices is more than that of soft drinks due to health consciousness of
people.

Consumption Pattern of Soft Drinks and Fruit Juices: A Comparative Study ISSN 2321 - 2535
SVIM e-Journal of Applied Management Volume I Issue I January-June 2013 Page 48
References:
Bonilla, T. (2010, August). Analysis of consumer preferences toward 100% fruit juice
packages and labels. Costa rica.
Chen, D. L. (2001). World Consumption Economics. World Scientific, NJ .
Deliza, R. H. (1999). An investigation using the repertory grid and focus group methods of
the package features affecting consumer perception of fruit juice. Brazilian Journal
of Food Technology , 2, 63-71.
Dhuna, M. (1984). An Analysis of Consumer Behaviour. International Journal of Marketing
, 14 (7), 26-28.
Gopi, K., & Arasu, R. (2012). Consumer preferences towards soft drink products in
dharmapuri – a factor analysis evidence. Namex International Journal of
Management Research , 2 (1), 38-47.
Hutchings, J. B. (2003). Expectations and the Food Industry: The impact of color and
appearance. Kluwer Academic Plenum Publishers .
Lorinczi, K. (2009). Health factor in soft drink consumption: German example. Applied
Studies in Agribusiness and Commerce , 3 (3 & 4), 41-44.
Luckow, T. a. (2004). Consumer acceptance of orange juice containing functional
ingredients. Food Research International , 37 (8), 805-814.
Mevlüt Gül, M. G. (2012). The analysis of households’ purchasing preferences for fruit
juice in Turkey. Journal of Food, Agriculture & Environment , 10 (3 & 4), 119-123.
Namasivayam, N. V. (2003). A study on socio economic profiles and place of
consumption pattern of carbonated soft drinks in selected urban centres in Tamil
Nadu. International Journal of Marketing , 33 (5), 23-27.
Ozdes, A. O. (1999). Analysis of concentrated fruit juice demand using the Tobit Model.
Tr. J. of Agriculture and , 23, 493-499.

Consumption Pattern of Soft Drinks and Fruit Juices: A Comparative Study ISSN 2321 - 2535
SVIM e-Journal of Applied Management Volume I Issue I January-June 2013 Page 49
S., S. (1990). Demographic and psychological factors that influence the pattern and
selection in soft drinks and tetra pack drinks - A study in Vellore. International
Journal of Marketing , 20 (7), 102-106.
Selvanathan, E. A., & Selvanathan, S. (2003). International Consumption Comparisons:
OECD vs LDC. World Scientific, NJ .
The Great Indian Bazaar. (n.d.). Retrieved 2 20, 2013, from Indian Bazaar:
http://www.ibef.org/download/indianbazaar_jan19.pdf
Topçu, Y. (2006). Brand competition and consumer behaviours in dairy products: A Case
Study in Erzurum Province. Atatürk University.