Embed Size (px)
Citation preview

\
Volume 5; Issue 2
Manuscript- 1
“IMPLICATIONS OF INSTRUCTIONAL STRATEGIES ON
ACADEMIC ACHIEVEMENT IN KAKAMEGA NORTH SUB
COUNTY, KAKAMEGA COUNTY”
International Journal for Management Science
And Technology (IJMST)
ISSN: 2320-8848 (Online)
ISSN: 2321-0362 (Print)
Tundo Lucheli
Masinde Muliro University of Science and
Technology, Kakamega,
Kenya
www.ijmst.com April, 2017
Lydiah Linet Wamocha
Masinde Muliro University of Science and
Technology, Kakamega,
Kenya
Knight Tundo
Masinde Muliro University of Science and
Technology, Kakamega,
Kenya

International Journal for Management Science and Technology (IJMST) Vol. 5; Issue 2; Manuscript 1
ISSN: 2320-8848(O.)/2321-0362(P.) Page 2 April, 2017
1. Statement of the Problem
Kakamega North is a Sub County in Kakamega County which has been known to post very
law results for the last six years consecutively as shown in Table 1.
Table 1: Kakamega North Sub County Mean Scores for 2010-2016
Year 2010 2011 2012 2013 2014 2015 2016
Mean Score 4.455 4.411 3.893 3.892 4.637 4.797 3.337
Table 1 shows that there is no year within the last seven years when the average mean score
of the schools in this sub county ever went close to 50% which is 6.00 out of the possible
12.00mean score. The current mean scores posted are equivalent to a D+ instead of an A
which is the equivalent of 12.00. This therefore calls for the need to look into the implications
of instructional strategies put in place by the school principals for academic achievement.
1.1 Objective of the Study
The study was guided by the following research objective:
To identify the instructional strategies principals apply to improve academic achievement in
secondary schools in Kakamega North Sub County.
1.2 Research Question
Based on the research objective, this research work was guided by the following research
question: What are the instructional strategies applied by principals to improve academic
performance by principals in secondary schools in Kakamega North Sub County?.
1.3 Significance of the Study
This study is aimed at helping educational managers and leaders to embrace effective
instructional strategies to improve academic performance in secondary schools.
1.4 Scope of the Study
The study was basically concerned with the implication of instructional strategies on
academic performance in secondary schools in Kakamega North Sub County, Kakamega
County, Kenya. The respondents in the study were teachers, principals and academic Heads
of Departments
1.5 Conceptual Framework
International Journal for Management Science and Technology (IJMST) Vol. 5; Issue 2; Manuscript 1
ISSN: 2320-8848(O.)/2321-0362(P.) Page 3 April, 2017
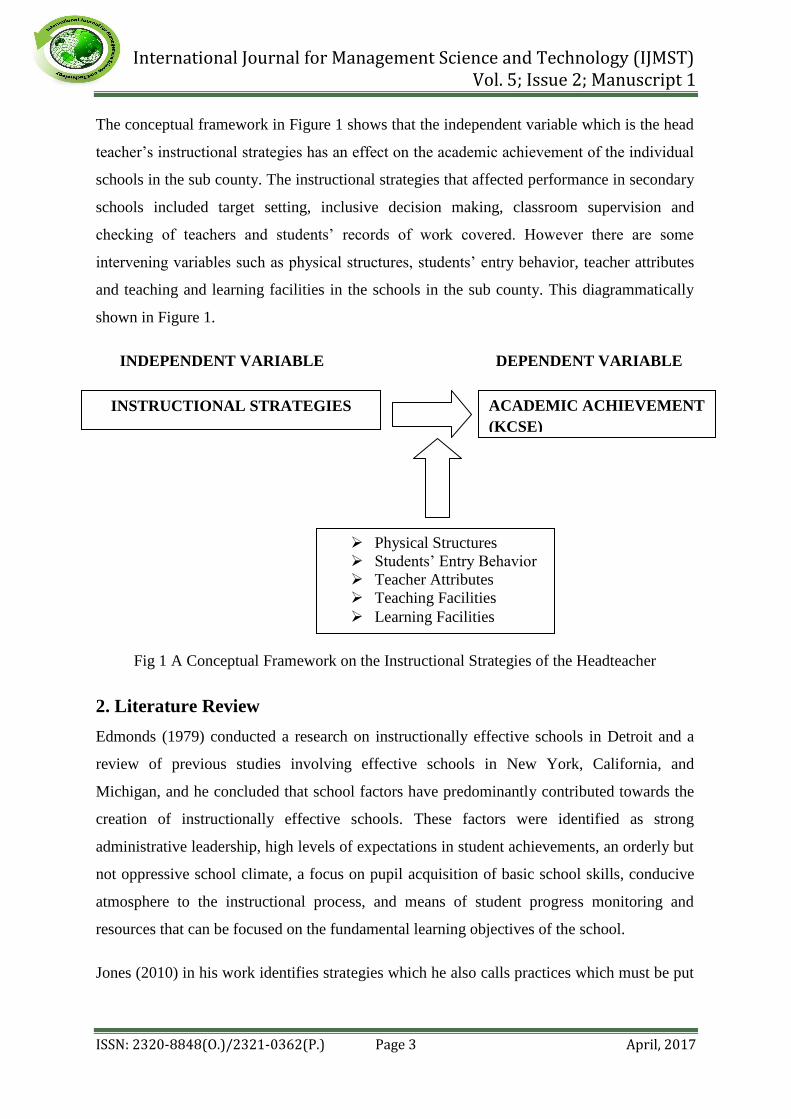
The conceptual framework in Figure 1 shows that the independent variable which is the head
teacher’s instructional strategies has an effect on the academic achievement of the individual
schools in the sub county. The instructional strategies that affected performance in secondary
schools included target setting, inclusive decision making, classroom supervision and
checking of teachers and students’ records of work covered. However there are some
intervening variables such as physical structures, students’ entry behavior, teacher attributes
and teaching and learning facilities in the schools in the sub county. This diagrammatically
shown in Figure 1.
INDEPENDENT VARIABLE DEPENDENT VARIABLE
Fig 1 A Conceptual Framework on the Instructional Strategies of the Headteacher
2. Literature Review
Edmonds (1979) conducted a research on instructionally effective schools in Detroit and a
review of previous studies involving effective schools in New York, California, and
Michigan, and he concluded that school factors have predominantly contributed towards the
creation of instructionally effective schools. These factors were identified as strong
administrative leadership, high levels of expectations in student achievements, an orderly but
not oppressive school climate, a focus on pupil acquisition of basic school skills, conducive
atmosphere to the instructional process, and means of student progress monitoring and
resources that can be focused on the fundamental learning objectives of the school.
Jones (2010) in his work identifies strategies which he also calls practices which must be put
INSTRUCTIONAL STRATEGIES ACADEMIC ACHIEVEMENT
(KCSE)
Physical Structures
Students’ Entry Behavior
Teacher Attributes
Teaching Facilities
Learning Facilities

International Journal for Management Science and Technology (IJMST) Vol. 5; Issue 2; Manuscript 1
ISSN: 2320-8848(O.)/2321-0362(P.) Page 4 April, 2017
in place for a school to succeed. They include balanced assessments, classroom walks
through, team teaching, individualized professional learning, instructional coaching,
leadership teams, mentoring, strategic planning, policies and procedures, staff meetings,
reward systems and teacher study tours among others as the best strategies a principal can put
in place to realize good academic performance. He notes that these strategies combined are
likely to positively influence academic performance.
Research has found that instructional leaders should be goal oriented. They should be able to
define a clear direction for the school and motivate others to join in the achievement.
Instructional leaders emphasize on the importance of vision, goals and mission for schools
which are to succeed (Hallinger & Murphy, 1986).
Classroom supervision is another vital strategy the principal would use to succeed in
instructional leadership. However, Barth (1990) and Cuban (1998) agree that the classroom
has been mostly a private domain of the teachers in which the principals may not be
welcome. They say in some cases the principals have less expertise in the subject area than
the teachers whom they supervise which makes the principals implication of this supervision
strategy a challenge especially in secondary schools. Blasé & Blasé (1998) argue that
effective instructional leadership involves the principal monitoring the students’ progress.
Musungu and Nasong’o (2009) noted that vision is a paramount strategy as far as academic
performance is concerned. According to them, for a school to realize sterling academic
performance, there is need to set a clear vision for the school. This vision should be
communicated to the school community and support its achievement by giving it
instructional leadership, provide the resources and be seen in every part of the institution.
They further suggest team work as a strategy for what they call a discreet head teacher. He
or she will set up committees and smaller groups of members of staff to investigate ideas or
strategies.
In addition Halinger and Murphy (1986) also attest to this by noting that Instructional leaders
are goal oriented. As leaders they are able to define a clear direction for the school and
motivate others to join in its achievement. In instructionally effective schools, this direction
focused primarily on the improvement of students’ outcomes.

International Journal for Management Science and Technology (IJMST) Vol. 5; Issue 2; Manuscript 1
ISSN: 2320-8848(O.)/2321-0362(P.) Page 5 April, 2017
Glew, et. al. (1995) as well as Jewell, (1998) in their study on participation in organization
refers to this kind of process as participative and that it gives a voice to that lower person in
the organization. This makes the person to feel involved in the running of the institution
hence realization of good results. They converge on the fact that people will always be
obliged to support a decision where they were involved in making and will always want it to
succeed. Mullins, (2005) puts it clearly that many people believe that participation in
decision making leads to higher performance and any person who wants to survive in the
current competitive world.
In organizations where teachers lack involvement in decision making, there is truancy,
excessive excuses, unproductive and non achievement of organizational goals of (Awotua –
Efebo, 1999). In the schools where the teachers are involved in decision making process,
they become more committed and give adequate support to the principal hence success
(Udoh & Akpa, 2007). Olorunsola (2011) gives credit to collective decision making process
as it relieves the principal of problem which might have otherwise piled on him.
Omobude & Igbidu (2012) carried out a study on influence of teachers’ participation in
decision making on their job performance in public and private secondary schools in Oredo
Local Government area of Edo State in Nigeria. Their main instruments were a
questionnaire and a teacher’s performance evaluation report card (TPERC). Amongst their
findings was the fact that teachers in private secondary schools participate more in decision
making than teachers in public secondary schools.
In public secondary schools, their findings state that the ministry of education influences
most of the decisions unlike in private secondary schools where the proprietor, the principal
and teaching staff collectively make decisions. They further found out that teachers who are
involved in decision making produce better academic results than those who don’t. They
therefore recommended that schools need to involve teachers in school governance for the
teachers to produce better academic results.
3. Research Design and Methodology
3.1 Research Method
International Journal for Management Science and Technology (IJMST) Vol. 5; Issue 2; Manuscript 1
ISSN: 2320-8848(O.)/2321-0362(P.) Page 6 April, 2017
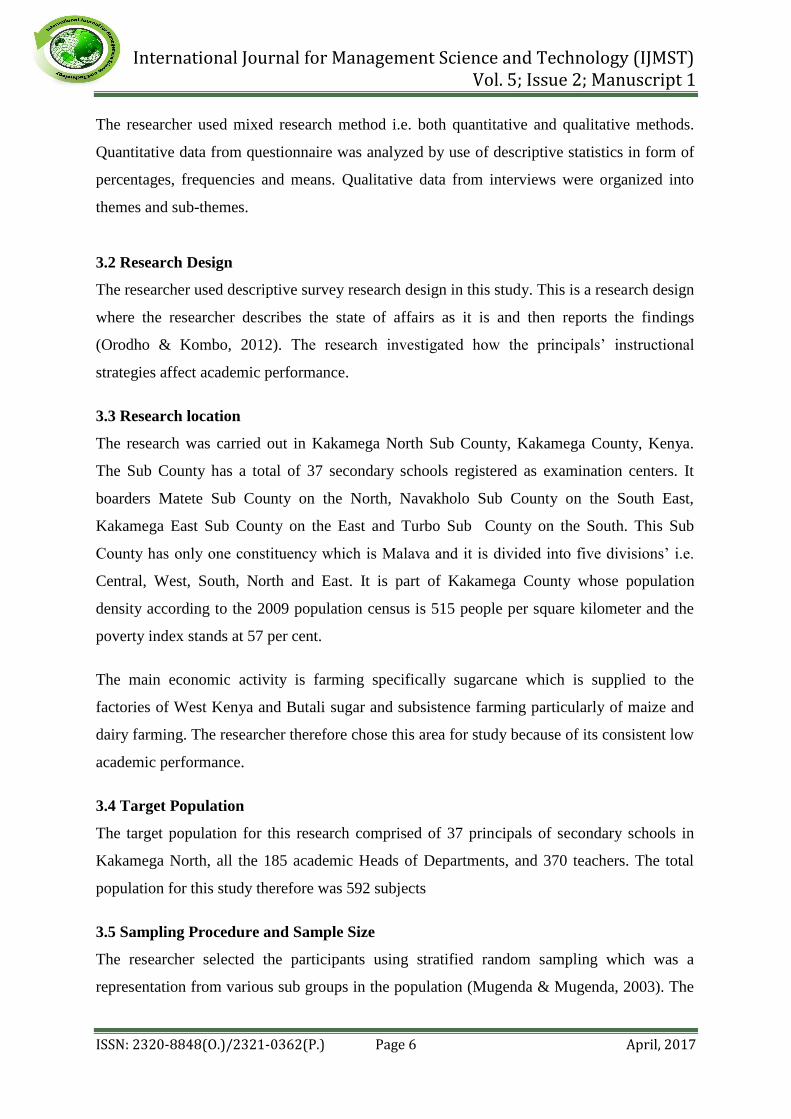
The researcher used mixed research method i.e. both quantitative and qualitative methods.
Quantitative data from questionnaire was analyzed by use of descriptive statistics in form of
percentages, frequencies and means. Qualitative data from interviews were organized into
themes and sub-themes.
3.2 Research Design
The researcher used descriptive survey research design in this study. This is a research design
where the researcher describes the state of affairs as it is and then reports the findings
(Orodho & Kombo, 2012). The research investigated how the principals’ instructional
strategies affect academic performance.
3.3 Research location
The research was carried out in Kakamega North Sub County, Kakamega County, Kenya.
The Sub County has a total of 37 secondary schools registered as examination centers. It
boarders Matete Sub County on the North, Navakholo Sub County on the South East,
Kakamega East Sub County on the East and Turbo Sub County on the South. This Sub
County has only one constituency which is Malava and it is divided into five divisions’ i.e.
Central, West, South, North and East. It is part of Kakamega County whose population
density according to the 2009 population census is 515 people per square kilometer and the
poverty index stands at 57 per cent.
The main economic activity is farming specifically sugarcane which is supplied to the
factories of West Kenya and Butali sugar and subsistence farming particularly of maize and
dairy farming. The researcher therefore chose this area for study because of its consistent low
academic performance.
3.4 Target Population
The target population for this research comprised of 37 principals of secondary schools in
Kakamega North, all the 185 academic Heads of Departments, and 370 teachers. The total
population for this study therefore was 592 subjects
3.5 Sampling Procedure and Sample Size
The researcher selected the participants using stratified random sampling which was a
representation from various sub groups in the population (Mugenda & Mugenda, 2003). The

International Journal for Management Science and Technology (IJMST) Vol. 5; Issue 2; Manuscript 1
ISSN: 2320-8848(O.)/2321-0362(P.) Page 7 April, 2017
schools were stratified into boys boarding, girls boarding, mixed day, boys boarding and day
and girls’ boarding and day. Saturated sampling was used where the respondents in the
population were few. In this case, the 1 boys’ boarding school was selected as well as both
girls’ boarding schools.
Cohen, Manion & Marrison (2011) recommends that for educational research, at least 30%
of the target population is enough. Therefore, 8 mixed schools were sampled, 2 girls’
boarding and day schools and 1 boys’ boarding and day school.
3.6 Research Instruments
The data was collected using questionnaires, an interview schedule and a document analysis
guide. Two sets of questionnaires were prepared for the Academic Heads of Departments and
teachers. Apart from seeking to find out personal information, they sought for their responses
on instructional strategies used in their various schools for academic achievement.
In-depth interviews were administered to the twelve (12) sampled head teachers of the
schools involved in the study which sought to know their views on the effect of instructional
leadership strategies on academic achievement.
The document analysis guide focused on the observation of documents that are relevant such
as KCSE results analysis, list of responsibilities, school motto, core values and mission,
record of work covered books, class attendance registers, schemes of work as well as mark
books.
3.7 Validity of Research Instruments
According to Mugenda and Mugenda (2003) validity refers to the accuracy and
meaningfulness of inferences made based on results obtained. It is asking a relevant question
framed in the least way. The research adopted the content validity to measure the validity of
the instruments to be used. Content validity enables data being collected to be reliable in
representing the specific content of a particular concept. The researcher established the
validity of the research instruments by presenting them to the experts in the field of education
management and leadership at Mount Kenya University, Kakamega Campus for their advice,
corrections and recommendations included in the final instruments. Borg and Gall (1993)
points out that validity of an instrument is improved through expert judgment.

International Journal for Management Science and Technology (IJMST) Vol. 5; Issue 2; Manuscript 1
ISSN: 2320-8848(O.)/2321-0362(P.) Page 8 April, 2017
3.8 Research Instruments Reliability
Mugenda & Mugenda, (2003) describes reliability as a measure of the degree to which a
research instrument yields consistent results or data after repeated trials. The researcher did
piloting on schools which had not been captured in the sampling. The contents and structure
of the instruments were then improved according to the pilot outcome before the researcher
went to the field. Cronbach Alpha Reliability coefficient value was computed to determine
how items correlate among themselves. The threshold value acceptable in this study was 0.7
and higher (Fraenkel and Wallen, 2000; Mugenda and Mugenda, 2003). Cronbach Alpha
Reliability for questionnaire for teachers was 0.768 and for HODs was 0.773 hence the
questionnaire instrument was reliable as shown in Table 2.
Reliability Statistics
Cronbach's
Alpha
Cronbach's Alpha Based on
Standardized Items
N of Items
Teachers .768 .778 15
HODs .773 .777 15
Table 2: Reliability Statistics
3.9 Data Analysis Procedures
The researcher employed descriptive and inferential statistics to analyze data where averages,
percentages, medians, frequencies and totals were calculated. The descriptive analysis was
deemed to be the best for this study because the study involved the description, analysis and
interpretation of responses in the study. Statistical measures like averages, percentages,
means, medians, frequencies and totals were used for analysis because the study involved the
description, analysis and interpretation of responses in the study. Responses from in-depth
interviews were analyzed line per line which was then developed into sub themes then into
themes and conclusions were made. The SPSS programme was used to analyze the data. The
results of objectives one, two and three were subjected to inferential analysis where
correlation was used to study the relationship between each one of them and the independent
variable.
4. Data Presentation, Analysis and Discussion
The question answered here was:
International Journal for Management Science and Technology (IJMST) Vol. 5; Issue 2; Manuscript 1
ISSN: 2320-8848(O.)/2321-0362(P.) Page 9 April, 2017
What are the instructional strategies applied to improve academic performance by principals
in secondary schools in Kakamega North Sub County?
4.1 School categories
This section deals with the categories of schools that were sampled, the gender of the
teachers and HODs who responded to the questionnaires and their experience in the
respective positions. It further presents information on the categories of schools sampled as
well as the age and academic qualifications of the teacher respondents. The schools in
Kakamega North sub county were categorized into boys’ boarding, girls boarding, mixed
day, girls’ boarding and day and boys’ boarding and day. Figure 2 shows the distribution of
the schools per the various categories.
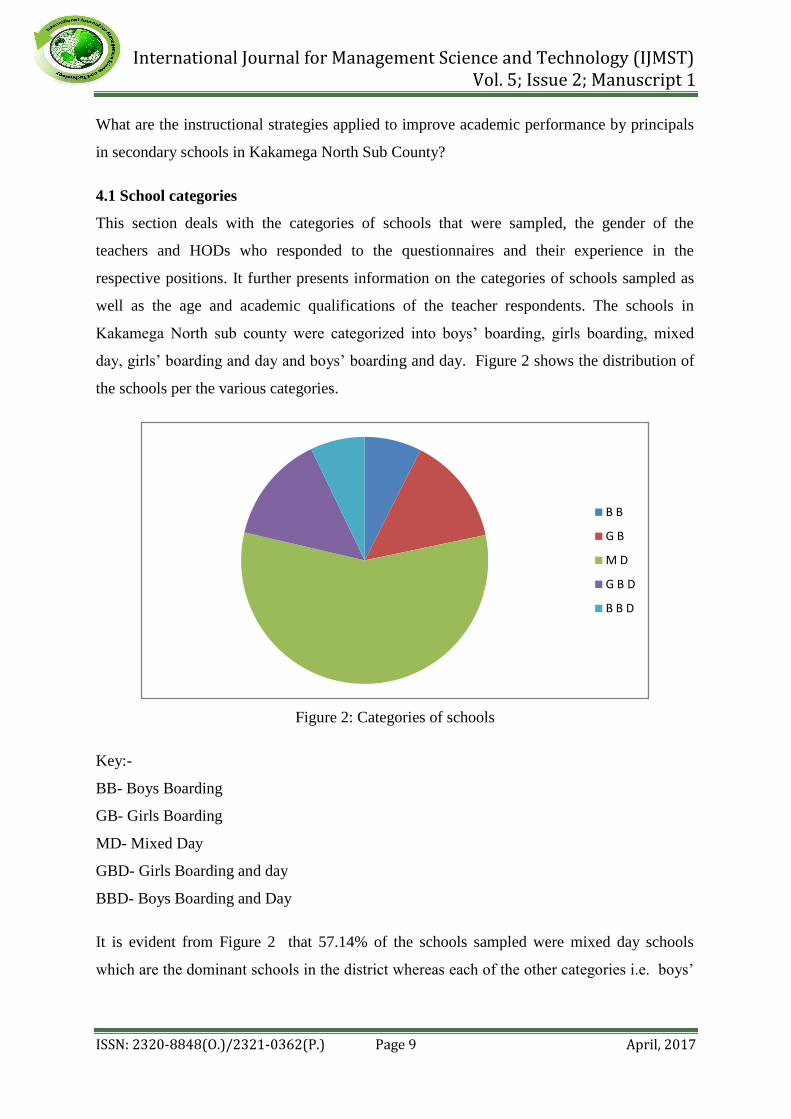
Figure 2: Categories of schools
Key:-
BB- Boys Boarding
GB- Girls Boarding
MD- Mixed Day
GBD- Girls Boarding and day
BBD- Boys Boarding and Day
It is evident from Figure 2 that 57.14% of the schools sampled were mixed day schools
which are the dominant schools in the district whereas each of the other categories i.e. boys’
B B
G B
M D
G B D
B B D
International Journal for Management Science and Technology (IJMST) Vol. 5; Issue 2; Manuscript 1
ISSN: 2320-8848(O.)/2321-0362(P.) Page 10 April, 2017
boarding, girls boarding, mixed, girls’ boarding and day and boys’ boarding and day.
4.2 Gender of sampled teachers and HODs
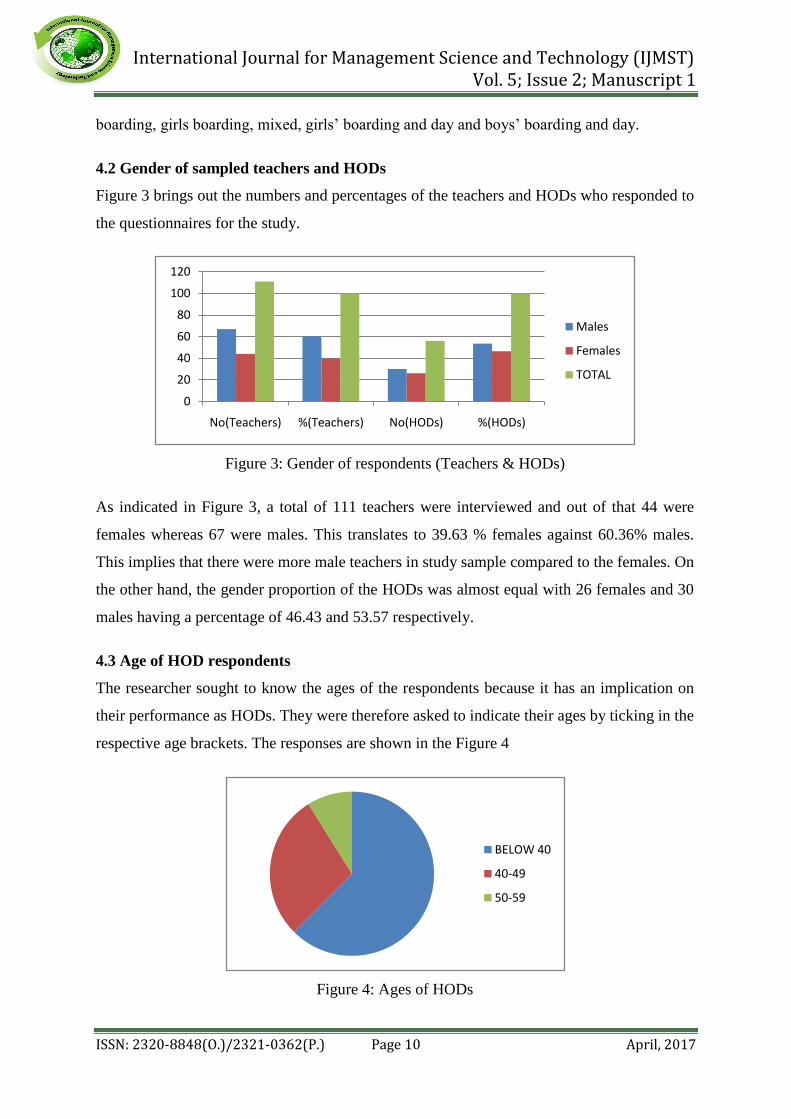
Figure 3 brings out the numbers and percentages of the teachers and HODs who responded to
the questionnaires for the study.
Figure 3: Gender of respondents (Teachers & HODs)
As indicated in Figure 3, a total of 111 teachers were interviewed and out of that 44 were
females whereas 67 were males. This translates to 39.63 % females against 60.36% males.
This implies that there were more male teachers in study sample compared to the females. On
the other hand, the gender proportion of the HODs was almost equal with 26 females and 30
males having a percentage of 46.43 and 53.57 respectively.
4.3 Age of HOD respondents
The researcher sought to know the ages of the respondents because it has an implication on
their performance as HODs. They were therefore asked to indicate their ages by ticking in the
respective age brackets. The responses are shown in the Figure 4
Figure 4: Ages of HODs
0
20
40
60
80
100
120
No(Teachers) %(Teachers) No(HODs) %(HODs)
Males
Females
TOTAL
BELOW 40
40-49
50-59
International Journal for Management Science and Technology (IJMST) Vol. 5; Issue 2; Manuscript 1
ISSN: 2320-8848(O.)/2321-0362(P.) Page 11 April, 2017
Figure 4 indicates that the bulk of HODS in secondary schools in Kakamega North Sub
County (62.5%) are below the age of 40. This implies that most of the HODs are young
professionals who might not be having much experience in departmental management. Ijaiya
(2012) conducted a research on failing schools in Niger Nigeria and found out that students
can only do well in the hands of experienced teachers.
4.4 Head of Departments Academic Qualifications
The researchers sought to find out the qualifications of HODs in the sampled schools. Their
responses are clearly brought out in Figure 5.
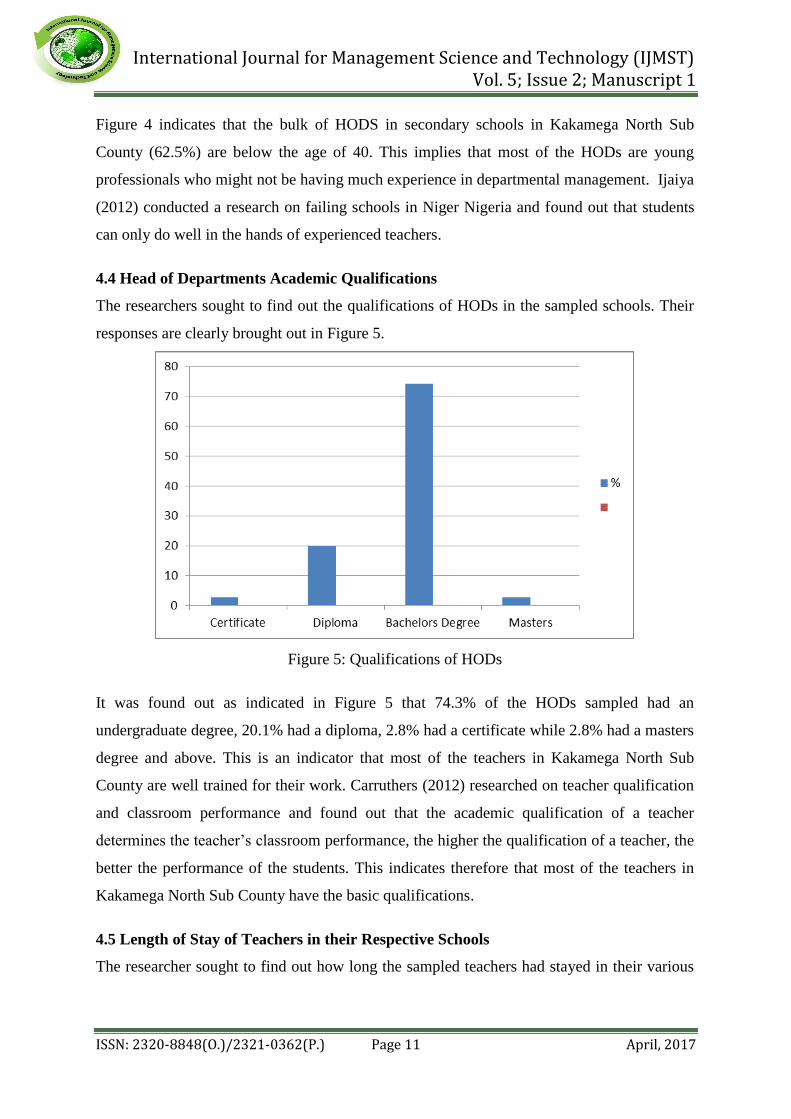
Figure 5: Qualifications of HODs
It was found out as indicated in Figure 5 that 74.3% of the HODs sampled had an
undergraduate degree, 20.1% had a diploma, 2.8% had a certificate while 2.8% had a masters
degree and above. This is an indicator that most of the teachers in Kakamega North Sub
County are well trained for their work. Carruthers (2012) researched on teacher qualification
and classroom performance and found out that the academic qualification of a teacher
determines the teacher’s classroom performance, the higher the qualification of a teacher, the
better the performance of the students. This indicates therefore that most of the teachers in
Kakamega North Sub County have the basic qualifications.
4.5 Length of Stay of Teachers in their Respective Schools
The researcher sought to find out how long the sampled teachers had stayed in their various

International Journal for Management Science and Technology (IJMST) Vol. 5; Issue 2; Manuscript 1
ISSN: 2320-8848(O.)/2321-0362(P.) Page 12 April, 2017
schools and five choices were given for the responded to choose one. Their responses are
shown in Table 3.
Table 3: Length of Stay in the School
The length of stay of a teacher, a HOD and a principal in one station is vital in instructional
leadership hence academic performance. As indicated in Table 3 and it was found out that
50% of the teachers had been in the schools for less than a year, 11% between 1 and 3 years,
18% between 4 and 6 years, 3.6% between 7 and 9 years while 17.4% for more than 9 years.
It is therefore clear that most of the teacher respondents had not stayed in their respective
schools for a long time. This might be a contributing factor to poor performance in KCSE in
the study area. Plecket (2006) researched in Washington on the effect of teacher mobility on
performance and concluded that in schools where teachers depart so oftenly, learning is
disrupted leading to poor performance academically.
4.6 Presence of Instructional Strategies
The researcher expected to find out if schools were having classroom supervision, inclusive
decision making, classroom assessment, principals’ involvement in departmental meetings,
checking of professional documents as well as students’ work. Heads of Departments were
asked if instructional strategies existed in their schools and their responses are shown in
Figure 6.
DURATION NO. Teachers %
Less than 1 year 56 50.
1-3 years 12 11
4-6years 20 18
7-9 years 4 3.6
More than 9 years 19 17.4
TOTAL 111 100

International Journal for Management Science and Technology (IJMST) Vol. 5; Issue 2; Manuscript 1
ISSN: 2320-8848(O.)/2321-0362(P.) Page 13 April, 2017
Figure 6: Availability of instructional strategies
In their responses 69.64% said No while 30.36% said Yes as shown in Figure 6 This implied
that in most schools in Kakamega North, the instructional strategies were absent. Teaching
therefore went own haphazardly without specific instructional strategies. This departs from
the researches done by Edmomds (1979), Austin (1979), Jones, (2010), Hallinger & Murphy,
(1986) and Musungu & Nasong’o, 2009 who all conquer on the argument that for any school
to perform specific strategies or practices should be put in place and properly managed.
However, using the document analysis, 85% of the schools had the school vision, mission
and motto clearly displayed.
4.7 Presence of school motto, vision, mission and core Values
The document analysis sought to find out if the target schools had displayed clearly the
school motto, mission, vision as well as core values. The results are brought out in Table 4.
PRESENT ABSENT
N % N %
Motto 10 71.43 4 28.57
Vision 8 57.14 6 42.86
Mission 8 57.14 6 42.86
Core Values 3 21.43 11 78.57
Table 4: Presence of motto, mission, vision and core values
0
10
20
30
40
50
60
70
80
N Percentage
Yes
No

International Journal for Management Science and Technology (IJMST) Vol. 5; Issue 2; Manuscript 1
ISSN: 2320-8848(O.)/2321-0362(P.) Page 14 April, 2017
Table 4 demonstrates that most schools sampled had the school motto, vision and mission
although it evident that there are some which had none at all. This is in consistent with
Hallinger & Murphy (1986) who found out in their study that an effective instructional leader
should be able to define a clear direction for the school and motivate others to join in the
achievement. They emphasize the importance of vision, goals and mission for schools which
are to succeed. However, only 21.43% of the schools had core values an indicator that most
of them did not have the values to guide them.
4.8 Inclusive Decision Making
The question responded to by the teachers was: Does your school have inclusive decision
making? The responses from the teachers who responded to the questionnaires were as
shown in Figure 7.
Figure 7. Inclusive decision making
Further, the HODs were asked to appraise the various areas they were involved by their
principals in decision making and their responses are shown in Figure 4.10.
0
10
20
30
40
50
60
70
N Percentage
Yes
No

International Journal for Management Science and Technology (IJMST) Vol. 5; Issue 2; Manuscript 1
ISSN: 2320-8848(O.)/2321-0362(P.) Page 15 April, 2017
Figure 7: HODs involvement in decision making
As seen in Figure 7 more than a half the teachers who responded to the questionnaires
responded that inclusive decision making was absent. This was brought out by the HODs
who responded to the specific questions on it or not they are consulted in specific areas and
in all of them the negative responses are common. This therefore indicates that in the study
area, teachers and HODs are rarely consulted while principals are making major decisions
concerning their various areas. This differs with Glew, et.al (1995), Jewell, (1998), Mullins,
(2005), Awotua-Efebo, (1999) Ndiku, et, al.(2009), Wanjiku, (1985) and Mwangi (1986)
who concludes that for a school to perform academically, the teachers must be involved in
decision making so that the own it up.
4.9 Effect of Decision Making Style on Students’ Academic Performance
To establish the position of the teachers on the implication of decision making style on the
academic performance of the students, a statement, decision making style greatly affects
students’ academic performance was posed and their responses are brought out in Figure 8.
YES N %
NO N %
Total N
Total %

International Journal for Management Science and Technology (IJMST) Vol. 5; Issue 2; Manuscript 1
ISSN: 2320-8848(O.)/2321-0362(P.) Page 16 April, 2017
Figure 8: Effect of decision making style on academic performance
In their responses, 14.41% disagreed, 63.03% had no idea, 16.22% agreed and 6.31%
strongly disagreed.
4.10 Checking of students’ note books
Teachers were given a statement that the principal oftenly checks students’ note books and
Table 5 shows the responses
Table 5: Responses on checking students’ note books
In Table 5 it is evident that 50.45% a relatively large percentage tend to disagree strongly
with the statement pointing to the fact that in most schools principals don’t normally check
students’ note books. 17.12% disagrees, 8.1% have no idea, 9.9% agree whereas only
14.43% strongly agree.
0
20
40
60
80
100
120
Percent Cumulative Percent
Valid DISAGREE
Valid NO IDEA
Valid AGREE
Valid STRONGLY AGREE
RESPONSE N %
STRONGLY DISAGREE 56 50.45
DISAGREE 19 17.12
NO IDEA 9 8.1
AGREE 11 9.9
STRONGLY AGREE 16 14.43
TOTAL 111 100

International Journal for Management Science and Technology (IJMST) Vol. 5; Issue 2; Manuscript 1
ISSN: 2320-8848(O.)/2321-0362(P.) Page 17 April, 2017
4.11 Checking of Schemes of Work
Teachers were asked how often their principals checked their schemes of work. The
statement posed was, principals check schemes of work oftenly, the responses are shown in
Figure 9: Frequency of checking schemes of work by principal
As indicated in Figure 9, 13.51% strongly disagreed while 78.38% disagreed .This was a
clear indicator that large percentage of head teachers never checked the schemes of work of
the teachers oftenly. 9% respondents had no idea while only 12.62% disagreed.
4.12 Checking of Record of Work
The statement, the principal oftenly checks records of work was posed to the teachers; their
responses are displayed in Figure 10.
Figure 10: Frequency of principal checking record of work covered
0
10
20
30
40
50
60
70
80
Frequency Percent
Valid STRONGLY DISAGREE
Valid DISAGREE
Valid NO IDEA
Valid AGREE
0
5
10
15
20
25
30
35
40
45
STRONGLYDISAGREE
DISAGREE NO IDEA AGREE STRONGLYAGREE
Frequency
Percent
Series3
Series4

International Journal for Management Science and Technology (IJMST) Vol. 5; Issue 2; Manuscript 1
ISSN: 2320-8848(O.)/2321-0362(P.) Page 18 April, 2017
In their responses, 12.61% of the teachers strongly disagreed, 49.55% disagreed, 17.12% had
no idea, 25.23% agreed and 8.1% strongly disagreed as shown Figure 10. The same
statement was posed to the HODs and their responses are brought out in Figure 11.
Figure 11.Frequency of principal checking record of work
It is important to note that 50% of the Heads of Departments strongly disagreed, 25%
disagreed, 5.36% had no idea, 12.5% agreed while 7.14% strongly disagreed. This implies
that according to the Heads of Departments most of the principals do not check record of
work covered which might lead to laxity and therefore poor performance.
4.13 Checking of Mark Books
Teachers were also given the statement, mark books are checked by the principals oftenly.
Their responses are displayed in Figure 12
Figure 12: Principals’ checking of mark books
0102030405060
STR
ON
GLY
DIS
AG
REE
DIS
AG
REE
NO
IDEA
AG
REE
STR
ON
GLY
AG
REE
Valid
Frequency
Percent
Series3
Series4
0
20
40
60
80
Frequency Percent
Valid STRONGLY DISAGREE
Valid DISAGREE
Valid NO IDEA
Valid AGREE
International Journal for Management Science and Technology (IJMST) Vol. 5; Issue 2; Manuscript 1
ISSN: 2320-8848(O.)/2321-0362(P.) Page 19 April, 2017
As indicated in Figure 12 that 23.42% strongly disagreed and 62.16% disagreed. This implies
that in most schools sampled, principals do not check the mark books. 4.5% of the
respondents had no idea while 9.9% agreed.
4.14 Departmental Meetings
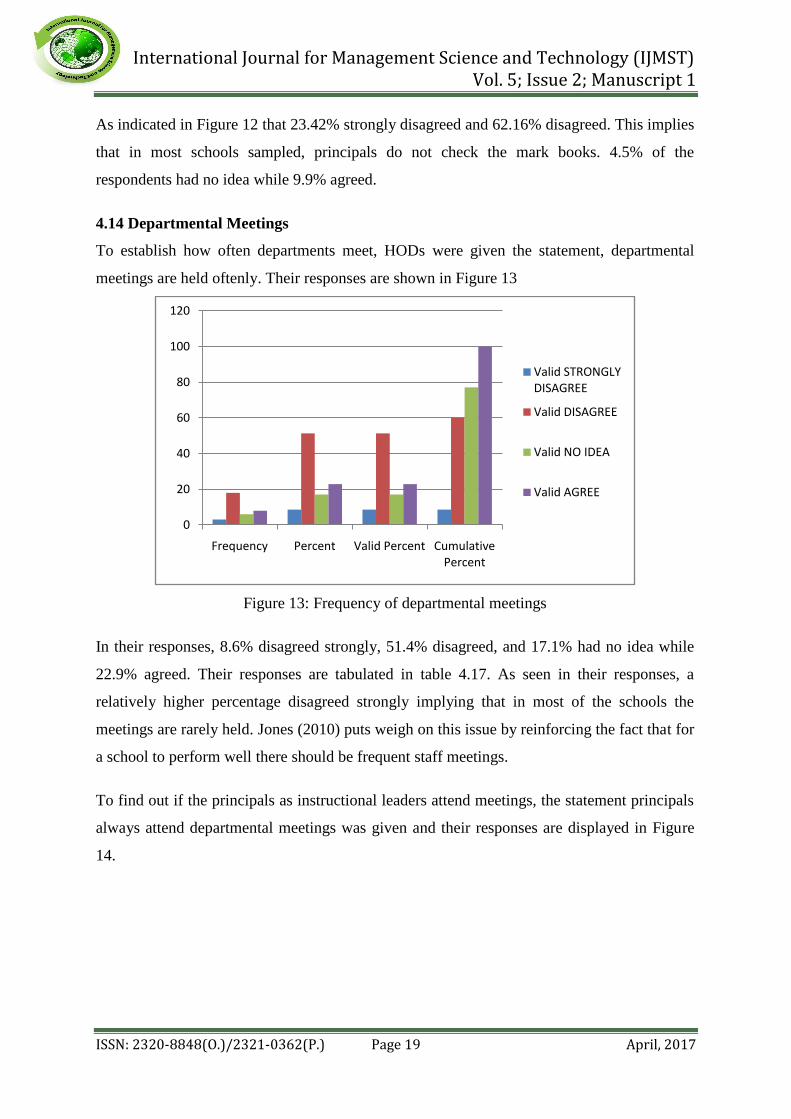
To establish how often departments meet, HODs were given the statement, departmental
meetings are held oftenly. Their responses are shown in Figure 13
Figure 13: Frequency of departmental meetings
In their responses, 8.6% disagreed strongly, 51.4% disagreed, and 17.1% had no idea while
22.9% agreed. Their responses are tabulated in table 4.17. As seen in their responses, a
relatively higher percentage disagreed strongly implying that in most of the schools the
meetings are rarely held. Jones (2010) puts weigh on this issue by reinforcing the fact that for
a school to perform well there should be frequent staff meetings.
To find out if the principals as instructional leaders attend meetings, the statement principals
always attend departmental meetings was given and their responses are displayed in Figure
14.
0
20
40
60
80
100
120
Frequency Percent Valid Percent Cumulative Percent
Valid STRONGLY DISAGREE
Valid DISAGREE
Valid NO IDEA
Valid AGREE

International Journal for Management Science and Technology (IJMST) Vol. 5; Issue 2; Manuscript 1
ISSN: 2320-8848(O.)/2321-0362(P.) Page 20 April, 2017
Figure 14: Frequency of principal’s attendance of meetings
As seen in Figure 14, 39.29% of the respondents strongly disagreed, 25% disagreed, 8.92%
had no idea, 14.29% agreed and 12.5% strongly disagreed. These points to the fact that in
most cases principals don’t attend departmental meetings.
4.15 Effects of Instructional Strategies on Performance
A statement, instructional leadership affects a schools’ academic performance, was given to
the teachers in the questionnaires and they were to give their responses. Figure 15 displays
their responses.
Figure 15: Effect of instructional strategies on academic performance
The above responses indicate that 46.85% agreed and 22.52% strongly agreed implying that
most of the teachers interviewed concurred that instructional strategies had a strong
correlation to performance. On the other hand, 25.23% disagreed and 5.4% had no idea.
S A
D
N I
A
S A
D
N A
A
S A

International Journal for Management Science and Technology (IJMST) Vol. 5; Issue 2; Manuscript 1
ISSN: 2320-8848(O.)/2321-0362(P.) Page 21 April, 2017
HODs conquered when given the same statement as shown in Figure 15 where 3.57%
disagreed, 19.64% had no idea, 53.57% agreed while 23.2% strongly disagreed. This implies
that a higher percentage supported the fact that instructional leadership affects academic
performance. This agrees with the findings of Cotton, 2003 who did a research on principals
and student achievement as well as Quinn (2002) who researched on the impact of principal
leadership on behavior on instructional practice and engagement and both found out that
instructional leadership has a significant impact on creating more effective schools leading to
higher levels of student achievement
5. Summary of Findings, Conclusions and Recommendations
The study was aimed at finding out the implications of instructional strategies on academic
performance in secondary schools in Kakamega North Sub County.
The study found out that in a few of the schools which were performing well had
instructional strategies. These included involving teachers and HODs in academic decision
making, classroom assessment, checking of both teachers and students records which
included schemes of work, lesson notes, mark books and record of work covered. These
schools had also the vision, mission, motto and core values of the schools displayed. On the
other hand, the research found out that a higher percentage of the principals had not put
instructional strategies in place hence poor performance.
5.1 Conclusion
The following conclusion was made based on research question. That the instructional
strategies that affected performance in secondary schools included target setting, inclusive
decision making, classroom supervision and checking of teachers and students’ records.
The findings of this research led to the following recommendation:
That In order for schools to perform better in academics, deliberate efforts should be made by
the school principals to put instructional strategies in place to guide the academic
development of the schools. These strategies may include setting the school motto, vision and
mission, constant meetings between the principal and teachers and academic targeting.

International Journal for Management Science and Technology (IJMST) Vol. 5; Issue 2; Manuscript 1
ISSN: 2320-8848(O.)/2321-0362(P.) Page 22 April, 2017
References
Awotua- Efebo, E. B. (1999). Effective Teaching Principles and Practice. Port
Harcourt: Pen Graphics.
Barth, R. (1990). Improving Schools from Within San Francisco: Jossey-Bass.
Blase , J., & Blase, J. (1998). Handbook on Instructional Leadership: How Really
Good Principals Promote Teaching and Learning. Thousand Oaks, CA: Corwin
Press.
Bass, B. M. and Riggio, R. E. (2006). Transformational Leadership (Second Edition).
Carruthers, C. K. (2012). The qualifications and classroom performance of teachers
moving to charter schools. University of Tenesse: Knoxville.
Cuban, L. (1988). The managerial imperative and the practices of leadership in
schools. Albany: State University of New York Press.
Edmonds, R. (1979). Effective Schools for the Urban Poor. Educational Leadership,
37 (1), 15
Eshiwani, G. S. (1993). Education in Kenya Since Independence. Nairobi:
Government Printers.
Gongera, E. G., Njoroge, W. N., Mindila., R., Nyakwara,S. &Wanjiru J. M. (2013).
An Evaluation of the Principal’s Instructional Supervision on Academic
Performance: A Case Of Sameta Primary School Kisii County, Kenya. Journal of
Education and Practice,Vol.4,11
Hallinger, P. & Murphy, J. (1986). The social context of effective schools.American
Journal 94(3), 328-355.
Heck, R., Larsen, T. J., & Marcoulides, G. A. (1990). Instructional leading and school
Achievement: Validation of casual model. Educational Instruction Quartely, 26:94-
125.
Ijaiya. N. Y. (2000). ‘Failing schools’ and national development: Time for
reappraisal of school effectiveness in Nigeria. Niger: J. Educ. Res. Eval. (2):2; 42.
Fraenkel, R. J. & Wallen, E. N. (1993). How to Design and Evaluate Research in
Education. 4th Edition Illinois: F. E. Peacock Publishers, Inc.
Jones, D.R. (2010). Instructional leadership: Quadrant D leadership practices. New
York: International Centre for Leadership in Education.

International Journal for Management Science and Technology (IJMST) Vol. 5; Issue 2; Manuscript 1
ISSN: 2320-8848(O.)/2321-0362(P.) Page 23 April, 2017
Mugenda, O. & Mugenda, A. (2003). Research Methods: Quantitative and
Quantitative Approaches. Nairobi: Laba graphics Services.
Musugu, L. M. & Nasong’o, J. W. (2009). Role of the Head Teacher in Academic
Achievement in Secondary Schools in Vihiga District Kenya. Current Research
Journal of Social Sciences 1(3): 84-92.
Mullins, L. J. (2005). Management and organizational behavior (7thed). New York:
Prentice Hall.
Ngala, F. B. J. A. (1977). “ Management of teachers by head teachers and its
influence on pupils achievement. A case study of primary schools in Eldoret
Municipality, “ Unpublished M. A. Thesis, Moi University.
Ndiku, J. M., Simiyu, A. M. & Achoka, S. K. J. (2009). Improving decision making in
schools through teacher participation. Education Research and Review,4(8), 391-397.
Ndiku, J. M., Simiyu, A. M. & Achoka, S. K. J. (2009). Improving decision making in
schools through teacher participation. Education Research and Review,4(8), 391-397.
Olosirade, G. O. (2011). Influence of Managerial Skills of Middle- level Managers
Organizational Effectiveness in Nigerian colleges of Education. Academic Research
Journal.
Udoh, S. U. & Akpa, G. O. (2007). Education administration in Nigeria. Theory and
practice. Short: P.M. Millerwood.
Osakwe, N. R. (2010). The relationship between principals’ supervisory strategies
Senatorial District, Nigeria. Pakistan Journal of Social Sciences.
Orodho, A. J. and Kombo, D. K. (2002). Research Methods. Nairobi: Kenyatta
University.
Quinn, D. M. (2002). The Impact of Principal Leadership on Behaviours on
Instructional Practice and Student Engagement. Journal of Educational
Administration, 40 (5), 447-467.


![Reformation Issue: Martin Luther, Reformer …...26 152 0196fi9Thfi 729Th2Th October fifl, fi The Standard Bearer (ISSN 0362-4692 [print], 2372-9813 [online]) is a semi-monthly periodical,](https://img.pdfslide.us/doc/110x75/5e4b56452e50ed43305633c4/reformation-issue-martin-luther-reformer-26-152-0196fi9thfi-729th2th-october.jpg)