Embed Size (px)
Citation preview

Journal of Theoretical and Applied Information Technology 10
th December 2014. Vol.70 No.1
© 2005 - 2014 JATIT & LLS. All rights reserved.
ISSN: 1992-8645 www.jatit.org E-ISSN: 1817-3195
153
ACTIVE VORTEX INDUCED VIBRATION CONTROLLER
AND NEURO IDENTIFICATION FOR MARINE RISERS
1MOHAMMED JAWAD MOHAMMED,
2INTAN Z. MAT DARUS
1Faculty of Mechanical Engineering, UTM, Skudai, Johor, Malaysia-81310
1Faculty of Electromechanical Engineering, University of Technology, Baghdad, Iraq
2Faculty of Mechanical Engineering, UTM, Skudai, Johor, Malaysia-81310
E-mail: [email protected], [email protected]
ABSTRACT
In this work, a vortex induced vibration controller within discrete time has been investigated on marine cylinder pipe risers which represented by using nonlinear neuron identification models namely NARX and NAR. Input-output data have been extracted from the experimental rig of vortex induced vibration marine riser. A proposed work in this paper is to create the nonlinear system identification model undergoing for vortex induced vibration of marine riser depends on Neural Network which didn’t represented before this time in this application and using PID controller to suppress the vibration. Two nonlinear system identification methods used to represent the models which are: Neural Network based on Nonlinear Auto-Regressive External (Exogenous) Input (NARX) and Neural Network based on Nonlinear Auto-Regressive (NAR). Also, the best model has been chosen based on the lowest value of Mean Square Error (MSE) between actual and predicted response. While, PID controller has been used to suppress the oscillation of pipe cylinder for all models and the comparison of the controller’s performance on each model by tuning the controller parameter (KP, KI and KD) using heuristic method. Finally, the outcomes show that the NARX model performed better than the NAR model to predict the dynamic response of the system. On the other hand, PID controller has been managed to reduce the pipe cylinder fluctuation for all models specially the NARX model. Using particle swarm optimization (PSO) to improve the stability for marine riser on the parameters of PID controller are planned for future work.
Keywords: Neuro Identification, NARX Model, NAR Model, PID Controller, Vortex Induced Vibration
1. INTRODUCTION
Many researchers consider the
phenomenon of Vortex Induced Vibration (VIV) is one of the main problems in the offshore engineering fields because of the elastically dynamic which is mounted on the rigid cylinder to extract the oil from the depths of the sea [1-2]. VIV happens because of the interaction between the body and the vortices shedding behind the structure. Whereas, the vortices behind of the structure create the forces which Working on fluctuation the cylinder from side to side in one or two directions [3].
The motion of the cylinder from the previous studies can divide into movements: firstly, when the cylinder motion in perpendicular (transverse) to the air or water crossflow generating force called lift force. Secondly, when the cylinder motion in same direction of stream flow (inline) generating force called drag force [4-5]. However,
there are two ways in this field can suppress the oscillation of a pipe cylinder under VIV which is: passive and active vibration control. The first method depends on adding stiffness or mass or changing the sectional area of the structure of the system to raise the natural frequency of the body without the need for external power signal. [6-7]. While, the other method its very used from the first attempt by Baz and Ro (1991) up to now because of this method is cheaper and produce a higher performance more than the passive method and its depend on using sensors and actuators as an external power signal to the system [8].
Nowadays, there are few researchers in this field represented the system behavior by using system identification model to suppress the attenuation of the cylinder during from using controlled methods such as PID and Fuzzy-PID controllers [9-12]. All papers in this field used linear System identification methods (Least Square and Recursive Least Square) to predict the system.
Journal of Theoretical and Applied Information Technology 10
th December 2014. Vol.70 No.1
© 2005 - 2014 JATIT & LLS. All rights reserved.
ISSN: 1992-8645 www.jatit.org E-ISSN: 1817-3195
154
The initial goal in this work to create the model depends on nonlinear system identification methods then using discrete time PID controller.
In this work, the reduction process the effect of VIV on marine risers has been divided into four main sections: firstly, extracting the input-output data of the experimental setup from prior paper. Secondly, using NARX and NAR as a system identification method to predict the dynamic response of the system and validating the results during from MSE technique. Thirdly, study the effectiveness of PID controller discrete time on NARX and NAR models. Recently, discuss the outcomes that obtained from this work.
2. EXPERIMENTAL DATA
In this study, the input-output data extracted from previous paper by Shaharuddin and Mat Darus [11-12]. The researchers used the rigid cylinder with flexibly supporting in the crossflow vibration only. Table 1 showing the specification and the parameter values which estimated from experimental test.
Table 1. Obtained Parameters [11-12]
Parameter Symbol Value Unit Cylinder Diameter
D 50 mm
Cylinder
Length
L 1110 mm
Aspect Ratio L/D 22.2 Dimensionless
Cylinder
mass
m 2.95 kg
Mass ratio m* 1.18 Dimensionless
Natural
Frequency in
water
ƒw 1.11 Hz
Damping
ratio in water
ζ 0.1007 Dimensionless
System
Stiffness
k 265.34 N/m
Input (from accelerometer A) and output (from
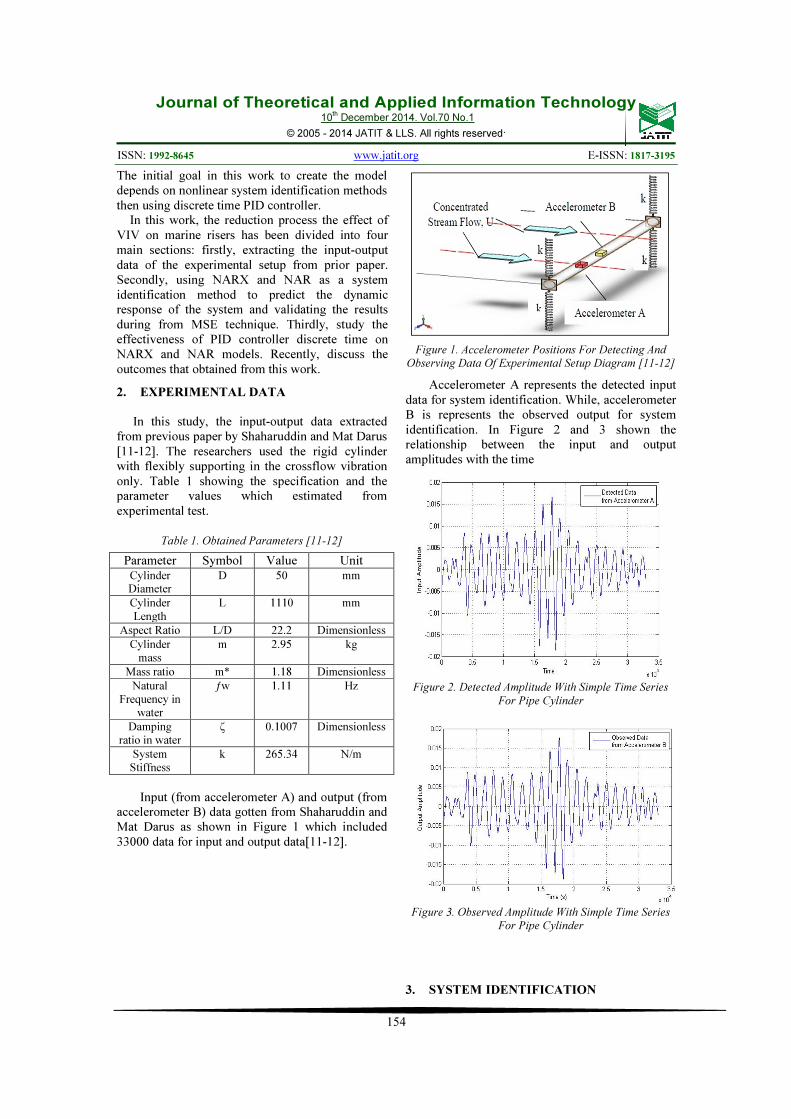
accelerometer B) data gotten from Shaharuddin and Mat Darus as shown in Figure 1 which included 33000 data for input and output data[11-12].
Figure 1. Accelerometer Positions For Detecting And
Observing Data Of Experimental Setup Diagram [11-12]
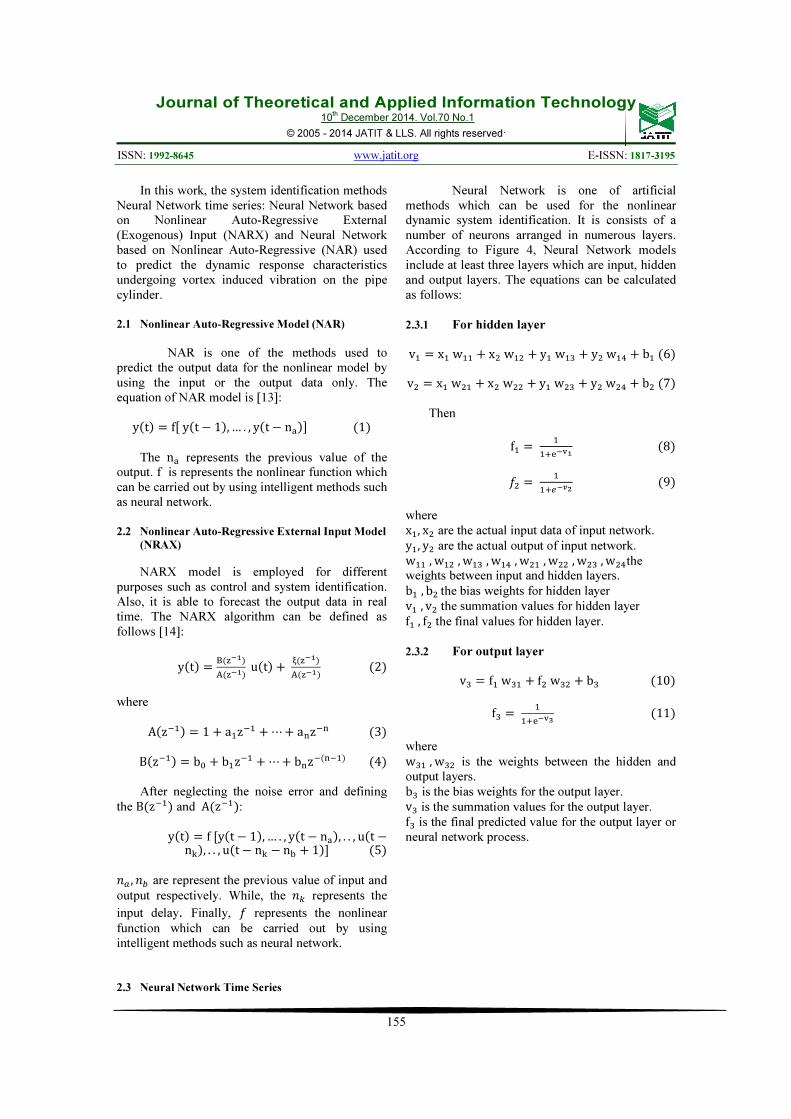
Accelerometer A represents the detected input data for system identification. While, accelerometer B is represents the observed output for system identification. In Figure 2 and 3 shown the relationship between the input and output amplitudes with the time
Figure 2. Detected Amplitude With Simple Time Series
For Pipe Cylinder
Figure 3. Observed Amplitude With Simple Time Series
For Pipe Cylinder
3. SYSTEM IDENTIFICATION
Journal of Theoretical and Applied Information Technology 10
th December 2014. Vol.70 No.1
© 2005 - 2014 JATIT & LLS. All rights reserved.
ISSN: 1992-8645 www.jatit.org E-ISSN: 1817-3195
155
In this work, the system identification methods
Neural Network time series: Neural Network based on Nonlinear Auto-Regressive External (Exogenous) Input (NARX) and Neural Network based on Nonlinear Auto-Regressive (NAR) used to predict the dynamic response characteristics undergoing vortex induced vibration on the pipe cylinder.
2.1 Nonlinear Auto-Regressive Model (NAR)
NAR is one of the methods used to predict the output data for the nonlinear model by using the input or the output data only. The equation of NAR model is [13]:
y�t� � f�y�t 1�,… . , y�t n����1�
The n� represents the previous value of the output. f is represents the nonlinear function which can be carried out by using intelligent methods such as neural network. 2.2 Nonlinear Auto-Regressive External Input Model
(NRAX)
NARX model is employed for different purposes such as control and system identification. Also, it is able to forecast the output data in real time. The NARX algorithm can be defined as follows [14]:
y�t� � ������
������u�t� � ������
������ (2)
where
A�z�� � 1 � az� � ⋯� az� (3)
B�z�� � b� � bz� � ⋯� bz���� (4)
After neglecting the noise error and defining
the B�z�� and A�z��: y�t� � f�y�t 1�,… . , y�t n��, . . , u�t n��, . . , u�t n� n � 1�� (5)
�� , �� are represent the previous value of input and
output respectively. While, the �� represents the
input delay. Finally, � represents the nonlinear
function which can be carried out by using intelligent methods such as neural network. 2.3 Neural Network Time Series
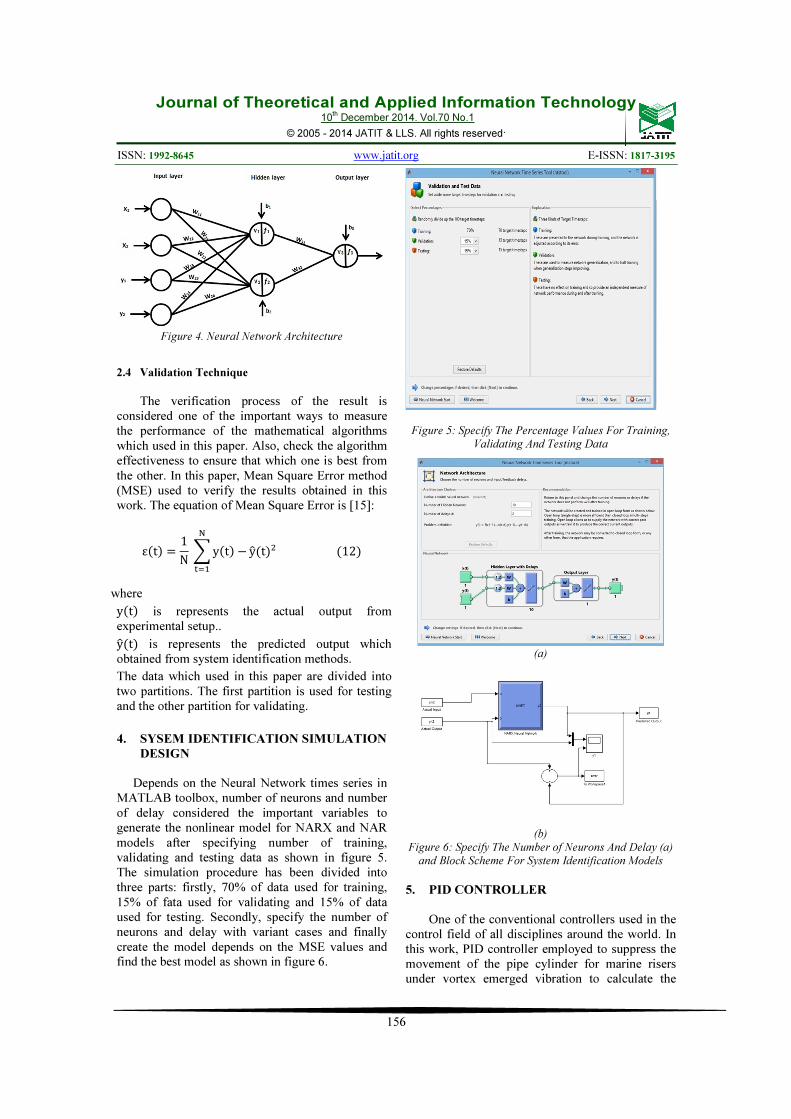
Neural Network is one of artificial
methods which can be used for the nonlinear dynamic system identification. It is consists of a number of neurons arranged in numerous layers. According to Figure 4, Neural Network models include at least three layers which are input, hidden and output layers. The equations can be calculated as follows:
2.3.1 For hidden layer
v � xw � x�w� � yw� � y�w� � b (6)
v� � xw� � x�w�� � yw�� � y�w�� � b� (7)
Then
f �
����� (8)
�� �
����� (9)
where x, x� are the actual input data of input network.
y, y� are the actual output of input network.
w, w�, w�, w�, w�, w��, w��, w��the weights between input and hidden layers.
b, b�the bias weights for hidden layer
v, v� the summation values for hidden layer
f, f� the final values for hidden layer.
2.3.2 For output layer
v� � fw� � f�w�� � b� (10)
f� �
����� (11)
where
w�, w�� is the weights between the hidden and output layers.
b� is the bias weights for the output layer.
v� is the summation values for the output layer.
f� is the final predicted value for the output layer or neural network process.
Journal of Theoretical and Applied Information Technology 10
th December 2014. Vol.70 No.1
© 2005 - 2014 JATIT & LLS. All rights reserved.
ISSN: 1992-8645 www.jatit.org E-ISSN: 1817-3195
156
Figure 4. Neural Network Architecture
2.4 Validation Technique
The verification process of the result is
considered one of the important ways to measure the performance of the mathematical algorithms which used in this paper. Also, check the algorithm effectiveness to ensure that which one is best from the other. In this paper, Mean Square Error method (MSE) used to verify the results obtained in this work. The equation of Mean Square Error is [15]:
ε�t� � 1N�y�t�
�
��
y �t���12�
where
y�t� is represents the actual output from experimental setup..
y �t� is represents the predicted output which obtained from system identification methods.
The data which used in this paper are divided into two partitions. The first partition is used for testing and the other partition for validating.
4. SYSEM IDENTIFICATION SIMULATION
DESIGN
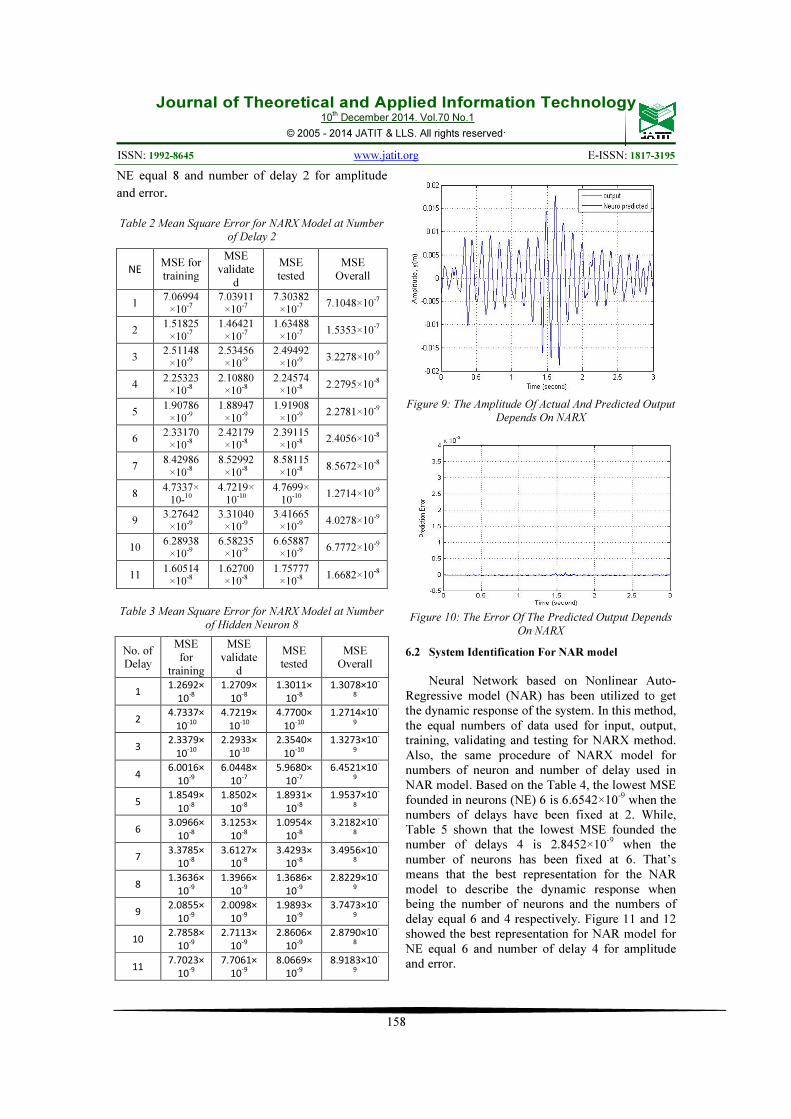
Depends on the Neural Network times series in MATLAB toolbox, number of neurons and number of delay considered the important variables to generate the nonlinear model for NARX and NAR models after specifying number of training, validating and testing data as shown in figure 5. The simulation procedure has been divided into three parts: firstly, 70% of data used for training, 15% of fata used for validating and 15% of data used for testing. Secondly, specify the number of neurons and delay with variant cases and finally create the model depends on the MSE values and find the best model as shown in figure 6.
Figure 5: Specify The Percentage Values For Training,
Validating And Testing Data
(a)
(b)
Figure 6: Specify The Number of Neurons And Delay (a)
and Block Scheme For System Identification Models
5. PID CONTROLLER
One of the conventional controllers used in the
control field of all disciplines around the world. In this work, PID controller employed to suppress the movement of the pipe cylinder for marine risers under vortex emerged vibration to calculate the

Journal of Theoretical and Applied Information Technology 10
th December 2014. Vol.70 No.1
© 2005 - 2014 JATIT & LLS. All rights reserved.
ISSN: 1992-8645 www.jatit.org E-ISSN: 1817-3195
157
value of the error between the output measured and the desired set point under disturbance load as shown in Figure 7. The process required using a heuristic method to find and tunes the PID parameters (KI, KP and KD). Also, this method depended on mean square error (MSE) technique to validate the gain values of the PID parameters under disturbed load which it's included three steps [16]: firstly, calculating the last proportional gain value (KP) by assuming different values until reaching this gain to the lower MSE of the system when being the integral and derivative gain values equal to zero. Secondly, accounting for the last integral gain value (KI) by assuming different values until reaching this gain to the lower MSE of the system when being the proportional gain equal to the last value for the first step and the derivative value equal to zero. Finally, calculating the last derivative gain value (KD) by assuming the different values for this gain until reaching it to the lower MSE of the system when being the proportional and the derivative gain values equal to the last value of the first and second steps respectively. Figure 8 shown the block diagram for marine risers system which it's undergoes in the vortex induced vibration as a distributed load with PID controller discrete time.
(a)
(b)
Figure 7: The Block Scheme For Controller And System
Identification
Figure 5. The Block Scheme for Controller And System
Identification
(a)
(b)
Figure 8: The Block Scheme for Controller With (A) System Identification (NARX) And (B) System
Identification (NAR)
6. RESULTS AND DISCUSSIONS 6.1 System Identification For NARX Model
Neural Network based on Nonlinear Auto-Regressive external input model (NARX) has been employed to predict the dynamic response of the system. In this method, 33000 data used as an input and output data which extracted from the experimental setup for prior paper and it's distributed into two inputs and one output. Whereas, all data separated into three portions: firstly, 32100 data. Secondly, 4950 used to validate the system and last part utilized 4950 data for testing. Also, in this paper used different values for the number of neurons (NE) which ranged between 1 to 11 neurons for default number of delays 2 to find the lower MSE. Then, the best result from pervious process fixed and used for different number of delays until finding the lower MSE which ranged between 1 to 11 values. Based on the Table 2, the lowest MSE founded at neurons (NE) 8 is 1.2714×10⁻⁹ when the numbers of delay has been fixed at 2. While, Table 3 shown that the lowest MSE founded the number of delay 2 is 1.2714×10⁻⁹ when the number of neurons has been fixed at 8. That’s means that the best representation for the NARX model to describe the dynamic response when being the number of neurons and the numbers of delay equal 8 and 2 respectively. Figure 9 and 10 showed the best representation for NARX model at
Journal of Theoretical and Applied Information Technology 10
th December 2014. Vol.70 No.1
© 2005 - 2014 JATIT & LLS. All rights reserved.
ISSN: 1992-8645 www.jatit.org E-ISSN: 1817-3195
158
NE equal 8 and number of delay 2 for amplitude
and error.
Table 2 Mean Square Error for NARX Model at Number
of Delay 2
NE MSE for
training
MSE
validate
d
MSE
tested
MSE
Overall
1 7.06994
×10-7
7.03911
×10-7
7.30382
×10-7
7.1048×10
-7
2 1.51825
×10-7
1.46421
×10-7
1.63488
×10-7
1.5353×10
-7
3 2.51148
×10-9
2.53456
×10-9
2.49492
×10-9
3.2278×10
-9
4 2.25323
×10-8
2.10880
×10-8
2.24574
×10-8
2.2795×10
-8
5 1.90786
×10-9
1.88947
×10-9
1.91908
×10-9
2.2781×10
-9
6 2.33170
×10-8
2.42179
×10-8
2.39115
×10-8
2.4056×10
-8
7 8.42986
×10-8
8.52992
×10-8
8.58115
×10-8
8.5672×10
-8
8 4.7337×
10-10
4.7219×
10-10
4.7699×
10-10
1.2714×10
-9
9 3.27642
×10-9
3.31040
×10-9
3.41665
×10-9
4.0278×10
-9
10 6.28938
×10-9
6.58235
×10-9
6.65887
×10-9
6.7772×10
-9
11 1.60514
×10-8
1.62700
×10-8
1.75777
×10-8
1.6682×10
-8
Table 3 Mean Square Error for NARX Model at Number
of Hidden Neuron 8
No. of Delay
MSE
for
training
MSE
validate
d
MSE tested
MSE Overall
1 1.2692×
10-8
1.2709×
10-8
1.3011×
10-8
1.3078×10-
8
2 4.7337×
10-10
4.7219×
10-10
4.7700×
10-10
1.2714×10-
9
3 2.3379×
10-10
2.2933×
10-10
2.3540×
10-10
1.3273×10-
9
4 6.0016×
10-9
6.0448×
10-7
5.9680×
10-7
6.4521×10-
9
5 1.8549×
10-8
1.8502×
10-8
1.8931×
10-8
1.9537×10-
8
6 3.0966×
10-8
3.1253×
10-8
1.0954×
10-8
3.2182×10-
8
7 3.3785×
10-8
3.6127×
10-8
3.4293×
10-8
3.4956×10-
8
8 1.3636×
10-9
1.3966×
10-9
1.3686×
10-9
2.8229×10-
9
9 2.0855×
10-9
2.0098×
10-9
1.9893×
10-9
3.7473×10-
9
10 2.7858×
10-9
2.7113×
10-9
2.8606×
10-9
2.8790×10-
8
11 7.7023×
10-9
7.7061×
10-9
8.0669×
10-9
8.9183×10-
9
Figure 9: The Amplitude Of Actual And Predicted Output
Depends On NARX
Figure 10: The Error Of The Predicted Output Depends
On NARX
6.2 System Identification For NAR model
Neural Network based on Nonlinear Auto-
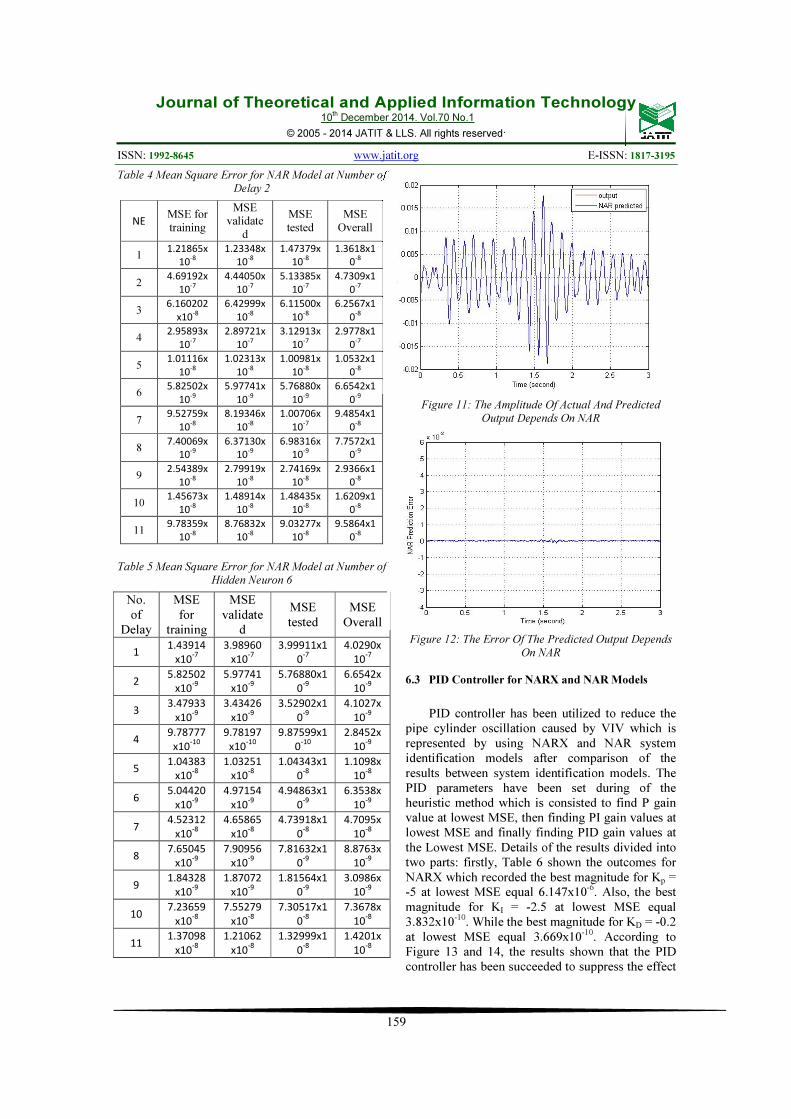
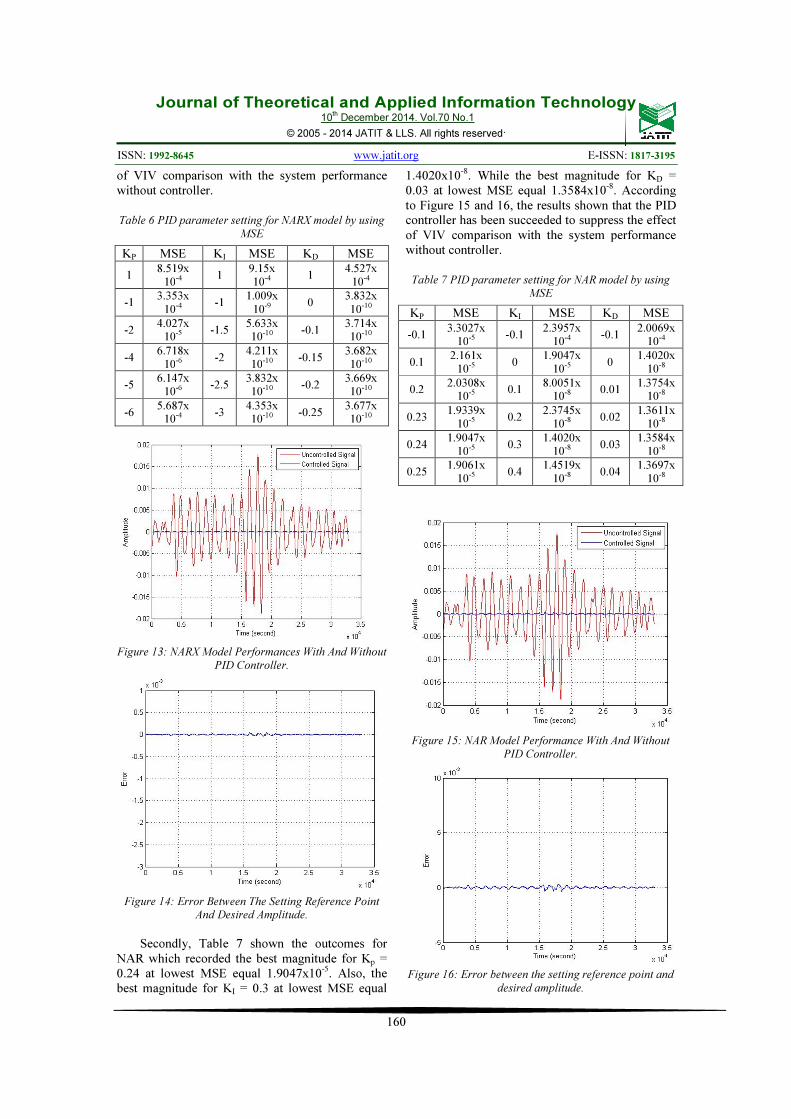
Regressive model (NAR) has been utilized to get the dynamic response of the system. In this method, the equal numbers of data used for input, output, training, validating and testing for NARX method. Also, the same procedure of NARX model for numbers of neuron and number of delay used in NAR model. Based on the Table 4, the lowest MSE founded in neurons (NE) 6 is 6.6542×10⁻⁹ when the numbers of delays have been fixed at 2. While, Table 5 shown that the lowest MSE founded the number of delays 4 is 2.8452×10⁻⁹ when the number of neurons has been fixed at 6. That’s means that the best representation for the NAR model to describe the dynamic response when being the number of neurons and the numbers of delay equal 6 and 4 respectively. Figure 11 and 12 showed the best representation for NAR model for NE equal 6 and number of delay 4 for amplitude and error.
Journal of Theoretical and Applied Information Technology 10
th December 2014. Vol.70 No.1
© 2005 - 2014 JATIT & LLS. All rights reserved.
ISSN: 1992-8645 www.jatit.org E-ISSN: 1817-3195
159
Table 4 Mean Square Error for NAR Model at Number of
Delay 2
NE MSE for
training
MSE validate
d
MSE
tested
MSE
Overall
1 1.21865x
10-8
1.23348x
10-8
1.47379x
10-8
1.3618x1
0-8
2 4.69192x
10-7
4.44050x
10-7
5.13385x
10-7
4.7309x1
0-7
3 6.160202
x10-8
6.42999x
10-8
6.11500x
10-8
6.2567x1
0-8
4 2.95893x
10-7
2.89721x
10-7
3.12913x
10-7
2.9778x1
0-7
5 1.01116x
10-8
1.02313x
10-8
1.00981x
10-8
1.0532x1
0-8
6 5.82502x
10-9
5.97741x
10-9
5.76880x
10-9
6.6542x1
0-9
7 9.52759x
10-8
8.19346x
10-8
1.00706x
10-7
9.4854x1
0-8
8 7.40069x
10-9
6.37130x
10-9
6.98316x
10-9
7.7572x1
0-9
9 2.54389x
10-8
2.79919x
10-8
2.74169x
10-8
2.9366x1
0-8
10 1.45673x
10-8
1.48914x
10-8
1.48435x
10-8
1.6209x1
0-8
11 9.78359x
10-8
8.76832x
10-8
9.03277x
10-8
9.5864x1
0-8
Table 5 Mean Square Error for NAR Model at Number of
Hidden Neuron 6
No. of
Delay
MSE for
training
MSE validate
d
MSE tested
MSE Overall
1 1.43914
x10-7
3.98960
x10-7
3.99911x1
0-7
4.0290x
10-7
2 5.82502
x10-9
5.97741
x10-9
5.76880x1
0-9
6.6542x
10-9
3 3.47933
x10-9
3.43426
x10-9
3.52902x1
0-9
4.1027x
10-9
4 9.78777
x10-10
9.78197
x10-10
9.87599x1
0-10
2.8452x
10-9
5 1.04383
x10-8
1.03251
x10-8
1.04343x1
0-8
1.1098x
10-8
6 5.04420
x10-9
4.97154
x10-9
4.94863x1
0-9
6.3538x
10-9
7 4.52312
x10-8
4.65865
x10-8
4.73918x1
0-8
4.7095x
10-8
8 7.65045
x10-9
7.90956
x10-9
7.81632x1
0-9
8.8763x
10-9
9 1.84328
x10-9
1.87072
x10-9
1.81564x1
0-9
3.0986x
10-9
10 7.23659
x10-8
7.55279
x10-8
7.30517x1
0-8
7.3678x
10-8
11 1.37098
x10-8
1.21062
x10-8
1.32999x1
0-8
1.4201x
10-8
Figure 11: The Amplitude Of Actual And Predicted
Output Depends On NAR
Figure 12: The Error Of The Predicted Output Depends
On NAR
6.3 PID Controller for NARX and NAR Models
PID controller has been utilized to reduce the pipe cylinder oscillation caused by VIV which is represented by using NARX and NAR system identification models after comparison of the results between system identification models. The PID parameters have been set during of the heuristic method which is consisted to find P gain value at lowest MSE, then finding PI gain values at lowest MSE and finally finding PID gain values at the Lowest MSE. Details of the results divided into two parts: firstly, Table 6 shown the outcomes for NARX which recorded the best magnitude for Kp = -5 at lowest MSE equal 6.147x10⁻⁶. Also, the best magnitude for KI = -2.5 at lowest MSE equal 3.832x10⁻¹⁰. While the best magnitude for KD = -0.2 at lowest MSE equal 3.669x10⁻¹⁰. According to Figure 13 and 14, the results shown that the PID controller has been succeeded to suppress the effect
Journal of Theoretical and Applied Information Technology 10
th December 2014. Vol.70 No.1
© 2005 - 2014 JATIT & LLS. All rights reserved.
ISSN: 1992-8645 www.jatit.org E-ISSN: 1817-3195
160
of VIV comparison with the system performance without controller.
Table 6 PID parameter setting for NARX model by using
MSE
KP MSE KI MSE KD MSE
1 8.519x
10-4 1 9.15x
10-4 1 4.527x
10-4
-1 3.353x
10-4 -1 1.009x
10-9 0 3.832x
10-10
-2 4.027x
10-5 -1.5 5.633x 10⁻¹⁰ -0.1
3.714x 10⁻¹⁰
-4 6.718x
10-6 -2 4.211x
10-10 -0.15 3.682x
10-10
-5 6.147x
10-6 -2.5 3.832x
10-10 -0.2 3.669x
10-10
-6 5.687x
10-4 -3 4.353x 10⁻¹⁰ -0.25
3.677x 10⁻¹⁰
Figure 13: NARX Model Performances With And Without
PID Controller.
Figure 14: Error Between The Setting Reference Point
And Desired Amplitude.
Secondly, Table 7 shown the outcomes for
NAR which recorded the best magnitude for Kp = 0.24 at lowest MSE equal 1.9047x10⁻⁵. Also, the best magnitude for KI = 0.3 at lowest MSE equal
1.4020x10⁻⁸. While the best magnitude for KD = 0.03 at lowest MSE equal 1.3584x10⁻⁸. According to Figure 15 and 16, the results shown that the PID controller has been succeeded to suppress the effect of VIV comparison with the system performance without controller.
Table 7 PID parameter setting for NAR model by using
MSE
KP MSE KI MSE KD MSE
-0.1 3.3027x
10-5 -0.1 2.3957x
10-4 -0.1 2.0069x
10-4
0.1 2.161x
10-5 0 1.9047x
10-5 0 1.4020x
10-8
0.2 2.0308x
10-5 0.1 8.0051x
10-8 0.01 1.3754x
10-8
0.23 1.9339x
10-5 0.2 2.3745x
10-8 0.02 1.3611x
10-8
0.24 1.9047x
10-5 0.3 1.4020x
10-8 0.03 1.3584x
10-8
0.25 1.9061x
10-5 0.4 1.4519x
10-8 0.04 1.3697x
10-8
Figure 15: NAR Model Performance With And Without
PID Controller.
Figure 16: Error between the setting reference point and
desired amplitude.
Journal of Theoretical and Applied Information Technology 10
th December 2014. Vol.70 No.1
© 2005 - 2014 JATIT & LLS. All rights reserved.
ISSN: 1992-8645 www.jatit.org E-ISSN: 1817-3195
161
According to all results above, the PID controller has ability to suppress the effect of VIV. But, the performance of PID controller for NARX model was better the NAR model where it's recorded the MSE equal 3.669x10⁻¹⁰ while the MSE for PID controller on NAR model equal 1.3584x10-
8. That’s mean that controller was able to reduce the vibrations around 97 % from the original case without using the controller for NAR model. From the other hand, the controller on the NARX model was able to reduce the vibrations for the marine riser around 99% from the original case without using the controller. Figure 17 has shown the performance of PID controller on NARX model against NAR model.
Figure 17: PID Controller Performance On NARX And
NAR Models.
CONCLUSION
The performance of PID controller for NARX and NAR system identification models for oscillating pipe riser under vortex induced vibration has been investigated in this paper. The input-output data extracted from the experimental setup for priority research. NARX and NAR models employed to represent the dynamic response of the system after comparing the results for different number of hidden neurons and numbers of delay by using MSE technique. The PID controller proved to be effective to decrease the effect of vortex induced vibration of a pipe cylinder under disturbance load for all models. But the PID performance on NARX model was better than the NAR model which recorded the lowest MSE 3.669x10⁻¹⁰ while the MSE for PID controller for NAR model equal 1.3584x10⁻⁸.
ACKNOWLEDGMENT
Ministry of Education (MOE) and Universiti Teknologi Malaysia (UTM) for Research University Grant (Vote No.04H17).
REFRENCES:
[1] C. H. K. Williamson and R. Govardhan, “Vortex-Induced Vibrations,” Annu. Rev. Fluid Mech., vol. 36, no. 1, 2004, pp. 413–455.
[2] T. L. Morse and C. H. K. Williamson, “Prediction of Vortex-Induced Vibration Response by Employing Controlled Motion,” J. Fluid Mech., vol. 634, 2009, pp. 5-39.
[3] B. V. E. How, S. S. Ge, and Y. S. Choo, “Active Control of Flexible Marine Risers,” J. Sound Vib., vol. 320, no. 4–5, 2009, pp. 758–776.
[4] F. Flemming and C. H. K. Williamson, “Vortex-Induced Vibrations of A Pivoted Cylinder,” J. Fluid Mech., vol. 522, 2005, pp. 215–252.
[5] L. Cheng, Y. Zhou, and M. M. Zhang, “Perturbed Interaction Between Vortex Shedding and Induced Vibration,” J. Fluids Struct., vol. 17, no. 7, 2003, pp. 887–901.
[6] O. Streets and A. R. E. Formed, “Feedback Control of Vortex Shedding From a Circular Cylinder by Rotational,” J. of Fluid and Structure, Vl. 15, 2001, pp. 23–37.
[7] L. Cheng, Y. Zhou, and M. M. Zhang, “Controlled Vortex-Induced Vibration on A Fix-Supported Flexible Cylinder in Cross-Flow,” J. Sound Vib., vol. 292, no. 1–2, 2006, pp. 279–299.
[8] J. Ro, “Active Control of Flow-Induced Using Feedback Vibrations Velocity Of A Flexible Cylinder Direct,” J. Sound Vib., vol. 146, no. 1, 1991, pp. 33–45.
[9] N. M. R. Shaharuddin and I. Z. Mat Darus, “Active Vibration Control of Marine Riser,” 2012 IEEE Conf. Control. Syst. Ind.
Informatics, Sep. 2012, .pp. 114–119. [10] C.-M. Chang and B. F. Spencer, “Hybrid
System Identification For High-Performance Structural Control,” Eng. Struct., vol. 56, 2013, pp. 443–456.
[11] N. M. R. Shaharuddin and I. Z. M. Darus, “Fuzzy-PID Control of Transverse Vibrating Pipe Due to Vortex Induced Vibration,” UKSim
15th Int. Conf. Comput. Model. Simul., Apr. 2013, pp. 21–26.

Journal of Theoretical and Applied Information Technology 10
th December 2014. Vol.70 No.1
© 2005 - 2014 JATIT & LLS. All rights reserved.
ISSN: 1992-8645 www.jatit.org E-ISSN: 1817-3195
162
[12] N. M. R. Shaharuddin and I. Z. Mat Darus, “System Identification of Flexibly Mounted Cylindrical Pipe Due to Vortex Induced Vibration,” IEEE Symp. Comput. Informatics, Apr. 2013, pp. 30–34.
[13] V. L. Syrmos, “Nonlinear System Identification And Fault Detection Using Hierarchical Clustering Analysis and Local Linear Models,” Mediterr. Conf. Control Autom., Jun. 2007, pp. 1–6.
[14] H. Peng, T. Ozaki, Y. Toyoda, H. Shioya, K. Nakano, V. Haggan-Ozaki, and M. Mori, “RBF-ARX Model-Based Nonlinear System Modeling And Predictive Control With Application to a Nox Decomposition Process,” Control Eng. Pract., vol. 12, no. 2, 2004, pp. 191–203.
[15] A. R. Tavakolpour, I. Z. Mat Darus, O. Tokhi, and M. Mailah, “Genetic Algorithm-Based Identification of Transfer Function Parameters for a Rectangular Flexible Plate System,” Eng. Appl. Artif. Intell., vol. 23, no. 8, 2010, pp. 1388–1397.
[16] M. A. Fadil, I. Z. M. Darus, M. S. Ammoo, and J. Bahru, “Iterative Learning Auto-tuned PID Controller for Micro-Unmanned Air Vehicle,” Conf. on Instrumentation, Measurement,
Circuits and Systems, Apr. 2013, pp. 153–160.


![ISSN: 1992-8645 E-ISSN: ENERGY ...aware Multi-path Routing Protocol with Load Balance for wireless sensor networks) has been recommending in [12]. AEMRP-LB highlight an idea called](https://img.pdfslide.us/doc/110x75/5f3c60722b346f71b62be58c/issn-1992-8645-e-issn-energy-aware-multi-path-routing-protocol-with-load-balance.jpg)