Embed Size (px)
Citation preview
continued on page 2
Issue 38 December 2017 ISSN 1174–0523 (print) ISSN 1174-0566 (online)
NZTA research
THE PROS AND CONS OF TRANSPORT ASSESSMENTS FOR SMALL-SCALE DEVELOPMENTSResearch looked at whether the transportation effects of small-scale developments could be identified, and whether the cost and effort of assessing these effects was warranted.At present, in New Zealand, the integrated transport assessment guidelines that practitioners use to assess the transport effects of development proposals only provide guidance for developments of a significant size. The assessment approach varies depending on the size and scale of the development, and the guidelines set out thresholds that must be met before they apply.
There are no equivalent guidelines for smaller-scale developments, and for those that fall below the lower thresholds there is no obligation to assess their effects. Typically, these small-scale developments are only assessed when they fail to meet specific transport rules in district plans.
However, it is becoming increasingly evident there are cases where small-scale developments have an effect either individually or cumulatively on the transportation network. In these instances, there may be benefits in assessing the impacts of these developments.
The research project, by Abley Transportation Consultants in Christchurch and Flow Transportation Specialists in Auckland, investigated if and how the potential effects of these small-scale developments should be identified.
Both Auckland and Christchurch have mechanisms to identify the thresholds that will trigger the requirement for an integrated transport assessment. The creation of these thresholds has caused extensive discussion among practitioners about the relationship between the extent of assessment required and the size, scale and location of developments. The findings from the
research project will inform this debate by discussing a number of core issues.
ESTABLISHING WHETHER ASSESSMENT IS NEEDEDThe research took as its starting point that any requirement for additional assessments for small-scale developments needs to be carefully considered and, if implemented, the assessments need to be done in such a way they do not undermine the objectives of simplifying and reducing the prescriptiveness of development controls.
As there was no specific definition or classification for small-scale developments in the literature, the research took these developments to be ones that fall below existing thresholds for transport assessments.
The research analysed the strengths, weaknesses, opportunities and threats (SWOT analysis) of the proposition that small-scale developments should require a transportation assessment.
This analysis was based, in part, on responses from a range of stakeholders representing both public and private sector interests. Overall, the stakeholders indicated that the assessment of small-scale developments could help achieve better integration between transport and land use planning. However, some stakeholders considered there was already too much regulation, and that requiring transport assessments for small-scale developments would likely increase costs and lead to further delays.
5Varying effects of maximum speeds
7Measuring moisture levels in pavements
12New research reports
3Travel time savings and speed
continued from page 1
2 | NZ Transport Agency NZTA research December 2017
Further, it was felt that contextual considerations would be most important for determining whether or not an assessment was required for smaller-scale developments, rather than relying on any hypothetical threshold. The types of questions that needed to be considered should include the following:• Does the development trigger restricted discretionary (or
higher) status as a result of non-compliance with the traffic or transportation rules of a district plan?
• Are heavy vehicles likely to be a high proportion of the trips generated by the development?
• What is the status of the surrounding transport network (ie the adjacent road hierarchy) and the sensitivity of the receiving environment (existing level of service)?
• How will the proposed development contribute to and/or impact on safety, efficiency, travel time, accessibility and resilience of the transport system?
Such considerations reflect that the level of transport effects caused by land use activity will depend on the characteristics of the land use and its location within the transport network.
CONCLUSIONS AND RECOMMENDATIONS FROM THE RESEARCHBased on the above considerations, it was decided there was no need to develop prescriptive guidelines for transportation practitioners assessing small-scale developments.
Instead the research concluded that:• any requirement for assessments should focus on the likely
effects or impacts of the development, and therefore be linked to the context, rather than having pre-established thresholds for assessment
• any threshold approach would inevitably result in applications just below the threshold to avoid the need for assessment or to minimise costs
• it was unreasonable to require assessments to be prepared for all small-scale developments at the resource consent stage of the planning process, because in many cases the costs would be unwarranted as the assessment could have negligible benefit
• expectations as to how the transport network should perform, in relation to whether certain effects should be considered acceptable (or otherwise), were not well articulated or understood
• assessments should take the network operating framework into consideration, to align with the ‘one network’ approach, rather than looking at individual sites, routes or modes.
The research also commented at a high level on the cumulative effects of developments on the network. Although not within the scope of the research, the issue of cumulative effects was one that was raised repeatedly by stakeholders.
The research team considered cumulative effects are most effectively managed at a strategic level in the planning process (ie through district plans and plan changes), rather than at the resource consent application stage. They recommended planning authorities and road controlling authorities consider them at this level, and that guidance could be developed for this purpose.
The assessment of the effects of small-scale development proposals on the transport network, NZ Transport Agency research report 610Available online at www.nzta.govt.nz/resources/ research/reports/610
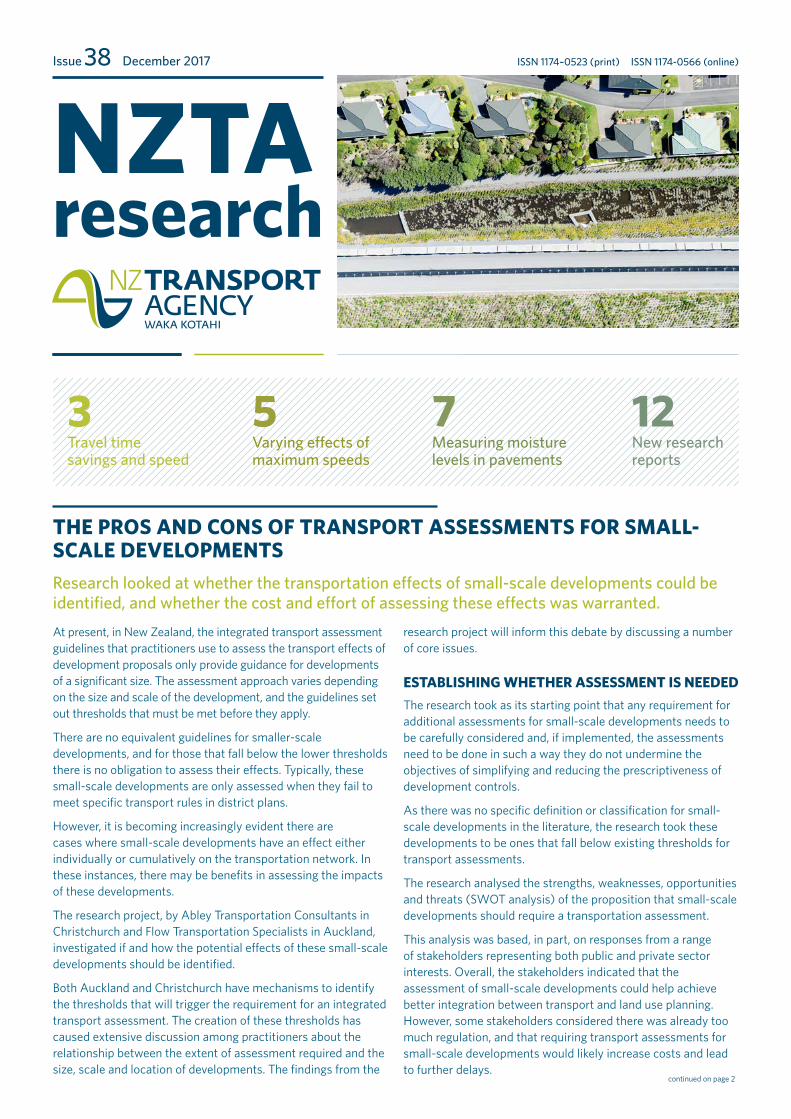
THE CURRENT REQUIREMENT FOR ASSESSMENTSAt present, two processes under the Resource Management Act 1991 (RMA) typically provide the trigger for an assessment of transport effects to be required for a proposed development. These are: when a resource consent is applied for, for an activity that is not permitted by a district plan, and when a change is sought to a district plan to modify what activities are allowed.
The inter-relationship between these two processes is shown in the following diagram:
RELATIONSHIP BETWEEN DISTRICT PLANS AND ASSESSMENT OF TRANSPORTATION EFFECTS
Activity not permitted by plan
Resource consent required
Assessment of effects (as per s104)
Assessment of transport effects (eg ITA)
District plan
Alterations to district plan to modify what activities are permitted
Plan change or variation
Costs and benefits assessment (as per schedule 1 and s32)
of transport effects may be prepared (eg ITA)
For resource consents, section 104 of the RMA requires that regard should be had to ‘any actual and potential effects on the environment; any relevant provisions of a national environmental standard, other regulations, a national policy statement, a regional policy statement or a plan; and any other matter considered relevant and reasonably necessary to determine the application’.
For changes to a district plan, schedule 1 of the RMA requires ‘an explanation of the purpose of, and reasons for the change, an assessment of the environmental effects anticipated and an evaluation report prepared in accordance with section 32’. Part of this assessment is a requirement ‘to identify and assess the benefits and costs of the environmental, economic, social, and cultural effects that are anticipated from the implementation of the provisions’.

NZ Transport Agency | 3 NZTA research December 2017
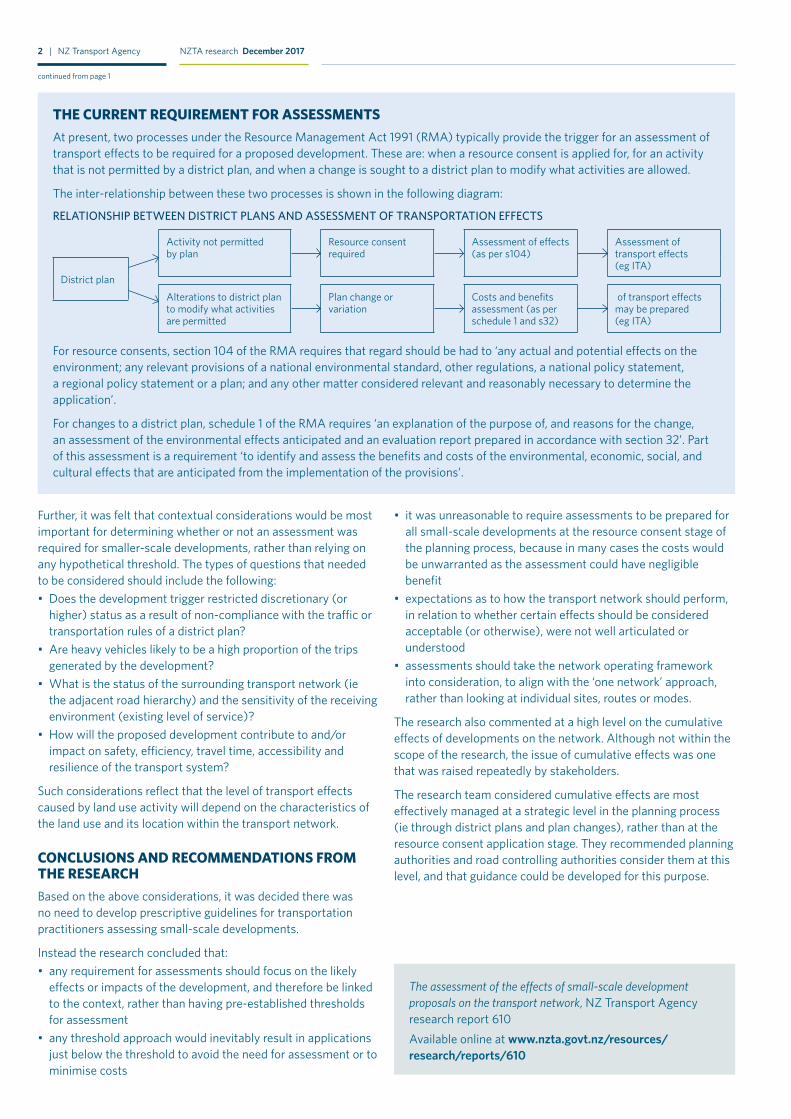
EDUCATION SHOWS PROMISE FOR LOWERING SPEEDS
A study has examined drivers’ motivations for speeding, in order to better target education interventions to promote safe speeds.The study combined an initial survey about drivers’ attitudes to speeding, with an educational intervention about the costs and benefits of speeding, and a follow-up survey to determine what, if any, impact the intervention had on drivers’ attitudes. Data was also collected from a small sample of the drivers participating in the survey to see if the reported shifts in drivers’ attitudes were mirrored in their actual driving.
The research team, from Malatest International, was particularly interested in understanding what part time savings played as a motivation for speeding by New Zealand drivers, in the context of other potential motivations. A preliminary review of the literature suggested drivers had difficulty estimating how much time they would save by increasing their speed, yet the desire to arrive at their destinations faster was a common reason given by drivers for increasing their speed.
In their full report, the research authors say, ‘Drivers who choose to speed to save time are those whose speeding behaviour falls into the violation category, as opposed to accidental lapses and other speeding behaviour. They make a conscious decision that the benefit of increasing speed (arriving at their destination sooner) outweighs the costs of speeding (financial, safety, possible penalties). If that cost-benefit decision is based on incorrect information, providing correct information may result in a different outcome. For example, the driver’s decision to speed may be based on an inflated estimate of the time they may save and an underestimate of the increased safety risk. If the driver instead has correct information about time saving and risk they may make a different speed choice.’
EDUCATION AN EFFECTIVE OPTIONThe study found New Zealand drivers’ attitudes to speeding were consistent with those of drivers internationally, as described in the literature.
Drivers were well aware speeding increases the risks of crashing, and of increasing the severity of a crash, should one occur. Avoiding these risks was a common reason drivers chose not to speed.
There were close links between the speeds drivers preferred to travel at, their definitions of speeding and the commonly perceived enforcement discretion used by the New Zealand Police. For example, in 50km/h zones, nearly one-third (30%) of the survey respondents considered they would be speeding at 55km/h and a further third (33%) at 60km/h. Likewise, in 100km/h zones, substantial proportions of respondents considered themselves to be speeding at 105km/h (18%) or 110km/h (36%).
The preferred speeds cited by drivers nearly always fell below their definitions of speeding. This suggested that if education interventions could change drivers’ definition of speeding, then their speed choices could also be influenced.
In general, drivers did not have a good understanding of how much time they would save by speeding: nearing three-quarters (72%) of drivers underestimated the journey time they would save by increasing their speed from a lower speed (from 50km/h to 60km/h), while well over half (60%) overestimated the time savings from increasing their speeds from higher speeds (95km/h to 110km/h).
Less speedLess harm
1819 NTA Thank You Speed Billboard_6x3m_@ 50%_2_CG.indd 1 12/01/17 3:39 PM
4 | NZ Transport Agency NZTA research December 2017
The education intervention appeared to be effective in helping change drivers’ attitudes to speed. The intervention provided information about the costs and benefits of speeding, and could be completed either online or in a hard copy. Although only around one-third of the participants said they learnt anything new from the materials, a higher proportion (47%) reported they intended to change their driving as a result. In particular, there were reductions in people’s preferred speeds and definitions of speeding.
‘The findings support the conclusion that drivers’ attitudes towards speeding may be changed through the provision of information on the costs and benefits of speeding,’ the research authors say.
This may have been because the educational materials served to remind drivers of facts about speeding and its potential impacts that they already knew.
However, the study was unable to draw any definitive conclusions about whether, and to what extent, the reported change in drivers’ attitudes would be reflected in their actual driving behaviour.
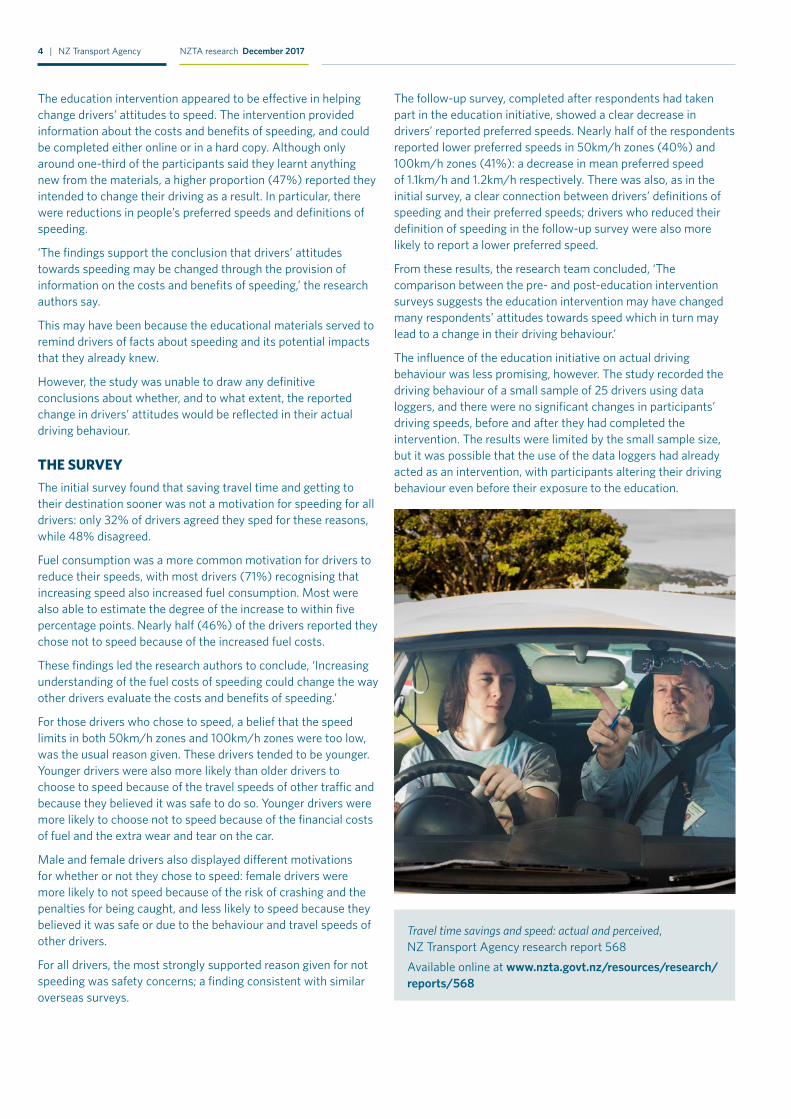
THE SURVEYThe initial survey found that saving travel time and getting to their destination sooner was not a motivation for speeding for all drivers: only 32% of drivers agreed they sped for these reasons, while 48% disagreed.
Fuel consumption was a more common motivation for drivers to reduce their speeds, with most drivers (71%) recognising that increasing speed also increased fuel consumption. Most were also able to estimate the degree of the increase to within five percentage points. Nearly half (46%) of the drivers reported they chose not to speed because of the increased fuel costs.
These findings led the research authors to conclude, ‘Increasing understanding of the fuel costs of speeding could change the way other drivers evaluate the costs and benefits of speeding.’
For those drivers who chose to speed, a belief that the speed limits in both 50km/h zones and 100km/h zones were too low, was the usual reason given. These drivers tended to be younger. Younger drivers were also more likely than older drivers to choose to speed because of the travel speeds of other traffic and because they believed it was safe to do so. Younger drivers were more likely to choose not to speed because of the financial costs of fuel and the extra wear and tear on the car.
Male and female drivers also displayed different motivations for whether or not they chose to speed: female drivers were more likely to not speed because of the risk of crashing and the penalties for being caught, and less likely to speed because they believed it was safe or due to the behaviour and travel speeds of other drivers.
For all drivers, the most strongly supported reason given for not speeding was safety concerns; a finding consistent with similar overseas surveys.
The follow-up survey, completed after respondents had taken part in the education initiative, showed a clear decrease in drivers’ reported preferred speeds. Nearly half of the respondents reported lower preferred speeds in 50km/h zones (40%) and 100km/h zones (41%): a decrease in mean preferred speed of 1.1km/h and 1.2km/h respectively. There was also, as in the initial survey, a clear connection between drivers’ definitions of speeding and their preferred speeds; drivers who reduced their definition of speeding in the follow-up survey were also more likely to report a lower preferred speed.
From these results, the research team concluded, ‘The comparison between the pre- and post-education intervention surveys suggests the education intervention may have changed many respondents’ attitudes towards speed which in turn may lead to a change in their driving behaviour.’
The influence of the education initiative on actual driving behaviour was less promising, however. The study recorded the driving behaviour of a small sample of 25 drivers using data loggers, and there were no significant changes in participants’ driving speeds, before and after they had completed the intervention. The results were limited by the small sample size, but it was possible that the use of the data loggers had already acted as an intervention, with participants altering their driving behaviour even before their exposure to the education.
Travel time savings and speed: actual and perceived, NZ Transport Agency research report 568Available online at www.nzta.govt.nz/resources/research/reports/568
NZ Transport Agency | 5 NZTA research December 2017
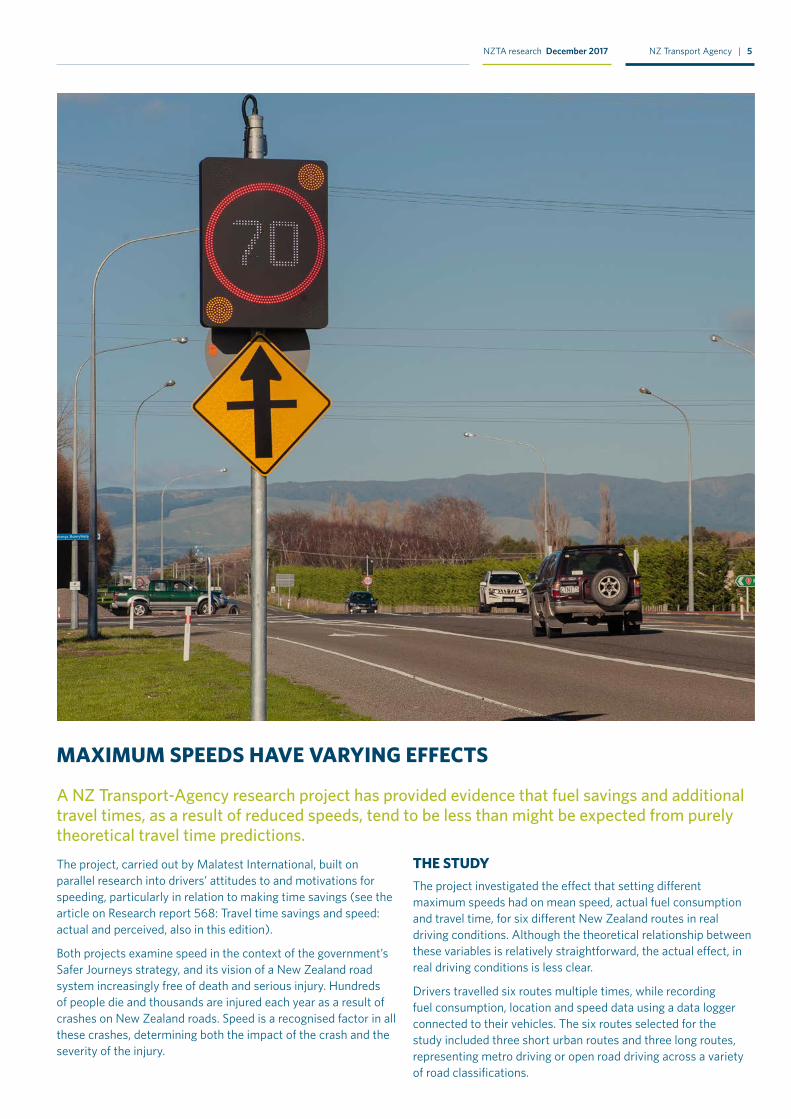
MAXIMUM SPEEDS HAVE VARYING EFFECTS
A NZ Transport-Agency research project has provided evidence that fuel savings and additional travel times, as a result of reduced speeds, tend to be less than might be expected from purely theoretical travel time predictions.The project, carried out by Malatest International, built on parallel research into drivers’ attitudes to and motivations for speeding, particularly in relation to making time savings (see the article on Research report 568: Travel time savings and speed: actual and perceived, also in this edition).
Both projects examine speed in the context of the government’s Safer Journeys strategy, and its vision of a New Zealand road system increasingly free of death and serious injury. Hundreds of people die and thousands are injured each year as a result of crashes on New Zealand roads. Speed is a recognised factor in all these crashes, determining both the impact of the crash and the severity of the injury.
THE STUDYThe project investigated the effect that setting different maximum speeds had on mean speed, actual fuel consumption and travel time, for six different New Zealand routes in real driving conditions. Although the theoretical relationship between these variables is relatively straightforward, the actual effect, in real driving conditions is less clear.
Drivers travelled six routes multiple times, while recording fuel consumption, location and speed data using a data logger connected to their vehicles. The six routes selected for the study included three short urban routes and three long routes, representing metro driving or open road driving across a variety of road classifications.
6 | NZ Transport Agency NZTA research December 2017
• The short urban routes, one in Auckland (12km) and two in Wellington (10km and 6km respectively), were driven at maximum speeds of 40km/h or 50km/h. Each route was driven between 102 and 120 times.
• The long routes, Auckland to Tauranga (211km), Hastings to Levin (197km) and Christchurch to Kaikoura (178km), were driven at maximum speeds of 80km/h, 90km/h and 100km/h. Each route was driven between 40 and 42 times.
The results of the study showed decreasing the maximum travel speed on a route resulted in decreases in mean speed, but by a smaller proportion than might be expected.
Decreasing maximum speed also increased travel time, but again by a smaller proportion.
Fuel consumption decreased on five of the six tested routes as the maximum speed was reduced. The proportion by which fuel consumption decreased was less than the proportionate decreases in mean speed on two of the three short urban routes, but was greater than the proportionate decreases in mean speed on all three of the longer routes.
Some main points in relation to each of these findings are given below. The research report discusses in more detail each area and its ramifications for conversations about the costs and benefits of different speed limits.
Mean speed• Decreasing the maximum speed on the long routes by 20%
(from 100km/h to 80km/h) decreased mean speed by between 8% and 12%.
• The same percentage decrease in maximum speed on the short routes (20%, from 50km/h to 40km/h) decreased the mean speed by between 9% and 14%, depending on the route.
• This difference between the size of the decrease in maximum and mean speeds can be explained by factors such as traffic, road conditions and intersections.
Travel time• Results across all of the routes demonstrated that decreasing
maximum trip speed increased travel time, but by varying amounts.
• Taken together, the results show trip maximum speed limits have a strong effect on travel time. However, the increase in travel time is not equally proportional to the decrease in travel speed.
• Other factors, such as traffic volumes and number of controlled intersections, affect travel time in urban routes to a greater extent than long distance trips.
Fuel consumption• Fuel consumption was closely related to maximum speed, with
higher maximum speeds leading to higher fuel consumption on all but one route.
• Having a lower maximum speed decreased fuel consumption by a smaller proportion than the decrease in mean speed on two of the short routes.
• However, the decrease in fuel consumption was larger than the decrease in mean speed on the long routes.
Variation within and between routes• The routes had different characteristics and drivers
encountered different challenges, leading to variation in results across routes.
• There was more variation recorded in fuel consumption and travel time on the short routes than on the long routes. On the short routes, idle time and traffic ratings were significant predictors of fuel consumption, highlighting the influence of factors other than trip maximum speed.
• The direction of travel was also an important variable. • The significance of these factors emphasised the effect that
small variations in the driver’s experience on each trip had on fuel consumption and travel time. Short delays, such as those caused by a traffic light or another driver parking, could have relatively large effects on the measurements for those trips.
• Other factors, not controlled for in the project, may have also explained differences across routes. For example, the different driving styles of the various drivers used could potentially account for large variances in fuel consumption, as could the different types of terrain covered by the routes.
The information from the study recorded in the research report will inform future discussions about the costs and benefits of different speed limits.
The research authors note, however, that any such discussion must take place in the context of the well understood safety consequences of increased speed. In their report they conclude:
‘Any discussion of different travel speeds and their time and fuel costs must acknowledge the well-established relationship between travel speed and safety. The relationship has two important aspects: the effect of speed on the risk of crashing and the effect of increased speed on the severity of a crash should one occur. Increasing speed increases both the risk of crashing and the severity of crashes should they occur. The relationship between speed and safety is important in both urban environments and open road environments.’
Time and fuel effects of different travel speeds, NZ Transport Agency research report 582Available online at www.nzta.govt.nz/resources/research/reports/582
NZ Transport Agency | 7 NZTA research December 2017
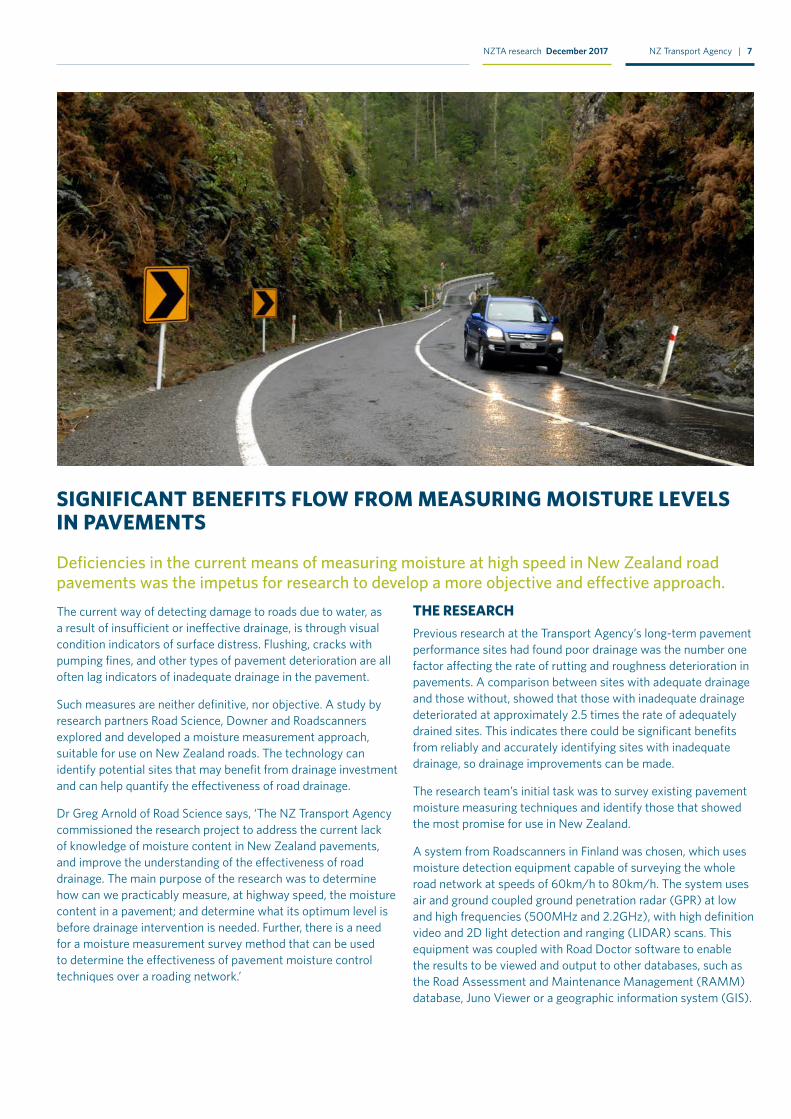
SIGNIFICANT BENEFITS FLOW FROM MEASURING MOISTURE LEVELS IN PAVEMENTS
Deficiencies in the current means of measuring moisture at high speed in New Zealand road pavements was the impetus for research to develop a more objective and effective approach.The current way of detecting damage to roads due to water, as a result of insufficient or ineffective drainage, is through visual condition indicators of surface distress. Flushing, cracks with pumping fines, and other types of pavement deterioration are all often lag indicators of inadequate drainage in the pavement.
Such measures are neither definitive, nor objective. A study by research partners Road Science, Downer and Roadscanners explored and developed a moisture measurement approach, suitable for use on New Zealand roads. The technology can identify potential sites that may benefit from drainage investment and can help quantify the effectiveness of road drainage.
Dr Greg Arnold of Road Science says, ‘The NZ Transport Agency commissioned the research project to address the current lack of knowledge of moisture content in New Zealand pavements, and improve the understanding of the effectiveness of road drainage. The main purpose of the research was to determine how can we practicably measure, at highway speed, the moisture content in a pavement; and determine what its optimum level is before drainage intervention is needed. Further, there is a need for a moisture measurement survey method that can be used to determine the effectiveness of pavement moisture control techniques over a roading network.’
THE RESEARCHPrevious research at the Transport Agency’s long-term pavement performance sites had found poor drainage was the number one factor affecting the rate of rutting and roughness deterioration in pavements. A comparison between sites with adequate drainage and those without, showed that those with inadequate drainage deteriorated at approximately 2.5 times the rate of adequately drained sites. This indicates there could be significant benefits from reliably and accurately identifying sites with inadequate drainage, so drainage improvements can be made.
The research team’s initial task was to survey existing pavement moisture measuring techniques and identify those that showed the most promise for use in New Zealand.
A system from Roadscanners in Finland was chosen, which uses moisture detection equipment capable of surveying the whole road network at speeds of 60km/h to 80km/h. The system uses air and ground coupled ground penetration radar (GPR) at low and high frequencies (500MHz and 2.2GHz), with high definition video and 2D light detection and ranging (LIDAR) scans. This equipment was coupled with Road Doctor software to enable the results to be viewed and output to other databases, such as the Road Assessment and Maintenance Management (RAMM) database, Juno Viewer or a geographic information system (GIS).
8 | NZ Transport Agency NZTA research December 2017
The next step was to use the Roadscanners moisture detection equipment to survey a selection of roads in the lower North Island of New Zealand.
The full results are documented in the research report, which compares the moisture detected within the pavement layers and subgrade as a result of the trial, with evidence of surface defects due to moisture on the surveyed roads. The data was also verified against the results from test pits. The test pit data confirmed the results of the moisture survey data 80% of the time.
USING THE DATA FROM THE MOISTURE SURVEYThe raw data from the moisture survey provided a moisture damage index (MDI) value at three depths in the pavement (top 200mm, 200 to 400mm, and greater than 400mm):
MDITOTAL = 0.5MDITOP + 0.3MDIMIDDLE + 0.2MDIBOTTOM
The method used to calculate the MDI was based on the roads surveyed in New Zealand to give a relative measure of moisture, with this data correlated to laboratory tests, test pit results and visual indicators of moisture.
The moisture survey data was collated together with the LIDAR rut depths, roughness and pavement depths at two-metre increments to give a complete picture of the pavement. Priority was given to improving drainage on sites showing both pavement rutting and high MDI values.
The MDI relies on an underlying model for correlating raw GPR data into the MDI calculation. The actual calculation of underlying top/middle/bottom layer MDIs from raw GPR data was not part of this research and will require further modelling, calibration and validation to enhance the reliability of the technique and to derive an openly available index for the New Zealand roading industry.
The outputs of the MDI have the potential to offer roading authorities a viable approach for surveying moisture content across their networks, in order to identify areas of moisture-based risk to pavement life, and enable more focused and informed investment decision making.
The MDI outputs could assist asset managers identify investment opportunities for planning forward works programmes on their networks. The MDI data can be output to GIS or Google maps, and colour coded as per the Road Doctor viewer software. Black areas are those with the highest moisture values and indicate to asset managers the areas that need looking at more closely with the Road Doctor viewer software to determine whether drainage improvements or surface waterproofing are required. The type of drainage improvement to be used at each location will depend on where the viewer software shows the water is being retained in the pavement. (Deep mitigation treatment will be required to remove moisture from the subgrade and shallow treatment to remove it from the basecourse.)
A cross-section view also enables the software to determine whether the depth of the drainage ditch adjacent to the pavement is adequate and whether there is a high shoulder lip trapping the water.
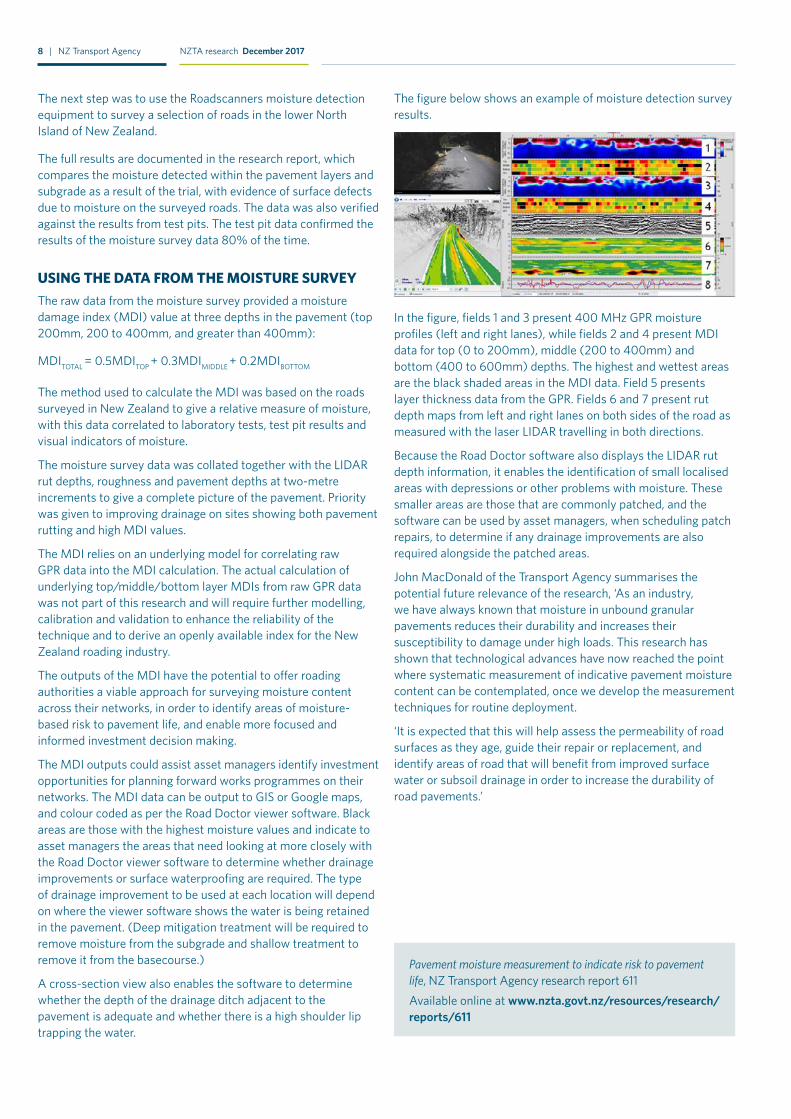
The figure below shows an example of moisture detection survey results.
In the figure, fields 1 and 3 present 400 MHz GPR moisture profiles (left and right lanes), while fields 2 and 4 present MDI data for top (0 to 200mm), middle (200 to 400mm) and bottom (400 to 600mm) depths. The highest and wettest areas are the black shaded areas in the MDI data. Field 5 presents layer thickness data from the GPR. Fields 6 and 7 present rut depth maps from left and right lanes on both sides of the road as measured with the laser LIDAR travelling in both directions.
Because the Road Doctor software also displays the LIDAR rut depth information, it enables the identification of small localised areas with depressions or other problems with moisture. These smaller areas are those that are commonly patched, and the software can be used by asset managers, when scheduling patch repairs, to determine if any drainage improvements are also required alongside the patched areas.
John MacDonald of the Transport Agency summarises the potential future relevance of the research, ‘As an industry, we have always known that moisture in unbound granular pavements reduces their durability and increases their susceptibility to damage under high loads. This research has shown that technological advances have now reached the point where systematic measurement of indicative pavement moisture content can be contemplated, once we develop the measurement techniques for routine deployment.
‘It is expected that this will help assess the permeability of road surfaces as they age, guide their repair or replacement, and identify areas of road that will benefit from improved surface water or subsoil drainage in order to increase the durability of road pavements.’
Pavement moisture measurement to indicate risk to pavement life, NZ Transport Agency research report 611Available online at www.nzta.govt.nz/resources/research/reports/611
NZ Transport Agency | 9 NZTA research December 2017
RECENTLY PUBLISHED RESEARCH REPORT ABSTRACTS
Best practice guide for pavement stabilisationNZ Transport Agency research report 611Freely available online at www.nzta.govt.nz/resources/research/reports/611
New Zealand pavement engineers, in collaboration with colleagues in South Africa and Australia, are recognised internationally as leaders in the use of stabilisation in highway, road, airport, port and industrial hardstand pavement applications.
Stabilisation is used to rectify a deficiency in a soil, aggregate or surfacing material. Stabilised materials contribute to the strength and performance of pavements at all levels: subgrade; subbase; base and surfacing.
Applied research into and development of leading edge testing and design knowledge, coupled with significant improvements in the capacity and effectiveness of stabilisation construction plant and work site processes now offer the wider transport industry in New Zealand relatively safe, efficient and sustainable pavement construction, rehabilitation and maintenance options incorporating stabilisation.
This research was undertaken to bring together informed, current technical advice from a variety of sources to enable road controlling authorities, consultants and contractors in New Zealand to successfully investigate, design, construct, maintain and operate pavements with stabilised components.
Effects of land transport activities on New Zealand’s endemic bat populations: reviews of ecological and regulatory literatureNZ Transport Agency research report 623
Freely available online at www.nzta.govt.nz/resources/research/reports/623
Roading projects may have adverse effects on indigenous wildlife. In New Zealand the effects of roading on long-tailed bats (Chalinolobus tuberculatus) is an issue and projects have attempted to monitor and mitigate effects on bats populations. However, how to undertake monitoring and mitigation is unclear.
The NZ Transport Agency commissioned Wildland Consultants, Landcare Research and AECOM to:• review the literature on effects and mitigation of roads on
bats, and relevant statutory processes• research road effects on long-tailed bats• develop a framework for managing these effects.
Roads affect bats by severing their flight paths and depleting roosting habitat by removing trees. Most bat road research has quantified effects on behaviour rather than population survival, making prediction of effects difficult. No previous studies have demonstrated any mitigation options to be effective for bats. Demographic modelling indicated adult female survival is vital for the survival of long-tailed bat populations, and therefore must be preserved by roading mitigation.
Research showed that nightly bat emergence is related to temperature, indicating that bat monitoring should be undertaken when temperatures one to four hours after sunset are above 5ºC, and preferably in the 10–17ºC range. Field research also showed a negative relationship between bat activity and night-time traffic volume.
A framework guiding roading projects through the process of consents, ecological monitoring and mitigation was developed and addresses ecological uncertainty around mitigation options, and describes improved bat monitoring.
Assessment of the value to end users of the NZ Transport Agency research programmeNZ Transport Agency research report 624
Freely available online at www.nzta.govt.nz/resources/research/reports/624
This evaluation assesses the value to end users of research published by the Transport Agency between 2011 and 2016. ‘Value’ is defined as the importance of the research programme to individual end users as well as the transport sector more broadly. The evaluation also identifies barriers and enablers to the uptake and use of findings; and the extent to which the Transport Agency’s mechanisms for disseminating and promoting research findings work for end users. The evaluation is a follow-up to a study conducted in 2011.
The findings show the research continues to be of substantial value to end users in all areas of the transport sector. Respondents value practical, innovative New Zealand-based solutions to their issues. There is more conceptual ‘use’ and less evidence of research being used to inform decision making, programme/policy formation and/or improvement. This in part is due to the roles respondents have in organisations and the extent to which they are positioned to apply findings in their work.
Email and newsletter notifications are highly valued. End users would like the opportunity for more events that showcase the research.

10 | NZ Transport Agency NZTA research December 2017
Use of technology to measure and improve freight movementsNZ Transport Agency research report 625Freely available online at www.nzta.govt.nz/resources/research/reports/625
The advance of technology has created several rich sources of data to analyse road network performance and freight patterns. New technology is also driving intelligent transport systems (ITS) designed to improve transport operations. This research used Auckland as a case study to explore how existing and real-time data sources could be used to manage network performance and improve journey predictability for urban freight using ITS solutions.
Drawing on previous research and a wide range of international literature and case studies, the report presents an overview of the role of ITS and the innovative ways technology is being applied to measure congestion and manage infrastructure more effectively.
Extensive industry stakeholder engagement revealed a high level of frustration and urgency to find solutions to improve network efficiency and an acknowledgement of the role of technology alongside infrastructure and regulatory measures to support efficient urban freight movement.
This report proposes five case studies to demonstrate the application of technological solutions to manage and improve network performance with regard to network efficiency, network optimisation and improved journey predictability for urban freight in Auckland.
The long-term acoustic performance of New Zealand standard porous asphaltNZ Transport Agency research report 626Freely available online at www.nzta.govt.nz/resources/research/reports/626
Research was commissioned to investigate the long-term acoustic performance of New Zealand standard porous asphalt made to TNZ P/11 Specification for open graded porous asphalt (OGPA). The research findings should be considered applicable only to New Zealand OGPA laid in high-speed environments (speed limits of 80 to 100 km/h).
A method for acoustic measurement was selected, developed and applied using drafts of ISO 11819-2 for guidance. Measurements were made of a set of OGPA sections of different ages from four regions of New Zealand. The oldest OGPA sections were around 8 to 10 years old, which matches current expectations of OGPA ‘life’.
The measurements show OGPA acoustic performance deteriorating at a steady but slow rate over time, yielding about 2 dB(A) deterioration of acoustic performance over 8 to 10 years.
Current asset management of OGPA is largely driven by functional attributes of smoothness and porosity, which also deliver OGPA’s acoustic performance. It appears that current practices of asset management for OGPA functional life are synchronised with what would be prescribed if considering asset management for OGPA acoustic life. Therefore, the research makes no recommendation for changes to asset management of OGPA in high-speed environments, but supports current practices.
Data standards for the NZ transport networkNZ Transport Agency research report 627Freely available online at www.nzta.govt.nz/resources/research/reports/627
As transport network operations become more and more time critical the requirement for knowledge of the performance and state of the network becomes more significant for decision support. Sensor technology is advancing quickly, particularly with respect to the ‘Internet of Things’, and there are significant amounts of data and information generated by a number of internal and external sources that relate to transport network and require processing. An inherent embedded component of the data sources is information about the transport networks themselves. Typically, this spatial attribute is developed to meet the specific needs of an application leading to diverse representations of the same transport network.
There is a lack of transport specific data analysis platforms that are resilient to change, are lightweight and cost efficient to maintain. Analytical tools are often tied to specific proprietary systems that compromise adaptability and create latency in terms of keeping up with the rapidly changing developments, and indeed in representing transient changes in transport networks.
This report proposes a method that will support normalising diverse network representations of selected data sources, and support presentation of the information within the context of a standardised reference transport network model.
NZ Transport Agency | 11 NZTA research December 2017
Standardisation of laboratory compaction energiesNZ Transport Agency research report 628Freely available online at www.nzta.govt.nz/resources/research/reports/628
This research reviewed the New Zealand vibrating hammer laboratory compaction test and energy standardisation thereof. The area of laboratory aggregate compaction was found to have significant problems with the variability of results and reduced correlations with field compaction results, which suggests there are problems with standardisation of the compaction energies used.
A list of components of the New Zealand vibrating hammer test as it is actually performed in laboratories throughout New Zealand is provided, with each component introducing a larger or smaller amount of variability into the results. Methods of rectifying each component are identified to improve the standardisation of compaction energy and recommendations are made into how an alternative test method might be developed, tested and compared with the existing methods.
System dynamics investigation of freight flows, economic development and network performance NZ Transport Agency research report 629Freely available online at www.nzta.govt.nz/resources/research/reports/629
The purpose of this research was to investigate if and how systems dynamic (SD) modelling could be used for understanding traffic flows at an inter-regional (state highway) level, in the context of improving understanding of the relationship between economic activity, the demand for freight, and the performance of the rail and road network. The Auckland – Hamilton – Tauranga (AHT) triangle was used as a pilot case study.
The research involved the design and construction of three models: two simple Bayesian vector autoregressive model to forecast economic activity and freight flows within the AHT region, and a high level SD model for simulating freight flows along the main roads in the region. The key strength, and hence the main reason for selecting an SD model for this latter task, is that time is explicit. This means the SD model can simulate processes such as traffic flows, encompassing delays, congestion and capacity constraints.
The SD model can be used to ask ‘what if’ questions around future freight growth and infrastructure planning. Examples include road improvements along the Waikato Expressway and the Kaimai Range, greater use of larger (HPMV) trucks, changes in driver working hours and road–rail substitution.
OBTAINING TRANSPORT AGENCY RESEARCH REPORTSAll research reports published since 2005 are available free of cost for downloading from the Transport Agency’s website www.nzta.govt.nz/planning/programming/researchPDF scans of research reports published prior to 2005 are available by emailing [email protected]
Ex-post evaluation of transport interventions using causal inference methodsNZ Transport Agency research report 630Freely available online at www.nzta.govt.nz/resources/research/reports/630
This report reviews, summarises and gives guidance for the choice and application of causal inference techniques to ex-post evaluation of the impacts of interventions in the transport sector.
Such techniques seek to establish robust counterfactual outcomes against which post-intervention outcomes can be compared, while accounting for the effects of other factors aside from the intervention itself.
The report illustrates the application of key techniques using two New Zealand case studies, and gives recommendations to improve the robustness of ex-post evaluations.
12 | NZ Transport Agency NZTA research December 2017
A NOTE FOR READERS
NZTA research newsletterThe NZTA research newsletter is published quarterly by the NZ Transport Agency. Its purpose is to profile research funded through the Transport Agency’s Research Programme, to act as a forum for passing on national and international information, and to aid collaboration between all those involved. For information about the Transport Agency’s Research Programme, see www.nzta.govt.nz/planning/programming/research.html.Advertisements of forthcoming conferences and workshops, that are within the newsletter’s field of interest, may be published free of charge when space permits.Published articles may be reproduced and reference made to any part of this publication, provided appropriate credit is given.All general correspondence, queries related to conference notices, and requests for additions or amendments to the mailing list, should be made to [email protected] .
DisclaimerThe views expressed in the NZTA research newsletter are the outcome of research and should not be regarded as being the opinion, responsibility or policy of the Transport Agency or of any agency of the New Zealand Government.
Availability of NZTA researchThe current edition of the NZTA research newsletter is available in hard copy or on the Transport Agency website, along with all previous editions of the newsletter, at www.nzta.govt.nz/resources/nzta-research/.
Email alerts of newly published research reportsEmail notifications are provided when new issues of the NZTA research newsletter are published. Notification is also provided when new Transport Agency research reports are published on the Transport Agency’s website at www.nzta.govt.nz/planning/programming/research.html. Please email [email protected] if you would like to receive these email alerts.
Do we have your correct details?We would like to hear from you at [email protected] if you wish to:• add or update names, email or address details• receive the NZTA research newsletter in hard copy format• receive email notification of the publication of the
NZTA research newsletter and research reports • alter the number of NZTA research newsletter hard
copies you receive.
Media contactFor media enquiries – contact Andrew Knackstedt, National Media Manager, on [email protected], ph 04 894 5400.
Other Transport Agency contactsAlex Brocklehurst – Manager, Research & Evaluation ProgrammeNigel Curran – Senior Analyst, Research & Evaluation ProgrammeKaren Johnson – Coordinator, Research & Evaluation ProgrammeFor any enquiries, email [email protected] NZTA research | NZ Transport Agency | Private Bag 6995 | Wellington 6141 | New Zealand
www.nzta.govt.nz
DID YOU KNOW...That there is a spreadsheet on the Transport Agency website listing all published Transport Agency research reports?
The spreadsheet is searchable by several criteria and can be found at www.nzta.govt.nz/planning/programming/research.html.
The spreadsheet has two worksheets; the first worksheet lists research reports with associated key words and the second lists research reports with the report abstracts.
THE NZ TRANSPORT AGENCY WISHES YOU A VERY MERRY CHRISTMAS AND SAFE JOURNEYS THROUGHOUT YOUR HOLIDAYS.