Embed Size (px)
Citation preview
Determination of Dipyridamole in the presence of its degradationproducts and in the presence of Aspirin
INTRODUCTION
Dipyridamole is widely used as a coronaryvasodilator in patients with high blood pressure, aprophylactic agent in patients with angina pectoris andan inhibitor of platelet aggregation in various thrombo-embolic conditions[1]. The known pharmacologicalapproach for the prevention of thrombotic accidents
M.F.Abdel-Ghany, L.A.Hussien, M.H.Abdel Rahman*Pharmaceutical Analytical Chemistry Department, Faculty of Pharmacy, Ain Shams University,
Abbassia, 11566 Cairo, (EGYPT)E-mail : [email protected]
is to use Dipyridamole in combination with Aspirin(acetylsalicylic acid). The mechanism of action is toinhibit the cellular uptake and metabolism of adenosinewith resulting vasodilatory and anti-aggregatory effects.Aspirin inhibits platelet aggregation by irreversibleinhibition of platelet cyclooxygenase and thus inhibitingthe generation of Thromboxane A2. Dipyridamoleinhibits the uptake of adenosine into platelets and
KEYWORDS
Stability;Acid;
Plasma;Divisor.
ABSTRACT
A stability-indicating thin-layer chromatographic method (TLC) was de-veloped for the determination of Dipyridamole in presence of its acid, alka-line, oxidative and thermal induced degradates. This TLC method and adouble divisor ratio spectra derivative method were developed for determi-nation of Dipyridamole in presence of Aspirin and Salicylic acid, as thecombination of Dipyridamole and Aspirin is widely used to reduce throm-bosis in patients with thrombotic diseases. Dipyridamole was separatedby TLC densitometic method from its degradates on silica gel plates usingacetonitrile:ammonia 33% (4:1, v/v) as a developing system. This methoddepends on quantitative densitometric evaluation of thin layer chromato-gram of Dipyridamole at 230 nm over a concentration range of 0.30-15.00ìg/spot with mean percentage recovery 99.87 ± 0.62. The double divisor
ratio spectra derivative method (DDRD) depends on the measurement ofthe amplitude at 252nm using Aspirin and Salicylic acid as double divisor.Calibration graph of (DDRD) method for Dipyridamole is linear in the con-centration range 1�10 ìg /ml with mean percentage recovery 99.47 ± 1.41.
The proposed methods have been successfully applied for the analysis ofDipyridamole in pharmaceutical dosage form without interference from otherdosage form additives and the results were statistically analyzed and com-pared with those obtained by certain validated published method. More-over, The TLC-densitometric method was successfully applied for the de-termination of Dipyridamole in spiked human plasma with mean percent-age recovery 101.96± 4.28. 2016 Trade Science Inc. - INDIA
ACAIJ, 16(8) 2016 [344-361]
An Indian Journal
Volume 16 Issue 8
Analytical CHEMISTRYAnalytical CHEMISTRYISSN : 0974-7419
Full Paper
id3092671 pdfMachine by Broadgun Software - a great PDF writer! - a great PDF creator! - http://www.pdfmachine.com http://www.broadgun.com
M.H.Abdel Rahman et al. 345
Full PaperACAIJ, 16(8) 2016
An Indian JournalAnalytical CHEMISTRYAnalytical CHEMISTRY
endothelial cells, thus decreasing the adhesion ofplatelets to thrombogenic surfaces[2,3]. Analyticalmethods such as high performance liquidchromatography HPLC [4-10], electrochemicalanalysis[11-14], spectrophotometric methods[15] andphosphorimetric methods were reported for thedetermination of Dipyridamole[16,17]. A few analyticalprocedures were also proposed for the determinationof Dipyridamole in dosage forms in human plasma,serum, urine and feces [18-20]. Although thecombinational use of Aspirin and Dipyridamole iscontinuously increasing, few methods were reportedfor the simultaneous determination of Aspirin andDipyridamole including combination of liquidchromatographic and mass spectrometric detection[21],second-order derivative spectrophometry[22] and byspectrofluorimetric method[23]. The focus of the ourstudy is to develop and validate a simple stability-indicating method for the determination ofDipyridamole in presence of its acid, alkaline,oxidative and thermal degradates for the quality controlof Dipyridamole as well as in presence of Aspirin andSalicylic acid without any interference that can be usedfor quality control and routine analysis.
MATERIALS AND METHODS
Instruments
TLC scanner (Desaga Densitometer model CD60(Germany) with the following requirements are takeninto consideration: Photo mode : Reflectance. Scan mode : Linear slit scanning. Scanning speed : 20 mm/ sec. Slit width = 0.4 mm. Slit height = 0.02 mm Result output : Densitogram and peak
list.TLC plates (20cmX10cm) coated with silica gel
60 F254(Merck, Germany). A 30 Desaga Applicator.A Desaga chromatographic tank 20× 21× 9 cm. A
Desaga UV lamp (254 nm), (USA). Oven, TEQ,Model D4MV (Portugal). Jenway PH meter(Germany). Thermostatic multiple water bath, modelBT- 15 (Spain). Double beam UV-VISspectrophotometer (Shimadzu, Japan) model1601 Pc
with quartz cell of 1 cm pathlength, connected to IBMcompatible computer. The software was UVPCpersonal spectroscopy software version 3.7. Thespectral band width was 2 nm and the wavelengthscanning speed 2800nm /min. High Performance LiquidChromatograph (HPLC) consists of a solvent deliverysystem (SHIMADZU LC-20AT), which is a stand-alone modular unit that features a reciprocating singlepiston isocratic pump. The pump is coupled with anefficient pulse damping hardware and delivers flow in
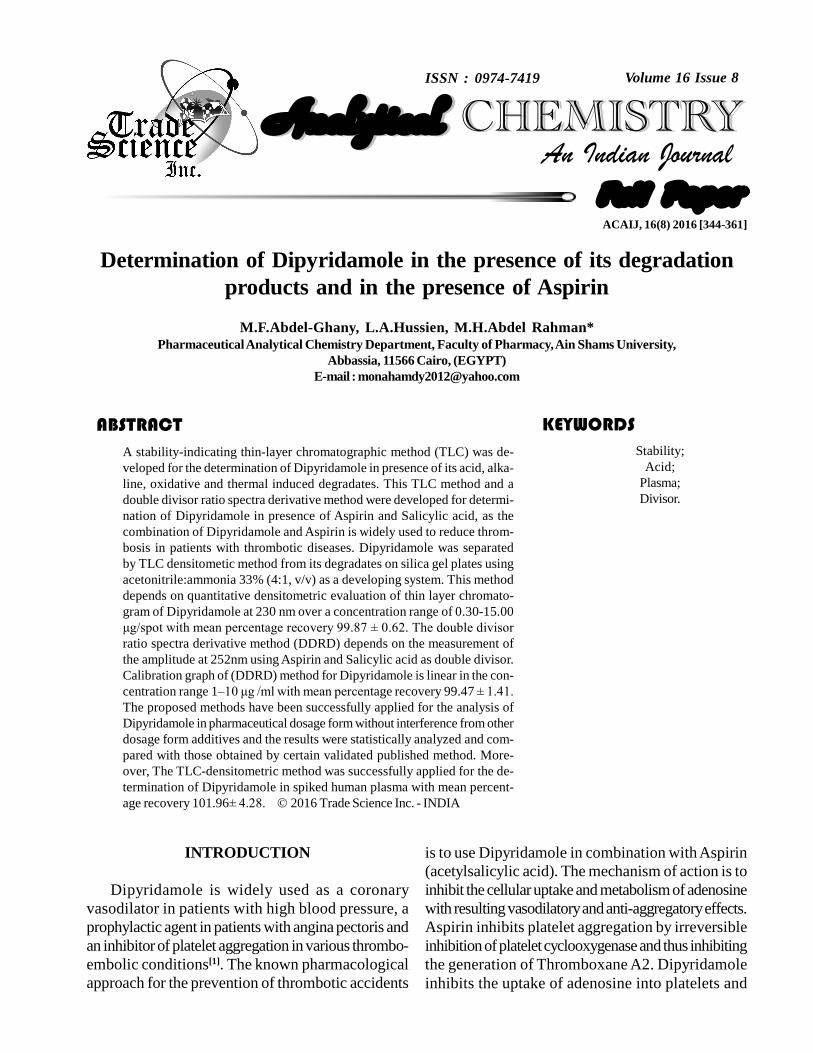
Figure 1 : LC-MS spectra of stressed Dipyridamole samples(a- acid degradates, b- alkaline degradates and c- oxidativedegradates.
(a)
(b)
(c)
Determination of Dipyridamole in the presence of its degradation products and346
Full Paper
ACAIJ, 16(8) 2016
An Indian JournalAnalytical CHEMISTRYAnalytical CHEMISTRY
the linear dynamic range up to 10 (ml/min). SHIMADZU�chromatography data system� was employed for data
collection and handling. Shimadzu Autosampler ModelSIL-20A. Analyst software version 1.4.3, appliedbiosystems, MDS, SCIEX, Canada. API 3200 LC/MS/MS system (mass detector) applied biosystemsMDS, SCIEX, Canada.
Materials
Pure standards
Dipyridamole was supplied by Cid PharamaceuticalCompany (Cairo, Egypt). Its purity was found to be99.90% 12. Acetyl salicylic acid was supplied by HikmaPharma (6th October, Egypt). Its purity was found to
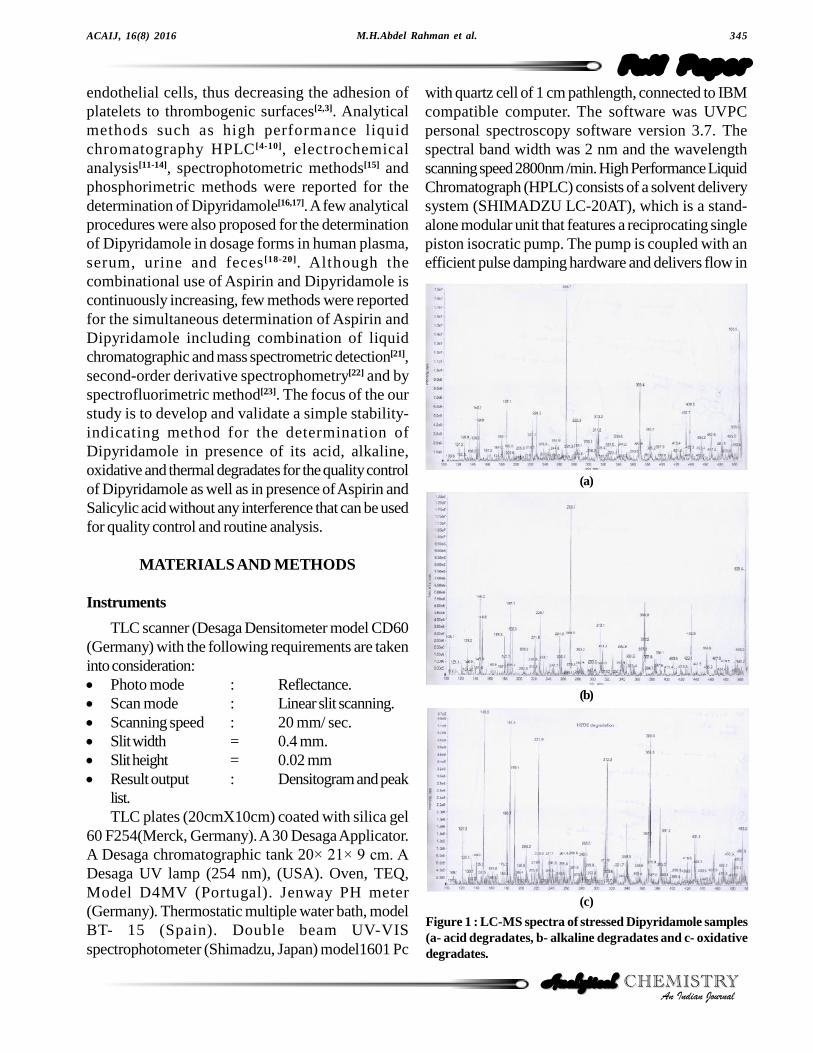
(a)
Figure 2 : LC-MS spectra of stressed Dipyridamole samples (a- wet thermolysis degradates and b- dry thermolysis degradates)
(b)
M.H.Abdel Rahman et al. 347
Full PaperACAIJ, 16(8) 2016
An Indian JournalAnalytical CHEMISTRYAnalytical CHEMISTRY
be 99.50% 23. Salicylic acid (El-Nasr Pharmaceuticalcompany, Abu-Zabal, Cairo, Egypt).
Pharmaceutical dosage forms
Persantin®-75 tablets were manufactured by CidPharamaceutical Company (Cairo, Egypt) under licenseof BoehringerIngelheim, Canada. Each tablet was
labeled to contain 75 mg of Dipyridamole(batchNo.100122).
Chemicals and Reagents
All chemicals and solvents used throughout thiswork were of analytical grade. Ethyl acetate, Sodiumhydroxide, Hydrogen peroxide 50% w/v, Ammonia
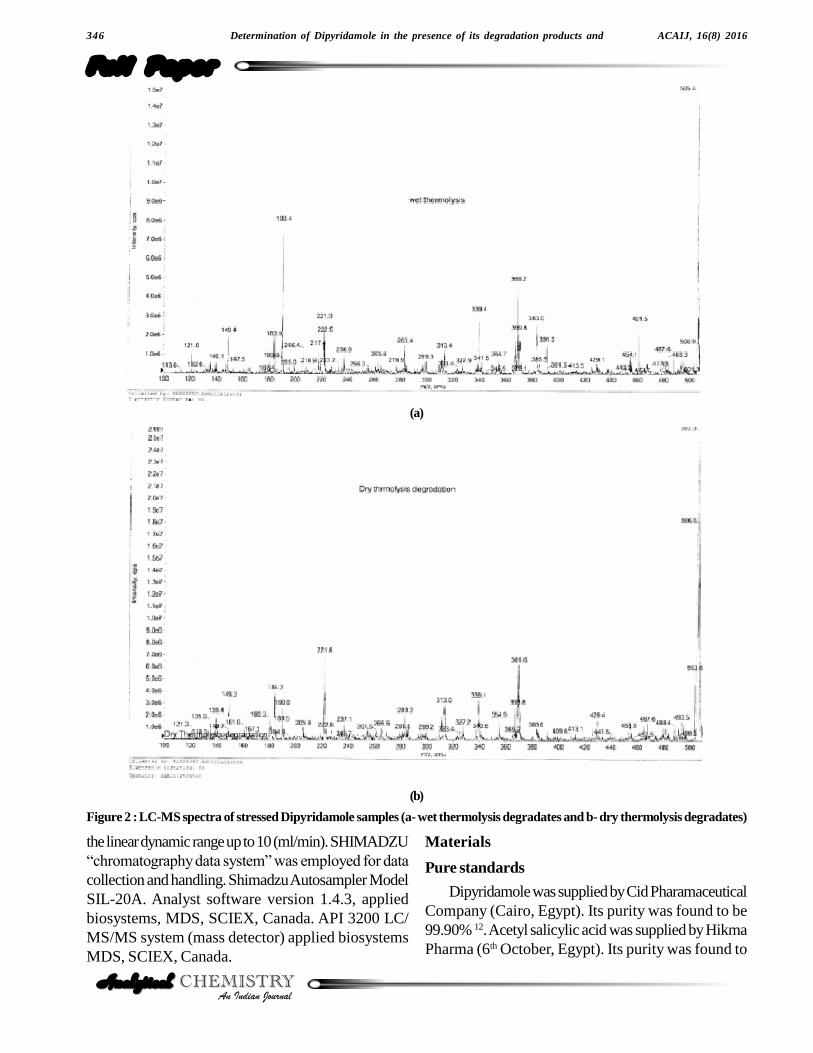
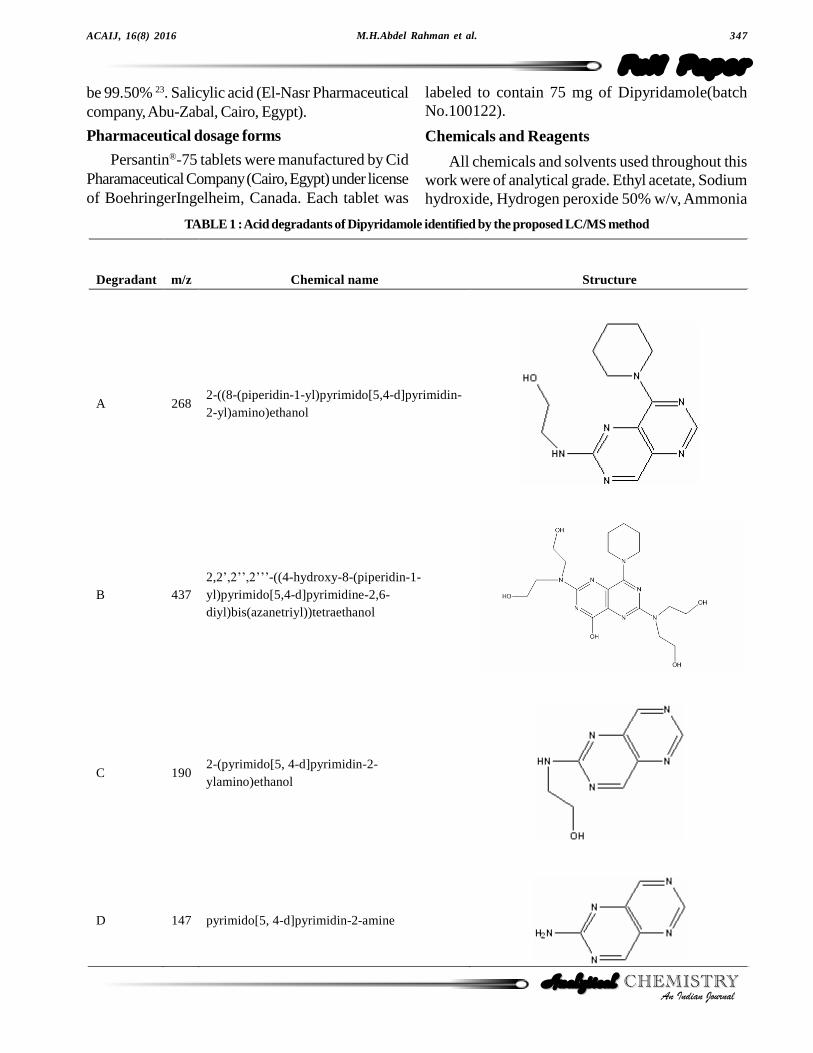
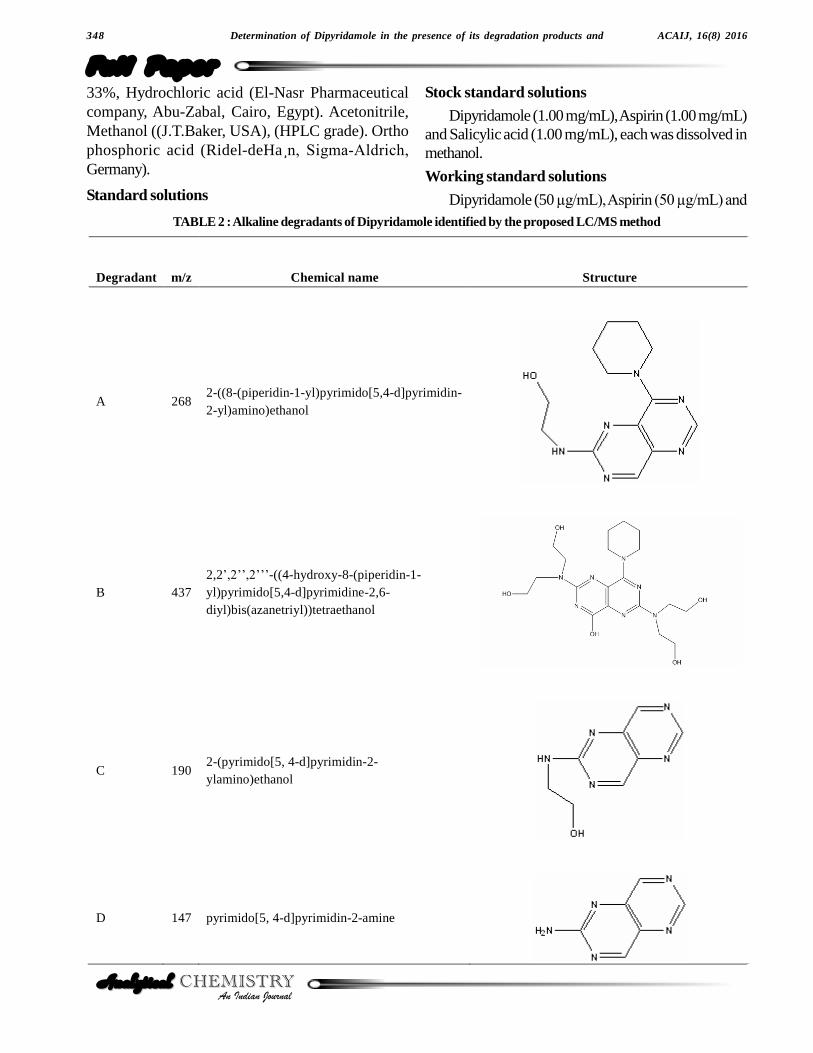
TABLE 1 : Acid degradants of Dipyridamole identified by the proposed LC/MS method
Degradant m/z Chemical name Structure
A 268 2-((8-(piperidin-1-yl)pyrimido[5,4-d]pyrimidin-2-yl)amino)ethanol
B 437 2,2�,2��,2���-((4-hydroxy-8-(piperidin-1-yl)pyrimido[5,4-d]pyrimidine-2,6-diyl)bis(azanetriyl))tetraethanol
C 190 2-(pyrimido[5, 4-d]pyrimidin-2-ylamino)ethanol
D 147 pyrimido[5, 4-d]pyrimidin-2-amine
Determination of Dipyridamole in the presence of its degradation products and348
Full Paper
ACAIJ, 16(8) 2016
An Indian JournalAnalytical CHEMISTRYAnalytical CHEMISTRY
33%, Hydrochloric acid (El-Nasr Pharmaceuticalcompany, Abu-Zabal, Cairo, Egypt). Acetonitrile,Methanol ((J.T.Baker, USA), (HPLC grade). Orthophosphoric acid (Ridel-deHa¸n, Sigma-Aldrich,
Germany).
Standard solutions
Stock standard solutions
Dipyridamole (1.00 mg/mL), Aspirin (1.00 mg/mL)and Salicylic acid (1.00 mg/mL), each was dissolved inmethanol.
Working standard solutions
Dipyridamole (50 µg/mL), Aspirin (50 µg/mL) and
TABLE 2 : Alkaline degradants of Dipyridamole identified by the proposed LC/MS method
Degradant m/z Chemical name Structure
A 268 2-((8-(piperidin-1-yl)pyrimido[5,4-d]pyrimidin-2-yl)amino)ethanol
B 437 2,2�,2��,2���-((4-hydroxy-8-(piperidin-1-yl)pyrimido[5,4-d]pyrimidine-2,6-diyl)bis(azanetriyl))tetraethanol
C 190 2-(pyrimido[5, 4-d]pyrimidin-2-ylamino)ethanol
D 147 pyrimido[5, 4-d]pyrimidin-2-amine
M.H.Abdel Rahman et al. 349
Full PaperACAIJ, 16(8) 2016
An Indian JournalAnalytical CHEMISTRYAnalytical CHEMISTRY
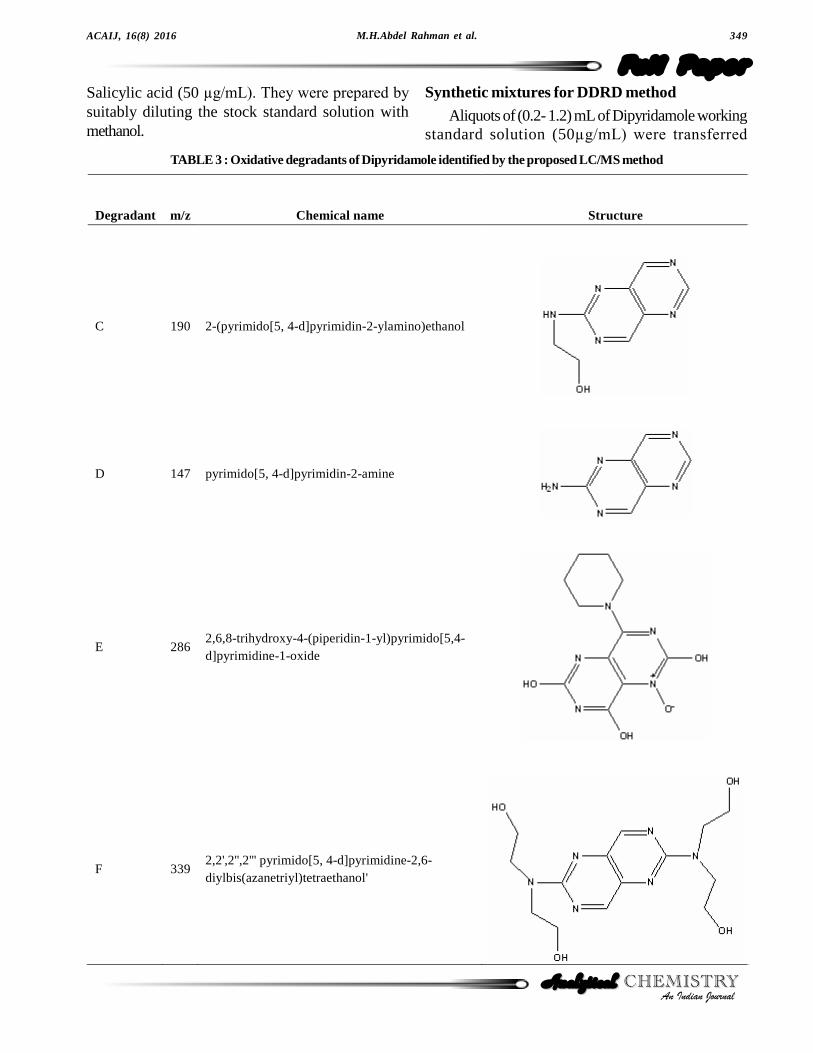
TABLE 3 : Oxidative degradants of Dipyridamole identified by the proposed LC/MS method
Degradant m/z Chemical name Structure
C 190 2-(pyrimido[5, 4-d]pyrimidin-2-ylamino)ethanol
D 147 pyrimido[5, 4-d]pyrimidin-2-amine
E 286 2,6,8-trihydroxy-4-(piperidin-1-yl)pyrimido[5,4-d]pyrimidine-1-oxide
F 339 2,2',2'',2''' pyrimido[5, 4-d]pyrimidine-2,6-diylbis(azanetriyl)tetraethanol'
Salicylic acid (50 µg/mL). They were prepared by
suitably diluting the stock standard solution withmethanol.
Synthetic mixtures for DDRD method
Aliquots of (0.2- 1.2) mL of Dipyridamole workingstandard solution (50µg/mL) were transferred
Determination of Dipyridamole in the presence of its degradation products and350
Full Paper
ACAIJ, 16(8) 2016
An Indian JournalAnalytical CHEMISTRYAnalytical CHEMISTRY
separately into a series of 10-mL volumetric flasks. Tothe previous solutions accurately measured volumes (0.6mL) of each of Aspirin and salicylic acid (50µg/mL)
were added. The volume was completed to mark withmethanol.
Using the proposed methods, the samples wereanalyzed for Dipyridamole contents. The concentrationswere calculated from the corresponding regressionequation; the mean percentage recoveries and standarddeviations were then calculated.
Degraded samples
Acid and alkaline induced degradation
Two mL of Dipyridamole stock solution weretransferred into a conical flask and mixed with 2.00 mLof 1 M HCl or 2.00 mL of 1 M NaOH for acid andalkaline degradation, respectively. The mixture washeated on a thermostatically controlled water bath at90R�C for one hour while fitting air condenser. The
solution was cooled and then neutralized with 2 MNaOH or 2 M HCl. PH was monitored with PH glasselectrode. The solution was transferred quantitavely into
10-mL volumetric flask and the volume was thencompleted with methanol.
Hydrogen peroxide-induced degradation
Two mL of Dipyridamole stock solution weretransferred into 10-mL volumetric flask and mixed with2.00 mL 3% H
2O
2. The mixture was left for 30 minutes
at room temperature. The volume was completed withmethanol.
Wet themolysis
Two mL of Dipyridamole stock solution weretransferred into a conical flask and mixed with 2.00 mLdistilled water, the mixture was heated on athermostatically controlled water bath at 90R�C for two
hours while fitting air condenser. The solution was cooledand transferred quantitavely into 10-mL volumetric flaskand the volume was then completed with methanol.
Dry thermolysis
Dipyridamole bulk powder was spread on petridishin thin film about 2 mm thickness) in an oven at 90R�Cfor an hour. After exposure, about 50 mg ofDipyridamole powder were accurately weighed into
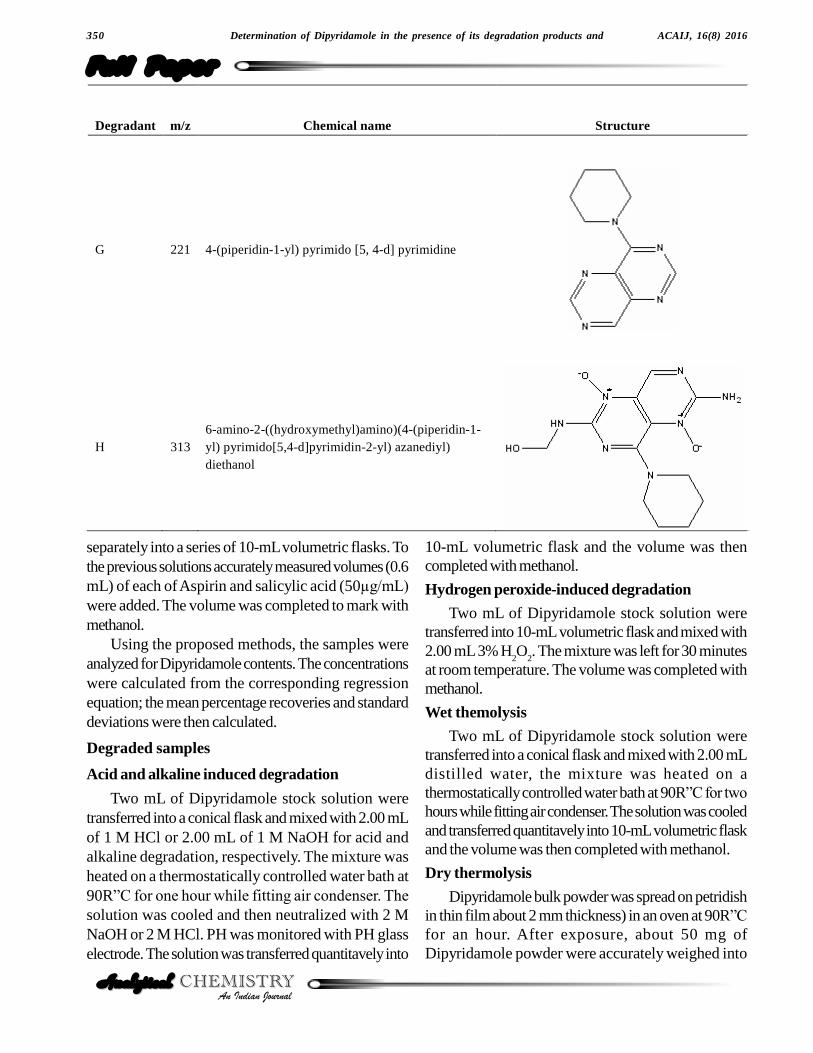
Degradant m/z Chemical name Structure
G 221 4-(piperidin-1-yl) pyrimido [5, 4-d] pyrimidine
H 313 6-amino-2-((hydroxymethyl)amino)(4-(piperidin-1-yl) pyrimido[5,4-d]pyrimidin-2-yl) azanediyl) diethanol
M.H.Abdel Rahman et al. 351
Full PaperACAIJ, 16(8) 2016
An Indian JournalAnalytical CHEMISTRYAnalytical CHEMISTRY
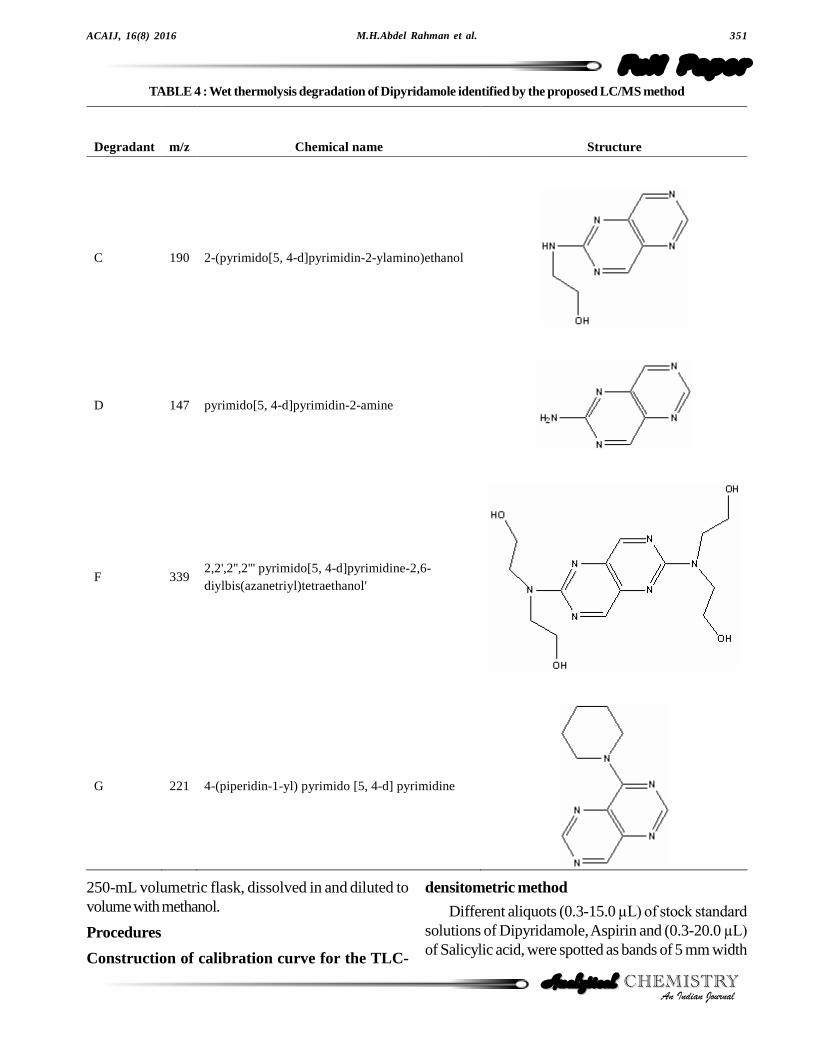
TABLE 4 : Wet thermolysis degradation of Dipyridamole identified by the proposed LC/MS method
Degradant m/z Chemical name Structure
C 190 2-(pyrimido[5, 4-d]pyrimidin-2-ylamino)ethanol
D 147 pyrimido[5, 4-d]pyrimidin-2-amine
F 339 2,2',2'',2''' pyrimido[5, 4-d]pyrimidine-2,6-diylbis(azanetriyl)tetraethanol'
G 221 4-(piperidin-1-yl) pyrimido [5, 4-d] pyrimidine
250-mL volumetric flask, dissolved in and diluted tovolume with methanol.
Procedures
Construction of calibration curve for the TLC-
densitometric method
Different aliquots (0.3-15.0 µL) of stock standard
solutions of Dipyridamole, Aspirin and (0.3-20.0 µL)
of Salicylic acid, were spotted as bands of 5 mm width
Determination of Dipyridamole in the presence of its degradation products and352
Full Paper
ACAIJ, 16(8) 2016
An Indian JournalAnalytical CHEMISTRYAnalytical CHEMISTRY
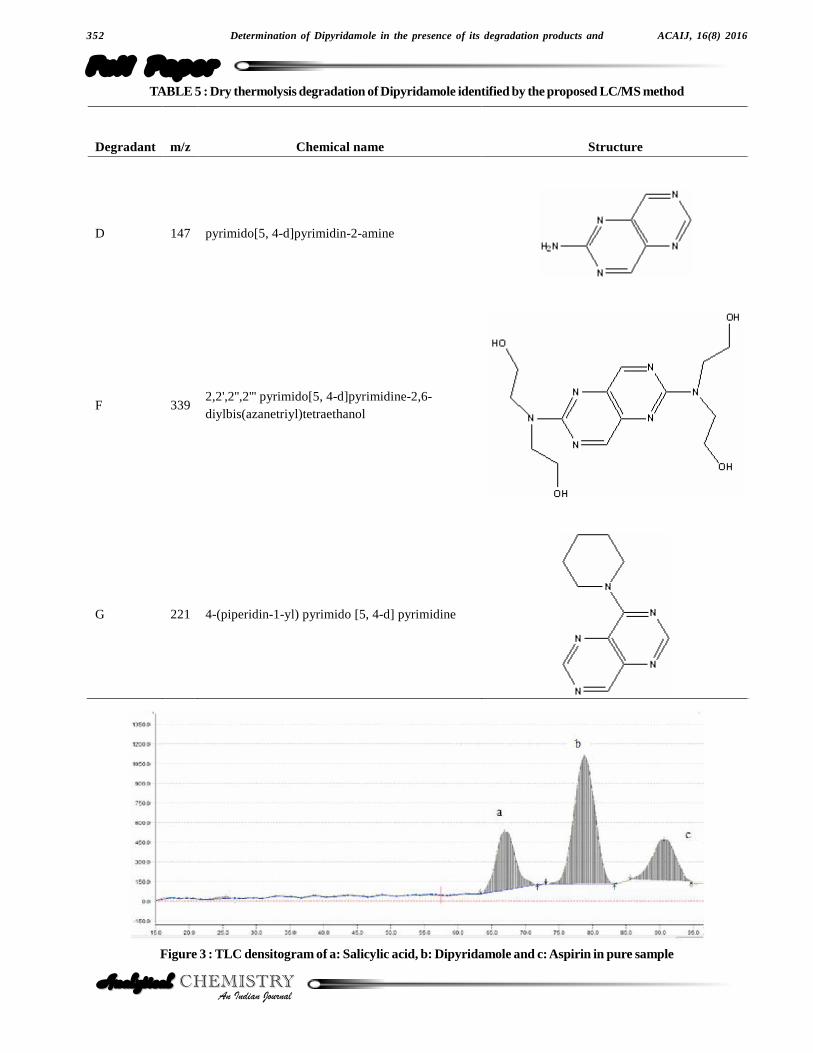
TABLE 5 : Dry thermolysis degradation of Dipyridamole identified by the proposed LC/MS method
Degradant m/z Chemical name Structure
D 147 pyrimido[5, 4-d]pyrimidin-2-amine
F 339 2,2',2'',2''' pyrimido[5, 4-d]pyrimidine-2,6-diylbis(azanetriyl)tetraethanol
G 221 4-(piperidin-1-yl) pyrimido [5, 4-d] pyrimidine
Figure 3 : TLC densitogram of a: Salicylic acid, b: Dipyridamole and c: Aspirin in pure sample
M.H.Abdel Rahman et al. 353
Full PaperACAIJ, 16(8) 2016
An Indian JournalAnalytical CHEMISTRYAnalytical CHEMISTRY
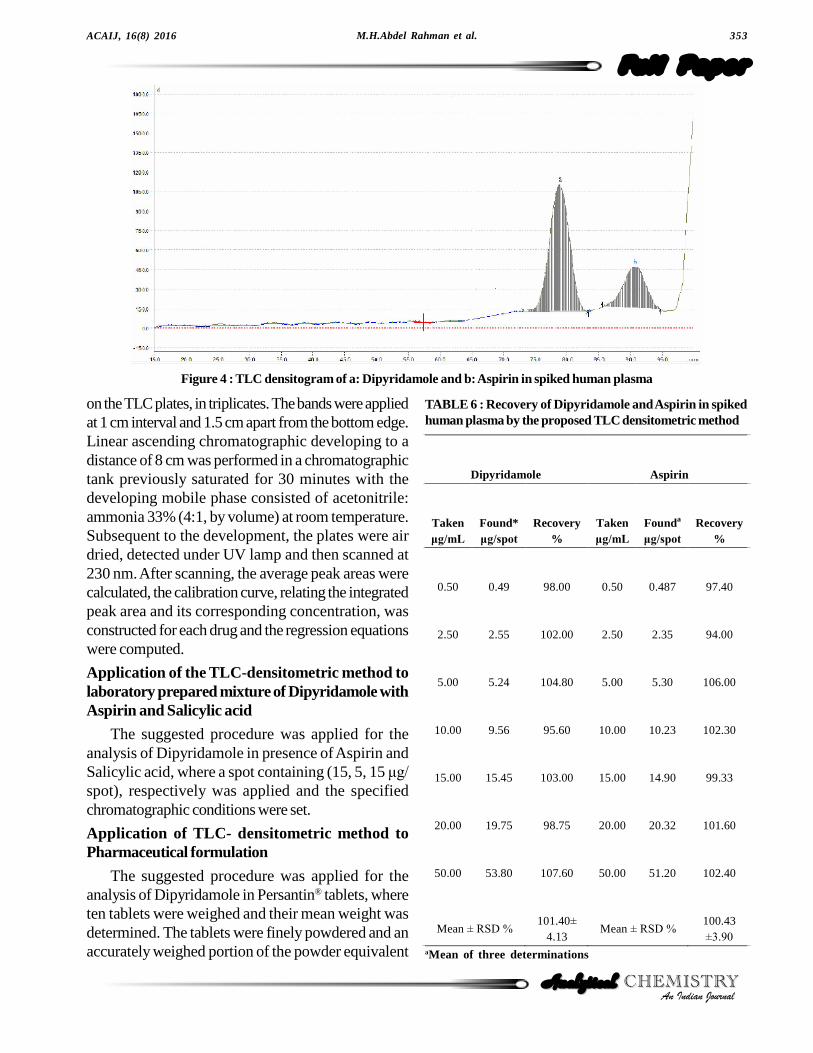
Figure 4 : TLC densitogram of a: Dipyridamole and b: Aspirin in spiked human plasma
on the TLC plates, in triplicates. The bands were appliedat 1 cm interval and 1.5 cm apart from the bottom edge.Linear ascending chromatographic developing to adistance of 8 cm was performed in a chromatographictank previously saturated for 30 minutes with thedeveloping mobile phase consisted of acetonitrile:ammonia 33% (4:1, by volume) at room temperature.Subsequent to the development, the plates were airdried, detected under UV lamp and then scanned at230 nm. After scanning, the average peak areas werecalculated, the calibration curve, relating the integratedpeak area and its corresponding concentration, wasconstructed for each drug and the regression equationswere computed.
Application of the TLC-densitometric method tolaboratory prepared mixture of Dipyridamole withAspirin and Salicylic acid
The suggested procedure was applied for theanalysis of Dipyridamole in presence of Aspirin andSalicylic acid, where a spot containing (15, 5, 15 ìg/
spot), respectively was applied and the specifiedchromatographic conditions were set.
Application of TLC- densitometric method toPharmaceutical formulation
The suggested procedure was applied for theanalysis of Dipyridamole in Persantin® tablets, whereten tablets were weighed and their mean weight wasdetermined. The tablets were finely powdered and anaccurately weighed portion of the powder equivalent
TABLE 6 : Recovery of Dipyridamole and Aspirin in spikedhuman plasma by the proposed TLC densitometric method
Dipyridamole Aspirin
Taken ìg/mL
Found* ìg/spot
Recovery %
Taken ìg/mL
Founda
ìg/spot Recovery
%
0.50 0.49 98.00 0.50 0.487 97.40
2.50 2.55 102.00 2.50 2.35 94.00
5.00 5.24 104.80 5.00 5.30 106.00
10.00 9.56 95.60 10.00 10.23 102.30
15.00 15.45 103.00 15.00 14.90 99.33
20.00 19.75 98.75 20.00 20.32 101.60
50.00 53.80 107.60 50.00 51.20 102.40
Mean ± RSD % 101.40±
4.13 Mean ± RSD %
100.43 ±3.90
aMean of three determinations
Determination of Dipyridamole in the presence of its degradation products and354
Full Paper
ACAIJ, 16(8) 2016
An Indian JournalAnalytical CHEMISTRYAnalytical CHEMISTRY
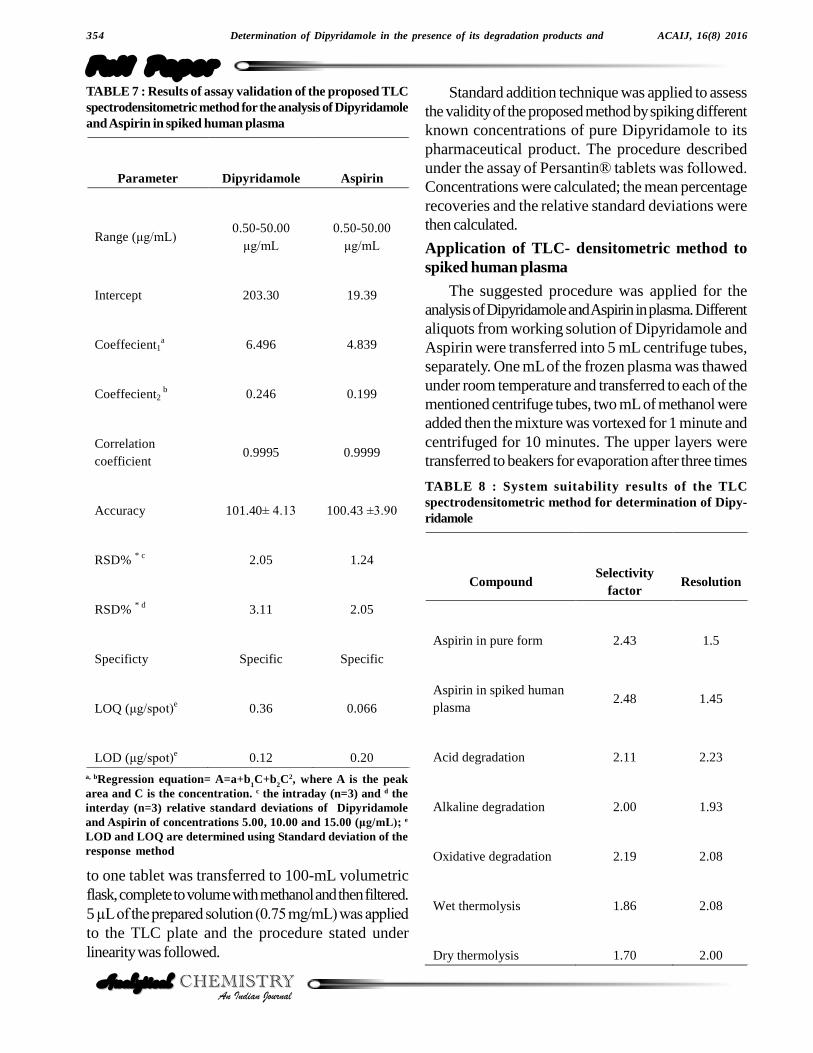
TABLE 7 : Results of assay validation of the proposed TLCspectrodensitometric method for the analysis of Dipyridamoleand Aspirin in spiked human plasma
Parameter Dipyridamole Aspirin
Range (ìg/mL) 0.50-50.00 ìg/mL
0.50-50.00 ìg/mL
Intercept 203.30 19.39
Coeffecient1a 6.496 4.839
Coeffecient2 b 0.246 0.199
Correlation coefficient
0.9995 0.9999
Accuracy 101.40± 4.13 100.43 ±3.90
RSD% * c 2.05 1.24
RSD% * d 3.11 2.05
Specificty Specific Specific
LOQ (ìg/spot)e 0.36 0.066
LOD (ìg/spot)e 0.12 0.20
a, bRegression equation= A=a+b1C+b
2C2, where A is the peak
area and C is the concentration. c the intraday (n=3) and d theinterday (n=3) relative standard deviations of Dipyridamoleand Aspirin of concentrations 5.00, 10.00 and 15.00 (ìg/mL); e
LOD and LOQ are determined using Standard deviation of theresponse method
to one tablet was transferred to 100-mL volumetricflask, complete to volume with methanol and then filtered.5 µL of the prepared solution (0.75 mg/mL) was applied
to the TLC plate and the procedure stated underlinearity was followed.
Standard addition technique was applied to assessthe validity of the proposed method by spiking differentknown concentrations of pure Dipyridamole to itspharmaceutical product. The procedure describedunder the assay of Persantin® tablets was followed.
Concentrations were calculated; the mean percentagerecoveries and the relative standard deviations werethen calculated.
Application of TLC- densitometric method tospiked human plasma
The suggested procedure was applied for theanalysis of Dipyridamole and Aspirin in plasma. Differentaliquots from working solution of Dipyridamole andAspirin were transferred into 5 mL centrifuge tubes,separately. One mL of the frozen plasma was thawedunder room temperature and transferred to each of thementioned centrifuge tubes, two mL of methanol wereadded then the mixture was vortexed for 1 minute andcentrifuged for 10 minutes. The upper layers weretransferred to beakers for evaporation after three times
TABLE 8 : System suitability results of the TLCspectrodensitometric method for determination of Dipy-ridamole
Compound Selectivity
factor Resolution
Aspirin in pure form 2.43 1.5
Aspirin in spiked human plasma
2.48 1.45
Acid degradation 2.11 2.23
Alkaline degradation 2.00 1.93
Oxidative degradation 2.19 2.08
Wet thermolysis 1.86 2.08
Dry thermolysis 1.70 2.00
M.H.Abdel Rahman et al. 355
Full PaperACAIJ, 16(8) 2016
An Indian JournalAnalytical CHEMISTRYAnalytical CHEMISTRY
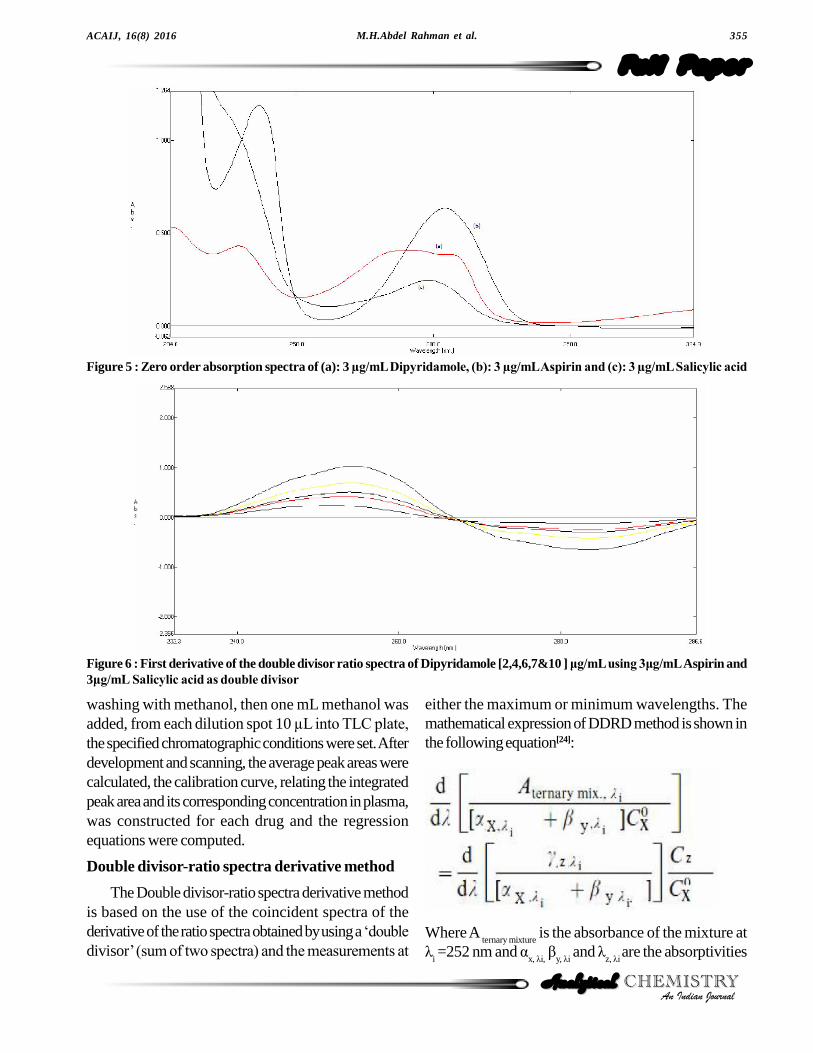
Figure 5 : Zero order absorption spectra of (a): 3 µg/mL Dipyridamole, (b): 3 µg/mL Aspirin and (c): 3 µg/mL Salicylic acid
Figure 6 : First derivative of the double divisor ratio spectra of Dipyridamole [2,4,6,7&10 ] ìg/mL using 3ìg/mL Aspirin and3ìg/mL Salicylic acid as double divisor
washing with methanol, then one mL methanol wasadded, from each dilution spot 10 µL into TLC plate,
the specified chromatographic conditions were set. Afterdevelopment and scanning, the average peak areas werecalculated, the calibration curve, relating the integratedpeak area and its corresponding concentration in plasma,was constructed for each drug and the regressionequations were computed.
Double divisor-ratio spectra derivative method
The Double divisor-ratio spectra derivative methodis based on the use of the coincident spectra of thederivative of the ratio spectra obtained by using a �double
divisor� (sum of two spectra) and the measurements at
either the maximum or minimum wavelengths. Themathematical expression of DDRD method is shown inthe following equation[24]:
Where A ternary mixture
is the absorbance of the mixture atë
i =252 nm and á
x, ëi, â
y, ëi and ë
z, ëi are the absorptivities
Determination of Dipyridamole in the presence of its degradation products and356
Full Paper
ACAIJ, 16(8) 2016
An Indian JournalAnalytical CHEMISTRYAnalytical CHEMISTRY
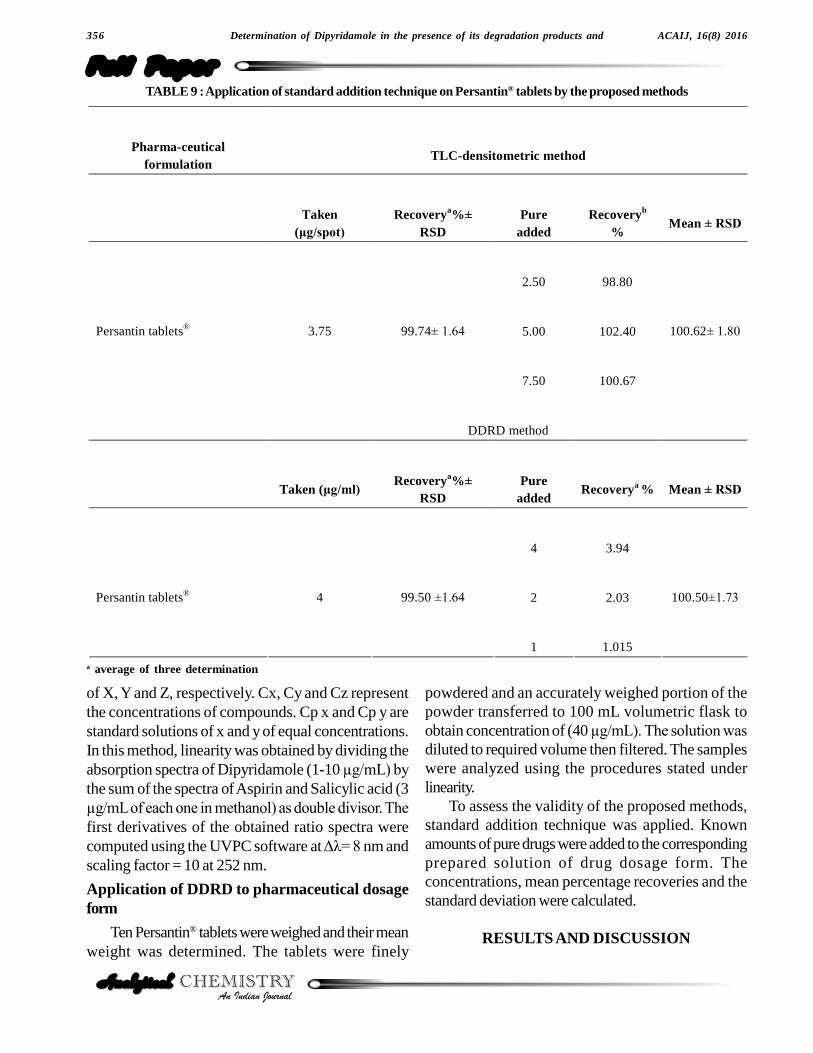
TABLE 9 : Application of standard addition technique on Persantin® tablets by the proposed methods
Pharma-ceutical formulation
TLC-densitometric method
Taken
(ìg/spot) Recoverya%±
RSD Pure
added Recoveryb
% Mean ± RSD
2.50 98.80
5.00 102.40 Persantin tablets® 3.75 99.74± 1.64
7.50 100.67
100.62± 1.80
DDRD method
Taken (ìg/ml) Recoverya%±
RSD Pure
added Recoverya % Mean ± RSD
4 3.94
2 2.03 Persantin tablets® 4 99.50 ±1.64
1 1.015
100.50±1.73
a average of three determination
of X, Y and Z, respectively. Cx, Cy and Cz representthe concentrations of compounds. Cp x and Cp y arestandard solutions of x and y of equal concentrations.In this method, linearity was obtained by dividing theabsorption spectra of Dipyridamole (1-10 µg/mL) by
the sum of the spectra of Aspirin and Salicylic acid (3µg/mL of each one in methanol) as double divisor. The
first derivatives of the obtained ratio spectra werecomputed using the UVPC software at Äë= 8 nm andscaling factor = 10 at 252 nm.
Application of DDRD to pharmaceutical dosageform
Ten Persantin® tablets were weighed and their meanweight was determined. The tablets were finely
powdered and an accurately weighed portion of thepowder transferred to 100 mL volumetric flask toobtain concentration of (40 µg/mL). The solution was
diluted to required volume then filtered. The sampleswere analyzed using the procedures stated underlinearity.
To assess the validity of the proposed methods,standard addition technique was applied. Knownamounts of pure drugs were added to the correspondingprepared solution of drug dosage form. Theconcentrations, mean percentage recoveries and thestandard deviation were calculated.
RESULTS AND DISCUSSION
M.H.Abdel Rahman et al. 357
Full PaperACAIJ, 16(8) 2016
An Indian JournalAnalytical CHEMISTRYAnalytical CHEMISTRY
TLC- densitometric method
The international conference onHarmonization(ICH) guidelines entitled � stability testing
of new drug substances and products� requires the
stress testing to be carried out to elucidate the inherentstability characterstics of the active substances 25. Anideal stability indicating method is one that quantifiesthe standard drug alone and also resolves its degradationproducts. Several degradates of Dipyridamole wereformed when conducting different stress testing studiesand the structures of acid, alkaline, oxidative, wet anddry thermal degradates were elucidated by LC-MS.Figure 1, 2 demonstrate the LC-MS chromatogramsof acid, alkaline, oxidative, dry and wet thermaldegradates for Dipyridamole. The m/z values, chemicalnames and structures of the proposed degradates arepresented in TABLES 1�5. The suggested mechanism
of degradation is nucleophilic substitution either by watermolecule potentiated by acid in case of acidic hydrolysisor by hydroxyl group in case of alkaline hydrolysis andformation of N oxide in oxidative degradation byhydrogen peroxide.
Development of the optimum mobile phase forTLC-densitometric method
The TLC procedure was optimized to develop astability-indicating assay method by trialing differentsolvent systems. Systems like mixtures of ethyl acetate,methanol and ammonia 33% in varying ratios were used,but they show poor resolution of Dipyridamole from itsdegradates. Systems containing acetonitrile, methanoland ammonia 33% didn�t separate many of degradates
produced. Systems containing acetone, methanol andammonia 33% with varying ratios, the drug migrate withthe mobile phase to reach solvent front. Systemscontaining diethyl ether, acetonitrile and ammonia 33%in varying ratios were examined but produce poorresolution of Dipyridamole and Aspirin.
In our proposed method, the optimum mobile phasewas acetonitrile: ammonia 33% (16: 4, by volume). Thisphase gave sharp and symmetric peak of Dipyridamoleat R
f =0.75, together with good separation of the drug
peak from Aspirin and Salicylic acid (Figure 3) and alsofrom the degradates peaks.
The densitograms of the stressed samples of thebulk powders and the TLC plates showed well
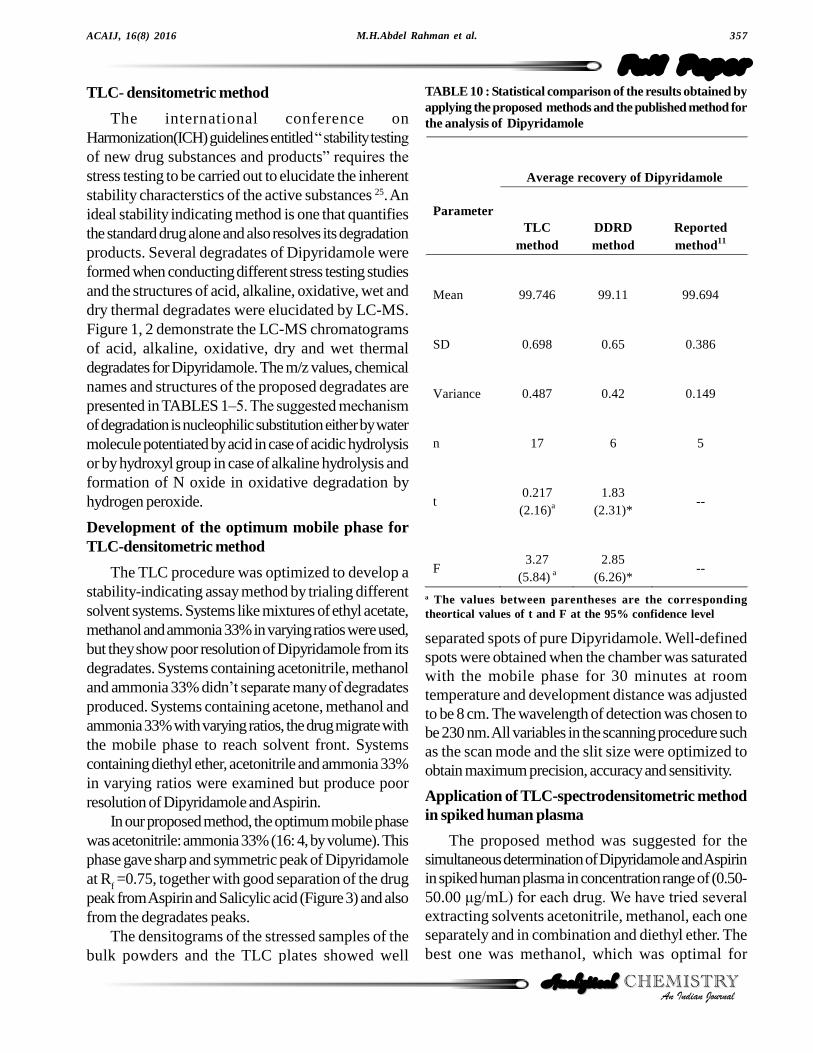
TABLE 10 : Statistical comparison of the results obtained byapplying the proposed methods and the published method forthe analysis of Dipyridamole
Average recovery of Dipyridamole
Parameter TLC
method DDRD method
Reported method11
Mean 99.746 99.11 99.694
SD 0.698 0.65 0.386
Variance 0.487 0.42 0.149
n 17 6 5
t 0.217 (2.16)a
1.83 (2.31)*
--
F 3.27
(5.84) a 2.85
(6.26)* --
a The values between parentheses are the correspondingtheortical values of t and F at the 95% confidence level
separated spots of pure Dipyridamole. Well-definedspots were obtained when the chamber was saturatedwith the mobile phase for 30 minutes at roomtemperature and development distance was adjustedto be 8 cm. The wavelength of detection was chosen tobe 230 nm. All variables in the scanning procedure suchas the scan mode and the slit size were optimized toobtain maximum precision, accuracy and sensitivity.
Application of TLC-spectrodensitometric methodin spiked human plasma
The proposed method was suggested for thesimultaneous determination of Dipyridamole and Aspirinin spiked human plasma in concentration range of (0.50-50.00 ìg/mL) for each drug. We have tried several
extracting solvents acetonitrile, methanol, each oneseparately and in combination and diethyl ether. Thebest one was methanol, which was optimal for
Determination of Dipyridamole in the presence of its degradation products and358
Full Paper
ACAIJ, 16(8) 2016
An Indian JournalAnalytical CHEMISTRYAnalytical CHEMISTRY
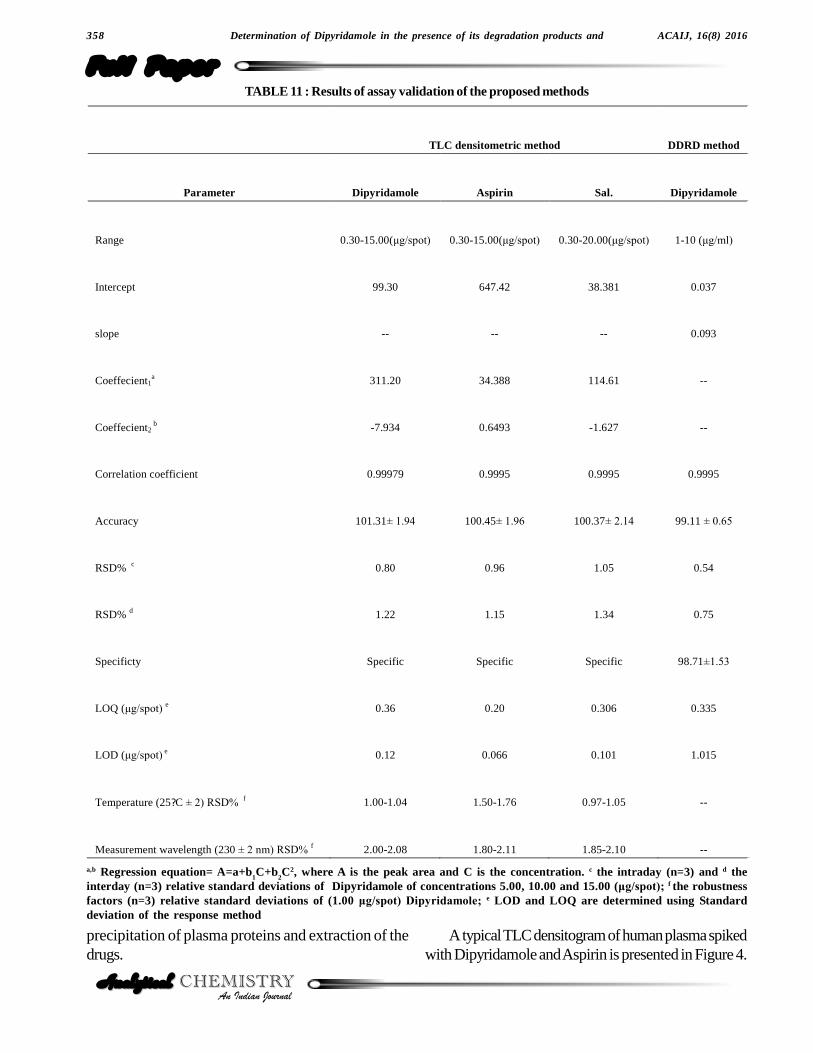
TABLE 11 : Results of assay validation of the proposed methods
TLC densitometric method DDRD method
Parameter Dipyridamole Aspirin Sal. Dipyridamole
Range 0.30-15.00(ìg/spot) 0.30-15.00(ìg/spot) 0.30-20.00(ìg/spot) 1-10 (ìg/ml)
Intercept 99.30 647.42 38.381 0.037
slope -- -- -- 0.093
Coeffecient1a 311.20 34.388 114.61 --
Coeffecient2 b -7.934 0.6493 -1.627 --
Correlation coefficient 0.99979 0.9995 0.9995 0.9995
Accuracy 101.31± 1.94 100.45± 1.96 100.37± 2.14 99.11 ± 0.65
RSD% c 0.80 0.96 1.05 0.54
RSD% d 1.22 1.15 1.34 0.75
Specificty Specific Specific Specific 98.71±1.53
LOQ (ìg/spot) e 0.36 0.20 0.306 0.335
LOD (ìg/spot) e 0.12 0.066 0.101 1.015
Temperature (25?C ± 2) RSD% f 1.00-1.04 1.50-1.76 0.97-1.05 --
Measurement wavelength (230 ± 2 nm) RSD% f 2.00-2.08 1.80-2.11 1.85-2.10 --
a,b Regression equation= A=a+b1C+b
2C2, where A is the peak area and C is the concentration. c the intraday (n=3) and d the
interday (n=3) relative standard deviations of Dipyridamole of concentrations 5.00, 10.00 and 15.00 (ìg/spot); f the robustnessfactors (n=3) relative standard deviations of (1.00 ìg/spot) Dipyridamole; e LOD and LOQ are determined using Standarddeviation of the response method
precipitation of plasma proteins and extraction of thedrugs.
A typical TLC densitogram of human plasma spikedwith Dipyridamole and Aspirin is presented in Figure 4.
M.H.Abdel Rahman et al. 359
Full PaperACAIJ, 16(8) 2016
An Indian JournalAnalytical CHEMISTRYAnalytical CHEMISTRY
The accuracy calculated as percentage recovery was101.40% for Dipyridamole and100.43% for Aspirinwith low values of % RSD demonstrating an excellentaccuracy of the method (TABLE 6).
All the assay validation parameters of the proposedmethod in spiked human plasma are summarized inTABLE 7. The LOD values for Dipyridamole andAspirin were found to be 0.12 and 0.101µg/mL and
LOQ values were found to be 0.36 and 0.306 µg/mL,
respectively. These values indicate that the method issensitive enough for Dipyridamole monitoring andpharmacokinetic studies as peak plasma concentrationof Dipyridamole at steady state is approximately1.98ìg/mL26.
The densitogram of Dipyridamole was wellseparated from Aspirin. The results of system suitabilitytests (TABLE 8) assured the adequacy of the proposedTLC method for the analysis of Dipyridamole andAspirin in human plasma.
The proposed method was tested for specificity bycomparing chromatograms of 6 different sources of blankhuman plasma. The chromatograms were free from anyinterfering peaks at R
f values of the drugs. Thus, the
proposed method can be used for determination ofDipyridamole and Aspirin without interference byendogenous plasma components.
The spiked human plasma freeze and thaw
stability[27] was assisted by storing three aliquots at eachof the low and high concentrations at -20p C for 24hours and thawed unassisted at room temperature.When completely thawed, the samples were refrozenfor 12 to 24 hours under the same conditions. Thefreeze�thaw cycle repeated two more times, then
analyzed on the third cycle, also, the spiked humanplasma samples stored at over a period of one month.In both cases samples didn�t suffer any appreciable
changes in the assay values. In addition, Dipyridamolewas found to be stable in human plasma and the stabilitywas maintained at room temperature for more than 12hours.
DDRD method
It�s apparent from (Figure 5) that the absorption
spectra of Dipyridamole, Aspirin and Salicylic acidexhibit certain degree of spectral overlap, conventionalUV spectrophotometry can�t be used for determination
of Dipyridamole in presence of Aspirin and Salicylicacid. However, the proposed spectrophotometricmethod permits a selective determination ofDipyridamole in presence of Aspirin and Salicylic acidas it resolves band overlapping without physicalseparation.
The absorption spectra of the solutions ofDipyridamole were recorded in the range 232�296 nm
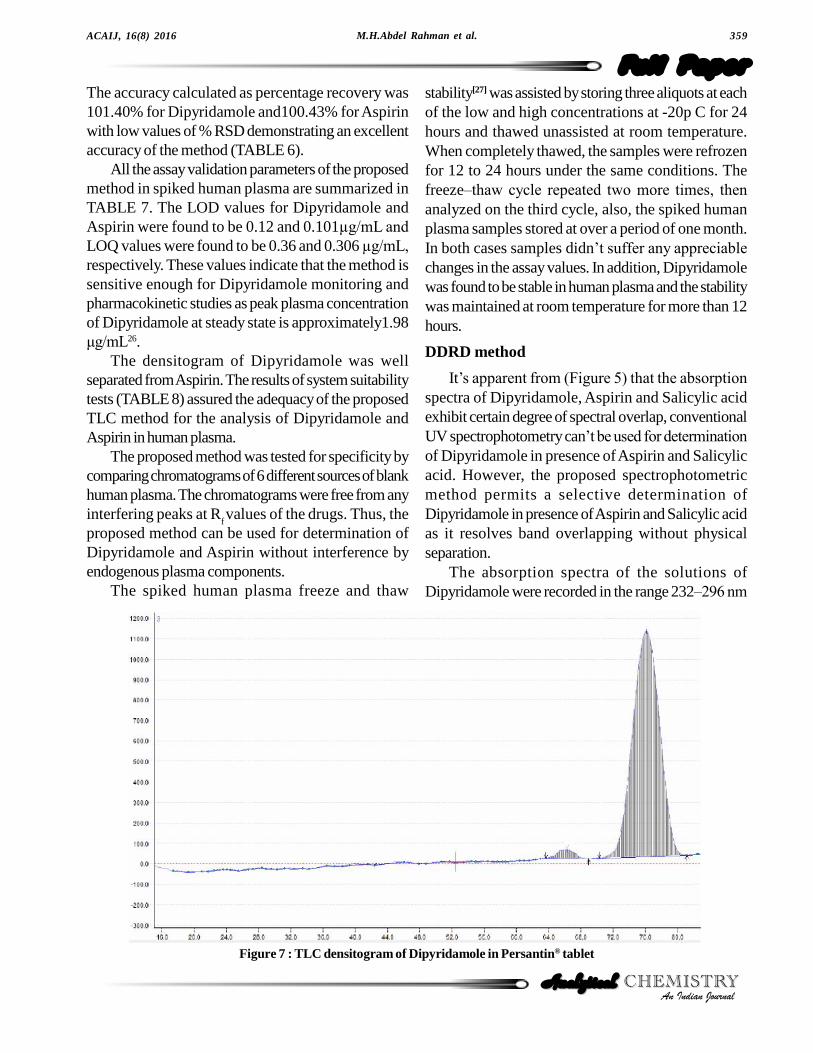
Figure 7 : TLC densitogram of Dipyridamole in Persantin® tablet
Determination of Dipyridamole in the presence of its degradation products and360
Full Paper
ACAIJ, 16(8) 2016
An Indian JournalAnalytical CHEMISTRYAnalytical CHEMISTRY
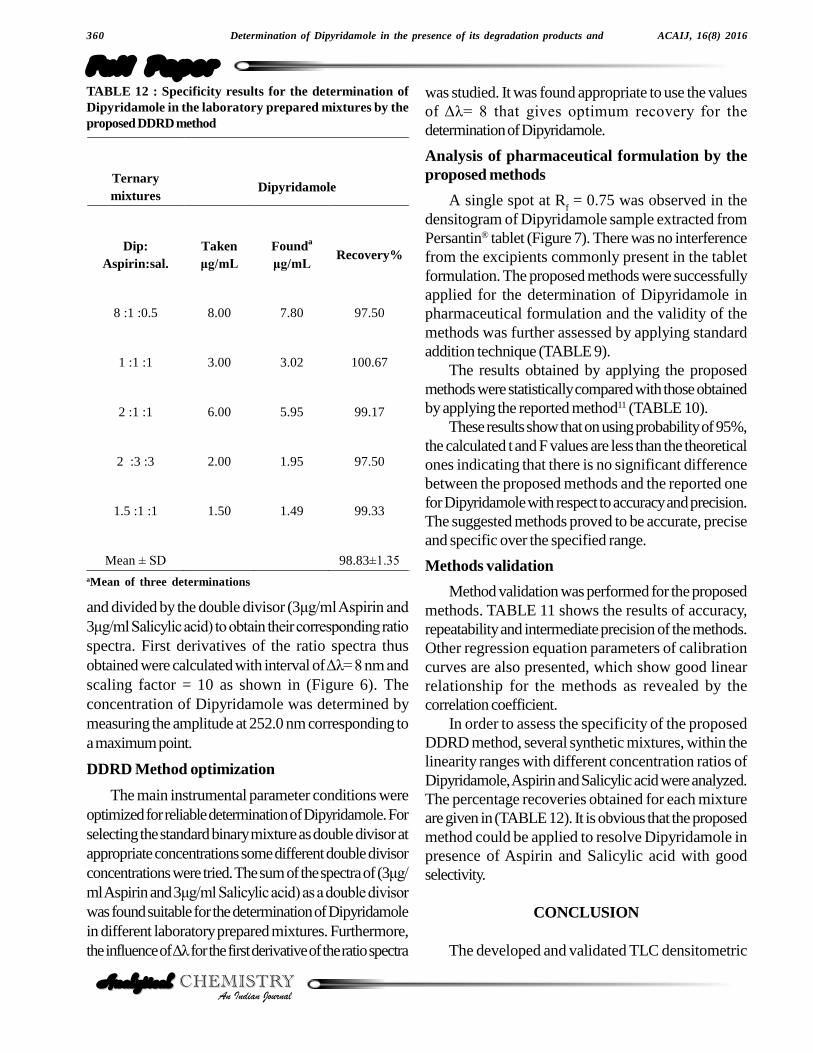
Ternary mixtures
Dipyridamole
Dip: Aspirin:sal.
Taken ìg/mL
Founda
ìg/mL Recovery%
8 :1 :0.5 8.00 7.80 97.50
1 :1 :1 3.00 3.02 100.67
2 :1 :1 6.00 5.95 99.17
2 :3 :3 2.00 1.95 97.50
1.5 :1 :1 1.50 1.49 99.33
Mean ± SD 98.83±1.35
TABLE 12 : Specificity results for the determination ofDipyridamole in the laboratory prepared mixtures by theproposed DDRD method
aMean of three determinations
and divided by the double divisor (3ìg/ml Aspirin and
3ìg/ml Salicylic acid) to obtain their corresponding ratio
spectra. First derivatives of the ratio spectra thusobtained were calculated with interval of Äë= 8 nm and
scaling factor = 10 as shown in (Figure 6). Theconcentration of Dipyridamole was determined bymeasuring the amplitude at 252.0 nm corresponding toa maximum point.
DDRD Method optimization
The main instrumental parameter conditions wereoptimized for reliable determination of Dipyridamole. Forselecting the standard binary mixture as double divisor atappropriate concentrations some different double divisorconcentrations were tried. The sum of the spectra of (3ìg/
ml Aspirin and 3ìg/ml Salicylic acid) as a double divisor
was found suitable for the determination of Dipyridamolein different laboratory prepared mixtures. Furthermore,the influence of Äë for the first derivative of the ratio spectra
was studied. It was found appropriate to use the valuesof Äë= 8 that gives optimum recovery for the
determination of Dipyridamole.
Analysis of pharmaceutical formulation by theproposed methods
A single spot at Rf = 0.75 was observed in the
densitogram of Dipyridamole sample extracted fromPersantin® tablet (Figure 7). There was no interferencefrom the excipients commonly present in the tabletformulation. The proposed methods were successfullyapplied for the determination of Dipyridamole inpharmaceutical formulation and the validity of themethods was further assessed by applying standardaddition technique (TABLE 9).
The results obtained by applying the proposedmethods were statistically compared with those obtainedby applying the reported method11 (TABLE 10).
These results show that on using probability of 95%,the calculated t and F values are less than the theoreticalones indicating that there is no significant differencebetween the proposed methods and the reported onefor Dipyridamole with respect to accuracy and precision.The suggested methods proved to be accurate, preciseand specific over the specified range.
Methods validation
Method validation was performed for the proposedmethods. TABLE 11 shows the results of accuracy,repeatability and intermediate precision of the methods.Other regression equation parameters of calibrationcurves are also presented, which show good linearrelationship for the methods as revealed by thecorrelation coefficient.
In order to assess the specificity of the proposedDDRD method, several synthetic mixtures, within thelinearity ranges with different concentration ratios ofDipyridamole, Aspirin and Salicylic acid were analyzed.The percentage recoveries obtained for each mixtureare given in (TABLE 12). It is obvious that the proposedmethod could be applied to resolve Dipyridamole inpresence of Aspirin and Salicylic acid with goodselectivity.
CONCLUSION
The developed and validated TLC densitometric
M.H.Abdel Rahman et al. 361
Full PaperACAIJ, 16(8) 2016
An Indian JournalAnalytical CHEMISTRYAnalytical CHEMISTRY
method is a simple, precise, accurate and stability-indicating for the determination of Dipyridamol.Statistical analysis proves that the method isreproducible and specific so represents a very usefulaid for determination of Dipyridamole in presence ofAspirin and its degradation product. The high sensitivityof the method allows simple and low cost application inhuman plasma. On the other hand, it�s apparent that the
absorption spectra of Dipyridamole, Aspirin andSalicylic acid exhibit certain degree of spectral overlap,conventional UV spectrophotometry can�t be used for
determination of Dipyridamole in presence of Aspirinand Salicylic acid. However, the proposedspectrophotometric method permits a selectivedetermination of Dipyridamole in presence of Aspirinand Salicylic acid as it resolves band overlapping withoutphysical separation, also the proposed DDRDspectrophotometric method provides a minimum samplepreparation, low cost, fast response and simpleprocedures so it offers a distinct advantage over othersophisticated techniques for separation and confirmsthe suitability for routine analysis of Dipyridamole inpresence of Aspirin and its degradation product in pureforms or in the pharmaceutical preparation.
REFERENCES
[1] B.B.Davood, P.H.Morteza, A.Mohsen, S.Abbas;High performance liquid chromatographic methodfor the determination of dipyridamole in humanplasma, Daru, 7(2), 14-17 (1999).
[2] N.P.Stafford, A.E.Pink, A.E.White, J.R.Glenn,S.Heptinstall; Thromb. Vasc. Biol., 23, 1928�33
(2003).[3] Y.B.J.Aldenhoff, L.H.Koole; Platelet adhesion
studies on dipyridamole coated polyurethaneSurfaces, Eu Cells and Materials, 3, 61-7 (2003).
[4] B.V.Subbaiah, K.K.S.Ganesh, G.V.Krishna,K.Vyas, R.V.Dev, K.S.Reddy; Isolation andcharacterisation of degradant impurities inDipyridamole formulation, J. Pharma. and Biomed.Anal., 61, 256�64 (2012).
[5] K.Prakash, R.R.Kalakuntla, J.R.Sama; Rapid andsimultaneous determination of aspirin anddipyridamole in pharmaceutical formulations byreversed-phase high performance liquidchromatography method, African J. Pharmacy and
Pharmacology, 5(2), 244-251 (2011).[6] W.Shu-jun, M.Fan-hao, S.Jin, L.Xiao, C.Ji-min,
B.Dian-zhou; Chinese Pharmaceutical Journal, 9,(2004).
[7] C.Ri-lai, L.Heng-mei; China pharmacy, 17, (2008).[8] T.Qin, F.Qin, N.Li, S.Lu, W.Liu, F.Li; Biomed
Chromatogr, 24(3), 268-73 (2010).[9] J.Zhang, R.B.Miller, R.Jacobus; Chromatogr., 44,
(1997).[10] J.H.Bridle, M.T.Brimble; Drug development and
industrial pharmacy, 19, 371-81 (1993).[11] Y.M.Issa, M.S.Rizk, A.F.Shoukry, R.M.El-Nashar;
Electroanalysis, 9, 74-8 (1997).[12] C.Li; Colloids Surf B Biointerfaces, 55(1), 77-83
(2007).[13] W.Zhenhui, Z.Hongzhong, Z.Shuping; Talanta, 44,
621-26 (1997).[14] R.A.de Toledo, M.Castilho, L.H.Mazo; J.Pharm.
and Biomed. Analysis, 36, 1113-7 (2005).[15] A.F.Shoukry, N.T.Abdel Ghani, Y.M.Issa,
O.A.Wahdan; Anal. letters, 34(10), 1689-701(2001).
[16] J.A.M.Pulgarín, A.A.Molina, P.F.López; Analyst,
122(3), 253-8 (1997).[17] A.M.de la Peña, A.E.Mansilla, J.A.M.Pulgarín,
A.A.Molina, P.F.López; Talanta, 48(5), 1061-73(1999).
[18] J.Zhang, R.B.Miller, R.Jacobus; Chromatogr., 44(5/6), (1997).
[19] T.Qin, F.Qin, N.Li, S.Lu, W.Liu, F.Li; Biomed.Chromatogr, 24(3), 268-273 (2010).
[20] P.J.A.Murillo, M.A.Alañón, L.P.Fernández; Anal.
Biochem., 245(1), 8-16 (1997).[21] N.Wang, F.Xu, Z.Zhang, C.Yang, X.Sun, J.Li;
Biomed. Chromatogr., 22(2), 149-156 (2008).[22] U.Periasamy; Int. J. Pharm., 108(1), 11-19 (1994).[23] H.H.Hassan, A.E.Y.Fawzy, E.M.Mohamad,
M.S.Ghassan, M.S.Nada; Open Spectrosc. J., 2,19-28 (2008).
[24] E.Dinc; Talanta., 48, 1145�1157 (1999).[25] ICH Q1A(2R), Stability Testing of New Drug
Substances and Products, International Conferenceon Harmonization, IFPMA, Genva, (2003).
[26] Lawrence R.Borgsdorf et al.; Drug facts andComparisons, 10 th Edition, Wolters Kluwer health,60 (2006).
[27] S.Braggio, R.J.Barnaby, P.Grossi, M.Cugola; J.Pharm. and Biomed. Analysis, 14, 375-88 (1996).