Embed Size (px)
Citation preview

ISSISSISSISSISSNNNNN 09709709709709733333 ––––– 98749874987498749874 J.Pharm.ChemJ.Pharm.ChemJ.Pharm.ChemJ.Pharm.ChemJ.Pharm.Chem CODENCODENCODENCODENCODEN::::: JPCOCMJPCOCMJPCOCMJPCOCMJPCOCM
Journal of Pharmacy and Chemistry(An International Research Journal of Pharmaceutical and Chemical Sciences)
Indexed in Chemical Abstractwww.stfindia.com
Editor-in-chiefProf. K.N. JAYAVEERA
Director, Oil Technological Research Institute,Jawaharlal Nehru Technological University Anantapur,
Anantapur, Andhra Pradesh -515001.
Executive EditorDr. K. Balaji
Editorial BoardDr. B.M.Vrushabendra Swamy Dr. C. SridharDr. K. Tarakaram Dr. Y. SudhakarProf. Y. Narasimha Reddy Dr. G. S. Kumar
Editorial Advisory BoardProf. S. Srihari IndiaProf. G. Krishna Mohan IndiaProf. K.V.S.R.G. Prasad IndiaProf. K. Bharathi IndiaProf. B. Duraiswamy IndiaProf. K. Kannan IndiaProf. D.R. Krishna IndiaProf. K.B.Chandrasekhar IndiaProf. S. Kavimani IndiaProf. A. Ramachandraiah IndiaProf. M. Kalilullah IndiaProf. K. Mukkanti IndiaProf. A. Naidu IndiaProf. P. K. Dubey IndiaProf. Jonathan R Dimmock CanadaProf. T. Satyanarayana IndiaProf. Helton Max M. Santos PortugeseProf. Damaris Silveira BrazilProf. Mustafa Iraz TurkeyProf. Abdul Naser B Singab EgyptProf. Ali Asgarh hemmati IranProf. Mohd Mehedi Maasud BangladeshProf. V.K. Dixit IndiaProf. K.R.S. Sambasiva Rao IndiaProf. Chandrashekar Sultanpuri IndiaProf. R. Shyam Sunder India

October - December 2010 108 Journal of Pharmacy and Chemistry • Vol.4 • Issue.4
ISSISSISSISSISSNNNNN 09709709709709733333 ––––– 98749874987498749874 J.Pharm.ChemJ.Pharm.ChemJ.Pharm.ChemJ.Pharm.ChemJ.Pharm.Chem CODENCODENCODENCODENCODEN::::: JPCOCMJPCOCMJPCOCMJPCOCMJPCOCM
Journal of Pharmacy and Chemistry(An International Research Journal of Pharmaceutical and Chemical Sciences)
Volume 4 • Issue 4 • October – December 2010Volume 4 • Issue 4 • October – December 2010Volume 4 • Issue 4 • October – December 2010Volume 4 • Issue 4 • October – December 2010Volume 4 • Issue 4 • October – December 2010
VIEWSThe views and opinions expressed in this journal are those of the contributors; Science-Tech Foundation does notnecessarily concur with the same. All correspondence should be addressed to the Editor-In-Chief (Hon.),Journal of Pharmacy and Chemistry (Science-Tech Foundation), Plot No 22, Vidyut Nagar, Anantapur - 515 001,Andhra Pradesh, India. Phone:+91-8554 274677, Mobile:+91-94414 89324 • e-mail: [email protected] Subscription: Rs. 800/- • www.stfindia.com
Contents
Formulation, Characterization and Evaluation of Granisetron Buccal Patches .......................................................109M SWATHI1, JITHAN AUKUNURU* AND Y MADHUSUDAN RAO
Assessment Of Neuropharmacological Activities Of Pandanus Odoratissimus Root In Mice ................................ 114B RAMYA KUBER* AND THAAKUR SANTHRANI
Evaluation and Permeation Studies of Transdermal Patches of Ketorolac Tromethamine ..................................... 118ABIN ABRAHAM*, BENY BABY, S JAYAPRAKASH AND T PRABHAKAR
In Vitro Dissolution Studies on Solid Dispersions of Mefenamic Acid inPregelatinised Starch Alone and with PVP .....................................................................................................................122MV NAGABHUSHANAM* AND M BEENA DEVI, K SWATHI
Simultaneous Estimation of Lamivudine, Zidovudine andNevirapine by Rp-Hplc in Pure and Pharmaceutical Dosage Form ......................................................................... 126SK PATRO*, MK SAHOO, VJ PATRO AND NSK CHOUDHURY
Synthesis, Anticonvulsant Activity of some Novel 1, 2, 4-triazol-3-yl-thioacetohydrazidesDerived from Benzimidazole and Benzoxazole ...............................................................................................................132GURUBASAVARAJ V PUJAR* AND MADHUSUDAN N PUROHIT
Characterization and Screening of Antimicrobial Activity of Lactic Acid BacteriumIsolated from A Traditional Beverage Marcha of Sikkim ............................................................................................136DEEPLINA DAS AND ARUN GOYAL*
Optimized and Validated Spectrophotometric Methods for the Determination ofAripiprazole Using Ferric Chloride Based on Complexation Reactions ....................................................................140KVV SATYANARAYANA, I UGANDAR REDDY AND P NAGESWARA RAO*
INSTRUCTION TO AUTHORS.......................................................................................................................................146

October - December 2010 109 Journal of Pharmacy and Chemistry • Vol.4 • Issue.4
*Address for correspondence: [email protected]
IntroductionAbsorption of therapeutic agents from the oral mucosa
overcomes premature drug degradation within the gastrointestinal tract, as well as active drug loss due to first passmetabolism that may be associated with other routes ofadministration. Buccal delivery of drugs became anattractive alternate to the oral route of drug administrationby providing rich blood supply that drains drug directlyinto the jugular vein and chance to administer drugs topatients who cannot be dosed orally[1-3]. Variousmucoadhesive formulations were suggested for buccaldelivery that includes buccal patches[4], adhesive tablets[5]and adhesive gels[6]. Buccal patches overcome some ofthe drawbacks of other dosage forms. They have uniquecharacteristics including flexibility, relatively rapid onsetof drug delivery, sustained drug release and rapid declinein the serum drug concentration when the patch is removed.The patch is confined to the buccal area over which it isattached and therefore the absorption profile may have lessinter and intra-individual variability [7,8].
Granisetron is a selective 5-HT3 receptor antagonistused in treatment of chemotherapy-induced, radiation-
induced and post-operative nausea and vomiting. The oralroute of administration of GRN is also impractical forpatients who are vomiting or who have impaired gastricemptying [9,10]. Both parenteral and oral formulationshave also been used, but buccal route may obviate the needfor repeated injections, repeated oral dosing and also beuseful in patients who cannot tolerate oral dosage forms. Itis less invasive than IV or subcutaneous administration.Physicochemical (low molecular weight 312.4g/mol, lowdose 1-2mg , Log P 2.6) and pharmacokinetic (t1/2 4-6hr,absolute bioavailability about 60%) parameters made GRNto be suitable for buccal delivery[11-13].
In this investigation we developed GRN buccal patcheswith a dissolvable matrix using HPMC E 15, with aninsoluble backing membrane. The developed patches wereevaluated for in vitro release, ex vivo permeation throughporcine buccal membrane and mechanical properties.
Materials and MethodsMaterials
Granisetron was a gift from by Natco pharma,Hyderabad, A.P, India. Hydroxypropyl methylcellulose E
Formulation, Characterization and Evaluation ofGranisetron Buccal Patches
M SWATHI1, JITHAN AUKUNURU1* AND Y MADHUSUDAN RAO21Vaagdevi College of Pharmacy, Warangal, India-506001.
2University College of Pharmaceutical Sciences, Kakatiya University, Warangal, India-506009.
ABSTRACT
The aim of this investigation was to develop and evaluate mucoadhesive buccal patches ofGranisetron(GRN). Permeation of GRN was determined in vitro using porcine buccal membrane.Buccal patches were developed by solvent-casting technique using Hydroxypropylmethylcellulose(HPMC) as mucoadhesive polymer. The patches were evaluated for in vitro release, moistureabsorption, mechanical properties and ex vivo permeation studies. The optimized formulation, basedon in vitro release, ex vivo permeation studies and moisture absorption studies, was subjected for invitro residence time using porcine buccal membrane. In vitro flux of GRN was calculated to be3.19±0.27μg.hr–1
.cm–2. In vitro drug release and moisture absorbed was governed by HPMC content.Increasing concentration of HPMC delayed the drug release. All formulations followed Zero orderrelease kinetics where as the release pattern was non-Fickian. The mechanical properties, tensilestrength (9.58±3.45kgmm–2 for formulation F3) and elongation at break reveal that the formulationswere found to be strong but not brittle. Formulations showed a significant permeation throughporcine buccal membrane and convenient residence time. The results indicate that suitable bioadhesivebuccal patches of GRN with desired permeability and suitable mechanical properties could beprepared using HPMC.
Keywords: Buccal patches, Granisetron, Mucoadhesive, Mechanical properties.

October - December 2010 110 Journal of Pharmacy and Chemistry • Vol.4 • Issue.4
15(HPMC E 15) was procured from Loba Chemie Pvt.Ltd., India. Phenol red was obtained from Hi MediaLaboratories Pvt. Ltd. Mumbai, India. All reagents usedwere of analytical grade.
Tissue Preparation (Isolation)Porcine buccal tissue was taken from local slaughter-
house. It was collected within 10 minutes after slaughter ofthe pig and tissue was kept in Kreb’s buffer solution. Itwas bought immediately to the laboratory and was mountedwithin 2 hours of isolation of buccal tissue. The tissue wasrinsed thoroughly using phosphate buffer saline to removeany adherent material. The epithelium was separated fromthe underlying connective tissue using surgical procedure.Sufficient care was taken to prevent any damage to thebuccal epithelium [14].
In vitro Drug Permeation StudiesThe buccal epithelium was carefully mounted in
between the two compartments of a Franz diffusion cellwith internal diameter of 1.1cm (4.15cm2 area) with areceptor compartment volume of 24ml. Phosphate buffersolution (PBS) pH (7.4) was placed in receptorcompartment. The donor compartment contained a solutionof 5ml of phosphate buffer pH 6.6 in which 5 mg of GRNwas dissolved. The donor compartment also containedphenol red at a concentration of 20μg/ml. This is becausephenol red acts as a marker compound and is not supposedto permeate through the porcine buccal membrane. Theentire set-up-was placed over magnetic stirrer andtemperature was maintained at 37° C by placing thediffusion cell. The samples were collected at predeterminedtime intervals and stored under refrigerated conditions tillthe analysis was carried out using UV-Visiblespectrophotometer (Elico, India) at 302nm. All theexperiments were performed in triplicates.
Fabrication of GRN patchesBuccal patches were prepared using solvent casting
technique with HPMC E 15 as polymer and propyleneglycol as plasticizer[15].Polymer was added to 20ml ofdichloromethane and methanol (1:1) solvent system andallowed to stand for 6hrs to swell. GRN and propyleneglycol were dissolved in 5 ml of solvent system and addedto the polymeric solution. This was set aside for 2hrs toremove entrapped air, transferred to a petriplate and driedat room temperature for overnight and then in vacuumoven for 8-12 hrs. The formed patches were removedcarefully, cut to size and stored in a desiccator. Thecomposition of the patches is shown in Table 1. Patcheswith any imperfections, entrapped air, differing in weightor GRN content were excluded from further studies.
In vitro Release StudiesThe drug release rate from buccal patches was studied
using Franz diffusion cells. Patches were supposed torelease the drug from one side only; therefore an
impermeable backing membrane (aluminium foil) wasplaced on the other side of the patch. The patch wassandwiched in dialysis membrane (Hi Media molecularweight 5000) and, was further placed between receptor anddonor compartments. The entire set up was placed overmagnetic stirrer and temperature was maintained at 37°Cby placing the diffusion cell. The contents of receptorcompartment were stirred with teflon bead at a speed of500 rpm. One ml sample was collected at predeterminedtime intervals from receptor compartment and replacedwith an equal volume of the buffer. The samples wereanalyzed using UV-Visible spectrophotometer (Elico, India)at 302 nm. The experiment was performed in triplicates[15].
Ex vivo Permeation StudiesEx vivo permeation [16,17] of GRN from buccal
patches through porcine buccal membrane was studied.Porcine buccal mucosa was obtained and buccal membranewas isolated. The membrane was mounted over a Franzdiffusion cell and a buccal patch was placed over themembrane. A dialysis membrane was placed over themembrane so as to secure the patch tightly from gettingdislodged from the membrane (the buccal patch wassandwiched between the buccal mucosa and the dialysismembrane). The donor compartment of diffusion cell wasfilled with PBS pH 7.4. The setup was placed over amagnetic stirrer with temperature maintained at 370C.Samples were withdrawn and replenished immediately fromthe receiver compartment at predetermined time intervals.They were stored under refrigerated conditions till theanalysis was carried out. The content of GRN in thesamples was analyzed by UV-Visible Spectrophotometer atthe wavelength of 302nm. All the experiments wereperformed in triplicates.
Moisture Uptake StudiesThe moisture uptake studies give an indication about
the relative moisture absorption capacities of polymers and
Table 1Formulation ingredients of mucoadhesive buccal
patches of Granisetron
Formulation GRN Ingredients Propylenecode (mg) HPMCE 15 glycol
(mg) (μμμμμl)
F1 140 2000 300.0F2 140 2250 337.5F3 140 2500 375.0F4 140 2750 412.0F5 140 3000 450.0
Note: 25ml of solvent system, 1:1 ratio of dichloro methaneand methanol was used.
October - December 2010 111 Journal of Pharmacy and Chemistry • Vol.4 • Issue.4
an idea whether the formulations maintain their integrityafter absorption of moisture. The study was carried out asper procedure reported earlier [18] . Briefly, agar (5% w/v) was dissolved in hot water, transferred into petriplatesand allowed to solidify. Six patches from each formulationseries were placed in vacuum oven overnight prior to thestudy to remove moisture if any and laminated on one sidewith water impermeable backing membrane. They werethen incubated at 37°C for one hour over the agar surface.The initial and final weights were recorded and percentagemoisture absorption was calculated by using the formula.
Final weight – Initial weight%Moisture absorption = –––––––––––––––––––– X 100
Initial weight
Measurement of Mechanical PropertiesMechanical properties of the patches were evaluated
using a microprocessor based advanced force gauzeequipped with a motorized test stand (Ultra Test, Mecmesin,West Sussex, UK), equipped with a 25 kg load cell. Filmstrip with the dimensions 60 x 10 mm and without anyvisual defects were cut and positioned between two clampsseparated by a distance of 3 cm. Clamps were designed tosecure the patch without crushing it during the test, thelower clamp was held stationary and the strips were pulledapart by the upper clamp moving at a rate of 2 mm/secuntil the strip broke. The force and elongation of the filmat the point when the strip broke was recorded. The tensilestrength and elongation at break values were calculatedusing the formula [19].
Force at break (kg)Tensile strength (kg. mm–2) ––––––––––––––––––––– =
Initial cross sectional areaof the sample (mm2)
Increase in length (mm) 100Elongation atbreak (%mm–2) = ––––––––––––– X ––––––––––––––
Original length Cross sectional area (mm) (mm2)
Measurement of in vitro Residence TimeThe in vitro residence time was determined using USP
disintegration apparatus. The disintegration medium was800 ml of PBS (pH 6.6) maintained at 37±20C. Thesegments of porcine buccal mucosa, each of 3 cm length,were glued to the surface of a glass slab, which was thenvertically attached to the apparatus. Three mucoadhesivefilms of each formulation were hydrated on one surfaceusing PBS (pH 6.6) and the hydrated surface was broughtinto contact with the mucosal membrane. The glass slabwas vertically fixed to the apparatus and allowed to moveup and down. The film was completely immersed in thebuffer solution at the lowest point and was out at thehighest point. The time required for complete erosion or
detachment of the film from the mucosal surface wasrecorded [20].
Drug-Polymer Interaction StudyTo study the possible interaction between Granisetron
and Polymeric materials of the patches, infrared (IR)spectroscopy was carried out on pure substances and theirphysical mixture. The IR spectra were recorded using IR-Spectrophotometer (Perkin Elmer FT-IR, Perkin ElmerInst.USA) by KBr pellet method.
Results and DiscussionsDrug Permeation Studies through the Porcine BuccalMembrane
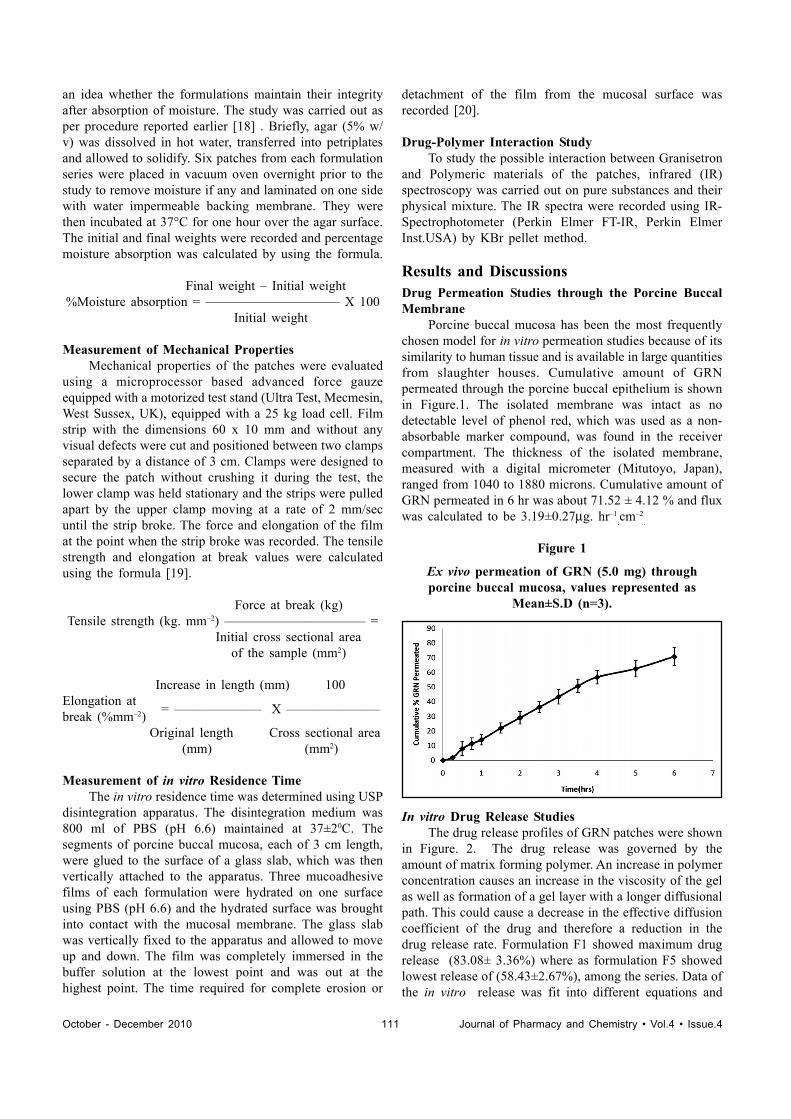
Porcine buccal mucosa has been the most frequentlychosen model for in vitro permeation studies because of itssimilarity to human tissue and is available in large quantitiesfrom slaughter houses. Cumulative amount of GRNpermeated through the porcine buccal epithelium is shownin Figure.1. The isolated membrane was intact as nodetectable level of phenol red, which was used as a non-absorbable marker compound, was found in the receivercompartment. The thickness of the isolated membrane,measured with a digital micrometer (Mitutoyo, Japan),ranged from 1040 to 1880 microns. Cumulative amount ofGRN permeated in 6 hr was about 71.52 ± 4.12 % and fluxwas calculated to be 3.19±0.27μg. hr–1
.cm–2.
Figure 1
Ex vivo permeation of GRN (5.0 mg) throughporcine buccal mucosa, values represented as
Mean±S.D (n=3).
In vitro Drug Release StudiesThe drug release profiles of GRN patches were shown
in Figure. 2. The drug release was governed by theamount of matrix forming polymer. An increase in polymerconcentration causes an increase in the viscosity of the gelas well as formation of a gel layer with a longer diffusionalpath. This could cause a decrease in the effective diffusioncoefficient of the drug and therefore a reduction in thedrug release rate. Formulation F1 showed maximum drugrelease (83.08± 3.36%) where as formulation F5 showedlowest release of (58.43±2.67%), among the series. Data ofthe in vitro release was fit into different equations and

October - December 2010 112 Journal of Pharmacy and Chemistry • Vol.4 • Issue.4
kinetic models to explain the release kinetics of GRN frombuccal patches. Zero order model seemed to be the mostappropriate model describing release kinetics from allpatches (0.986, 0.987, 0.988,0.995, 0.976 for formulationF1 to formulation F5).On other hand ‘ç’ values indictedthat amount of released drug was by non Fickiandiffusion[21,22].Increasing the concentration of the polymerin the formulations showed a sustained effect on GRNrelease. This is because, as the proportion of these polymersin the matrix increased, there was an increase in theamount of water uptake and proportionally greater swellingleading to a thicker gel layer. Zero-order release fromswellable hydrophilic matrices occurs as a result of constantdiffusional pathlengths. When the thickness of the gelledlayer and thus the diffusional pathlengths remain constant,zero-order release can be expected. In this investigationsimilar behavior was predicted and obtained.
Figure 2Release profiles of GRN from mucoadhesive buccal
patches, values represented asMean ±S.D (n=3)
Ex vivo Permeation StudiesFigure 3 shows the graphical representation of cumulativepercentage drug permeated from the buccal patches.Theresults of drug permeation from buccal patches ofGranisetron through the porcine buccal mucosa reveal thatdrug was released from the formulation and permeatedthrough the porcine buccal membrane,hence could possiblypermeate through the human buccal membrane. The resultsindicated that the drug permeation was more in F3 amongthe last three formulations and about 72.25% of Granisetroncould permeate through the buccal membrane in 4 hrs.
Moisture Uptake StudiesMoisture absorption studies evaluate the integrity of
the formulation upon exposure to moisture and the resultswere shown in Table 2. The percentage moisture observedranged from about 59.6±11.99% to 156.34±9.27 % w/w fordifferent formulations. Formulations F1 and F2 weredeformed during the study. The results reveal that,percentage of moisture absorption was increased withincrease in polymer content of formulations(Table 2). Whenthe patches were placed without backing membranecomplete swelling followed by erosion was observed
indicating that the drug release mechanism involves swellingof the polymer initially, followed by drug release from theswollen matrix by diffusion.
Mechanical Properties of PatchesIdeal buccal film, apart from good bio adhesive
strength, should be flexible, elastic and strong enough towithstand breakage due to stress caused during its residencein the mouth. The tensile strength (TS) and elongation atbreak (E/B) shows the strength and elasticity of the film.A soft and weak polymer is characterized by a low TS andE/B; a hard and brittle polymer is defined by a moderateTS, and low E/B; a soft and tough polymer is characterizedby a moderate TS and a high E/B; whereas a hard andtough polymer is characterized by high TS and E/B. It issuggested that an ideal buccal film should have a relativelyhigh TS and E/B. The results of the mechanical propertiesi.e. TS and E/B were presented in Table 2. TS increasedwith the increase in polymeric content but E/B valuesdecreased with the increase in polymer content. MaximumTS was exhibited by F5 patch (13.24±2.74kg.mm–2) andminimum was exhibited by F1(3.87±1.28 kg.mm–2).Maximum E/B was seen with F1(117±8.24% mm–2) andthe least was observed with F5 (53.6±3.72% mm–2).In vitro residence time
In vitro residence time was determined for theformulations F3, F4, F5.The formulations F1, F2 wereeroded in moisture absorption study. So they were notsuitable as buccal patches. The in vitro residence time ofthe formulations was in order of F4> F3> F5.
Drug - Polymer Interaction StudyThe IR spectral analysis of Granisetron alone showed
that the principal peaks were observed at wave numbers of1648.15, 1559.88, 1228.95 and 3235.58. In the IR spectraof the physical mixture of Granisetron and HPMC E151647.90, 1560.15, 1242.12 and 3448.42 were observed forthe Granisetron. However, some additional peaks were
Figure 3Ex vivo permeation studies of selected mucoadhesive
buccal patches of GRN, values represented asMean±S.D (n=3).

October - December 2010 113 Journal of Pharmacy and Chemistry • Vol.4 • Issue.4
observed with physical mixtures, which could be due tothe presence of polymer. These results suggest that there isno interaction between the drug and polymer used in thepresent study. It is already well known that the commonpolymers such as HPMC popular in controlled/sustainedrelease matrix type formulations because of theircompatibility with a number of drugs.
Selection of optimized formulationBased on in vitro release and moisture absorption
studies formulation F3 was selected as the best formulation.Formulation F1 showed maximum drug release 83.08 ±3.36 %, where as formulation F2 showed 79.37±4.46%drug release. Formulations F1 and F2 were deformedduring Moisture absorption studies, these formulations couldnot be expected to maintain the integrity after administration.The results indicated that the drug permeation was more inF3 among the last three formulations therefore; formulationF3 was selected as best formulation and subjected forfurther investigation.
AcknowledgementsThe authors would like to thank Natco Pharma,
Hyderabad, A.P, India for providing gift sample ofGranisetron.the authors also like to thank principal andmanagement of Vaagdevi College of Pharmacy for providingnecessary facility useful in conduction of this work.
References[1] Edith Mathiowitz, Chckering III Donald E, Claus-Michael
Lehr. Bioadhesive Drug Delivery Systems, Fundamentals,Novel Approaches, and Development, Design and ThePharmaceutical Sciences, New York: Marcel Dekker1999; 98: 541-562.
[2] Hans E. Junginger, Janet A. Hoogstraate, J. Coos Verhoef.J Cont Rel 1999; 62: 149-159.
[3] Rathbone M J, Drummond B, Trucker l. Adv Drug Del Rev1994; 13: 1-22.
[4] Luana Periolia, Valeria Ambrogia, Fausta Angelicia, MaurizioRiccia, Stefano Giovagnolia, Marinella Capuccellab, CarloRossia. J Cont Rel 2004; 99: 73– 82.
[5] Choi HG, Jung JH, Yong CS, Rhee CD, Lee MK, Han J H, Park K M, Kim C K. J Cont Rel 2000; 68: 405-412.
[6] Jones DS, Brown AF, Woolfson AD, Djokic J, Adams V. JPharm Sci 1999; 88: 592-598.
[7] Kashappa Goud, Pramod Kumar T M. AAPS Pharm SciTech 2004; 5(3): 1-9.
[8] Amir H Shojaei. J Pharm Pharmaceut Sci 1998; 1(1): 15-30.
[9] Matti Aapro. The Oncologist 2004; 9: 673-686.[10] Pouran Layegh, Mohammad Javad Mojahedi, Parisa
Emamgholi Tabar Malekshah, Fakhrozaman Pezeshkpour.Indian Journal of Dermatology, Venereology and Leprology2007; 73(4): 231-234.
[11] Alfonso Gurpide, Belen Sadaba, Salvador Martin-Algarra,Jose R, Azanaza. The Oncologist 2007; 12: 1151-1155.
[12] Plosker GL, Goa KL. Drugs 1991; 42: 805-824.[13] Upward JW, Arnold BDC, Link C, Pierce DM, Allen A,
Tasker TCG. Eur J Cancer 1990; 26: 12-15.[14] Chandra Sekhar Kolli, Ramesh Gannu, Vamshi Vishnu
Yamsani, Kishan V, Madhsudan Rao Yamsani. Int J PharmSci Nanotechnol 2008; 1(1): 64-70.
[15] Pramod Kumar TM, Kashappa Goud Desai, ShivakumarHG. J Pharm Educ 2002; 36(3): 147-151.
[16] Mona Semalty, Ajay Semalty, Ganesh Kumar, Vijay Jugal.Int J Pharm Sci Nanotechnol 2008; 1(2): 184-189.
[17] Giacomo Di Colo, Ylenia Zambito, Chira Zaino. J PharmSci 2008; 97(5): 1652-1677.
[18] Vamshi Vishnu Y, Chandrasekhar K, Ramesh G ,Madhusudan Rao Y. Curr Drug Del 2007; 4: 27-39.
[19] Peh KK, Wong CF. J Pharm Sci 1999; 2: 53-61.[20] Semalty A, Mona Bhojwani, Bhatt GK, Guptha GD,
Shrivatav AK. Indian J Pharm Sci 2005; 67(5): 548-552.[21] Patel Vishnu M, Prajapati Bhupendra G, Patel Madhabahai
M. Acta Pharm 2007; 57: 61-72.[22] Peppas NA. Pharm Acta Helv 1985; 60: 110-111.
Table 2Moisture absorption, Mechanical properties of GRN buccal patches, values represented as
mean±S.D (n=3).
FORMULATION Moisture absorbed TensileStrength Elongation at break(%w/w) (Kg.mm2) (mm-2)
F1 Deformed 3.87±1.28 117±8.24F2 Deformed 8.74±1.74 94±7.58F3 59.67±11.99 9.58±3.45 75±6.42F4 63.72±1.94 11.58±2.42 70±5.24F5 156.34±9.27 13.24±2.74 53.6±3.72

October - December 2010 114 Journal of Pharmacy and Chemistry • Vol.4 • Issue.4
IntroductionPandanus odoratissimus (Pandanaceae) is a perennial
shrub (or) slender tree attaining a height of 6m. This plantis distributed in coastal districts of Orissa, Gujarat, AndhraPradesh, Tamil Nadu and tropical Asia [1]. In Orissa, twomorphologically distinct types of Pandanus are found innature i.e. “Kewda” and “Ketaki” are golden yellow incolour and strongly scented while “Kewda” flowers arecream coloured and sweetly scented [1]. Flower is pungent,bitter and used in pruritus, earache, headache, leucoderma,strengthen the brain (yunani). The fruit is useful in “Vata”,“Kapha” and urinary discharges (Ayurveda). Leaves arebright green, pungent, bitter with flavour, useful in leprosy,small pox, syphilis, scabies, pain, leucoderma, diseases ofthe heart, brain, aphrodisiac and tonic. Oil prepared fromthe aerial root is used as stimulant, antispasmodic,antirheumatic agent [1], diuretic, depurative and tonic [2].The chief constituents of oil is methyl ether of phenyl ethylalcohol, it also contains d-linalool, depentene, phenyl ethylacetate, citral, caproic acid, stearoptene and pthalic acid.Roots of Pandanus odoratissimus contains 2 phenoliccompounds which are reported to possess antioxidantactivity [3]. Leaves has lignan and benzofuran [4].
Assessment Of Neuropharmacological Activities Of PandanusOdoratissimus Root In Mice
B RAMYA KUBER* AND THAAKUR SANTHRANIDepartment of Pharmacognosy and Pharmacology, Institute of Pharmaceutical Technology,
Sri Padmavathi Mahila Visvavidyalayam, Tirupati, Andhra Pradesh.
ABSTRACT
The ethanolic extract of the roots of Pandanus odoratissimus (PO) pandanaceae was assessed forneuropharmacological activities in mice using a number of experimental models. The ethanolicextract was given at a dose of 100, 200, 400 mg/kg. Spontaneous motor activity, analgesia, gripstrength, alertness, immobility, climbing and swimming in forced swimming (FST) and immobilitytime in tail suspension test (TST) were analyzed. The extract at given doses showed significantdose dependent activity by decreasing the exploratory activity, Spontaneous motor activity, increasedimmobility time in both FST and TST, decreased climbing and swimming behaviour in FST and didnot alter other parameters. The preliminary phytochemical analysis showed the presence of saponins,sterols, glycosides, carbohydrates and flavonoids. The results of the present study indicated that thealcoholic extract may have active constituents with CNS depressant activity and at the given dosesthey are devoid of memory impairment and neurotoxicity.
Keywords: Pandanus odoratissimus, neuropharmacological, CNS depressant activity, neurotoxicity,memory impairment, phytochemical.
*Address for correspondenceEmail:[email protected]
Materials and MethodsCollection and Extraction of PO root
Plant material (roots) was collected from the wildsource in the month of October and identified by theBotanist at the Department of Botany, S.V.University,Tirupati, A.P. The roots were washed under running tapwater, shade dried, and crushed to a coarse powder. Thepowder was passed through sieve no. 40 and used forfurther studies.
Dried coarse powder of PO root was extracted withpetroleum ether and then with alcohol. Ash color powderyextract was obtained after evaporation of solvent the yieldwas 6.4% w/w. A suspension of the extract was preparedby using 2% v/v tween 80 in distilled water.
AnimalsMale Swiss albino mice weighing 25-30g were used.
They were housed in groups of five under standardlaboratory conditions at temperature 23 ± 10C, relativehumidity of 55±5%. The animals had access to water andpellet diet ad libitum (Hindustan Lever Foods, Bangalore,India). The animals were deprived of food 12h beforeexperimentation. Control group animals received 2% v/vtween 80 orally and all behavioured parameters wereassessed one hour after the oral administration of extract.

October - December 2010 115 Journal of Pharmacy and Chemistry • Vol.4 • Issue.4
Neuropharmacological TestsTest for locomotor activity
The locomotor activity was measured by usingActophotometer (Inco, Ambala, India). It consists of cagewhich is 30 x 30 x 30 cms and has a wire mesh at thebottom. Six lights and 6 photo cells placed in the outerperiphery of the bottom in such a way that a single miceblocks only one beam. Photo cell is activated when therays of light falls on photocells, the beam of light is cut asand when animals cross, number of cut off’s were recordedfor 10 minutes [5].
Hot Plate TestThe hot plate consisting of a electrically heated
surface. with a temperature of 55o to 56o C. The animalswere placed on the hot plate and the time for either lickingor jumping was recorded by a stop-watch, before and afterthe oral administration of the test compound [6].
Forced Swimming Test (FST)Mice were forced to swim individually in a glass jar
(25 x 12 x 25 cm3) containing fresh water of 15 cm heightand maintained at 25oC (± 3oC). After an initial 2 minperiod of vigorous activity each animal assumed a typicalimmobile posture. A mouse was considered to be immobilewhen it remained floating in the water without struggling,making only minimum movements of its limbs necessaryto keep its head above water. The total duration ofimmobility was recorded during the next 4 min of a total6 min test. The changes in immobility duration werestudied after administering drugs in separate groups ofanimals [9].
Test for Alertness: Hole Board TestThis test was done using Hole Board. The hole Board
consisted of a 0.5m3 wooden board with 16 holes (3cm indiameter). The mice was placed at the corner of the boardand allowed to move freely. First two minutes wereallowed for adaptation and the number of head dippings innext four minutes was counted [7].
Tail Suspension Test (TST)The total duration of immobility induced by tail
suspension was measured according to the method describedby steru et al [12]. Mice were suspended on the edge of atable 50 cm above the floor by the adhesive tape placedapproximately 1 cm from the tip of the tail. The total
duration of immobility was recorded during the next 4 minof a total 6 min test [9].
Motor Co-ordination Test (Rota rod Test)Motor Co-ordination test was conducted using a Rota
rod apparatus (Inco Ambala, India). The animals wereplaced on the moving rod prior to the treatment and themice stayed on the rod without falling for 120 secondswere chosen for the study. The fall of time of animalsbefore and after the extract was noted [6,8].
Phytochemical AnalysisPreliminary phytochemical analysis was carried out
according to standard protocol [10,11].
Statistical AnalysisAll values are expressed as Mean ± SEM. The data
was analyzed using one way ANOVA followed by Dunnet’s‘T’ tests, in all tests the criteria for statistical significancewas p<0.05.
ResultsPreliminary phytochemical analysis was carried out
on the crude alcoholic extract the results indicated thepresence of glycosides, sterols, saponins, flavonoids andcarbohydrates (Table 1).
No lethal effect was observed in groups of miceduring the 24 h period after oral administration at a doseupto 1600 mg/kg. The animals treated with 100, 200, 400mg/kg po exhibited significant (p<0.01) and dose dependentdecrease in spontaneous motor activity as compared tocontrol vehicle group (Fig. 1).
Alcoholic extract at a dose of 100, 200, 400 mg/kgpo showed no significant change in reaction time incomparison to control group (Fig. 2) in Eddys hot platetest.
Alcoholic extract at given doses decreased motorcoordination significantly (p<0.01) and dose dependently(Fig. 3).
The results of forced swimming test showed thatthere was significant increase (p<0.01) in immobility andsignificant decrease (p<0.01) in swimming and climbingbehaviour of animals at 100, 200, 400 mg/kg in comparisonto control vehicle group (Fig. 4, 5, 6).
Table 1:Preliminary Phytochemical tests of Pandanus odoratissimus root
Extract Sterols Glycosides Saponins Carbo hydrates Alkaloids Flavonoids Tannins Proteins
Ethyl Alcohol +ve +ve +ve +ve -ve +ve -ve -ve
* +ve – Postive Test; * -ve - Negative Test

October - December 2010 116 Journal of Pharmacy and Chemistry • Vol.4 • Issue.4
Fig.1: Effect of Alcoholic Extract of Root of PandanusOdoratissimus on the Spontaneous Motor Activity
Values are expressed as Mean ± SEM of 8 animals,** P<0.01 Vs Control Group
Fig.4: Effect of Alcoholic Extract of Root of PandanusOdoratissimus on Immobility Time in Forced Swimming Test
Values are expressed as Mean ± SEM of 8 animals,** P<0.01 Vs Control Group
Fig.3: Effect of Alcoholic Extract of Root of PandanusOdoratissimus on Motor Co-ordination (Rota Rod Test)
Values are expressed as Mean ± SEM of 8 animals, ** P<0.01 Vs Control Group
Fig.2: Effect of Alcoholic Extract of Root of PandanusOdoratissimus on Analgesia (Eddys Hot Plate Test)
Values are expressed as Mean ± SEM of 8 animals
Fig.5: Effect of Alcoholic Extract of Root of Pandanus Odoratissimus on Swimming Time in Forced Swimming Test
Values are expressed as Mean ± SEM of 8 animals, ** P<0.01 Vs Control Group
Fig.6: Effect of Alcoholic Extract of Root of Pandanus Odoratissimus on Climbling Time in Forced Swimming Test
Values are expressed as Mean ± SEM of 8 animals, ** P<0.01 Vs Control Group

October - December 2010 117 Journal of Pharmacy and Chemistry • Vol.4 • Issue.4
At given doses alcoholic extract exhibited significant(p<0.01) and dose dependent increase in the immobilitytime as compared to vehicle group in tail suspension test(Fig. 7).
Fig.7: Effect of Alcoholic Extract of Root of PandanusOdoratissimus on Alertness (Hole Board Test)
Values are expressed as Mean ± SEM of 8 animals,** P<0.01 Vs Control Group
The results of the hole board test revealed that therewas a significant (p<0.01) decrease in the number of headdipping as compared to control vehicle group (Fig. 8).
Fig.8: Effect of Alcoholic Extract of Root of Pandanus Odoratissimus on Alertness (Hole Board Test)
Values are expressed as Mean ± SEM of 8 animals,** P<0.01 Vs Control Group
DiscussionIn the present study, alcoholic extract of Pandanus
odoratissimus was evaluated for its effect on central nervoussystem. The PO showed significant CNS depressant actionssuch as reduced alterness and locomotion in a dosedependent manner, which could be attributed to the sedativeeffect of the extract. Extract also showed the significantloss of muscular coordination. This could be due to lossof muscular strength. PO extract increased immobility timein both FST and TST and decreased swimming and climbingbehaviour in FST. This further confirms the presence ofchemical constituents having CNS depressant action.
ConclusionAssessment of neuropharmacological activities of the
alcoholic extract of PO root indicates that the root extractmay have chemical constituents with CNS depressant action.Further work is required on identification of phytochemicalsinvolved in the CNS depressant action from the rootextract of Pandanus odorotismus.
References[1] Bhattacharjee SK. Hand book of aromatic plants, Pointer
Publishers, Jaipur, India, 2000: 340-341.[2] Kirtikar KR, Basu BD. Indian Medicinal Plants, Vol. 4,
International Book Distributors, Dehradun, India, 1987:2591-93.
[3] Jong TT, Chau SW. Antioxidative activities of constituentsisolated from Pandanus odoratissimus, Phytochemistry 1998;49: 2145-2148.
[4] Akira Inada, Yasuyuki Ikeda, Hiroko Murata, Yuka Inatoni.Phytochemistry 2005; 66: 2729-2733.
[5] Goyal RK. Practicals in Pharmacology, 5th ed, B.S. ShahPrakashan Ahmedabad, 2005-2006: 121-122.
[6] Kulkarni SK. Hand book of Experimental Pharmacology,Vallabh Prakashan, New Delhi, India, 1987: 122.
[7] File SE, Wardril AG Validity of Head Dipping as a Measureof Exploration in a modified Hole-Board,Psychopharmacology, 1975; 44: 53-59.
[8] Dunham NW, Miya TSJ. Am Pham Assoc Sci, 1957; 46:208-209.
[9] Bhattacharya SK, Satyan KS, Ramanthan M. Indian J ExpBiol 1999; 37: 120.
[10] Kokate CK, Purohit AP, Gokhale SB. Text Book ofPharmacognosy, 19th ed, Nirali Prakasan, Pune, 2002:108-109.
[11] Khandelwal KR. Practical Pharmacognosy, 6th ed. NiraliPrakashan, Pune, 1998: 171-172.
[12] Mohd Abid HJ. Harishikeshavan, Mohammed Asad. IndianJ Physiol Pharmacol 2006; 50 (2): 143-151.

October - December 2010 118 Journal of Pharmacy and Chemistry • Vol.4 • Issue.4
IntroductionTransdermal delivery is the delivery of drugs through
intact skin to reach the systemic circulation in sufficientquantity to administer a therapeutic dose. Skin is the mostextensive and readily accessible organ in the body [1]. Itschief functions are concerned with protection, temperatureregulation, control of water output & sensation. In anaverage adult it covers an area about 1.73m2 and receivesone third of circulating blood throughout the body at anygiven time. The potential of using intact skin as the site ofadministration for dermatological preparations to elicitpharmacological action in the skin tissue has beenrecognized for several years. Until the turn of the century,the skin was thought to be impermeable. However theview has changed & the progress achieved in this areaclearly demonstrates that the skin is a complex organ andallows the passage of chemicals into and across the skin[2]. The Permeation of chemicals, toxicants and drugs aremuch slower across the skin when compared to otherbiological membrane in the body. The understanding ofthese complex phenomena has lead to the development of
transdermal drug delivery systems, in which the skin servesas the site for the administration of systemically activedrugs [3].
Materials and MethodsMaterials
Ketorolac Tromethamine (Cipla Ltd Goa); Hydroxylpropyl methyl cellulose; Ethyl cellulose; Polyvinylpyrolidone; Methyl cellulose ; ( Strides Arco Labs); wereused as procured from the manufactures. All other reagentswere analytical grade and used as such.
ExperimentalThe films were casted on a mercury surface. Required
amount of drug was dissolved in ethanol or water and thepolymer (HPMC-2%) were added to the drug solution .Tothis plasticizer dibutylphthalate (30%) was added and stirredto get homogenous solution. The volume was made upto 5ml and poured on the mercury surface. After 48 hours, thedried films were taken out.
Fabrication of Rate Controlling Membrane with MethylCellulose
Accurately weighed quantities of Methyl cellulose-
Evaluation and Permeation Studies of Transdermal Patches ofKetorolac Tromethamine
ABIN ABRAHAM*, BENY BABY, S JAYAPRAKASH AND T PRABHAKARDepartment of Pharmaceutics, Karnataka College of Pharmacy, Hegde Nagar Main Road,
Bangalore-560064, Karnataka, India.
ABSTRACT
Transdermal drug delivery was carried out by membrane permeation controlled type transdermalpatches using different polymers such as PVP, hydroxy propyl methyl cellulose, methyl cellulose,ethyl cellulose in varying proportions and combinations. Transdermal Delivery of Ketorolac a non-steroidal agent with potent analgesic and moderate anti-inflammatory activity certainly appears to bealternative route of administration as a non-invasive mode of drug delivery and to maintain the drugblood levels for an extended period of time. Results from clinical studies indicate that Ketorolactromethamine transdermal patch was significantly more effective than oral administration. Aftercarrying out the in-vitro diffusion studies for the formulations, the formulation of HPMC-2% & MC-3% was selected for the physico-chemical parameters, ex-vivo, in vivo drug release studies &pharmacodynamic studies. A well designed transdermal controlled drug delivery system is expectedto provide the following benefits like limitation of hepatic first pass metabolism, absolute reductionof gastro intestinal side effects, enhancement of therapeutic efficacy, minimisation of the needs offrequent dose intake, maintenance of steady plasma level of the drug, reduced side effects due tooptimization of the blood concentration time profile.
Key Words: Transdermal Patches, Ketorolac Tromethamine, Permeation Studies.
*Address for correspondence:E.mail:[email protected]

October - December 2010 119 Journal of Pharmacy and Chemistry • Vol.4 • Issue.4
3% were dissolved in water. Then the solution was mixedwith occasional stirring to get clear solution. Glycerin wasadded as plasticizer. Then it was poured on the mercurysurface and dried.
Physico chemical evaluation of transdermal films1) Percent Moisture Absorption [4]
The percent moisture absorption was carried out tocheck the physical stability and integrity of the films athighest humidity conditions. The films were accuratelyweighed and placed in the dessicator containing saturatedsolution of aluminium chloride, which maintain 79.50%RH After 3 days the films were taken out and weighed.
Final Weight–Initial WeightPercntage Moisture Absorbtion = ——————– x 100
Initial Weight
2) Percent Moisture LossThe percent moisture loss was carried out to check
the integrity of the films at dry condition. The films wereaccurately weighed and placed in the dessicator containingsaturated solution of anhydrous calcium chloride. After 3days the films were taken out and weighed. The moistureloss was calculated using the formula
Final Weight–Initial WeightPercntage Moisture Loss = —————––––––—– x 100
Initial Weight
3) Water Vapour Transmission Rate [5]For water Vapour transmission studies glass vials of
equal diameter were used as transmission cells. About 1gm of Anhydrous Calcium Chloride was taken in cells andthe polymer film was fixed over the brim with the help ofthe solvent. The cells were accurately weighed and kept ina closed dessicator containing saturated solution ofpotassium chloride to maintain a humidity of 84%RH.Thecells were taken out and weighed after 6,12,24,36,48,78hrs of storage. The amount of water transmitted werefound by
Final Weight–Initial WeightWater Vapour Transmission Rate = ––—————––––––
Time X Area
Water Vapour transmission rate usually expressed asthe number of grams of moisture gain/hrs/sq.cm.
4) ThicknessThickness of the film was measured at 3 different
points using a screw gauge and average thickness wasfound out.
5) Drug ContentA transdermal film was cut into small pieces and put
in the buffer solution and it is shaken in a mechanical
shaker for 3 ½ hrs to get a homogenous solution andfiltered. The filtrate was withdrawn and made up thevolume. The drug content was analysed at 313nm [6].
6) Folding Endurance [7]It was determined by repeatedly folding a small strip
of film at the same place till it breaks. The number oftimes, the film could be folded at the same place withoutbreaking gives the value of folding endurance.
Ex-Vivo Permeation Studies1) Guinea Pig skin [3]
Full Thickness of guinea pig skin was taken and thepatch was placed over it and this was mounted on thedonor compartment. The permeation study was carried outin a similar manner as that with artificial membrane.
2) Rat Skin [8] Male rats weighing 105-120 gm free from any visible
signs of disease were selected. Abdominal skin of fullthickness was excised from the rat and it was mounted onthe donor compartment. The transdermal Patch was placedover it. The permeation study was carried out in a similarmanner as that with artificial membrane.
3) Pig Ear SkinSuperficial skin of the pig was taken from the back
of its ear and mounted on the donor compartment. Thetransdermal patch was placed over it and the permeationstudy was carried out.
In-vivo Studies On RabbitsSkin Irritation Test using Rabbits [9]
A Primary skin Irritation test was performed sinceskin is a vital organ through which drug is transported. Thetest was carried out on 6 healthy rabbits weighing 2-3kg.Formulation (HPMC-2%: MC-3%) was subjected to thestudy and plain polymer films were used as control. Thedorsal surface of rabbits were cleared well and the hair wasremoved. The skin was cleared with rectified spirit. Thepatches were placed over skin and it is removed after 24hrs. The skins were examined for erythema and oedema.
In-vivo Drug Release studyA Set of male healthy Rabbits (corytolagus cuniculus)
10-12 weeks old weighing 2-3 kgs were selected. Thetemperature, Relative humidity conditions were 280C ±10Cand 600C ± 15 % respectively. The dose of Ketorolactromethamine was calculated according to the body weight[10].The patch was placed on the dorsal surface. At specificintervals of time, the films were removed carefully andanalysed for the remaining drug content. The drug contentobtained was substracted from the initial content in thefilm. The value obtained denotes the amount of drugreleased in the rabbits [11].

October - December 2010 120 Journal of Pharmacy and Chemistry • Vol.4 • Issue.4
Drug release at anyinterval time = Initial drug content - final drug content
(Before placing the film) -(After removal of the film)
Pharmacodynamic StudyComparative Anti-inflammatory studyMethod: Carrageenan induced acute paw oedema method[12]. The animals were divided into 3 groups eachcomprising of 6 albino rats. The first group kept as control.The second group was administered orally with the puredrug solution of Ketorolac tromethamine. The third groupwas administered with transdermal patches of Ketorolactromethamine. After 30 minutes all animals were injectedwith 1%w/v carrageenan in the plantar region of the leftpaw. The right Paw of all animals was considered asreference. Non- inflammed paw for comparison. The pawvolumes for both legs of all the 3 group rats were noted at1,2,3,4 hrs after carrageenan administration.
The mean paw volume in right and left leg of animalsof each group was calculated and the percent oedemainhibition was calculated for every time interval
The difference in paw volume between right and leftleg of each group was calculated and the percent oedemainhibition was calculated as follows.
Percent Oedema inhibition = 100-X
Difference in mean paw volume in treated groupX= ––––––––––––––––––––––––––––––––––––––––––––
Difference in mean paw volume in treated group
Time in hoursGroups Dose %Inhibition ––––––––––––––––––––––––––––––––––––––––
1 hr 2 hr 3 hr 4 hr
Control (Carrageenan) 0.52 0.54 0.57 0.61%w/v Soln 0.1ml ±0.02 ±0.02 ±0.08 ±0.03
0.42 0.37 0.31 0.28±0.11 ±0.11 ±0.10 ±0.03
Standard (Pure drug solution) –––––––––––––––––––––––––––––––––––––––––––––––––––––––––––––––13.5 mg %Inhibition 20.67 32.53 44.94 52.46
±0.11 ±0.11 ±0.10 ±0.03
0.44 0.37 0.34 0.32±0.11 ±0.11 ±0.10 ±0.03
Test (Transdermal Patch) –––––––––––––––––––––––––––––––––––––––––––––––––––––––––––––––13.5 mg %Inhibition 16.8 31.33 40.78 46.03
±0.02 ±0.13 ±0.12 ±0.02
Table-1Comparative Anti-Inflammatory Study
Fig.1: Ex Vivo Permeation Studies
Fig.2: Comparative Anti-inflammatory Studies

October - December 2010 121 Journal of Pharmacy and Chemistry • Vol.4 • Issue.4
Results and DiscussionAfter carrying out the Invitro diffusion studies, the
formulation HPMC-2% with rate controlling membrane(MC-3%) has shown release upto 21 hrs to the extent of84.99%and it was selected for ex-vivo permeation studies.The study was carried out in Pig ear skin, Guinea pig skin& Rat skin, inorder to select the best biological systemwhich has good correlation with invitro release. When thestudy was carried out in Pig ear skin the drug release hasshown the drug diffusion for 22 hrs upto the extent of65.75%.The studies were carried out in guinea pig skin &Rat skin, the drug release has shown for 22 hrs to theextent of 75.73% and 80.42% respectively
The variations among the used biological membranescould be attributed to the the fat content & thickness of themembrane used. As the pig ear skin has more fat distributionand thickness, it might have hampered the drug releasethrough the membrane. As earlier studies indicate that thehuman skin has best correlation with the diffusion rate ofrat skin, the results were analysed on this point of view. Asrat skin has shown good correlation with invitro release offormulation and this was considered for further studies.
Skin Irritancy TestSkin Irritation studies revealed that the formulation
has no erythema and oedema.
In-vivo Release studiesIn-vivo release studies were carried out in rabbits
revealed that the consistent in-vitro release pattern offormulation was reproducible even in biological membrane.At the end of 22 hrs, the in-vivo drug release has shown72.75% release. To ensure the correlation between theInvitro and in-vivo release pattern, the regression analysiswas carried out. It has followed the predicted zero orderkinetics in biological systems also.
Pharmacodynamic studyComparative anti-inflammatory study was carried out
with the transdermal formulation and pure Ketorolactromethamine drug solution(orally).The results obtained inthis study showed that the percentage paw oedema inhibitionwas 46.03% for animals treated with transdermal patch and52.46% for animals treated with pure drug solution(orally).
The study revealed that the animal treated with orallyreduced the inflammation (52.46%) within 4 hrs.But this
dosage form requires frequent administration. The animalstreated with transdermal patch reduced the inflammation(46.03%) in a sustained manner. The patch will release thedrug for 24 hrs.So the frequency of administration will bereduced & the gastro intestinal disturbances can be avoidedin case of transdermal mode of treatment. This may beadvantageous in case of long-term therapies.
ConclusionEx-vivo permeation studies evinced that the in-vitro
dissolution data correlated with the ex-vivo data observedin rat skin rather than of pig ear skin and guinea pig skin.In-Vivo studies, carried out using rabbit affirmed thereliability of the in-vitro evaluation methods followed andthe adaptability of the delivery system to the biologicalenvironment. Pharmacodynamic study revealed that theanti-inflammatory activity of the transdermal formulationwas better when compared with the drug given throughoral. The formulation has achieved the objectives ofextended release, reduced frequency administration, avoidsthe first pass effect and thus may improve the patientcompliance
As an extension of this work pharmacokinetic studies,in vivo studies on higher animals and controlled clinicalstudies on human beings can be carried out in future.
References[1] Zamir RD, Elizabeth M. J Pharm Sci 1995; 84:1190-1196.[2] Basak SC, Vellaiyan K. Eastern Pharm 1997; 40: 63-67.[3] Ramesh P.Indian J Pharmacol 1997; 29:140-156.[4] Koteshwar K B, Udupa N, Vasantha K. Indian drugs 1992;
29:680-685.[5] Naidu RA.Eastern Pharm 1997; 32:119-121.[6] Sane RT, Tirodkar VB, Desai AJ, Patel MK, Kulkarni UD.
Indian Drugs 1992;31:45-50.[7] Sachan A, Jain DK, Trivedi P.Ind J Pharm Sci 1997;
59(1):29-32.[8] Hiroven RJ. Pharm Res 1991; 23:933-938.[9] Udupa N. Pharma Times 1993; 25(1): 26-32.[10] Ghosh MN. Fundamentals of Experimental Pharmacology.
2nd ed. Calcutta Scientific Book Agency 1984:121-123.[11] Chakkapan S. Ind J Pharm Sci 1994;8: 121-125.[12] Kulkarni SK. Hand Book of Experimental Pharmacology.1st
ed. Vikas Prakashan 1999: 53-56.

October - December 2010 122 Journal of Pharmacy and Chemistry • Vol.4 • Issue.4
*Address for correspondence:[email protected]
In Vitro Dissolution Studies on Solid Dispersions of MefenamicAcid in Pregelatinised Starch Alone and with PVP
MV NAGABHUSHANAM1* AND M BEENA DEVI, K SWATHIDept. of Pharmaceutics, DCRM Pharmacy College, Inkollu,
Prakasam(Dt.,) A.P. Pin : 523 167 (India)
ABSTRACT
Solid Dispersions of mefenamic acid (MA), with a water soluble polymer (PVP) and a superdisintegrant namely, pregelatinised starch(PGS), were prepared by common solvent and solventevaporation methods employing methanol as solvent. Solid Dispersions prepared were evaluatedfor dissolution rate and dissolution efficiency in comparison to the corresponding pure drugs. Soliddispersions of mefenamic acid showed a marked enhancement in dissolution rate and dissolutionefficiency. The order of increasing dissolution rate was observed with increase in pregelatinisedstarch ratio. At 1:4 ratio of drug: carrier a 2.83 fold increase in the dissolution rate of mefenamicacid was observed with mefenamic acid-PGS (1:4) solid dispersion. The solid dispersions incombined carriers gave much higher rates of dissolution than super disintegrants alone. MA-PGS-PVP solid dispersion gave a 5.63 fold increase in the dissolution rate of mefenamic acid. Superdisintegrants alone or in combination with PVP could be used to enhance the dissolution rate ofpoorly soluble drug mefenamic acid.
Key Words: Mefenamic Acid, Solid Dispersions, Dissolution rate, Solubility, polyvinyl pyrrolidine,pregelatinised starch.
IntroductionMefenamic acid, an anthranilic acid derivative, is a
non-steroidal anti-inflammatory drug (NSAID) [1]. It isused in mild to moderate pain including headache, dentalpain, postoperative and postpartum pain, dysmenorrhoea,osteoarthritis. The usual dose by mouth is 500 mg threetimes daily. Mefenamic acid is absorbed from the gastrointestinal tract. Peak plasma concentrations occur about 2to 4 hours after ingestion. Most of the NSAIDs belong toclass II category under Biopharmaceutical classificationsystem (BCS) i.e., they are inherently highly permeablethrough biological membranes, but exhibit low aqueoussolubility. Rate of absorption and / or extent ofbioavailability for such insoluble hydrophobic drug arecontrolled by rate of dissolution in gastro-intestinal fluids[2].The present study aims at enhancing the dissolution rate ofMA. In the present investigation solid dispersions[3] wereprepared by employing common solvent and solventevaporation methods. Studies were carried out on mefenamicacid with an objective of enhancing their dissolution ratesand bioavailability. Water dispersible super disintegrants, anew class of tablet excipients were evaluated as carriers,
alone and in combination with PVP, for enhancing thedissolution rate and bioavailability of mefenamic acid.
Materials and methodsMefenamic acid was a gift sample from M/s.Sigma
Laboratories, Mumbai, methanol (qualigens) and polyvinylpyrrolidone (PVP K30) was a gift sample from M/s. SunPharma Ind. Ltd., Mumbai. All other materials used wereof pharmacopoeial grade and were procured fromcommercial sources.
Preparation of Solid DispersionsPreparation of Solid Dispersions Employing SolubleCarriers (PVP)
Solid Dispersions of Mefenamic Acid were preparedby common solvent method employing methanol as solventfor mefenamic acid solid dispersions. The requiredquantities of drug and carrier were weighed and dissolvedin the corresponding solvent in a round bottom flask to geta clear solution. The solvent was then removed byevaporation under reduced pressure (vacuum) at 600 Cwith constant mixing. The mass obtained was crushedpulverized and shifted through mesh no.100. In each casesolid dispersions were prepared in the ratio of drug carriernamely 8:2.

October - December 2010 123 Journal of Pharmacy and Chemistry • Vol.4 • Issue.4
Preparation of Solid Dispersions EmployingSuperdisintegrants
Solid dispersions of mefenamic acid (MA) insuperdisintegrants (pregelatinised starch) were prepared bysolvent evaporation method. The required quantities ofdrug were dissolved in methanol to get a clear solution ina dry mortar. The super disintegrant (passed through 120mesh) was then added to clear drug solution and dispersed.The solvent was removed by continuous trituration.Trituration was continued until a dry mass was obtained.The mass obtained was further dried at 500 C for 4 hoursin a oven. The product was crushed, pulverized andshifted through mesh no.100. In each case solid dispersionsin the superdisintegrants were prepared at three differentratios of drug excipient namely 1:1, 1:2 and 1:4 respectively.
Preparation of Solid Dispersions Employing CombinedCarriers
The required quantities of drug and water solublecarrier (PVP) were dissolved in the solvent to get a clearsolution in a dry mortar. The super disintegrant was thenadded to the drug solution and dispersed. The solvent wasthen evaporated by continuous trituration. Trituration wascontinued until a dry mass was obtained. The massobtained was further dried at 500 C for 4 hours in an oven.The product was crushed, pulverized and shifted throughmesh N0.100. Various solid dispersions prepared with theircomposition are listed in Tables 1.
Table-1
Various solid dispersions prepared and theircomposition
Sl. Composition
No. Drug Carriers SD Code
1. Mefenamic Acid (8) PVP (2) MA-PVP, 822. Mefenamic Acid (1) PGS (1) MA-PGS, 113. Mefenamic Acid (1) PGS(2) MA-PGS, 124. Mefenamic Acid (1) PGS(4) MA-PGS, 145. Mefenamic Acid (1) PGS(3.2) MA-PGS-PVP
PVP (0.8) MA-PGS-PVP
Estimation of Mefenamic AcidA spectrophotmetric method based on the measurement
of absorbance at 279 nm in phosphate buffer pH 7.4 wasused in the present study for the estimation of mefenamicacid [4]. The method was validated for reproducibility,accuracy, precision and linearity by analyzing sixindividually weighed samples of mefenamic acid. Thestock solution of mefenamic acid was subsequently dilutedto a series of dilution containing 5, 10, 15 and 20 mg/ml ofsolution, using phosphate buffer of pH 7.4. The absorbanceof these solutions was measured in UV-VISspectrophotometer (ELICO SL-159). The method obeyedBeer’s law in the concentration of 0-20 mg/ml.
Estimation of Mefenamic Acid Solid DispersionsPrepared
From each batch, 4 samples of 50 mg each were takenand analyzed for the drug mefenamic acid. 50 mg ofdispersions were weighed into a 100 ml volumetric flask.Methanol was added and mixed the contents thoroughly todissolve the drug from the dispersion. The solution wasthen filtered and collected carefully into another 100 mlvolumetric flask. The solution was made up to volumewith the solvent. The solution was suitably diluted withphosphate buffer of pH 7.4 and assayed at 279 nm formefenamic acid. The results are given in Tables 2.
Table 2Mefenamic Acid Content of
Various Solid Dispersions Prepared
Sl. Percent MefenamicNo. SD Code Acid Content ( x- ± s.d.,)
1. MA-PVP, 82 79.5 ± 0.74 (0.93)2. MA-PGS, 11 48.8 ± 0.37 (0.76)3. MA-PGS, 12 32.6 ± 0.19 (0.59)4. MA-PGS, 14 19.9 ± 0.31 (0.65)5. MA-PGS-PVP 19.8 ± 0.17 (0.86)
Dissolution Rate Studies on Solid DispersionsDissolution rate of mefenamic were studied using an
USP XXIII six station dissolution rate test apparatus (ElectroLab). Paddle stirrer at a speed of 50 rpm and temperatureof 370 ± 10C were used in each test. Drug or soliddispersion of drug equivalent to 100 mg of mefenamic acidwas used in each dissolution rate test. Samples ofdissolution medium i.e., phosphate buffer pH 7.4 (5ml)were withdrawn through a filter (0.45 m) at different timeintervals, suitably diluted, and assayed for mefenamic acid.The dissolution experiments were conducted in triplicate.The results are given in Table 3.
Fig.1: Dissolution Profiles of Mefenamic acid and its soliddispersions

October - December 2010 124 Journal of Pharmacy and Chemistry • Vol.4 • Issue.4
Table 3Dissolution Profiles of Mefenamic Acid Solid Dispersions
Time Percent Mefenamic Acid Dissolved ( x− − − − − ±±±±± s.d., n = 3)(min) MA MA-PGS 11 MA-PGS12 MA-PGS 14 MA-PGS PVP MA-PVP 825 12.39±0.63 36.23±0.93 39.20±1.67 44.02±0.93 60.84±1.48 21.75±1.8810 18.66±0.38 40.39±1.43 44.35±1.59 49.71±1.48 64.92±1.45 26.22±1.6720 24.2±0.56 46.61±1.29 51.93±1.70 54.16±1.70 72.96±2.10 31.41±1.8630 28.83±0.69 53.54±2.10 58.16±0.93 61.08±1.49 81.74±2.04 36.98±1.8545 32.25±0.71 60.83±1.70 65.91±1.30 69.25±2.10 86.93±1.66 40.94±2.0460 36.05±0.54 68.75±1.86 73.33±2.23 77.78±2.04 94.72±1.67 46.01±1.70
Fig.3: Hixson-Crowell Dissolution Plots of Mefenamic Acidand its Solid Dispersions
Fig.2: First Order Dissolution Plots of Mefenamic Acid andits Solid Dispersions
Table 4The Correlation Coefficient (r) values in the Analysis ofDissolution Data of Mefenamic Acid Solid Dispersionsas per Zero order, First Order and Hixson-CrowellCube Root Models
Sl. Solid CorrelationNo. Dispersion coefficient (r) value
Zero First Hixson-order order Crowell
1. Pure Drug 0.9875 0.9940 0.99202. MA -PVP, 82 0.8763 0.9075 0.90613. MA- PGS 11 0.8599 0.9379 0.91744. MA –PGS 12 0.8486 0.9376 0.91635. MA –PGS 14 0.8299 0.8829 0.90746. MA –PGS PVP 0.7769 0.9547 0.9192
Table 5Dissolution Parameters of Mefenamic Acid and its SolidDispersions in Superdisintegrants
Dissolution Parameter
%Sl.. Solid T50 Dissol- DE30 K1No. Dispersion (min) ved in (%) (min –1)
10 min
1. Mefenamic Acid > 60 10.63 19.60 0.0072
2. MA-PGS 11 25 35.85 40.59 0.0160
3. MA-PGS12 18 39.41 44.62 0.0184
4. MA-PGS 14 16 43.18 48.01 0.0204
5. MA-PGS PVP 3.50 64.92 64.48 0.0405
6. MA-PVP 82 > 60 26.20 26.81 0.0087

October - December 2010 125 Journal of Pharmacy and Chemistry • Vol.4 • Issue.4
Dissolution rates of mefenamic acid and its soliddispersions followed first order kinetics.(Table 4)
Analysis of Dissolution Data of Solid Dispersions as perHixson-Crowell’s cube root law
The dissolution data of mefenamic acid and their soliddispersions were also analyzed as per Hixson-Crowell’s [5]cube root equation. Hixson-Crowell introduced the conceptof changing surface area during dissolution and derived the“cube-root law” to nullify the effect of changing surfacearea and to linearize the dissolution curves. Hixson-Crowell’s cube root law is given by the following equation.(Wo)1
/3 – (Wt)1/3 = Kt, where Wo is initial mass and Wt is
the mass remained at time ‘t’. The cube root equation isapplicable to the dissolution of monodisperse powderconsisting of uniform sized particles. A plot of (Wo)
1/3 –(Wt)
1/3 versus time will be linear when dissolution occursfrom monodisperse particles of uniform size. Hixson-Crowell plots of the dissolution data were found to belinear (Fig.3) with all solid dispersions. This observationindicated the drug dissolution from all the solid dispersionsis occurring from discretely suspended or deposited(monodisperse) particles. This might have also contributedto the enhanced dissolution rate of the solid dispersions.
The correlation coefficient (r) values of the first orderrelease model are found to be (0.9075 to 0.9940) slightlyhigher when compared to the Hixson-Crowell’s cube rootmodel. Hence the release of drug from the preparationsfollowed predominantly first order kinetics compared toHixson-Crowell cube root law.
Another parameter suitable for evaluation of in vitrodissolution has been suggested by Khan [6] by a parameterDissolution efficiency (DE). DE is defined as the areaunder the dissolution curve up to a certain time ‘t’ expressedas percentage of the area of the rectangle described by100% dissolution in the same time.
Dissolution Efficiency (DE) = 100
.
.100
⎥⎥⎥⎥⎥
⎦
⎤
⎢⎢⎢⎢⎢
⎣
⎡∫
ty
dtyt
o
The index DE30 would relate to the dissolution of drugfrom a particular formulation after 30 minutes and couldbe compared with DE30 of other formulations. Summationof the large dissolution data into a single figure DE enablesready comparison to be made between a large numbers offormulations. First order dissolution rate constants (K1)calculated from the slopes of the first order liner plots,dissolution efficiency (DE30) values, T50 (time for 50%dissolution) and percent dissolved in 10 minutes are givenin Table 2.
Results and DiscussionAll the dissolution parameters given in Table 2
indicated rapid and higher dissolution of mefenamic acidfrom all solid dispersions when compared to mefenamicacid pure drug. Mefenamic acid-PVP (8:2) solid dispersiongave rapid and higher dissolution than the pure drug. A1.21 fold increase in the dissolution rate of mefenamicacid was obtained with this solid dispersion when comparedto pure drug. Water dispersible superdisintegrants gavemuch higher enhancement in the dissolution rate ofmefenamic acid than water soluble carriers. Soliddispersions of superdisintegrants gave rapid and higherdissolution of mefenamic acid when compared to puredrug as well as its solid dispersion in water soluble PVP.In each case, the K1 and DE30 values were increased as theconcentration of carrier (superdisintegrant) in the soliddispersion was increased. At 1:4 ratio of drug:carrier, theorder of increasing dissolution rate with varioussuperdisintegrant ratios was 1:4>1:2>1:1. A 2.83 foldincrease in the dissolution rate of mefenamic acid wasobserved with mefenamic acid-PGS (1:4) solid dispersion.All the solid dispersions in combined carriers gave muchhigher rates of dissolution, several times higher than thedissolution rate of pure drug. PVP combined superdisintegrants gave higher dissolution rates thansuperdisintegrants alone. MA-PGS-PVP solid dispersiongave a 5.63 fold increase in the dissolution rate ofmefenamic acid whereas solid dispersion of mefenamicacid in PGS lone (MA-PGS 14 solid dispersion) gave only2.83 fold increase. Thus combination of superdisintegrantswith water soluble carrier PVP resulted in a greaterenhancement in the dissolution rate of mefenamic acid.
ConclusionThus superdisintegrant pregelatinised starch was found
to be useful as a carrier in mefenamic acid solid dispersionsalone and in combination with PVP to enhance theirsolubility, dissolution rate and dissolution efficiency.
AcknowledgementsThe authors would like to express sincere thanks to
M/s.Sigma Laboratories, Mumbai for generous gift ofmefenamic acid samples.
References[1] Sean C sweetman, Martindale: The Extra Pharmacopoeia,
34th Edition, The Pharmaceutical Press, London,2005,55.[2] Michael Guirguis and Jammali,F. J Pharm Pharmaceut Sci
2001;4:77.[3] Sekiguchi K and Obi N. Chem Pharm Bull 1961;9:866.[4] Teresa H. Ado, Jan Pawlaczyk, J Incl Phen Macrocyclic
Chem 1999;35(3).[5] Hixon AW, and Crowell JH. Ind Eng Chem 1931;23:923.[6] Khan KA, Rhodes CT. Pharma Acta Helv 1972;47:594.

October - December 2010 126 Journal of Pharmacy and Chemistry • Vol.4 • Issue.4
*Address for correspondence:[email protected]
Simultaneous Estimation of Lamivudine, Zidovudine andNevirapine by RP-HPLC in Pure and Pharmaceutical Dosage Form
SK PATRO1*, MK SAHOO, VJ PATRO2 AND NSK CHOUDHURY31*Department of Pharmaceutical Analysis & Quality Assurance, Institute of Pharmacy and Technology,
Salipur, Cuttack, Orissa-754202.2College of Pharmaceutical sciences, Mohuda, Berhampur, Ganjam, Orissa.
3Department of Pharmacy, S. C. B. Medical College, Cuttack, Orissa.
ABSTRACT
A new, simple, accurate, precise, reproducible, economical RP-HPLC method was developed for thedetermination of lamivudine, zidovudine and nevirapine in pure and pharmaceutical dosage forms.A Phenomenix ODS C18 column (4.6 mm × 25 cm i.d., 5mm particle size) in isocratic mode ,withthe mobile phase containing 0.1M sodium dihydrogen orthophosphate (adjusted to pH 3.5 usingdiluted ortho phosphoric acid (1 in 100), Acetonitrile and methanol in the ratio of (2:1:1) (V/V/V)was used for the separation. The flow rate was set at 0.6 ml/min and effluent was monitored at 271nm. The run time was 15 min. The retention times for lamivudine, zidovudine and nevirapine were5.408, 7.417, and 10.125 min respectively. The linearity for lamivudine, zidovudine and nevirapinewere in the range of 12-84, 24-160 and 16-112 μg/ml respectively.
Key Words: RP-HPLC, Lamivudine, Zidovudine, Nevirapine.
IntroductonZidovudine [1, 2] (AZT), was the first drug approved
for the treatment of AIDS and HIV infection. JeromeHorowitz first synthesized AZT in 1964. It is from the classof nucleoside reverse transcriptase inhibitor. Chemically,3’- azido- 2’, 3’-dideoxythymidine. The mode of action isby terminating the growth of the DNA chain and inhibitingthe reverse transcriptase of HIV.
Lamivudine, [1, 2] (3TC) also belongs to the class ofnucleoside reverse transcriptase inhibitor. Chemicallylamivudine is L-2’, 3’- dideoxy -3’-thiacytidine. It acts bycompeting with deoxycytidine tri-phosphate for binding toreverse transcriptase and incorporation into DNA results inchain termination.
Nevirapine, [1, 2] (NEV) belongs to the class ofnon-nucleoside reverse transcriptase inhibitor (NNRTI).Chemically, it is 11-cyclopropyl -5, 11-dihydro-4-methyl-6H-dipyrido [3,2-b: 2’,3’-e][1,4]diazepin-6-one. It acts bybinding reverse transcriptase adjacent the catalytic site andterminates the DNA chain.
The litrerature survey [3-7] reveals that the analytical
methods like UV, HPLC and HPTLC for determination ofthese drugs individually and other combination inpharmaceuticals and biological preparations. In the presentinvestigation an attempt was made to develop a simple,new, accurate, sensitive and economical HPLC method forthe simultaneous estimation of lamivudine, zidovudine andnevirapine in pure sample and tablet dosage forms. Theproposed method was validated as per ICH guidelines [8].
ExperimentalHigh performance liquid chromatography Shimadzu
LC 2010 CHT series equipped with quaternary constantflow pump, auto injector with injection volume of 20 ìl,UV-visible detector and LC 10 software, Phenomenix ODSC18 column (4.6 mm i.d × 25cm , 5ìm particle size) formsthe stationary phase, a calibrated electronic single panbalance (SARTORIUS AG ), Labindia pH con meter, andUltra sonicator. The reference standards of lamivudine,zidovudine and nevirapine were collected from CiplaLaboratory. The tablet was purchased from the local market.All chemicals and reagents used were of AR/HPLC gradeand HPLC water was prepared from Milli-Q in the lab.
Preparation of mobile phase and standard stock solution:The mobile phase was prepared by mixing 0.1M
sodium dihydrogen orthophosphate [adjusted to pH 3.5using diluted ortho-phosphoric acid (1 in 100)] buffer,

October - December 2010 127 Journal of Pharmacy and Chemistry • Vol.4 • Issue.4
acetonitrile and methanol in the ratio of (2:1:1) (V/V/V).An accurately weighed quantity of lamivudine (150 mg),zidovudine (300mg) and nevirapine (200 mg) weretransferred to 100 ml volumetric flask, which was thendissolved and made up to volume with mobile phase. Fromthe above stock solution 0.4, 0.8, 1.2, 1.6, 2, 2.4, 2.8 ml oflamivudine, zidovudine, nevirapine were diluted to 50 mlwith mobile phase to give final concentration 12, 24, 36,48, 60, 72, and 84 μg/ml of lamivudine 24, 48, 72, 96, 120,144 an 168 μg/ml of zidovudine and 16, 32, 48, 64, 80, 96and 112 μg/ml of nevirapine. The solutions were injectedand chromatograms were recorded.
Optimized chromatographic conditions:HPLC analysis was performed by isocratic elution
with flow rate of 0.6 ml/min. The mobile phase containing0.1M sodium dihydrogen orthophosphate [adjusted to pH3.5 using diluted ortho phosphoric acid (1 in 100)] buffer,Acetonitrile and methanol in the ratio of 2:1:1 (V/V/V)separated to obtain well resolved peaks of Lamivudine (Rt= 5.408 min), Zidovudine (Rt = 7.417 min) and Nevirapine(Rt = 10.125 min), respectively as shown in Fig No.1.Overlay Chromatograms of mixture of standardLamivudine, Zidovudine, and Nevirapine is shown in theFig No.3.
Wavelength of maximum absorption was selected by UVspectrum which was recorded by UV-Visiblespectrophotometer Pharmaspec-1700. All the threecomponents showed good response at 270 nm.
Calibration curves for Lamivudine, Zidovudine andNevirapine
Linearity was assessed by injecting 20 ìl of sevendifferent standard concentrations obtained by dilutingstandard stock solution with mobile phase under optimized
Fig no.3. Overlay Chromatograms of mixture of standard Lamivudine, Zidovudine, and Nevirapine.
Fig No: 1. Typical chromatograms of mixture of standard Lamivudine, Zidovudine and Nevirapine.

October - December 2010 128 Journal of Pharmacy and Chemistry • Vol.4 • Issue.4
chromatographic conditions, which provides 12, 24, 36,48, 60, 72, and 84 μg/ml lamivudine, 24, 48, 72, 96, 120,144 and 168 μg/ml of zidovudine and 16, 32, 48, 64, 80,96 and 112 μg/ml of nevirapine. The chromatograms wererecorded and using peak area of individual drugs vs.respective concentrations linearity graph was plotted. Thecalibration curves of Lamivudine and Zidovudine andNevirapine are shown in Fig NO.2. (a), (b) and (c)respectively.
Validation of the method:The developed method was validated in terms of
linearity, accuracy, specificity, limit of detection and limitof Quantitation, intraday and interday precision andrepeatability of measurements.
Analysis of marketed formulations:Twenty tablets were weighed accurately and crushed
to the fine powder .An accurately weighed quantity ofpowder equivalent to 150 mg of lamivudine, 300 mg ofzidovudine and 200 mg of nevirapine were then transferredto a 100 ml volumetric flask , sonicated for 15 min andmade up to volume with mobile phase . Then the solutionwas filtered through 0.45 am filter paper. Two ml aliquotfrom the above solution was transferred into 50mlvolumetric flask and volume was adjusted with the mobilephase up to mark to get sample solution. Working samplesolution (n=5) were injected into column at abovechromatographic conditions and peak areas were measured.The quantification was carried out by keeping these valuesto the straight line equation of calibration curve. Theresults of tablet analysis are shown in Table 1:
Fig.2: (a), (b) and (C) The calibration curves of Lamivudine and Zidovudine and Nevirapine
Table 1Analysis of commercial tablet (n=5)
Analyte Label claim Amount found C.I. SD %RSD t(mg/tablet) (mg/tablet)
Lamivudine 150 150.178 100.1186±0.5088 0.4098 0.4093 0.6476Zidovudine 300 299.902 99.9673±0.2780 0.2239 0.2239 0.3263Nevirapine 200 200.334 100.167±0.6760 0.5444 0.5434 0.6859
Parameter Lamivudine Zidovudine Nevirapine
Retention time(min) 5.408 7.417 10.125Resolution factor 0 6.1125 6.6475Capacity factor 539.6225 741.085 1011.5
Asymetric Factor 1.48 1.485 1.475Theoretical plates 5174.3225 6852.8675 7918.2475
Lower limit of detection (μg/ml) 0.03217 0.00160 0.00697Lower limit of Quantitation (μg/ml) 0.09747 0.00486 0.02112
Results and DiscussionMethod Development:
The method was chosen after several trials with variousproportions of 0.1M sodium dihydrogen orthophosphate(adjusted to pH 3.5 using diluted ortho phosphoric acid (1in 100)) buffer, Acetonitrile and methanol in the ratio of
(2:1:1) was selected to achieve maximum separation andsensitivity. The flow rate was 0.6 ml/min and effluent wasmonitored at 271 nm and a Phenomenix ODS C18 columnand an injection volume of 20 μl and 25oC temperaturesfor the HPLC system were found to be the best for theanalysis. The System suitability results are as follows.

October - December 2010 129 Journal of Pharmacy and Chemistry • Vol.4 • Issue.4
Method Validation:The proposed method has been validated for the
simultaneous determination of Lamivudine, Zidovudineand Nevirapine in bulk as well as tablet dosage form usingfollowing parameters
Specificity:The peak purity of Lamivudine, Zidovudine and
Nevirapine were assessed by comparing the retention time(Rt) of standard Lamivudine, Zidovudine and Nevirapine.Good correlation was found between the retention time ofstandard and sample of Lamivudine, Zidovudine andNevirapine.
Linearity:Linearity was studied by preparing different
concentration levels. The linearity ranges for Lamivudine,Zidovudine and Nevirapine were found to be 12-84μg/ml,24-168μg/ml, and 16-112 μg/ml respectively. The regressionequations for Lamivudine, Zidovudine and Nevirapinewere found to be y = 9,106.3026 x + 19,911.4167, y =84555.8289 x + 33183.0, and y = 72998.1607 x - 48915.50and Correlation- coefficient (r2) 0.9993, 0.9999 and 0.9998respectively. Table-2
Precision:The precision of the method was demonstrated by
repeatability studies. Precision study was performed tofind out intraday and inter-day variations in the estimationof different concentrations with the proposed method.Percentage relative standard deviation (%RSD) was foundto be less than 1% for within a day and day to dayvariations over a period of one week, which provesthat method is precise. Results are shown in Table 3 andTable 4.
Accuracy:It was found by recovery study using standard addition
method. Known amounts of standard Lamivudine,zidovudine and Nevirapine were added to pre-analyzedsamples at a level from 80% upto 120% and then subjectedto the proposed HPLC method. Results of recovery studiesare shown in Table 5.
Robustness:It was done by making small changes in the
chromatographic conditions and found to be unaffected bysmall changes like ±0.1 changes in pH and 2% change involume of the mobile phase.
ConclusionThe modalities adopted in experimentation were
successfully validated as per analytical procedures laiddown in routine. The proposed method was validated bypreliminary analysis of standard sample and by recoverystudies. The percentage of average recoveries was obtainedin the range of 99 to 100. The results of analysis of averagerecoveries obtained in each instance were compared withthe theoretical value of 100 percent by means of Student’s‘t’test. As the calculated‘t’ values are less than theoretical’values (Table 5), it is concluded that the results of recoveriesobtained in agreement with 100 percent for each analyte.The absence of additional peaks in the chromatogramindicates non-interference of the common excipients usedin the tablets. This demonstrates that the developed HPLCmethod is new, simple, linear, accurate, sensitive andreproducible. Thus, the developed method can be easilyused for the routine quality control of bulk and tabletdosage forms.
Acknowledgments The Authors are thankful to the Director of StartechPvt Ltd, Hyderabad for providing the necessary facilities tocarry out this work.
Table 2:Linearity of Lamivudine, Zidovudine and Nevirapine
3TC AZT NEV
Concentration(μμμμμg/ml) Area Concentration(μμμμμg/ml) Area Concentration(μμμμμg/ml) Area
12 1303328 24 2096650 16 113197924 2419809 48 4101648 32 227416836 3534323 72 6107466 48 341632548 4648807 96 8113264 64 455846260 5943136 120 10204268 80 576578972 7267957 144 12305826 96 700174084 8341649 168 14157859 112 8163389

October - December 2010 130 Journal of Pharmacy and Chemistry • Vol.4 • Issue.4
Table 5Recovery study of 3TC, AZT, and NEV
Analyte Level Formu- Amount Amount C.I. SD % % t of % lation of stan- reco- RSD SE
Recovery dard drug veredadded
(μμμμμg/ml) (μμμμμg/ml) (μμμμμg/ml)
3TC 80% 36 28.8 28.848 100.1668±0.3189 0.2568 0.2564 0.1148 1.4523100% 36 36 36.06 100.1664±0.3658 0.2946 0.2941 0.1318 1.2631120% 36 43.2 43.194 99.9862±0.1717 0.1383 0.1385 0.0619 0.2231
AZT 80% 72 57.6 57.556 99.9238±0.2851 0.2295 0.2297 0.1027 0.7422100% 72 72 71.892 99.8500±0.2988 0.2406 0.241 0.1076 1.3936120% 72 86.4 86.4122 100.0140±0.1811 0.1457 0.1456 0.0651 0.2146
NEV 80% 48 38.4 38.422 100.0574±0.3386 0.2728 0.2726 0.122 0.4707100% 48 48 47.964 99.9252±0.3575 0.2879 0.288 0.1287 0.5809120% 48 57.6 57.618 100.0321±0.1195 0.0963 0.0962 0.043 0.7248
SD: Standard deviation, % SE: Percent standard error, C.I.: Confidence Interval within which true value may be foundat 95% confidence level = R ± ts/√n, R: Mean percent result of analysis of Recovery study (n = 5). Theoretical‘t’ valuesat 95% confidence level for n - 1 degrees of freedom t (0.05, 4) = 2.776.
Table 4Inter- day precision of Lamivudine, Zidovudine and Nevirapine
3TC AZT NEV
Conc.(μμμμμg/ml) Area %RSD Conc.(μμμμμg/ml) Area %RSD Conc.(μμμμμg/ml) Area %RSD
36 3552826 0.325 72 6116968 0.329 48 3420662 0.26248 4662300 0.290 96 8121353 0.138 64 4566016 0.15160 5940719 0.162 120 10222629 0.122 80 5759016 0.27272 7234947 0.381 144 12299546 0.264 96 7030650 0.50784 8354959 0.270 168 14180449 0.270 112 8168819 0.314
Table 3Intraday precision of Lamivudine, Zidovudine and Nevirapine
3TC AZT NEV
Conc.(μμμμμg/ml) Area %RSD Conc.(μμμμμg/ml) Area %RSD Conc.(μμμμμg/ml) Area %RSD
36 3534031 0.105 72 6117657 0.329 48 3427936 0.25348 4650188 0.119 96 8142684 0.273 64 4554229 0.19560 5940981 0.134 120 10239424 0.246 80 5777715 0.27772 7269244 0.108 144 12339070 0.192 96 6997762 0.21384 8337291 0.159 168 14197529 0.192 112 8156711 0.281

October - December 2010 131 Journal of Pharmacy and Chemistry • Vol.4 • Issue.4
References[1] British Pharmacopoeia, London, edn 15, 2003: 1963.
[2] Sethi PD. HPLC Quantitative Analysis of PharmaceuticalFormulation. 1 ed. CBS Publisher and Distributor NewDelhi, 1996: 1-74.
[3] Wankhede SB, Gupta KR, Wadekar SB. Indian J Pharm Sci2005; 67:96.
[4] Pai NR, Desai AS. Indian Drugs 2003; 40:111.
[5] Dunge A, Sharda N, Singh S. J Pharm Biomed Anal 2005;37: 1109.
[6] Bin FAN, Stewart James T. J Pharm Biomedical Anal 2002;28: 903-908.
[7] Droste JA, Wissen CP, Burger DM. Therap Drug Monit2003; 35:393.
[8] ICH Guideline Q2B, Validation of Analytical Procedures,Methodology

October - December 2010 132 Journal of Pharmacy and Chemistry • Vol.4 • Issue.4
*Corresponding author
Synthesis, Anticonvulsant Activity of some Novel 1, 2, 4-triazol-3-yl-thioacetohydrazides Derived from Benzimidazole and
BenzoxazoleGURUBASAVARAJ V PUJAR* AND MADHUSUDAN N PUROHIT.
Department of Pharmaceutical Chemistry, J.S.S. College of Pharmacy,Mysore, Karnataka- 570 015
ABSTRACT
A series of novel 1, 2, 4-triazol-3-ylthiols were synthesized from base catalyzed dehydrativecyclization of thiosemicarbazide intermediates. These triazoles were further treated withethylbromoacetate to yield their respective thioethylacetates. The thioacetohydrazides were preparedfrom these esters by reaction with hydrazine hydrate. The compounds synthesized were screened forin vivo anticonvulsant activity in albino mice against pentylenetetrazole (PTZ) induced convulsions.The neurotoxicity of the compounds was evaluated by rotarod method in mice.
Key words: - 1, 2, 4-triazol-3-ylthiol; Anticonvulsant activity.
IntroductionEpilepsy is a neurological disorder characterized by
unprovoked seizures that affects at least 50 million peopleworldwide. There is continuing demand for newanticonvulsant agents as it has not been possible to controlall kinds of seizure with the currently available antiepilepticdrugs. The anticonvulsant drugs like, Loreclezole- a positivemodulator of Gamma Amino Butyric Acid (GABA)receptors and Estazolam- a Benzodiazepine agonist, possesstriazole ring system [1-2]. The fact that several 1,2,4-triazol-3-ylthiol derivatives, substituted benzimidazoles andbenzoxazoles have been proven to exhibit anticonvulsantproperties [1–5], led us to synthesize some new compoundspossessing analogous structures in order to obtain morepotent anticonvulsant agents. In this paper we describe thesynthesis of novel 1,2,4-triazol-3-ylthioacetohydrazidederivatives and their anticonvulsant & neurotoxicityactivities.
Materials and MethodsMelting points were determined in open capillary
tube and are uncorrected. The purity of the compounds waschecked by TLC using ethyl acetate and toluene (7:3) assolvent system and iodine vapors as visualizing agent. IRspectra were recorded on Schimadzu 8400-S by KBr pelletmethod. 1H-NMR spectra were recorded on AMX 400NMR Spectrophotometer at 400 MHz using deuteriateddimethyl sulfoxide (DMSO-d6) as solvent and Tetra methyl
silane (TMS) as internal standard. The chemical shifts areexpressed in ppm.
The scheme of the synthesis for the present study isdepicted in Fig 1.
General procedure for the synthesis of 1-(substituted)-4-aryl-thiosemicarbazide (3-12)
The hydrazides that served as starting materials wereprepared by following the method described earlier [6]. Anequimolar quantity of 2-(1H benzimidazol-2yl-thio)acetohydrazide (1) or 2-(benzoxazol-2yl-thio)acetohydrazide (2) and appropriate arylisothiocyanate wereseparately dissolved in minimum quantity of absoluteethanol. The solution of isothiocyanate was poured into thesolution of hydrazide with continuous stirring. The reactionmixture was refluxed for 8 h. The white solid obtained oncooling the reaction mixture to room temperature, wasfiltered and recrystalized from dichloromethane to obtainthe corresponding thiosemicarbazides.
General method for the synthesis of 5-(substituted)-4-aryl-4H-1,2,4-triazol-3-ylthiols (13-22).
The triazole 3-thiols were prepared by base catalyzeddehydrative cyclization of thiosemicarbazides [7].Appropriate thiosemicarbazide (0.004 mol) was addedportion wise to 15ml of 2M NaOH solution and theresulting solution was refluxed for 6h. After the completionof the reaction (monitored by TLC), the mixture wasallowed to cool and filtered. The filtrate was acidified with2M HCl. The solid obtained by acidification was filtered,

October - December 2010 133 Journal of Pharmacy and Chemistry • Vol.4 • Issue.4
Preparation of 2-(5-((1H-benzo[d]imidazol-2-ylthio)m e t h y l ) - 4 - p h e n y l - 4 H - 1 , 2 , 4 - t r i a z o l - 3 - y l t h i o )acetohydrazide (33)
A mixture of 23 (0.001mol) and hydrazine hydrate 99% (0.003mol) in 25 ml of absolute ethanol was refluxedfor 7h on a water bath. After the completion of the reaction(monitored by TLC), the mixture was concentrated, cooledand poured into the crushed ice. The solid separated wasfiltered, dried and recrystallized from dichloromethane toobtain the hydrazide (33). Similar procedure was employedto prepare the hydrazides (34-42) using correspondingtriazlole-3-ylthioesters (24-32). The physical and the spectraldata of the synthesized compounds are summarized inTable-1 and Table-2 respectively.
Biological Activities
ANTICONVULSANT ACTIVITY:The in vivo anticonvulsant activity was carried out inalbino mice against pentylenetetrazole (PTZ) inducedconvulsions [8]. The subcutaneous PTZ seizure thresholdtest (sc-PTZ) was carried out by an intraperitoneallyadministration of pentylenetetrazole (85 mg/kg) 30 minutesafter the drug treatment. Each compound was administeredorally at three dose levels (30, 100, and 300 mg/kg). Thecompounds were suspended in 0.5% methylcellulose.Animals were observed over 4hr. Failure to observe thegeneralized clonic seizure is defined as protection. Minimalneurotoxicity was measured by the rotarod test. Mice wereplaced on a 1-in.diameter plastic rod rotating at 6 rpm afterthe administration of the drug, and their ability to maintaintheir balance was tested. Neurological deficit was indicatedby the inability of the animal to maintain its equilibriumfor 1 min on the rotating rod in each of three trials. Boththe animal experimental protocols were approved by theInstitutional Animal Ethical Committee (IAEC). Theanticonvulsant activity and neurotoxicity data of thesynthesized compounds is presented in the Table 3.
Result and DiscussionChemistry:
A series of novel 1,2,4-triazol-3-ylthiols weresynthesized from thiosemicarbazide intermediates from basecatalyzed dehydrative cyclization. Absence of the peakcorresponding to the C=O str between 1600-1700 cm-1 inthe IR spectrum of 13 suggests the cyclization of thecorresponding thiosemicarbazide. The triazole thiol protonhas resonated at 12.7 ppm in the proton NMR spectrum.This high down field value is attributed to tautomericthiol-thione system of the triazole. These triazoles werefurther converted to thioethylacetates by the treatment withethylbromoacetate. The IR spectrum of the 23 indicatesthe presence of esteric carbonyl group with the characteristicabsorption at 1645 cm-1. The proton NMR spectrum of thecompound 23 shows a quartet at 4.1 ppm and a triplet at1.04 ppm due to the ethyl group of the ester. The
Fig.1
washed with water, dried and recrystalized fromdichloromethane to obtain the respective 1, 2, 4-triazol-3-ylthiol.
Preparation of ethyl 2-(5-((1H-benzo[d]imidazol-2-ylthio)methyl)-4-phenyl-4H-1,2,4-triazol-3-ylthio)acetate (23)
A mixture of 13 (0.001mol), ethyl bromoacetate(0.0015mol) and 1g of anhydrous potassium carbonate in50ml dry acetone were refluxed for 6h on a water bath.The resulting solution was filtered and the acetone wasevaporated on a water bath. The cooled reaction mixturewas poured into ice-cold water. The crude precipitateobtained was recrystallized from dichloromethane to obtainthe ester 23.
Similar procedure was employed to prepare the ethylesters (24-32) using corresponding triazlole-3-ylthiols.

October - December 2010 134 Journal of Pharmacy and Chemistry • Vol.4 • Issue.4
Table 3:Anticonvulsant and Toxicity Screening Data in Mice
Compound Anticonvulsant Rotarodactivity (Sc PTZa,b) toxicitya,c
0.5h 4h 0.5h 4h33 ++ ++ + +34 ++ ++ + +35 ++ ++ + +36 +++ +++ + -37 +++ +++ + +38 ++ + + +39 ++ + + -40 ++ + + -41 +++ +++ + +42 ++ +++ + +
disappearance of the thiol proton indicates the position ofthe substitution. The IR spectrum of the 33 indicates thepresence of amide carbonyl group with the characteristicabsorption at 1725 cm-1. The hydrazide 33 derived fromthe ester 23 shows characteristic broad singlet at 9.2 ppmcorresponding to CONH group. The absence of signals dueto ethoxy group also confirms the formation of hydrazide.
Anticonvulsant activity: Compounds 36 and 37 from thebenzimidazole series and compounds 41 and 42 from thebenzoxazole series exhibited significant anticonvulsantactivity. However, all the synthesized compounds were
Compd X R R1 Melting point (0C) Rf Value* % Yield
23 NH phenyl 125 0.62 5524 NH 4-tolyl -do- 131 0.75 6025 NH 3-tolyl -do- 128 0.83 7026 NH 4-methoxy phenyl -do- 121 0.64 6527 NH 4-chloro phenyl -do- 145 0.76 6028 O phenyl -do- 152 0.63 7029 O 4-tolyl -do- 142 0.65 6530 O 3-tolyl -do- 135 0.82 6031 O 4-methoxy phenyl -do- 160 0.83 6032 O 4-chloro phenyl -do- 152 0.73 7033 NH phenyl 194 0.64 7534 NH 4-tolyl -do- 188 0.68 6535 NH 3-tolyl -do- 192 0.52 6536 NH 4-methoxy phenyl -do- 205 0.47 6037 NH 4-chloro phenyl -do- 210 0.53 7038 O phenyl -do- 225 0.60 7539 O 4-tolyl -do- 248 0.56 6040 O 3-tolyl -do- 235 0.45 6541 O 4-methoxy phenyl -do- 212 0.50 7542 O 4-chloro phenyl -do- 195 0.64 65
* Mobile phase: ethyl acetate and toluene (7:3)
a Key: (+++) activity at 30 mg/kg, (++) activity at 100mg/ kg, (+) activity at 300 mg/kg,
(-) no activity or no toxicity at 300 mg/kg.b Subcutaneous pentylenetetrazole seizure test. c Neurologictoxicity (rotarod) test.
Table-1:Physical Data of the Compounds

October - December 2010 135 Journal of Pharmacy and Chemistry • Vol.4 • Issue.4
Table-2Spectral data of the compounds
Compd IR and 1H-NMR Spectral Data
3 Chemical name: 1-(2-(1H-benzo[d]imidazol-2-ylthio)acetyl)-4-phenyl thiosemicarbazide.
IR: 3345 (NH), 3309 (NH); 3010 (Ar-CH); 2362 (SCH2); 1675 (C=O);1155 (C=S)1H-NMR: 10.1(s,1H,NH); 9.3 (s,1H,NH); 8.9 (bs, 1H, CONH); 6.85-7.40 (m, 9 H, ArH); 5.10 (bs,1H, NH benzimidazole);3.60 (s, 2H, SCH2).
8 Chemical name: 1-(2-(benzo[d]oxazol-2-ylthio) acetyl)-4-phenyl thiosemicarbazide.
IR: 3335 (NH); 3010 (Ar-CH); 2360 (SCH2); 1685 (C=O);1158 (C=S)1H-NMR: 10.05 (s,1H,NH); 9.2(s,1H,NH); 8.70 (bs, 1H, CONH); 6.90-7.32 (m, 9 H, ArH); 3.76 (s, 2H, SCH2).
13 Chemical name: 5-(1H-benzo[d]imidazol-2-ylthio) methyl)-4-phenyl-4H-1,2,4-triazole-3-thiol.
IR: 3309 (NH); 3025 (Ar-CH); 2990 (CH); 2362 (SCH2)1H-NMR: 12.7 (bs, 1H, NH of triazole); 6.90-7.46
(m, 9H, ArH); 5.1(bs,1H, NH benzimidazole); 3.80 (s, 2H, SCH2).
18 Chemical name: 5-(benzo[d]oxazol-2-ylthio)methyl)-4-phenyl-4H-1,2,4-triazole-3-thiol.
IR: 3021 (Ar-CH); 2950 (CH); 2362 (SCH2)1H-NMR: 12.5 (bs, 1H, NH of triazole); 6.90-7.4 (m, 9 H,
ArH); 3.75 (s, 2H, SCH2).
23 Chemical name: ethyl 2-(5-(1H-benzo[d]imidazol-2-ylthio)methyl-4-phenyl-4H-1,2,4-triazol-3-ylthio)acetate
IR: 3312 (NH); 3010 (Ar-CH); 2362 (SCH2); 1645 (C=O)1H-NMR: 6.90-7.50 (m, 9H,ArH); 5.01 (bs,1H,NH benzimidazole);4.1 (q,2H, OCH2); 3.92 (s, 2H, SCH2); 3.86 (s, 2H, SCH2); 1.04 (t, 3H, CH3)
28 Chemical name: ethyl 2-(5-(benzo[d]oxazol-2-ylthio)methyl)-4-phenyl-4H-1,2,4-triazol-3-ylthio)acetate
IR: 3309 (NH); 3015 (Ar-CH); 2362 (SCH2); 1640 (C=O)1H-NMR: 6.85-7.40 (m, 9H, ArH); ); 4.2 (q,2H,OCH2); 3.92 (s, 2H, SCH2); 3.86 (s, 2H, SCH2); 1.04 (t, 3H, CH3)
33 Chemical name: 2-(5-(1H-benzo[d]imidazol-2-ylthio)methyl)-4-phenyl-4H-1,2,4-triazol-3-ylthio)acetohydrazide
IR: 3350 (NH); 3015 (Ar-CH); 2360 (SCH2); 1665 (C=O)1H-NMR: 9.2 (s, 1H, CONH); 6.90-7.50 (m,9H,ArH); 5.0 (bs,1H, NH benzimidazole);4.3 (bs,2H, NH2); 3.92 (s, 2H, SCH2); 3.86 (s, 2H, SCH2).
38 Chemical name: 2-(5-(benzo[d]oxazol-2-ylthio)methyl)-4-phenyl-4H-1,2,4-triazol-3-ylthio)acetohydrazide
IR: 3342 (NH); 3045 (Ar-CH); 2362 (SCH2); 1650 (C=O)1H-NMR: 9.3(s, 1H, CONH); 6.85-7.40 (m, 9H,ArH); ); 4.2 (bs,2H, NH2); 3.92 (s, 2H, SCH2); 3.86 (s, 2H, SCH2).
[2] Zarghi A, Faizi M, Shafaghi B et al. Bioorg Med ChemLett 2005;15:3126–3129.
[3] Pujar G V, Synesh C, Purohit M N, Srinivasulu N andUdupi R H Ind J Heterocyclic Chem 2008;17: 387-388.
[4] Ucar H, Van derpoorten K, Cacciaguerra S. et al. J MedChem 1998; 41: 1138-1145.
[5] Ali A, Tabatabai AS., Faizi M. et al. Bioorg Med ChemLett 2004; 14: 6057-.6059.
[6] Hussain M I and Vinod Kumar Ind J Chem 1992; 31B:285-288.
[7] Omar M T. Arch Pharm Res 1997; 20(6): 602-609.[8] Kulkarni S K. Hand Book of Experimental Pharmacology,
2nd ed. Vallabh Prakashan, Delhi, 1993: 58-59.
well tolerated at the tested doses as indicated by thetoxicity data.
AcknowledgementThe authors are grateful to J.S.S Mahavidyapeetha
and Dr. H.G.Shivakumar, Principal, J.S.S College ofPharmacy, Mysore for providing research facilities. Authorsare thankful to NMR research centre, Indian Institute ofScience, Bangalore for providing 1H-NMR spectra.
References[1] Kucukguzel I, Güniz Kucukguzel G, Rollas S et al. IL
Farmaco 2004; 59: 893–901.

October - December 2010 136 Journal of Pharmacy and Chemistry • Vol.4 • Issue.4
*Address for correspondence:Email: [email protected]
Characterization and Screening of Antimicrobial Activity ofLactic Acid Bacterium Isolated from A Traditional Beverage
Marcha of Sikkim
DEEPLINA DAS AND ARUN GOYAL*Department of Biotechnology, Indian Institute of Technology Guwahati, Guwahati - 781 039, India
ABSTRACT
A strain DDM5 was isolated from traditionally fermented beverage marcha of Sikkim, showed broadrange of antagonistic activity against some member of Gram positive viz. Staphylococcous aureus,Staphylococcus epidermis, Pediococcous pentosaceus, Leuconostoc citreum and Gram negativebacteria viz Escherichia coli, Alcaligenes feacalis. The isolate was found to be vancomycin andnorfloxacin resistant like other antimicrobial substance producing lactic acid bacteria such asPediococcus pentosaceus and Streptococcos spp. The isolate was also able to ferment glucose,sucrose, xylose, trehalose, mellibiose, galactose, and fructose. The purpose of this study was toevaluate the potential of DDM5 as a bioprotective culture by inhibiting the food spoilagemicroorganism.
Keywords: Antagonistic activity, lactic acid bacteria, carbohydrate fermentation
IntroductionOne of the major challenges for the current food
industry is to reduce the cost of food processing andavoiding the economic losses due to the food spoilage.Many researches have been focused on naturally producedantimicrobials that can reduce the usage of chemicalpreservatives as well as increase the nutritional propertiesof the food. Lactic acid bacteria (LAB) are usuallyassociated with fermented dairy products or used as startercultures but they also play an important role in foodpreservation due to the production of antimicrobialsubstance such as organic acids, diacetyl compounds,hydrogen peroxide, reuterin and bacteriocins [1]. Recentlymany studies have focused on natural antimicrobialsubstances secreted by LAB in order to inhibit spoilagemicroorganism pathogens such as Listeria monocytogenesand Staphylococcus aureus [2]. Marcha was prepared fromsoaked glutinous rice mixed with various parts from locallygrown plants and used as starters for preparation of variousindigenous alcoholic beverages in Sikkim in India [3]. Theaim of this research was to isolate and identify of LABstrains from Marcha that could be useful as bioprotectivecultures. As a result of these screening, isolate DDM5 wasfound to produce bacteriocin like substances.
Materials and MethodsIsolation of LAB
Samples of Marcha was collected aseptically in steriletube from local market in Gangtok city and transported tolaboratory for analyses. The isolation of lactic acid bacteriafrom Marcha was done by dissolving 1g of Marcha into 9ml 0.85% sterile NaCl solution [4]. Serial dilution up to10-7 was done and all dilutions were plated on MRSmedium with 2% glucose and supplemented with 2% agar(pH-6.4) by spreading and the plates were incubated at30ÚC for 48 h. Randomly ten distinct colonies from 10-6
plates and ten distinct colonies from 10-7 plates werepicked and inoculated into MRS medium supplementedwith 2% glucose (pH-6.4) for 24 h at 30ÚC. Purity of eachsingle colony was checked by streaking again it into MRSagar plate and incubated for 24 h at 30ÚC and then sub-cultured in MRS broth.
Preparation of cell free supernatant100 μl of culture was taken from 18-20 h old culture
of MRS medium and inoculated in 5 ml of fresh MRSmedium supplemented with 2% glucose (pH-6.4) andincubated at 37°C for 20 h. The culture was then centrifugedat 10,000g and 4°C for 15 min. The cell free supernatantwas collected and pH was adjusted to 6.0 using sterile 4NNaOH. The supernatant was filtered through 0.2 μm filtermembrane and the filtrate was used for checking the

October - December 2010 137 Journal of Pharmacy and Chemistry • Vol.4 • Issue.4
antimicrobial activity on the growth of the indicatorstrains [5].
Screening of the isolatesThe isolates were screened for antagonistic activity by
agar well diffusion method using E. coli DH5α as indicatorstrain [5]. An overnight culture of the indicator strain(0.5%) was inoculated in Soft agar medium (0.7% agar).10 ml of this soft agar with the indicator strain was platedover the agar base (1.5% agar). The wells were createdwith sterile tips and were inoculated with 50 μl of cell freesupernatant of the isolate. The plates were then placed at4°C for 6 h which allowed diffusing the supernatant intothe agar. Then the plates were incubated at 37°C andexamined after 24 h for zone of inhibition.
Antibiotic sensitivity profile of the isolateThe isolate DDM5 was tested for susceptibility to
twenty eight antibiotics using agar disc diffusion test [6].This method determines the efficacy of the drug bymeasuring the diameter of the zone of inhibition whichresults from diffusion of the antibiotic from the disc intothe medium. The antibiotic tests were performed usingcommercially available antibiotic octodiscs from Hi-mediaPvt. Ltd., India. The discs were placed over the soft agarinoculated with 1% DDM5 and incubated for 36-48 h at30°C for observing the clear zone of inhibition around thediscs. The results were compared with Pediococcuspentosaceus [4].
Carbohydrate fermentation profile of the isolateThe isolate DDM5 was tested for their ability to
ferment various carbohydrates using the method of Kandlerand Weiss [7]. 50μl of culture was inoculated into 5 mlMRS medium lacking glucose but containing phenol redand 2% other test carbohydrates. Then the test mediumwas incubated for 48 h at 30°C under static condition. Theacid production was observed between 24-48h. The acidproduction was indicated by changing color of the phenolred indicator dye from red to yellow as a result ofcarbohydrate fermentation [6]. The results were comparedwith the published data of Pediococcus pentosaceus [4].
In vitro inhibition testThe antimicrobial activity of screened isolate DDM5
was checked with different Gram positive and Gramnegative indicator strains using agar well diffusion method.The indicator strains were obtained from the MicrobialType Culture Collection and Gene Bank (MTCC), IMTECH,Chandigarh and from the Agricultural Research ServiceCulture Collection (NRRL), U.S.A. The 50 μl filter sterilized(0.2 μm membrane) cell free supernatant of DDM5 wasplaced in the wells of soft agar inoculated with indicatorstrains over the base agar plate. The plates were incubatedat the optimum growth temperature of the indicator strainused [5]. The antimicrobial activity was determined bymeasuring the distance of the clear zone around the wells.
Results and DiscussionBased on the finding of zone of inhibition around the
well against E. coli DH5α as indicator strain, it wasconcluded that among the twenty isolates from marcha, theisolate DDM5 was selected, as it showed the maximumzone of inhibition (> 15 mm). The selected isolate wasnamed after discover as DDM5. The antibiotic resistance,carbohydrate fermentation profiles of the isolate DDM5was carried out for its characterization. The antibioticsusceptibility and carbohydrate fermentation profile ofDDM5 was compared with the Pediococcus pentosaceusisolated from soil of Assam [4], as Pediococcus pentosaceuswas also well known for producing antimicrobial substance[5]. The antibiogram of DDM5 has been shown in Table 1.By measuring the zone of inhibition around the octodiscs,the isolate DDM5 was found resistant to vancomycin,ciprofloxacin, norfloxacin, nalidixic acid and sensitive tobacitracin penicillinG, ampicillin like and Pediococcuspentosaceus [4] (Table 1). The resistance of lactic acidbacteria to vancomycin is a common characteristic of thisgroup [8]. The antibiogram pattern of DDM5 andPediococcus pentosaceus are in similar with few exceptions.The isolate DDM5 utilized glucose, sucrose, xylose,trehalose, mellibiose, galactose but did not show any activitytowards rhamnose (Table 2). The isolate DDM5 couldferment raffinose unlike Pediococcus pentosaceus [4] shownin Table 2. The carbohydrate fermentation profiles of theisolate DDM5 and Pediococcus pentosaceus are 62%similar. The isolate DDM5 showed broad range ofantagonistic activity. It inhibited the growth of Grampositive Staphylococcous aureus MTCC 737 andStaphylococcus epidermis MTCC 6810, Leuconostoccitreum NRRL B-742 and Pediococcus pentosaceus aswell as Gram negative Alcaligenes feacalis MTCC 2952and E. coli. DH5α (Table 3). The isolate DDM5 showedstrong inhibitory effect against Gram negative bacteria ascompared to Pediococcus pentosaceus ACCEL [9] andPediococcus acidilactici LAB 5 [10]. Both Pediococcuspentosaceus ACCEL and Pediococcus acidilactici LAB 5did not inhibit the growth of any Gram negative bacteriabut were active against Gram positive Staphylococcusepidermis and Staphylococcous aureus [9, 10]. As theisolate DDM5 had shown clear zone of inhibition (>15mm) against several major food borne pathogens, such asE. coli, Staphylococcus epidermis, Alcaligenes feacalis andStaphylococcous aureus in food stuffs, it could be potentiallyused as bio-preservatives in food systems.
AcknowledgementThis research work and Ms Deeplina Das (Senior
Research Fellow) are supported by a project grant by theCouncil of Scientific and Industrial Research, New Delhi,India, to AG.

October - December 2010 138 Journal of Pharmacy and Chemistry • Vol.4 • Issue.4
Table 1Antibiogram of isolate DDM5 using antibiotic
octodiscs on MRS agar
Sl. Concen- DD *PediococcusNo.
Antibiotictraion M5 pentosaceus
1 Kanamycin (K) 30 μg M R2 Lincomycin (L) 2 μg M S3 Olaendomycin (OL) 15 μg S S4 Penicillin G (P) 10 U S S5 Tobramycin(Tb) 10 μg R R6 Nalidixic acid (Na) 30 μg R -7 Sulphamethoxazole (Sx) 50 μg S -8 Amoxyclav(Ac) 10 μg S M9 Cephalexin (Cp) 10 μg M M
10 Ciprofloxacin(Cf) 10 μg R R11 Clindamycin(Cd) 2 μg S M12 Co-Trimaxazole(Co) 25 μg S13 Erythromycin(E) 15 μg S S14 Tetracycline(T) 30 μg S S15 Ampicillin (A) 10 μg S R16 Carbenicillin 100 μg S S17 Cephotaxime(Ce) 30 μg S M18 Chloramphenicol (C) 30 μg S S19 Norfloxacin (Nx) 10 μg R R20 Oxacillin(Ox) 5 μg M M21 Amikacin (Ak) 10 μg R R22 Amoxycillin (Am) 10 μg S S23 Bacitracin(B) 10 U S M24 Novobiocin(Nv) 30 μg S M25 Vancomycin (Va) 30 μg R R26 Gentamicin (G) 10 μg S -27 Cefexime (Cfx) 5 μg R -28 Ceftazidime (Ca) 30 μg R -
R- Resistant (0-0.1cm); M-Moderate (0.2-0.8 cm); S- Sensitive(0.9-2.5 cm)
* The data of antibiogram of Pediococcus pentosaceus wastaken from earlier report [4]
**Values in centimeter are the distance of zone of inhibition ofgrowth of microorganism.
Table 2Carbohydrate fermentation profile of isolate DDM5
Sl. Carbohydrate DDM5 *PediococcusNo. pentosaceus1 Xylose + +2 Trehalose +++ +++3 Mellibiose ++ +++4 Galactose +++ +++5 Mannitol +++ -6 Raffinose ++ -7 Cellobiose ++ +++8 Rhamnose - -9 Maltose +++ +++10 Lactose +++ ++11 Fructose ++ +++12 Glucose +++ +++13 Sucrose +++ +++
(+++): strongly positive, (++): fairly positive, (+): weakly positive,(-): negative
* The data of carbohydrate fermentation profile of Pediococcuspentosaceus was taken from earlier published report [4].

October - December 2010 139 Journal of Pharmacy and Chemistry • Vol.4 • Issue.4
References[1] Magnusson J, Schnurer. J Appl Environ Microbiol 2001;
67, 1–5.[2] Bromberg R, Moreno I, Oliveira J. Brazillian J Microbiol
2004; 35:137-144.[3] Tamang J P, Dewan S, Tamang B, Rai A, Schillinger U,
Holzapfel W H. Indian J Microbiol 2007; 47:119–125.[4] Patel S, Goyal A. The Internet J Microbiol 2010; 8:1[5] Todorov S D, Dicks L M T. Int J Food Microbiol 2009; 132:
117–126.
Table 3Inhibitory Spectra of DDM5 against some indicator strain
Indicator Strain Media Temp.(°C) Sensitivity
E. coli DH5á LB 37 +++Staphylococcous aureus MTCC 737 NB 30 +++Staphylococcus epidermis MTCC 6810 NB 30 ++Klebsiella oxytoca MTCC 3030 NB 37 -Alcaligenes feacalis MTCC 2952 NB 30 +Enterobacter aerogenes MTCC 7016 NB 30 -L. mesenteroides NRRL B-640 MRS 30 -L. dextranicum NRRL B-1146 MRS 30 -L. mesenteroides NRRL B-1149 MRS 30 -L. citreum NRRL B-742 MRS 30 ++L. mesenteroides NRRL-512 MRS 30 -Pediococcus pentosaceus MRS 30 ++Pseudomonas Fluorescens NRRLB-1612 NB 37 -Wesiella confuse MRS 30 -
(+++): zone>15 mm, (++): 10 mm<zone< 15 mm, (+): 5mm<zone<10mm, (-): no zone of inhibition**Values in millimeter are the distance of zone of inhibition of growth of microorganism
[6] Purama R K, Agrawal M, Majumder A, Ahmed S, Goyal A.J Pure Appl Microbiol 2008; 2, 139-146
[7] Kandler O, Weiss N. In: Bergey’s Manual of SystematicBacteriology (Sneath PHA, Mair NS, Sharpe ME, Holt JG,ed). Baltimore: Williams and Wilkins, 1986:1208-19
[8] Ammor M S, Florez A B, Mayo B. Food Microbiol 2007;24: 559-70.
[9] Wu C W, Yin L J, Jiang S T. J Agric Food Chem 2004; 52:1146-1151.
[10] Mandal V, Sen S K, Mandal N C. Indian J BiochemBiophys 2008; 45: 106-110.

October - December 2010 140 Journal of Pharmacy and Chemistry • Vol.4 • Issue.4
*Address for correspondence:E-mail: [email protected]
Optimized and Validated Spectrophotometric Methods for theDetermination of Aripiprazole Using Ferric Chloride Based on
Complexation ReactionsKVV SATYANARAYANA1, I UGANDAR REDDY1, 2 AND P NAGESWARA RAO1*
1Department of Chemistry, National Institute of Technology, Warangal -506004,
Andhra Pradesh and India2Dr.Reddy’s Laboratories Ltd. Active pharmaceutical ingredients,
IPDO, Bachupally, Hyderabad-500072, A.P and India.
ABSTRACT
Three simple and sensitive spectrophotometric methods (A-C) were developed for assay of aripiprazole(APZ) in pharmaceutical formulations. Methods A and Method B are based on the oxidation of APZwith Fe (III) and the estimation of reduced Fe(III) after chelation with either o-phenanthroline (o-phen) or bipyridyl (bipy) in the presence of acetate buffer solution. The absorbances of the coloredcomplexes were measured at 508 nm or 519 nm for Method A and Method B respectively. MethodC is based on the oxidation of APZ by Fe (III) in acidic medium, and the subsequent interaction ofiron (II) with ferricyanide to form Prussian blue, with the product exhibiting an absorption maximumat 796 nm. Beer’s law is obeyed over the ranges 0.5-7.0 μg/mL, 0.5-7.0 μg/mL and 0.5-9.0 μg/mLfor Methods A, B and C, respectively. The calculated molar absorptivity values are 8.88 x10⁴, 7.21x10⁴ and 7.74 x10⁴ L/mol/cm for Method A, B and C, respectively, and the corresponding Sandal’ssensitivities are 5.0x10⁻³, 6.2 x10⁻³and 5.7 x10⁻³ μg/cm2.The results of the proposed procedures werevalidated statistically according to ICH guidelines. The proposed methods were applied successfullyfor the determination of APZ in tablets.
Keywords: Aripiprazole, determination, spectrophotometry, oxidation, tablet forms.
IntroductionAripiprazole is a quinolinone derivative with the
chemical name 7-[4-[4-(2, 3- dichlorophenyl)-1-piperazinyl]butoxy]-3, 4-dihydro-2(1H)-quinolinone (Fig 1). It is apsychotropic agent belonging to the chemical class ofbenzisoxazole derivatives and is indicated for the treatmentof schizophrenia. It is a selective monoaminergic antagonistwith high affinity for the serotonin Type 2 (5HT2), dopamineType 2 (D2), 1 and 2 adrenergic and H1 histaminergicreceptors. The different analytical techniques reported sofar for the determination of this drug and its metabolites inbiological samples as well as in pharmaceutical formulationsinclude LC-MS-MS previously published [1-3]. Thedetermination of aripiprazole in plasma by RP-LC [4] andthat in bulk drug, solid dosage forms and related substancesby RP-LC [5-8] were also reported. As far as sensitive andeconomical methods of assay are concerned, very few UV-Visible spectrophotometric methods have been reported for
the quantification of aripiprazole based on extractable ionpair complexes [9-10] and UV spectrophotometric method[11]. Literature survey revealed that no attempt was madefor the determination of APZ by Fe (III) in the presence of1, 10-phenanthroline or 2, 2-bipyridyl or potassiumferricyanide. In view of this, we report three simple andsensitive spectrophotometric methods for the assay of APZin pharmaceutical formulations are reported in this article.The methods are based on the reducing property of thecited drug by iron (III). The formed iron (II) is interactedwith 1, 10-phenanthroline, 2, 2’-bipyridyl or ferricyanideto give colored species whose absorbances were measuredat 508, 519 and 796 nm respectively. Such reaction schemeshave successfully been used for spectrophotometricdetermination of many pharmaceutical compounds [12-14]. The developed methods are simple, accurate, preciseand sensitive for the determination of APZ in tablets.
ExperimentalApparatus
All absorption spectra were recorded using UV-Vis-

October - December 2010 141 Journal of Pharmacy and Chemistry • Vol.4 • Issue.4
NIR spectrophotometer (Shimadzu 1601, Japan) equippedwith 1 cm matched quartz cells by using a personalcomputer loaded with the UV-PC 3.9 software package. Anelectronic microbalance (Sartorius MC 5, Germany) wasused for weighing the solid materials. A digital pH meter802 (Systronic, India) was used for measuring the pH ofsolutions.
Materials and ReagentsAll solvents and reagents used were of analytical
grade. Double-distilled water was used throughout theinvestigation. The aqueous solution of 0.05 M ferric chloride(S.D. Fine Chem., Mumbai, India) was prepared bydissolving 0.8110 g of the chemical in 100 ml of distilledwater and stored in a dark bottle. The stock solution wasthen diluted appropriately with distilled water to get 0.005M working concentration for Method A, Method B andMethod C. The solution was prepared afresh just before theexperiment.
o-phenanthroline (0.02M) was prepared by dissolving0.3960 g of o-Phenanthroline (S.D. Fine Chem., Mumbai,India) in 100 mL of distilled water.
2, 2’ bipyridyl (0.02M) was prepared bydissolving0.3120 g of 2, 2’ bipyridyl (E-Merck., Mumbai,India) in 100 mL of distilled water. Potassium ferricyanide(0.01M) was prepared by dissolving 0.3293 g of potassiumferricyanide (S.D. Fine Chem., Mumbai, India) in 100 mLof distilled water. The stock Potassium ferricyanide solutionwas then diluted appropriately with distilled water to get0.002 M working concentration for method C. Sodiumacetate- acetic acid buffer of varying pH [3-6.0] valueswere prepared by mixing appropriate volumes of 0.1M ofsodium acetate (S.D. Fine Chem., Mumbai, India) andacetic acid (S.D. Fine Chem., Mumbai, India). The pH wasadjusted with the aid of pH-meter.
A gift standard APZ sample was obtained from Inogentlaboratories, Hyderabad, India. Three brand tablets werepurchased from local medical shop. A stock standardsolution containing 500μg mL-1of APZ was prepared bydissolving accurately weighed 0.025 g of pure drug in a 50mL of calibrated flask with methanol. The solution wasfurther diluted with methanol to get working concentrationsof 50 μg mL-1 APZ for all three methods.
Method ADifferent aliquots of APZ solution corresponding to
0.5-7.0 μg mL –1 were transferred into a series of 10 mLvolumetric flasks. To each flask 1.0ml of acetate buffer(pH 5), 2.0ml of 0.005M ferric chloride and 3.0 mL of o-Phenanthroline (0.02M) were added and kept in a waterbath (75 ± 2 0C) for 20min, then immediately cooled toroom temperature (27 ± 10C) using cold water and thesolutions were made up to volume with distilled water. Theabsorbance of each solution was measured at 508 nmagainst the reagent blank. The calibration graph wasconstructed by plotting the absorbance versus concentrationof the drug. The concentration of the unknown was readfrom the calibration graph or computed from the regressionequation.
Method BVarying volumes of APZ solution corresponding to
0.5-7.0 μg mL –1 were transferred into a series of 10 mLvolumetric flasks. To each flask 1.5 mL of acetate buffer(pH 4 ), 2.5mL of 0.005M ferric chloride and 3.0 mL of2,2’ bi-pyridyl (0.02M) were added and kept in a waterbath (75 ± 2 0C) for 25min, then immediately cooled toroom temperature (27 ± 10C) using cold water and thesolutions were made up to volume with distilled water. Theabsorbance of each solution was measured at 519 nmagainst the reagent blank. The calibration graph wasconstructed by plotting the absorbance versus concentrationof the drug. The concentration of the unknown was readfrom the calibration graph or computed from the regressionequation
Method CAliquot of a solution containing 0.5-9.0 μg mL –1 of
APZ were transferred into a series of 10mL standardflasks. To each flask 3.0mL of ferric chloride (0.005M)was added and kept in a water bath (75 ± 2 0C) for 30min.the flasks were then added each with 3.0 ml of potassiumferricyanide and 1.0 ml of 1N HCl, cooled to roomtemperature, diluted to mark with distilled water and mixedwell. The absorbance of the resulting solution was measuredat 796 nm for APZ against a reagent blank preparedsimilarly. The concentration of the unknown was read fromthe calibration graph or computed from the regressionequation.
Procedure for pharmaceutical formulationsAPZ containing ten tablets were weighed and ground
into a fine powder. An amount of the powder equivalent to25 mg of APZ was weighed into a 50-mL volumetric flask,30 mL methanol added and shaken thoroughly for about 20min, diluted to the volume with the same solvent, mixed,and filtered using Whatmann No. 41 filter paper into a 50-mL volumetric flask. The filtrate was further diluted withmethanol to get concentration of 50 μg mL-1 of APZ forMethod A, Method B and Method C. A suitable aliquotwas then subjected to analysis.
Fig. 1: Chemical structure of Aripiprazole

October - December 2010 142 Journal of Pharmacy and Chemistry • Vol.4 • Issue.4
Results and DiscussionIt is known that 1, 10-phenanthroline and 2, 2-bipyridyl
form highly stable, intensely red colored, water-solublechelates with iron (II). The complex formation stabilizesthe iron (II) oxidation state, as the formal redox potentialof complexes (+1.06 V) is higher than that of the ironaqua-complex. These complexes were applied to thedetermination of reducing substances by measuring theamount of ferrous iron produced when the analyte solutionis treated with an excess of ferric salt. Trace amounts ofthe reductants are conveniently measured by this waythrough spectrophotometric determination of ferrous ironusing 1, 10- phenanthroline or 2, 2-bipyridyl.
The proposed methods involve the oxidation of APZwith ferric chloride and subsequent complexation ofresulting Fe (II) with 1, 10-phenanthroline or 2, 2-bipyridylto form a red-colored complex, [Fe (phen) 3]
2+, with anabsorption maximum at 508 nm or
[Fe (bipy) 3]2+ exhibiting an absorption maximum at
519 nm. The general reaction path of proposed methods isrepresented in scheme 1. The absorption spectra of coloredcomplexes are shown in Figs 2 and 3.
Scheme-1
Fig.2: Absorption spectra. (b) Product of APZ (3 μμμμμg mL-1)-Fe(III)-Phen against reagent blank and (a) reagent blankagainst water
Optimum reaction conditionsThe optimum reaction conditions for the quantitative
estimation of APZ were established via a number ofpreliminary experiments
Effect of pHThe effect of pH for the quantitative determination of
APZ with the proposed oxidation-complexation reactionover the pH range of 3-6 was examined using acetatebuffer. At pH<3, the intensity of the absorption of theFe(II)-phen or Fe(II)-bipy complex decreases most probablydue to difficult oxidation of protonated forms of APZ byFe(III).
An increase in pH >3.0 caused increased absorbancefor both methods. So, pH 5.0 and 4.0 were chosen as theoptimum pH in Method A and Method B, respectively.The optimum volume of buffer solution required was 1.0ml in Method A and 1.5 mL in Method B in the totalvolume of 10 mL.
Effect of reagent concentrationsThe effects of reaction variables (methods A and B)
such as concentration of Fe (III) and 1, 10-phenanthrolineor 2, 22 - bipyridyl have been investigated to developmaximum color by adding to 5.0 μg mL-1 of APZ. Theeffect of iron (III) chloride concentration on colordevelopment was studied. These results indicate thatmaximum absorbance was observed for 2.0 mL of 0.005Mof ferric chloride for Method A and 2.5 mL of 0.005M offerric chloride for method B. Larger volumes of Iron (III)chloride had no effect on the sensitivity of the reaction.Similar observations were made when varying volumes of0.02M of phenonthroline or bipyridyl solution were addedto fixed amounts of APZ (5.0 μg mL-1) and diluted to 10mL after full color development. It is found that theabsorbance reaches its maximum when the amount ofreagent is 3.0 mL.
Effects of temperature and heating timeThe formation of colored complex was slow at room
temperature and required longer time for completion. Henceefforts were made to accelerate by carrying out the reactionat higher temperatures. It was observed that the maximumabsorbance was observed after heating the reaction mixture
Fig.3: Absorption spectra. (b) Product of APZ (4 μμμμμg mL-1) -Fe(III)-Bipy against reagent blank and (a) reagent blankagainst water
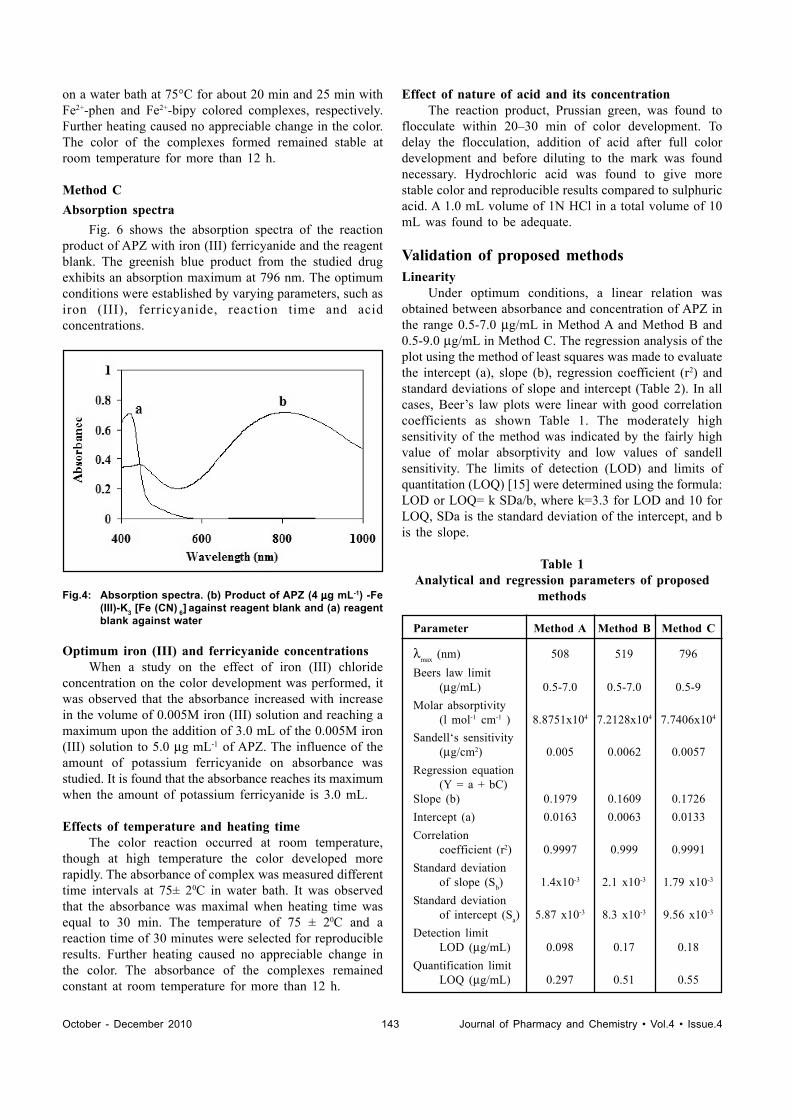
October - December 2010 143 Journal of Pharmacy and Chemistry • Vol.4 • Issue.4
on a water bath at 75°C for about 20 min and 25 min withFe2+-phen and Fe2+-bipy colored complexes, respectively.Further heating caused no appreciable change in the color.The color of the complexes formed remained stable atroom temperature for more than 12 h.
Method CAbsorption spectra
Fig. 6 shows the absorption spectra of the reactionproduct of APZ with iron (III) ferricyanide and the reagentblank. The greenish blue product from the studied drugexhibits an absorption maximum at 796 nm. The optimumconditions were established by varying parameters, such asiron (III), ferricyanide, reaction time and acidconcentrations.
Fig.4: Absorption spectra. (b) Product of APZ (4 μμμμμg mL-1) -Fe(III)-K3 [Fe (CN) 6] against reagent blank and (a) reagentblank against water
Optimum iron (III) and ferricyanide concentrationsWhen a study on the effect of iron (III) chloride
concentration on the color development was performed, itwas observed that the absorbance increased with increasein the volume of 0.005M iron (III) solution and reaching amaximum upon the addition of 3.0 mL of the 0.005M iron(III) solution to 5.0 μg mL-1 of APZ. The influence of theamount of potassium ferricyanide on absorbance wasstudied. It is found that the absorbance reaches its maximumwhen the amount of potassium ferricyanide is 3.0 mL.
Effects of temperature and heating timeThe color reaction occurred at room temperature,
though at high temperature the color developed morerapidly. The absorbance of complex was measured differenttime intervals at 75± 20C in water bath. It was observedthat the absorbance was maximal when heating time wasequal to 30 min. The temperature of 75 ± 20C and areaction time of 30 minutes were selected for reproducibleresults. Further heating caused no appreciable change inthe color. The absorbance of the complexes remainedconstant at room temperature for more than 12 h.
Effect of nature of acid and its concentrationThe reaction product, Prussian green, was found to
flocculate within 20–30 min of color development. Todelay the flocculation, addition of acid after full colordevelopment and before diluting to the mark was foundnecessary. Hydrochloric acid was found to give morestable color and reproducible results compared to sulphuricacid. A 1.0 mL volume of 1N HCl in a total volume of 10mL was found to be adequate.
Validation of proposed methodsLinearity
Under optimum conditions, a linear relation wasobtained between absorbance and concentration of APZ inthe range 0.5-7.0 μg/mL in Method A and Method B and0.5-9.0 μg/mL in Method C. The regression analysis of theplot using the method of least squares was made to evaluatethe intercept (a), slope (b), regression coefficient (r2) andstandard deviations of slope and intercept (Table 2). In allcases, Beer’s law plots were linear with good correlationcoefficients as shown Table 1. The moderately highsensitivity of the method was indicated by the fairly highvalue of molar absorptivity and low values of sandellsensitivity. The limits of detection (LOD) and limits ofquantitation (LOQ) [15] were determined using the formula:LOD or LOQ= k SDa/b, where k=3.3 for LOD and 10 forLOQ, SDa is the standard deviation of the intercept, and bis the slope.
Table 1Analytical and regression parameters of proposed
methods
Parameter Method A Method B Method C
λmax (nm) 508 519 796Beers law limit
(μg/mL) 0.5-7.0 0.5-7.0 0.5-9Molar absorptivity
(l mol-1 cm-1 ) 8.8751x10⁴ 7.2128x10⁴ 7.7406x10⁴
Sandell‘s sensitivity(μg/cm2) 0.005 0.0062 0.0057
Regression equation(Y = a + bC)
Slope (b) 0.1979 0.1609 0.1726Intercept (a) 0.0163 0.0063 0.0133Correlation
coefficient (r2) 0.9997 0.999 0.9991Standard deviation
of slope (Sb) 1.4x10⁻³ 2.1 x10⁻³ 1.79 x10⁻³
Standard deviationof intercept (Sa) 5.87 x10⁻³ 8.3 x10⁻³ 9.56 x10⁻³
Detection limitLOD (μg/mL) 0.098 0.17 0.18
Quantification limitLOQ (μg/mL) 0.297 0.51 0.55

October - December 2010 144 Journal of Pharmacy and Chemistry • Vol.4 • Issue.4
Precision and AccuracyIn order to determine the accuracy and precision of
the proposed methods, solutions containing three differentconcentrations of APZ were prepared within linearity andanalyzed in six determinations. The analytical results ofprecision and accuracy are show in Table .2. The precisionof the proposed methods is fairly high, as indicated by thelow values of SD and %RSD, respectively.
Table 2Evaluation of precision and accuracy of proposed
methods
Proposed Concentrations(μμμμμg/mL) RSD R.E
method Taken Found*±SD (%) (%)
Method A 1 1.01±0.025 2.47 1.03 3.03±0.06 1.98 1.06 6.05±0.078 1.29 0.83
Method B 1 0.99±0.018 1.81 -1.03 3.02±0.048 1.59 0.676 6.03±0.078 1.60 0.5
Method C 1 1.01±0.018 1.78 1.03 3.04±0.062 2.04 1.337 6.98±0.078 1.12 -0.28
*Mean value of six determinations; SD. Standard deviation;RSD. Relative standard deviation ; RE. Relative error
Accuracy and recoveryThe accuracy and reliability of the methods were
ascertained through recovery experiments. To a fixed and
known amount of drug in the tablet powder, pure APZ wasadded at two different levels, and the total content wasfound by the proposed methods. The recoveries of the puredrug added to the tablet powder were shown in (Table.3).The results reveal that the proposed methods are not liableto interference by tablet fillers, excipients and additivesusually formulated with pharmaceutical preparations.
Analysis of pharmaceutical formulationsThe results (Table 4) indicate that the methods
developed compare well with the reference method [11]with respect to accuracy and precision.
ConclusionsThe methods proposed are fairly simple and do not
require any pretreatment of the drug and tedious extractionprocedure. The methods have been demonstrated to be freefrom rigid experimental conditions. The procedures arebased on well established and characterized redox andcomplex formation reactions and use cheaper and readilyavailable chemicals. The methods have wider linear rangewith good accuracy, precision and stability of the coloredspecies for < 12 h. Thus, the developed methods aresensitive, selective, offer advantages of reagent availability,stability, less time consumption and free from interferencesby common additives and excipients qualifying them forthe analysis of aripiprazole in pharmaceutical formulations.
AcknowledgementThe authors are highly thankful to Director, National
Institute of Technology, Warangal for providing financialsupport and research facilities. The authors wish toacknowledge, Inogent laboratories, Hyderabad, India, forproviding the gift sample of Aripiprazole.
Table 3Results of recovery experiments by standard addition method
Proposed methods (%)Recovery * ± SD
Proposed methods Formulation taken Pure drug added ARPIT-10 ARIP MT-10 ARPIZOL-10(μμμμμg/mL) (μμμμμg/mL)
Method A 3 1.5 99.6±1.83 102.9±1.77 99.22±1.363 3 101.67±1.9 102.16±1.05 99.6±0.86
Method B 3 1.5 101.06±0.35 100.91±2.1 98.48±1.843 3 100.67±1.42 99.84±0.77 100.17±0.57
Method C 4 2 100.81±2.6 98.91±1.4 99.2±1.824 4 100.52±1.93 101.07±2.03 99.07±1.57
*Mean value of three determinations

October - December 2010 145 Journal of Pharmacy and Chemistry • Vol.4 • Issue.4
Table 4Application of proposed methods to the determination of APZ in pharmaceutical formulations
Pharmaceutical Reference method Proposed methods (% Found* ± SD)preparations # (%Found* ± SD) Method A Method B Method C
ARPIT-10a 101.81±1.31 100.08±1.94 101.33±1.46 100.12±1.68t=1.81 t=0.599 t=1.93F=2.14 F=1.24 F=1.64
ARIP MT-10b 101.61±1.79 101.09±1.87 99.95±0.94 101.38±1.95t=0.49 t=1.41 t=0.12F=1.1 F=3.62 F=1.18
ARPIZOL-10c 99.73±1.18 98.79±1.75 100.3±0.65 100.14±1.5t=0.732 t=1.09 t=0.52F=2.2 F=3.29 F=1.61
# Marketed by: a. Crescent Pharma, India; b. Torrent Pharma, India; c. Sun Pharma, India. All aripiprazole tabletscontaining 10 mg per tablet*Mean value of six determinations. The theoretical values of t (2.57) and F (5.05) at confidence limit at 95% confidencelevel and five degrees of freedom (p=0.05)
References[1] Zuo XC, Wang F, Xu P, Zhu RH, Li HD. Chromatographia
2006; 64:387.[2] Masanori K, Yasuo M, Yukihiro H, Takahiko O. J
Chromatogr B 2005; 822: 294.[3] Hui-Ching H, Chin-Hung L, Tsuo-Hung L, Tsung-Ming Hu,
Hsien-Jane C, Yu-Chun Wu, Ying Lung T. J Chromatogr B2007; 856: 57.
[4] Yoshihiko S, Hitoshi A, Eiji K, Toshihisa K, Gohachiro M.J Chromatogr B 2005; 821: 8.
[5] Vijaya Kumar M, Muley PR. Indian Pharmacist 2005; 4:71.
[6] Krischbaum KM, Muller MJ, Zernig G. Clin Chem 2005;51:1718.
[7] Krichherr H, Kuhn-Velten WN. J Chromatogr B AnalTechnol Biomed Life Sci 2006; 843: 100.
[8] Srinivas KSV, Buchireddy R, Madhusudhan G, Mukkanti K,Srinivasulu P. Chromatographia 2008; 68: 635.
[9] Ravindra N, Singhvi I. Int J Chem Sci 2006; 4: 347.[10] Nandini, Sachdav Y. The Indian Pharmacist 2009: 8: 69.[11] Kalaichelvi R, Thangabalan B, Srinivasa rao D, Jayachandran
E. E-J.Chem 2009; 6: S87.[12] Rahman N, Singh M, Nasrul Hoda Md. IL Farmaco 2004;
59: 913.[13] Syeda A, Mahesh HRK, Ahmed Syed A. IL Farmaco 2005;
60: 47.[14] Guo L, Zhang Y, Li Q. Spectrochim Acta Part A 2009; 74:
307.[15] ICH Harmonized Tripartite Guideline, Q2 (R1), Current
Step 4 Version, Parent Guidelines on Methodology DatedNovember 6, 1996, Incorporated in November, 2005.

October - December 2010 146 Journal of Pharmacy and Chemistry • Vol.4 • Issue.4
GENERAL REQUIREMENTS: Journal of Pharmacy andChemistry (ISSN 0973-9874) is a quarterly Journal, Indexingin CAS(Coden:JPCOCM) which publishes original researchwork that contributes significantly to further the scientificknowledge in Pharmaceutical Sciences (PharmaceuticalTechnology, Pharmaceutics, Biopharmaceutics,Pharmacokinetics, Pharmaceutical Chemistry, ComputationalChemistry and Molecular Drug Design, Pharmacognosy andPhytochemistry, Pharmacology, Pharmaceutical Analysis,Pharmacy Practice, Clinical and Hospital Pharmacy, CellBiology, Genomics and Proteomics, Pharmacogenomics, StemCell Research, Vaccines & Cera, Bioinformatics andBiotechnology of Pharmaceutical Interest) and in ChemicalSciences (Inorganic, Soil, Forensic, Analytical, Nano,Environmental, Polymer, Physical, Agricultural, Medicinal,Biochemistry, Organic, Computational, Food, Pesticides etc).Manuscripts are accepted for consideration by Journal ofPharmacy and Chemistry on the condition that they representoriginal material, have not been published previously, are notbeing considered for publication elsewhere, and have beenapproved by each author. Review articles, research papers,short communication and letters to the editor may be submittedfor publication.
SUBMISSION OF MANUSCRIPTS: Typewrittenmanuscripts prepared using MS Word should be submitted intriplicate and RW-CD to Prof. Dr. K.N Jayaveera, Editor-in-Chief of Journal of Pharmacy and Chemistry , Plot No 22,Vidyut Nagar, Ananthapur- 515 001, Andhra Pradesh, India.e-mail: [email protected]
All components of the manuscript must appear within a singleelectronic file: references, figure legends and tables mustappear in the body of the manuscript.
TYPING INSTRUCTION: The following detailedinstructions are necessary to allow direct reproduction of themanuscript for rapid publishing. If instructions are not followed,the manuscript will be returned for retyping. The followingtypefaces, in 12 points size, are preferred: Times Roman.
GENERAL FORMAT: The typing area must be exactly 6 5/8” (168 mm) wide by 9 7/8” (250 mm) long. Justify marginsleft and right (block format). The entire typing area of eachpage must be filled, leaving no wasted space. Text should bedouble-spaced, special care should be taken to insure thatsymbols, superscripts and subscripts are legible and do notoverlap onto lines above or below. Make sure text lines areequidistant.
TITLE: On the first page of the manuscript, start title 1” (25mm) down from top text margin. Type title in all capitalletters, centred on the width of the typing area and single-spaced if more than one line is required. The title should bebrief, descriptive and have all words spelled out. Double-space, then type the author(s) name(s), single-spaced if morethan one line is required. Double-space, than type author(s)
INSTRUCTION TO AUTHORSaddress(es), single-spaced, capitalizing first letters of mainwords. Quadruple-space before Abstract.
ABSTRACT: Centre, type and underline abstract heading,capitalizing the first letter. A double-space should separate theheading from the abstract text. Indent abstract textapproximately 1/2” (13 mm) from both left and right margins.The abstract should be intelligible to the reader withoutreference to the body of the paper and be suitable forreproduction by abstracting services. Introduction to the text(without a heading) should being four spaces below theabstract using full margins.
KEY WORDS: Three or more key words must be providedby authors for indexing of their article. Key words will belisted directly below the Abstract. Abbreviated forms ofchemical compounds are not acceptable. Spell out entirely,using the official nomenclature. Example: L-dihydroxyphenylalanine (L-DOPA)
MAJOR HEADINGS: Papers must include the majorheadings: Introduction, Methods, Results, Discussion,Acknowledgments and References. Capitalize first letter,underline, and centre headings on width of typing area.
TABLES/FIGURES: Incorporate tables and/or figures (B &W) with their legends into the main body of text.
REFERENCES: Referneces should be referred to a number[1] in the text and be listed according to this numbering at theend of the paper. Only papers and books that have beenpublished or in press may be cited; unpublished manuscriptsor manuscripts submitted to a journal but which have not beenaccepted may not be cited.
The references shoulld comprise the following informationand in the given order and with given punctuation as given inthe example below: Author name (s), Initials (s), PublicationTitle, Page Number, Year of Publication.
Standard Journal Article:[1] Bhattacharyya D, Pandit S, Mukherjee R, Das N, Sur
TK. Indian J Physiol Pharmacol 2003; 47:435.[2] Skottova N, Krecman V. Physiol Res 1998; 47:1.
Book:[1] Ghosh MN. Fundamentals of Experimental Pharmacology,
2nd ed. Calcutta Scientific Book Agency, 1984:154.
Proofs will be sent to the corresponding author. These shouldbe returned as quickly as possible.
The facts and view in the article will be of the authors andthey will be totally responsible for authenticity, validityand originality etc. the authors should give an undertakingwhile submitting the paper that the manuscripts submittedto journal have not been published and have not beensimultaneously submitted or published elsewhere andmanuscripts are their original work.Annual Subscription: Rs.800/-.
www.stfindia.comThis Quarterly Journal is Printed, Published, Owned and Edited by Dr. K.N. Jayaveera, Published from Science-Tech Foundation,Plot No.22, Door No. 12/3/925, Vidyut Nagar, Anantapur - 515 001. Phone:+91-8554 274677, Mobile: +91-94414 89324 • www.stfindia.comand Printed at Vipla Computer Services (Designers & Multi Colour Offset Printers) 1-8-725A/1/A, Balaji Bhagyanagar Apts., Nallakunta,Hyderabad - 500 044. Ph. 040-27676910, 27677078, 27654003.