Embed Size (px)
Citation preview

AUTOMOTIVE NOISEVariability of automotive interior noise from engine sources E. Hills, N. S. Ferguson and
B. R. Mace
DAMPING ON SHIPSMeasurement of spray-on damping effectiveness and application to bow thruster noise on ships Jesse Spence
WIND TURBINESLow frequency noise and infrasound from wind turbines Robert D. O’Neal,
Robert D. Hellweg,Jr. andRichard M. Lampeter
TUBE RESONATORSExperimental validation of the 1-D acoustical model for conical concentric tube resonators withmoving medium
P. Chaitanya and M. L. Munjal
TRANSMISSION LOSSESInterference effects in field measurements of airborne sound insulation of building facades Umberto Berardi, Ettore Cirillo
and Francesco Martellotta
HVAC SYSTEMSAero-acoustic predictions of industrial dashboard HVAC systems Stéphane Détry, Julien Manera,
Yves Detandt and Diego d’Udekem
OPEN-PLAN OFFICESOpen-plan office noise levels, annoyance and countermeasures in Egypt Sayed Abas Ali
JET TEST STANDReduction of engine exhaust noise in a jet engine test cell Wei Hua Ho, Jordan Gilmore and
Mark Jermy
TRAFFIC NOISEDynamic traffic noise simulation at a signalized intersection among buildings F. Li, M. Cai, J. K. Liu and Z. Yu
BOOK REVIEWSpeech Dereverberation Patrick A. Naylor and
Nikolay D. GaubitchSeismic Design of Buildings to Eurocode 8 Ahmed Y. ElghazouliAuditorium Acoustics and Architectural Design, 2nd Edition Michael BarronTechnology for a Quieter America The National Academy of Engineering
Volume 59, Number 2 March-April 2011
ISSN 0736-2501
Noise Control Engineering Journal - An International Publication -
Published by the Institute of Noise Control Engineering of the USA

Low frequency noise and infrasound from wind turbinesRobert D. O’Neala), Robert D. Hellweg Jr.b) and Richard M. Lampeterb)
(Received: 5 October 2010; Revised: 7 January 2011; Accepted: 8 January 2011)
A common issue raised with wind energy developers and operators of utility-scale wind turbines is whether the operation of their wind turbines may createunacceptable levels of low frequency noise and infrasound. In order to answerthis question, one of the major wind energy developers commissioned a scientificstudy of their wind turbine fleet. The study consisted of three parts: 1) a world-wide literature search to determine unbiased guidelines and standards used toevaluate low frequency sound and infrasound, 2) a field study to measure windturbine noise outside and within nearby residences, and 3) a comparison of thefield results to the guidelines and standards. Wind turbines from two differentmanufacturers were measured at an operating wind farm under controlledconditions with the results compared to established guidelines and standards.This paper presents the results of the low frequency noise and infrasound study.Since the purpose of this paper is to report on low frequency and infrasoundemissions, potential annoyance from other aspects of wind turbine operationwere not considered, and must be evaluated separately. © 2011 Institute of NoiseControl Engineering.
Primary subject classification: 14.5.4; Secondary subject classification: 21.8.1
1 INTRODUCTION
Early down-wind wind turbines in the US createdlow frequency noise; however current up-wind windturbines generate considerably less low frequencynoise. Epsilon Associates, Inc. (“Epsilon”) wasretained by NextEra Energy Resources, LLC(“NextEra”), formerly FPL Energy, to investigatewhether the operation of their wind turbines may createunacceptable levels of low frequency noise and infra-sound. This question has often been posed to NextEra,and other wind energy developers and operators ofutility-scale wind turbines. NextEra is one of theworld’s largest generators of wind power with approxi-mately 7,600 net megawatts (MW) in operation as ofJuly 2010.
The project was divided into three tasks: 1) literaturesearch, 2) field measurement program, and 3) compari-son to criteria. Epsilon conducted an extensive litera-ture search of the technical and scientific literature onthe effects of low-frequency noise and infrasound andexisting criteria in order to evaluate low-frequencynoise and infrasound from wind turbines. After
a) Epsilon Associates, Inc., 3 Clock Tower Place, Suite 250,Maynard MA 01754; email: [email protected].
b) Epsilon Associates, Inc., 3 Clock Tower Place, Suite 250,Maynard MA 01754.
Noise Control Eng. J. 59 (2), March-April 2011
completion of the literature search and selection ofcriteria, a field measurement program was developed tomeasure wind turbine noise to compare to the selectedcriteria.
The frequency range 20–20,000 Hz is commonlydescribed as the range of “audible” noise. The frequencyrange of low frequency sound is generally from20 Hertz (Hz) to 200 Hz, and the range below 20 Hz isoften described as “infrasound”. However, audibilityextends to frequencies below 20 Hz.
Low frequency sound has several definitions. Ameri-can National Standards ANSI/ASA S12.21 and ANSIS12.9 Part 42 have provisions for evaluating lowfrequency noise, and these special treatments applyonly to sounds in the octave bands with 16, 31.5, and63-Hz mid-band frequencies. For these reasons, in thispaper on wind turbine noise, we use the term “lowfrequency noise” to include 12.5 Hz–200 Hz withemphasis on the 16 Hz, 31 Hz and 63 Hz octave bandswith a frequency range of 11 Hz to 89 Hz.
International Electrotechnical Commission (IEC)standard 60050-801:19943 defines “infrasound” as“Acoustic oscillations whose frequency is below thelow frequency limit of audible sound (about 16 Hz).”This definition is incorrect since sound remains audibleat frequencies well below 16 Hz provided that the soundlevel is sufficiently high. In this paper we define infra-sound to be below 20 Hz, which is the limit for thestandardized threshold of hearing. Since there is no sharp
135
change in hearing at 20 Hz, the division into“low-frequency sound” and “infrasound” should only beconsidered “practical and conventional.”
2 EFFECTS AND CRITERIA OF LOWFREQUENCY SOUND ANDINFRASOUND
We performed an extensive world-wide literaturesearch of over 100 scientific papers, technical reportsand summary reports on low frequency sound andinfrasound—hearing, effects, measurement, and crite-ria. Leventhall4 presents an excellent and comprehen-sive study on low frequency noise from all sources andits effects. The Leventhall report also presents criteriain place at that time, which does not include some ofthe more recently developed ANSI/ASA standards onoutdoor environmental noise and indoor sounds.
The United States government does not have specificcriteria for low frequency noise. The US EnvironmentalProtection Agency (EPA) has guidelines for the protec-tion of public health with an adequate margin of safetyin terms of annual average A-weighted day-nightaverage sound level (Ldn), but there are no correctionsor adjustments for low frequency noise. The USDepartment of Transportation (DOT) has A-weightedsound pressure level criteria for highway projects andairports, but these do not have adjustments for lowfrequency noise. The following sections describe thelow frequency and infrasound criteria to which windturbine sounds are compared in later sections.
2.1 Threshold of Hearing and Audibility
Moeller and Pedersen5 present an excellentsummary on human perception of sound at frequenciesbelow 200 Hz. The ear is the primary organ for sensinginfrasound. Hearing becomes gradually less sensitive for
0
20
40
60
80
100
120
4 5 6.3 8 10 12.5 16One-Third Octave
SoundPressureLevel,dB
Fig. 1—Low frequency average threshold of hearin
G- · □ .l,:i -----. ·EJ.
--□. ·n.
136 Noise Control Eng. J. 59 (2), March-April 2011
decreasing frequencies. But, humans with a normalhearing organ can perceive infrasound at least down to afew hertz if the sound level is sufficiently high.
The threshold of hearing is standardized for frequen-cies down to 20 Hz6. Based on extensive research anddata, Moeller and Pedersen propose normal hearingthresholds for frequencies below 20 Hz; however, theirproposed threshold is higher than that obtained byWatanabe and Moeller7. To be conservative, we have usedthe data from Watanabe and Moeller7 for the region below20 Hz. (See Fig. 1.) Moeller and Pedersen5 suggest thatthe curve for low frequency thresholds for normal hearingis “probably correct within a few decibels, at least in mostof the frequency range.”
The hearing thresholds show considerable variabil-ity from individual to individual with a standard devia-tion among subjects of about 5 dB independent offrequency between 3 Hz and 1000 Hz with a slightincrease at 20–50 Hz. This implies that the audibilitythreshold for 97.5% of the population is greater than thevalues in Fig. 1 minus 10 dB and for 84% of the popula-tion is greater than the values in Fig. 1 minus 5 dB.Moeller and Pedersen suggest that the “pure-tone thresh-old can with a reasonable approximation be used as aguideline for the thresholds also for [low frequency]non-sinusoidal sounds”5; ISO 226 has thresholds forfrequencies at and above 20 Hz and approximatelyequates the thresholds and equal loudness contours fornon-sinusoidal sounds to those in the standard forsinusoidal sounds6.
As frequency decreases below 20 Hz, if the noisesource is tonal, the tonal sensation ceases. Below 20 Hztones are perceived as discontinuous. Below 10 Hz it ispossible to perceive the single cycles of a tone, and theperception changes into a sensation of pressure at the ears.
5 31.5 40 50 63 80 100 125 160d Center Frequency, Hz
ISO 226: AverageWatanabe and Moeller: Average
m ISO 2266 and Watanabe and Moeller7.
l
20 2Ban
g fro
Below 100 Hz, the dynamic range of the auditorysystem decreases with decreasing frequency, and thecompressed dynamic range has an effect on equalloudness contours: a slight change in sound level canchange the perceived loudness from barely audible toloud. This combined with the large variation in individualhearing may mean that a low frequency sound that isinaudible to some may be audible to others, and may berelatively loud to some of those for whom it is audible.Loudness for low frequency sounds grows considerablyfaster above threshold than for sounds at higherfrequencies5.
Non-auditory perception of low frequency and infra-sound occurs only at levels above the auditory thresh-old. In the frequency range of 4–25 Hz and at “levels20–25 dB above [auditory] threshold it is possible to feelvibrations in various parts of the body, e.g., the lumbar,buttock, thigh and calf regions. A feeling of pressuremay occur in the upper part of the chest and the throatregion” [emphasis added]5.
2.2 ANSI S12.9-Parts 4 and 5—EvaluatingOutdoor Environmental Sound
American National Standard ANSI/ASA S12.9-2007/Part 58 has an informative annex which providesguidance for designation of land uses compatible withexisting or predicted annual average adjusted day-nightaverage outdoor sound level (DNL). Ranges of theDNL are outlined, within which a specific region ofcompatibility may be drawn. These ranges take intoconsideration the noise reduction in sound level fromoutside to inside buildings as commonly constructed inthat locality and living habits there. There are adjust-ments to day-night average sound level to account forthe presence of low frequency noise, and the adjust-ments are described in ANSI S12.9 Part 4, which use asum of the sound pressure levels in octave bands withcenter frequencies of 16, 31 and 63 Hz.
ANSI S12.9/Part 4 identifies two thresholds: annoy-ance is minimal when the 16, 31.5 and 63 Hz octaveband sound pressure levels are each less than 65 dB andthere are no rapid fluctuations of the low frequencysounds. The second threshold is for increased annoyancewhich begins when rattles occur, which begins at LLF
70–75 dB. LLF is 10 times the logarithm of the ratio oftime-mean square sound pressure in the 16, 31.5, and63-Hz octave bands divided by the square of the referencesound pressure.
The adjustment procedure for low frequency noiseto the average annual A-weighted sound pressure levelin ANSI S12.9/Part 4 uses a different and more compli-cated metric and procedure (Equation D.1) than thoseused for evaluating low frequency noise in roomscontained in ANSI/ASA S12.2. (See Sec. 2.3). Since
Noise Control Eng. J. 59 (2), March-April 2011
we are evaluating low frequency noise and notA-weighted sound levels, we do not recommend usingthe procedure for adjusting A-weighted levels. Insteadwe recommend using the following two guidelinesfrom ANSI S12.9/Part 4: a sound pressure level of65 dB in each of the 16-, 31.5-, and 63 Hz octave bandsas an indicator of minimal annoyance, and 70–75 dB forthe summation of the sound pressure levels from thesethree bands as an indicator of possible increased annoy-ance from rattles.
2.3 ANSI/ASA S12.2—Evaluating RoomNoise
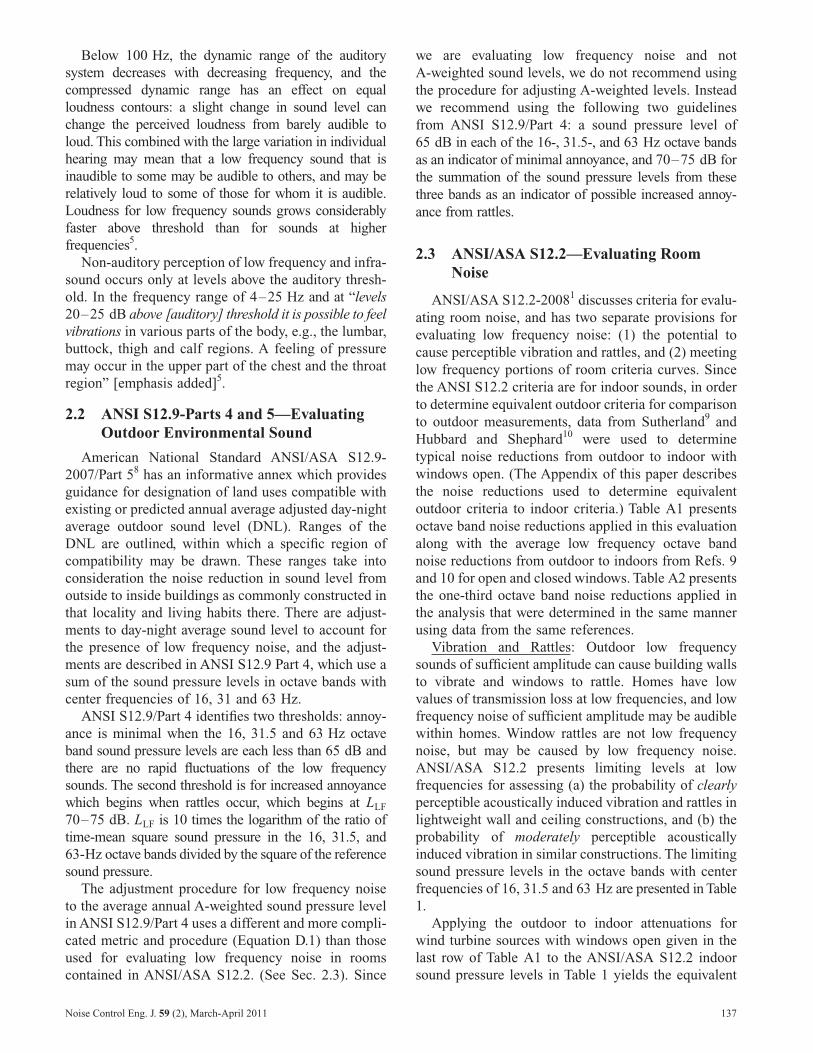
ANSI/ASA S12.2-20081 discusses criteria for evalu-ating room noise, and has two separate provisions forevaluating low frequency noise: (1) the potential tocause perceptible vibration and rattles, and (2) meetinglow frequency portions of room criteria curves. Sincethe ANSI S12.2 criteria are for indoor sounds, in orderto determine equivalent outdoor criteria for comparisonto outdoor measurements, data from Sutherland9 andHubbard and Shephard10 were used to determinetypical noise reductions from outdoor to indoor withwindows open. (The Appendix of this paper describesthe noise reductions used to determine equivalentoutdoor criteria to indoor criteria.) Table A1 presentsoctave band noise reductions applied in this evaluationalong with the average low frequency octave bandnoise reductions from outdoor to indoors from Refs. 9and 10 for open and closed windows. Table A2 presentsthe one-third octave band noise reductions applied inthe analysis that were determined in the same mannerusing data from the same references.
Vibration and Rattles: Outdoor low frequencysounds of sufficient amplitude can cause building wallsto vibrate and windows to rattle. Homes have lowvalues of transmission loss at low frequencies, and lowfrequency noise of sufficient amplitude may be audiblewithin homes. Window rattles are not low frequencynoise, but may be caused by low frequency noise.ANSI/ASA S12.2 presents limiting levels at lowfrequencies for assessing (a) the probability of clearlyperceptible acoustically induced vibration and rattles inlightweight wall and ceiling constructions, and (b) theprobability of moderately perceptible acousticallyinduced vibration in similar constructions. The limitingsound pressure levels in the octave bands with centerfrequencies of 16, 31.5 and 63 Hz are presented in Table1.
Applying the outdoor to indoor attenuations forwind turbine sources with windows open given in thelast row of Table A1 to the ANSI/ASA S12.2 indoorsound pressure levels in Table 1 yields the equivalent
137
ia fro
outdoor sound pressure levels that are consistent withthe indoor criteria and are presented in Table 2.
Room Criteria Curves: ANSI/ASA S12.2 has threeprimary methods for evaluating the suitability of noisewithin rooms: a survey method—A-weighted soundlevels, an engineering method—noise criteria (NC)curves, and a method for evaluating low-frequencyfluctuating noise using room noise criteria (RNC)curves. ANSI/ASA S12.2 states “The RNC method
Table A1—Average low frequency octave band homRef. 9 and 10).
Noise SourceWindowcondition 16
Average aircraftand trafficsources
Closed windows
Average aircraftand trafficsources
Open windows �1
Average WindTurbine
Closed windows
Average WindTurbine
Open windows �3
* No data are available for windows open below 63 Hz osubtracting the difference between the levels for 63 Hz clos+ Used in this paper to determine equivalent outdoor criter
Table A2—Average low frequency one-third octaveindoors.
Condition
One-Third
10 12.5 16 20 25Open Window* 2 2 3 4 4.5Average ClosedWindow withwind turbines10
**
8 7 8 8 8
* Used to determine equivalent outdoor levels as shown in** Used to determine equivalent outdoor levels as shown i
Table 1—ANSI/ASA S12.2 measuredceptible vibration and rstructures.1
ConditionClearly perceptible vibration and rattles likModerately perceptible vibration and rattleslikely
138 Noise Control Eng. J. 59 (2), March-April 2011
should be used to determine noise ratings when thenoise from HVAC systems at low frequencies is loudand is suspected of containing sizeable fluctuations orsurging.” [emphasis added] The NC curves are appro-priate to evaluate low frequency noise from windturbines in homes since wind turbine noise does nothave significant fluctuating low frequency noise suffi-cient to warrant using RNC curves and sinceA-weighted sound levels do not adequately determine
ise reductions from outdoor to indoors in dB (from
Octave Band Center Frequency
31.5 Hz 63 Hz 125 Hz15 18 20
�10�* 12 11
11 14 18
�6�*+ 9+ 9+
band. The values for 16 Hz and 31 Hz were obtained byd open conditions to the 16 and 31 Hz closed values.m indoor criteria in Tables 2 and 4
d noise reduction in dB for homes from outdoor to
ve Band Center Frequency, Hz
5 40 50 63 80 100 125 1607 8 9 9 9 9 913 14 15 12 18 18 18
e 7.le 9.
rior sound pressure levels for per-in lightweight wall and ceiling
Octave-band center frequency (Hz)
16 31.5 6375 dB 75 dB 80 dB65 dB 65 dB 70 dB
e no
Hz16
1�*
8
�*+
ctaveed an
ban
Octa
31.511
Tabln Tab
inteattle
ely

if there are low frequency problems. [ANSI/ASAS12.2, Sec. 5.3 gives procedures for determining ifthere are large fluctuations of low frequency noise.]
Annex C.2 of ANSI/ASA S12.2 contains recom-mended room criteria curves for bedrooms, which arethe rooms in homes with the most stringent criteria: NCand RNC criteria curve between 25 and 30. The recom-mended NC and RNC criteria for schools and privaterooms in hospitals are the same. The values of thesound pressure levels in the 16–125 Hz octave bandsfor NC curves 25 and 30 are shown in Table 3. Applyingthe outdoor to indoor attenuations for wind turbinesources with windows open given in the last row of TableA1 to the ANSI/ASA S12.2 indoor sound pressure levelsfor NC-25 and NC-30 in Table 3 yields the equivalentoutdoor sound pressure levels that are consistent with theindoor criteria and are presented in Table 4.
ANSI/ASA S12.2 also presents a method to deter-mine if the levels below 500 Hz octave band are too highin relation to the levels in the mid-frequencies whichcould create a condition of “spectrum imbalance”. Themethod for this evaluation is:
• Calculate the speech interference level (SIL)for the measured spectrum. [SIL is the arith-metic average of the sound pressure levels inthe 500, 1000, 2000 and 4000 Hz octave bands.]Select the NC curve equal to the SIL value with asymbol NC(SIL).
• Plot the measured spectra and the NC curveequal to the SIL value on the same graph and
Table 2—Equivalent outdoor soundindoor sound pressure levelightweight wall and ceilin
ConditionClearly perceptible vibration and rattles likModerately perceptible vibration and rattleslikely
Table 3—ANSI/ASA S12.2 low frequency octaveband sound pressure levels for noise cri-teria curves NC-25 and NC-30. [Table 1from Ref. 1].
NC Criteria
Octave-band-center frequency, Hz
16 31.5 63 125NC-25 80 65 54 44NC-30 81 68 57 48
Noise Control Eng. J. 59 (2), March-April 2011
determine the differences between the twocurves in the octave bands below 500 Hz.
• Estimate the likelihood that the excess low-frequency levels will annoy occupants of thespace using Table 5.
2.4 Other Criteria
2.4.1 World Health Organization (WHO)
No specific low frequency noise criteria areproposed by the WHO. The Guidelines for CommunityNoise report11 mentions that if the difference between
ssure levels to the ANSI/ASA S12.2r perceptible vibration and rattle inuctures for wind turbines.
Octave-band center frequency (Hz)
16 31.5 6378 dB 81 dB 89 dB68 dB 71 dB 79 dB
Table 4—Equivalent outdoor sound pressure levelsto the ANSI/ASA S12.2 low frequency oc-tave band sound pressure levels for noisecriteria curves NC-25 and NC-30. [Table1 from Ref. 1].
NC Criteria
Octave-band-center frequency, Hz
16 31.5 63 125NC-25
equivalentoutdoor
83 71 63 53
NC-30equivalent
outdoor
84 74 66 57
Table 5—Measured sound pressure level deviationsfrom an NC (SIL) curve that may lead toserious complaints1.
Octave-bandfrequency,
Hz=�
Measured Spectrum—NC(SIL),dB
31.5 63 125 250Possible seriousdissatisfaction
* 6–9 6–9 6–9
Likely seriousdissatisfaction
* �9 �9 �9
* Insufficient data available to evaluate
prels fog str
ely
139

the C-weighted sound level and A-weighted sound levelis greater than 10 decibels, then a frequency analysisshould be performed to determine if there is a lowfrequency issue. A document prepared for the WorldHealth Organization states that “there is no reliableevidence that infrasounds below the hearing thresholdproduce physiological or psychological effects. Infra-sounds slightly above detection threshold may causeperceptual effects but these are of the same character asfor ‘normal’ sounds. Reactions caused by extremelyintense levels of infrasound can resemble those of mildstress reaction and may include bizarre auditory sensa-tions, describable as pulsation and flutter”12.
2.4.2 The UK Department for Environment,Food, and Rural Affairs (DEFRA)
The report prepared by the University of Salford forthe UK Department for Environment, Food, and RuralAffairs (DEFRA) on low frequency noise proposedone-third octave band sound pressure level Leq criteriaand procedures for assessing low frequency noise13. Theguidelines are based on complaints of disturbance fromlow frequency sounds and are intended to be used byEnvironmental Health Officers.
Existing low frequency noise criteria from severalcountries were reviewed and experiences with lowfrequencies complaints were considered in developingthe proposed guidelines. The criteria are “based on
Table 6—DEFRA proposed criteria13 for the assesone-third sound pressure levels for non-stea
Location
One-Third
10 12.5 16 20 25Non-SteadyLeq, dB
92 87 83 74 64
Steady Leq, dB 97 92 88 79 69
Table 7—Equivalent outdoor Leq one-third sound prFRA indoor criteria13 for the assessment of
Location
One-Third
10 12.5 16 20 25Non-SteadyEquivalentoutdoor *
Leq, dB
94 89 86 78 68.5
SteadyEquivalentOutdoor* Leq,
99 94 91 83 73.5
* With windows open
140 Noise Control Eng. J. 59 (2), March-April 2011
5 dB below the ISO 226 average threshold of audibilityfor steady [low frequency] sounds.” However, the DEFRAcriteria are at 5 dB lower than ISO 226 only at20–31.5 Hz; at higher frequencies the criteria are equalto the Swedish criteria which are higher levels than ISO226 less 5 dB. For frequencies lower than 20 Hz, DEFRAuses the thresholds from Ref. 7 less 5 dB.
The DEFRA criteria are based on measurements inan unoccupied room, and it was noted by a practicingconsultant that measurements should be made withwindows closed14. However, we conservatively usedwindows open conditions for our assessment to deter-mine equivalent outdoor criteria since the DEFRAmeasurement procedure does not explicitly statemeasurements are with windows closed. If the lowfrequency sound is “steady” then the criteria may berelaxed by 5 dB. A low frequency noise is consideredsteady if either L10–L90�5 dB or the rate of change ofsound pressure level (Fast time weighting) is less than10 dB per second in the third octave band which exceedsthe criteria by the greatest margin.
Applying indoor to outdoor one-third octave bandtransfer functions for open windows (as presented inTable A2 from analysis of data in Refs. 9 and 10) yieldsequivalent one-third octave band sound pressure levelproposed DEFRA criteria for outdoor sound levels.Table 6 presents the indoor DEFRA proposed criteriafor non-steady and steady low-frequency sounds. Table
nt of low frequency noise disturbance: Indoor Leqnd steady low frequency sounds.
ve Band Center Frequency, Hz
40 50 63 80 100 125 16049 43 42 40 38 36 34
54 48 47 45 43 41 39
e levels for non-steady and steady sounds to the DE-frequency noise disturbance.
e Band Center Frequency, Hz
40 50 63 80 100 125 16056 51 51 49 47 45 43
61 56 56 54 52 50 48
smedy a
Octa
31.556
61
essurlow
Octav
31.561
66
first s
7 presents the DEFRA equivalent outdoor criteria fornon-steady and steady low frequency sounds.
2.4.3 Japan Ministry of Environment
The Japan Ministry of Environment has published ahandbook to deal with low frequency noise problemsand has established reference values for guidance indealing with complaints of rattling windows and doorsand complaints of “mental and physical discomfort”15.It was noted that traditional Japanese houses haverelatively light-weight and sensitive windows andpartitions16.
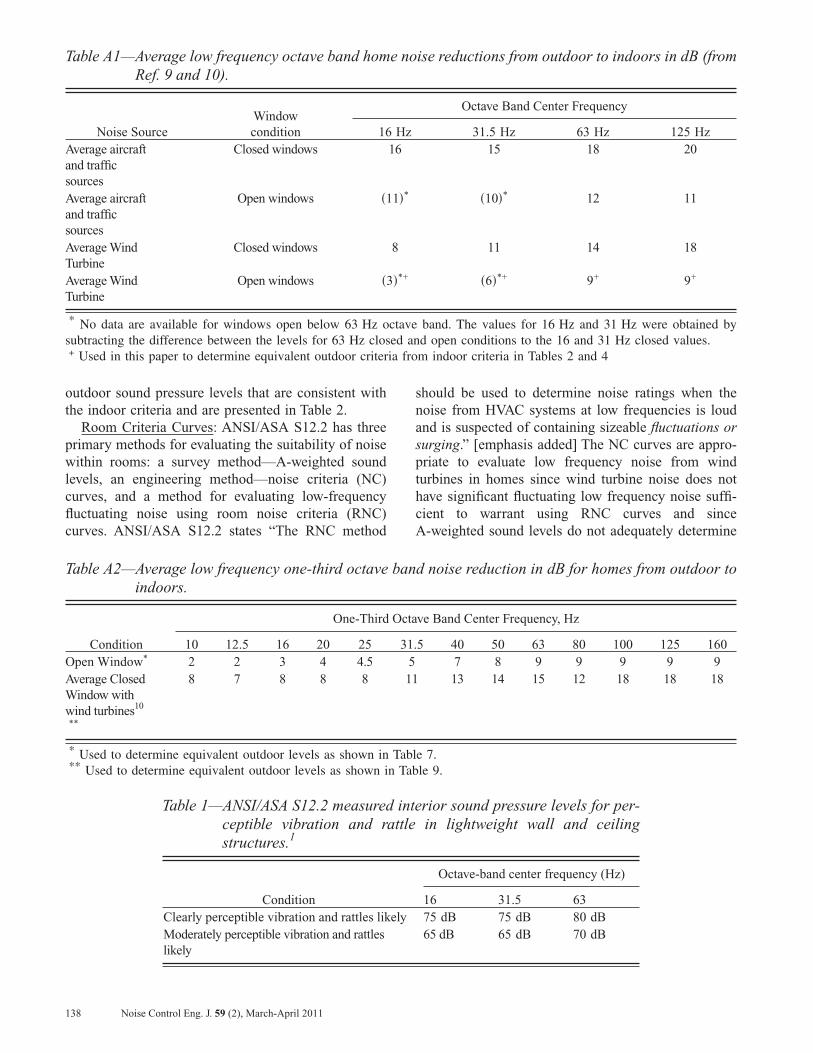
Table 8 presents the Japanese reference outdoorone-third octave band sound pressure level values forguidance in dealing with complaints of rattling fromenvironmental sounds from 5 Hz to 50 Hz. From10 Hz to 50 Hz the guidance levels are equal to theobserved threshold of rattles from two studies with a totalof 78 samples. However, for the bands centered at 5, 6.3and 8 Hz, the reference values are several dB lower thanthe supporting data contained in these two studies15. At5 Hz, the lowest observed window rattle was at 74 dB inone study and 79 dB in another; at 6.3 Hz, rattles startedat 74 dB in the first study and at 78 dB in the second; andat 8 Hz, window rattle started at 74 dB in the first studyand 77 dB in the second study. Thus the reference valuesat 5, 6.3 and 8 Hz in Table 8 are conservative in compari-son to the other values by 4, 3, and 2 dB respectively.
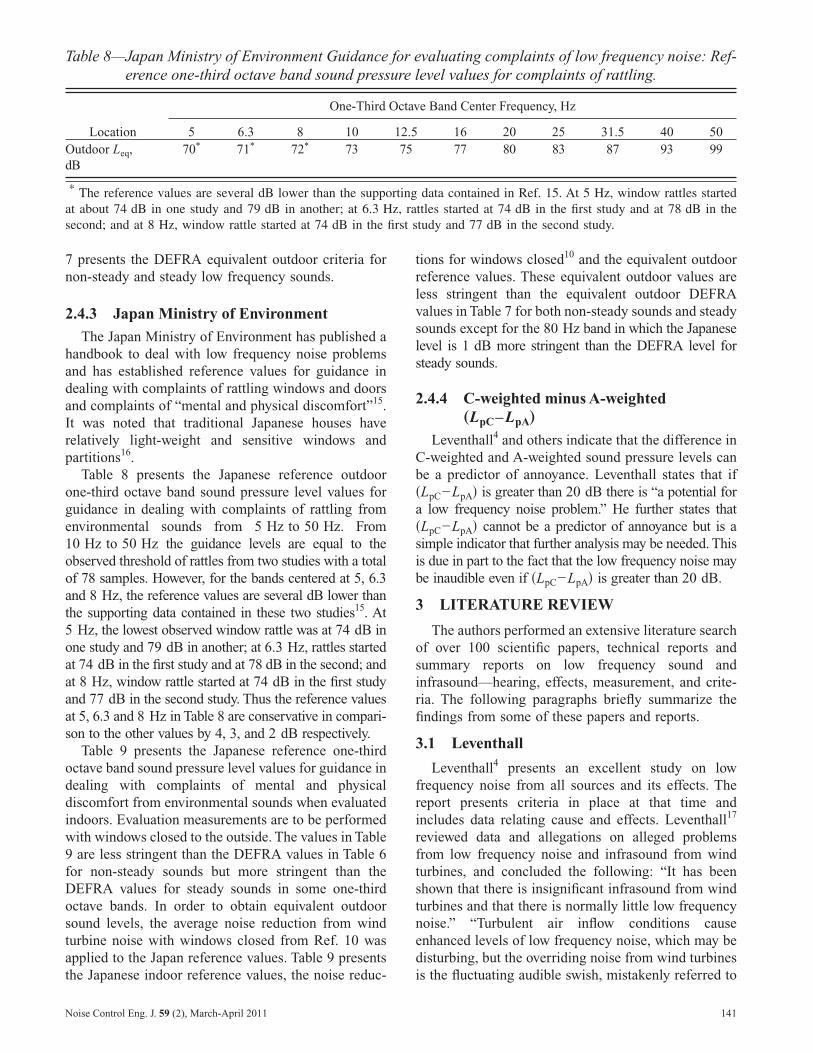
Table 9 presents the Japanese reference one-thirdoctave band sound pressure level values for guidance indealing with complaints of mental and physicaldiscomfort from environmental sounds when evaluatedindoors. Evaluation measurements are to be performedwith windows closed to the outside. The values in Table9 are less stringent than the DEFRA values in Table 6for non-steady sounds but more stringent than theDEFRA values for steady sounds in some one-thirdoctave bands. In order to obtain equivalent outdoorsound levels, the average noise reduction from windturbine noise with windows closed from Ref. 10 wasapplied to the Japan reference values. Table 9 presentsthe Japanese indoor reference values, the noise reduc-
Table 8—Japan Ministry of Environment Guidanceerence one-third octave band sound press
Location
One-Third
5 6.3 8 10Outdoor Leq,dB
70* 71* 72* 73
* The reference values are several dB lower than the suppoat about 74 dB in one study and 79 dB in another; at 6.3 Hsecond; and at 8 Hz, window rattle started at 74 dB in the
Noise Control Eng. J. 59 (2), March-April 2011
tions for windows closed10 and the equivalent outdoorreference values. These equivalent outdoor values areless stringent than the equivalent outdoor DEFRAvalues in Table 7 for both non-steady sounds and steadysounds except for the 80 Hz band in which the Japaneselevel is 1 dB more stringent than the DEFRA level forsteady sounds.
2.4.4 C-weighted minus A-weighted„LpC–LpA…
Leventhall4 and others indicate that the difference inC-weighted and A-weighted sound pressure levels canbe a predictor of annoyance. Leventhall states that if�LpC−LpA� is greater than 20 dB there is “a potential fora low frequency noise problem.” He further states that�LpC−LpA� cannot be a predictor of annoyance but is asimple indicator that further analysis may be needed. Thisis due in part to the fact that the low frequency noise maybe inaudible even if �LpC−LpA� is greater than 20 dB.
3 LITERATURE REVIEW
The authors performed an extensive literature searchof over 100 scientific papers, technical reports andsummary reports on low frequency sound andinfrasound—hearing, effects, measurement, and crite-ria. The following paragraphs briefly summarize thefindings from some of these papers and reports.
3.1 Leventhall
Leventhall4 presents an excellent study on lowfrequency noise from all sources and its effects. Thereport presents criteria in place at that time andincludes data relating cause and effects. Leventhall17
reviewed data and allegations on alleged problemsfrom low frequency noise and infrasound from windturbines, and concluded the following: “It has beenshown that there is insignificant infrasound from windturbines and that there is normally little low frequencynoise.” “Turbulent air inflow conditions causeenhanced levels of low frequency noise, which may bedisturbing, but the overriding noise from wind turbinesis the fluctuating audible swish, mistakenly referred to
valuating complaints of low frequency noise: Ref-level values for complaints of rattling.
e Band Center Frequency, Hz
16 20 25 31.5 40 5077 80 83 87 93 99
data contained in Ref. 15. At 5 Hz, window rattles startedttles started at 74 dB in the first study and at 78 dB in thetudy and 77 dB in the second study.
for eure
Octav
12.575
rtingz, ra
141
as “infrasound” or “low frequency noise”. “Infrasoundfrom wind turbines is below the audible threshold andof no consequence”. Other studies have shown thatwind turbine generated infrasound levels are belowthreshold of perception and threshold of feeling andbody reaction.
3.2 DELTA
The Danish Energy Authority project on “lowfrequency noise from large wind turbines” comprises aseries of investigations in the effort to give increasedknowledge on low frequency noise from windturbines18. One of the conclusions of the study is thatwind turbines do not emit audible infrasound, withlevels that are “far below the hearing threshold.”Audible low frequency sound may occur both indoorsand outdoors, “but the levels in general are close to thehearing and/or masking level.” “In general the noise inthe critical band up to 100 Hz is below both thresholds”.The final report notes that for road traffic noise (in thevicinity of roads) the low frequency noise levels arehigher [than wind turbine] both indoors and outdoors.
3.3 Hayes McKenzie Partnership
Hayes McKenzie Partnership Ltd performed a studyfor the UK Department of Trade & Industry (DTI) toinvestigate complaints of low frequency noise thatcame from three of the five farms with complaints outof 126 wind farms in the UK14. The study concludedthat:
• Infrasound associated with modern wind tur-bines is not a source which will result in noiselevels that are audible or which may be injuri-ous to the health of a wind farm neighbor.
• Low frequency noise was measureable on a fewoccasions, but below DEFRA criteria. Windturbine noise may result in indoor noise levels
Table 9—Japan Ministry of Environment Guidanceerence one-third octave band sound pressdiscomfort.
Location
One-Third
10 12.5 16 20Indoor Leq,dB
92 88 83 76
NoiseReduction*,dB
8 7 8 8
EquivalentOutdoor Leq,dB
100 95 91 84
* from Hubbard10 windows closed condition
142 Noise Control Eng. J. 59 (2), March-April 2011
within a home that is just above the threshold ofaudibility; however, it was lower than that of lo-cal road traffic noise.
• The common cause of the complaints was notassociated with low frequency noise but the oc-casional audible modulation of aerodynamicnoise, especially at night.
• The UK Department of Trade and Industry,which is now the UK Department for BusinessEnterprise and Regulatory Reform (BERR),summarized the Hayes McKenzie report: “Thereport concluded that there is no evidence ofhealth effects arising from infrasound or lowfrequency noise generated by wind turbines.”19.
3.4 Howe
Howe performed extensive studies on wind turbinesand infrasound and concluded that infrasound was notan issue for modern wind turbine installations—“whileinfrasound can be generated by wind turbines, it isconcluded that infrasound is not of concern to thehealth of residences located nearby.”20. Since thenGastmeier and Howe21 investigated an additional situa-tion involving the alleged “perception of infrasound byindividual.” In this additional case, the measuredindoor infrasound was at least 30 dB below the audibil-ity threshold given by Ref. 7 as presented in Fig. 1.
3.5 Branco
Branco and other Portuguese researchers havestudied possible physiological affects associated withhigh amplitude low frequency noise and have labeledthese alleged effects as “Vibroacoustic Disease”(VAD)22. “Vibroacoustic disease (VAD) is a whole-body, systemic pathology, characterized by the abnor-mal proliferation of extra-cellular matrices, and causedby excessive exposure to low frequency noise.”
valuating complaints of low frequency noise: Ref-level values for complaints of mental and physical
e Band Center Frequency, Hz
25 31.5 40 50 63 8070 64 57 52 47 41
8 11 13 14 15 12
78 75 70 66 62 53
for eure
Octav
Hayes23,24 concluded that levels from wind farms arenot likely to cause VAD after comparing noise levelsfrom alleged VAD cases to noise levels from windturbines in homes of complainers. Noise levels inaircraft in which VAD has been hypothesized areconsiderably higher than wind turbine noise levels.Hayes also concluded that it is “unlikely that symptomswill result through induced internal vibration fromincident wind farm noise.”23. Other studies have foundno VAD indicators in environmental sound that havebeen alleged by VAD proponents25.
3.6 French National Academy of Medicine
In 2006, the French National Academy of Medicinerecommended26 “as a precaution construction shouldbe suspended for wind turbines with a capacity exceed-ing 2.5 MW located within 1500 m of homes.” [empha-sis added] However, this precaution is not because ofdefinitive health issues but because:
• Sound levels one km from some wind turbineinstallations “occasionally exceed allowablelimits” for France (note that the allowable limitsare long term averages).
• French prediction tools for assessment did nottake into account sound levels created withwind speeds greater than 5 m/s.
• Wind turbine noise has been compared to air-craft noise (even though the sound levels ofwind turbine noise are significantly lower), andexposure to high level aircraft noise “involvesneurobiological reactions associated with an in-creased frequency of hypertension and cardio-vascular illness. Unfortunately, no such studyhas been done near wind turbines.”27.
In March 2008, the French Agency for Environmen-tal and Occupational Health Safety (AFSSET)published a report on “the health impacts of noisegenerated by wind turbines”, commissioned by theMinistries of Health and Environment in June 2006following the report of the French National Academyof Medicine in March 200628. The AFSSET studyrecommends that one does not define a fixed minimumdistance between wind farms and homes, but rather tomodel the acoustic impact of the project on a case-by-case basis. One of the conclusions of the AFSSETreport is: “The analysis of available data shows: Theabsence of identified direct health consequencesconcerning the auditory effects or specific effectsusually associated with exposure to low frequencies athigh level.” (“L’analyse des données disponibles met enévidence: L’absence de conséquences sanitairesdirectes recensées en ce qui concerne les effets auditifs,ou les effets spécifiques généralement attachés àl’exposition à des basses fréquences à niveau élevé.”).
Noise Control Eng. J. 59 (2), March-April 2011
4 FIELD PROGRAM
Two types of utility-scale wind turbines were studiedfor this field program. These two turbines are amongthe most commonly used in the NextEra fleet: GeneralElectric (GE) 1.5sle �1.5 MW�, and SiemensSWT-2.3-93 �2.3 MW�.
Sound levels for these wind turbine generators(WTGs) vary as a function of wind speed from cut-inwind speed to maximum sound level. Cut-in windspeed for the GE 1.5sle wind turbine is 3.5 m/s whilethe Siemens wind turbine has a cut-in wind speed of4 m/s. Maximum reference sound power levels for theGE 1.5sle and Siemens 2.3-93 are approximately 104 dBand 105 dB respectively as provided by the manufacturer.These sound power levels are reached at electrical outputlevels of approximately 924 kW and 1767 kW for the GEand Siemens units, respectively. Under higher windspeeds, the sound levels from the wind turbines do notincrease although electrical power output does continue toincrease up to the rated power of each wind turbine(1500 kW and 2300 kW respectively).
Each wind turbine manufacturer has an uncertaintyfactor “K” of 2 dB to guarantee the turbine’s soundpower level. (K accounts for both measurement variationsand production variation29.) The results presented later inthis paper include sound power values which have addedthe manufacturer’s K value to the reference values, that is,2 dB above the expected reference levels for themeasured wind conditions and power output.
Real-world data were collected from operating windturbines to compare to the low frequency noise guide-lines and criteria discussed previously in Sec. 2. Thesedata sets consisted of outdoor measurements at variousreference distances, and concurrent indoor/outdoormeasurements at residences within the wind farm.
NextEra provided access to the Horse Hollow WindFarm in Taylor and Nolan Counties, Texas in November2008 to collect data on the GE 1.5sle and SiemensSWT-2.3-93 wind turbines. The portion of the windfarm used for testing is relatively flat with no signifi-cant terrain. The land around the wind turbines is ruraland primarily used for agriculture and cattle grazing.The siting of the sound level measurement locationswas chosen to minimize local noise sources except thewind turbines and the wind itself. Hub height for thesewind turbines is 80 meters above ground level (AGL).
Two of the authors collected sound level and windspeed data over the course of one week under a varietyof operational conditions. Weather conditions were drythe entire week with ground level winds ranging fromcalm to 12.5 m/s �28 mph� over a 1-minute average. Inorder to minimize confounding factors, the data collectiontried to focus on periods of maximum sound levels from
143
the wind turbines (moderate to high hub height winds)and light to moderate ground level winds.
Ground level (2 meters AGL) wind speed and direc-tion were measured continuously at one representativelocation. Wind speeds near hub height were alsomeasured continuously using the permanent meteorologi-cal towers maintained by the wind farm.
A series of simultaneous interior and exterior soundlevel measurements were made at four houses ownedby participating landowners within the wind farm. Twosets were made of the GE WTGs, and two sets weremade of the Siemens WTGs. Data were collected withboth windows open and windows closed. Due to thenecessity of coordinating with the homeowners inadvance, and reasonable restrictions on time of day toenter their homes, the interior/exterior measurementdata sets do not always represent ideal conditions.However, enough data were collected to compare to thecriteria and draw conclusions on low frequency noise.
Sound level measurements were also made simulta-neously at two reference distances from a string ofwind turbines under a variety of wind conditions.Using the manufacturer’s sound power level data,calculations of the sound pressure levels as a functionof distance in flat terrain were made to aid in decidingwhere to collect data in the field. Based on this analy-sis, two distances from the nearest wind turbine wereselected—305 meters �1,000 feet� and 457 meters�1,500 feet�—and were then used where possible duringthe field program. Distances much larger than 457 meters�1,500 feet� were not practical since an adjacent turbinestring could then be closer and affect the measurements,or would put the measurements beyond the boundaries ofthe wind farm property owners. Brief background soundlevel measurements were conducted several times duringthe program whereby the Horse Hollow Wind Farmoperators were able to shutdown the nearby WTGs for abrief �20 minutes� period. This was done in real timeusing cell phone communication.
All the sound level measurements described abovewere attended. One series of unattended overnightmeasurements was made at two locations for approxi-mately 15 hours to capture a larger data set. Onemeasurement was set up approximately 305 meters�1,000 feet� from a GE 1.5sle WTG and the other was setup approximately 305 meters �1,000 feet� from aSiemens WTG. The location was chosen based on thecurrent wind direction forecast so that the sound levelequipment would be downwind for the majority of themonitoring period. By doing this, the program was able tocapture periods of strong hub-height winds and moderateto low ground-level winds.
All sound levels were measured using two NorsonicModel Nor140 precision sound analyzers, equipped
144 Noise Control Eng. J. 59 (2), March-April 2011
with a Norsonic-1209 Type 1 Preamplifier, a Norsonic-1225 half-inch microphone and a 7-inch Aco-Pacificuntreated foam windscreen Model WS7. The instrumen-tation meets the “Type 1—Precision” requirements setforth in American National Standards Institute (ANSI)S1.4 for acoustical measuring devices30. The microphonewas tripod-mounted at a height of 1.5 meters (five feet)above ground. The measurements included simultaneouscollection of broadband (A-weighted) and one-third-octave band data (3.15 hertz to 20,000 hertz bands).Sound level data were primarily logged in 10-minuteintervals to be consistent with the wind farm’s Supervi-sory Control And Data Acquisition (SCADA) systemwhich provides electrical power output (kW) in10-minute increments. A few sound level measurementswere logged using 20-minute intervals for use in deter-mining home transmission loss values. The meters werecalibrated and certified as accurate to standards set by theNational Institute of Standards and Technology. Thesecalibrations were conducted by an independent laboratorywithin the past 12 months. Ground level wind speed anddirection were measured with a HOBO H21-002 microweather station (Onset Computer Corporation). The winddata were sampled every three seconds and logged everyone minute.
5 RESULTS AND COMPARISON TOCRITERIA
Results from the field program are organized bywind turbine type. For each wind turbine type, resultsare presented per location type (outdoor or indoor) withrespect to applicable criteria. Results are presented for305 meters �1,000� feet from the nearest wind turbine.Data were also collected at 457 meters �1,500 feet� fromthe nearest wind turbine which showed lower soundlevels. Therefore, wind turbines that met the criteria at305 meters also met it at 457 meters. Data werecollected under both high turbine output and moderateturbine output conditions (defined as sound power levels 2or 3 dB less than the maximum sound power levels), andlow ground-level wind speeds. The sound level data underthe moderate conditions were equivalent to or lower thanthe high turbine output scenarios, thus confirming theconclusions from the high output cases. None of theoperational sound level data were corrected forbackground noise. A-weighted sound power levelspresented in this section (used to describe turbine opera-tion) were estimated from the actual measured poweroutput (kW) of the wind turbines and the sound powerlevels as a function of wind speed plus an uncertaintyfactor K of 2 dB.
Outdoor measurements are compared to criteria foraudibility, for UK DEFRA disturbance using equiva-lent outdoor levels, for rattle and annoyance criteria as

contained in ANSI S12.9/Part 4, for evaluatingcomplaints of rattling using Japan Ministry of Environ-ment guidance, and for perceptible vibration usingequivalent outdoor levels from ANSI/ASA S12.2.Indoor measurements are compared to criteria foraudibility, for UK DEFRA disturbance, for evaluatingcomplaints of mental and physical discomfort usingJapan Ministry of Environment guidance, and forsuitability of bedrooms, hospitals and schools andperceptible vibration from ANSI/ASA S12.2.
5.1 Siemens SWT-2.3-93
5.1.1 Outdoor measurements—Siemens SWT-2.3-93
Sound levels during six 10-minute periods of highwind turbine output and relatively low ground wind speed(which minimized effects of wind noise) were measuredoutdoors approximately 305 meters �1,000 feet� fromthe closest Siemens WTG. This site was actually part of astring of 15 WTGs, four of which were within 610 meters
Table 10—Summary of operational parameters—Siemens SWT-2.3-93 (Outdoor).
Parameter Sample #34 Sample #39Distance to nearest WTG 305 meters 305 metersTime of day 22:00-22:10 22:50-23:00WTG power output 1,847 kW 1,608 kWA-weighted sound power level* 107 dB 106.8 dBMeasured wind speed @ 2 m 3.3 m/s 3.4 m/sLAeq 49.4 dB 49.6 dBLA90 48.4 dB 48.6 dBLCeq 63.5 dB 63.2 dB
* Includes K, uncertainty factor of 2 dB
30
40
50
60
70
80
90
100
110
3.15 4 5 6.3 8 10 12.5 11/3 Octave Ba
SoundPressureLevel,dB
Infrasound
Fig. 2—Siemens SWT-2.3-93 wind turbine outdoorcriteria.
<)o. -~-• -- ,0... .A -- ... ... -~--., ~-... _ ~..
..... ...... ....... """ ~ F'1::: Pt::: ~
+-I I I
Noise Control Eng. J. 59 (2), March-April 2011
�2,000 feet� of the monitoring location. Representativesound level data from two 10-minute periods arepresented herein and include contributions from all windturbines as measured by the recording equipment. Onedata set is representative of time periods with lowfrequency sound level values near the maximummeasured and the other data set is representative of themean. The standard deviations for the low frequencyone-third octave band levels for the six measurementperiods were between 0.2–0.7 dB. The key operationaland meteorological parameters during these two measure-ment periods are listed in Table 10.
Figure 2 plots the one-third octave band sound levels�Leq� for both samples of high output conditions. Theresults show that infrasound is inaudible to even the mostsensitive people 305 meters �1,000 feet� from thesewind turbines (more than 20 dB below the median thresh-olds of hearing). Low frequency sound above 40 Hz maybe audible depending on background sound levels.
Figure 3 plots the one-third octave band sound levels�Leq� for both samples of high output conditions. The lowfrequency sound was “steady” according to DEFRAprocedures, and the results show that all outdoor equiva-lent DEFRA disturbance criteria are met.
Figure 4 compares the one-third octave band soundlevels �Leq� for both samples of high output conditions tothe Japan Ministry of Environment levels for evaluatingcomplaints on rattle. The rattle criteria is met at allfrequencies except at 5 Hz where the mean value is 1 dB(standard deviation of 0.4 dB) higher than the Japaneseevaluation value. When one considers that the 5 Hz soundlevel is 3 dB lower than the observed threshold of rattle,one concludes that the Japanese criteria are met.
The measured outdoor sound levels also meet theoutdoor equivalent Japan Ministry of Environment
25 31.5 40 50 63 80 100 125 160nter Frequency, Hz
ISO 226 + WatanabeISO 226 + Watanabe - 5 dBLwA = 107 dB (34)LwA = 106.8 dB (39)
d levels at 305 meters compared to audibility
-~-
-• · ------¼-
' ---'~
' ' • ' ' ' ---~ l'.a_ - -~ - - ~ ' ·. - ~ HR ., ' ~
' .. , ~ ' ' • ~ '
6 20nd Ce
soun
' .
' ,~,
•'
~
145

criteria for evaluating complaints of mental and physi-cal discomfort. This comparison is not presented in afigure since these criteria are generally less stringentthan the DEFRA criteria.
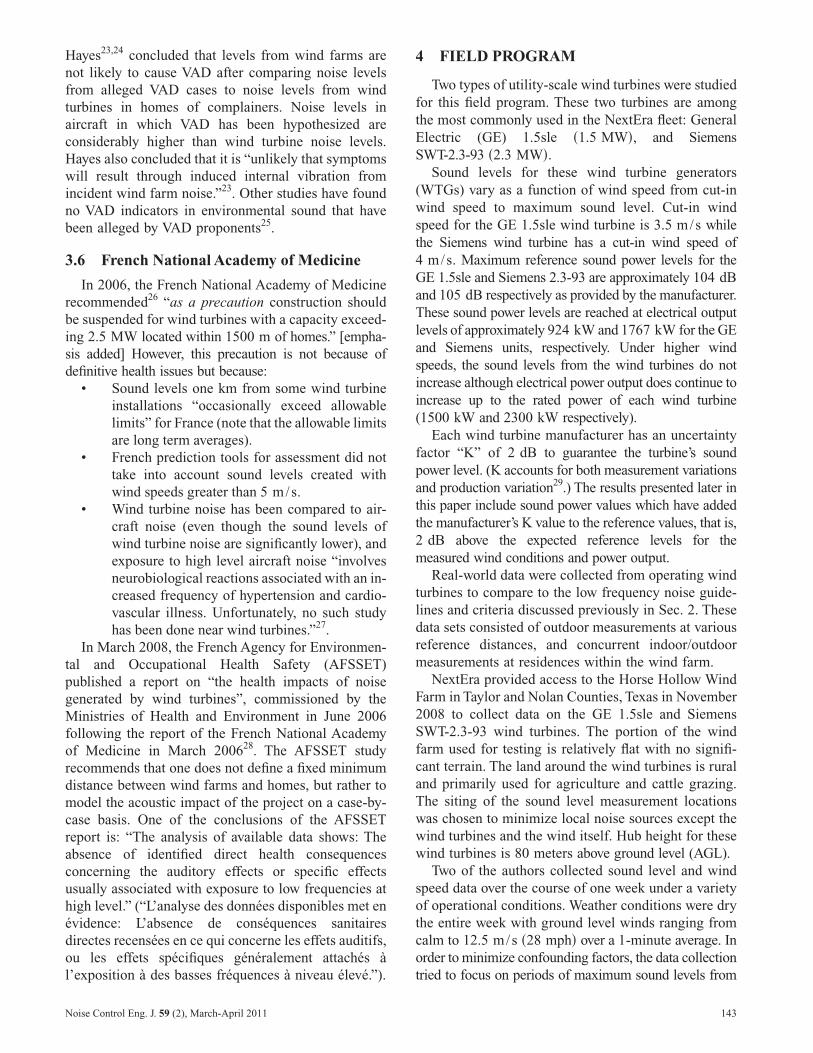
Figure 5 plots the 16, 31.5, 63, and 125 Hz octaveband sound levels �Leq� for both samples of high outputconditions. The results show that all outdoor equivalentANSI/ASA S12.2 perceptible vibration criteria are met. Inaddition, the results show that all outdoor equivalentANSI/ASA S12.2 low frequency NC-25 and NC-30 crite-ria for bedrooms are met. The low frequency sound levelsare below the ANSI S12.9 Part 4 thresholds for the begin-ning of rattles (16, 31.5, 63 Hz total less than 70 dB). The31.5 and 63 Hz sound levels are below the level of 65 dBidentified for minimal annoyance in ANSI S12.9 Part 4,
20
30
40
50
60
70
80
90
100
110
3.15 4 5 6.3 8 10 12.5 161/3 Octave Ba
SoundPressureLevel,dB
Infrasound
Fig. 3—Siemens SWT-2.3-93 wind turbine outdoorequivalent DEFRA criteria.
20
30
40
50
60
70
80
90
100
110
3.15 4 5 6.3 8 10 12.5 161/3 Octave Ba
SoundPressureLevel,dB
Infrasound
Fig. 4—Siemens SWT-2.3-93 wind turbine outdoortry of Environment rattle criteria.
6--. ~ ----.
... -.. 1--L. .,,,.._ ~ ::.:t::: ~ :::.
+-+
L. ---- ---~ - La-=- -- "'"-' ~ Ft::: ~ ~
+-
146 Noise Control Eng. J. 59 (2), March-April 2011
and the 16 Hz sound level is within 1.5 dB of this level,which is an insignificant increase since the levels were notrapidly fluctuating.
5.1.2 Indoor measurements—Siemens SWT-2.3-93
Simultaneous outdoor and indoor measurementswere made at two residences at different locationswithin the wind farm to determine indoor audibility oflow frequency noise from Siemens WTGs. In eachhouse a 10-minute measurement was made in a roomfacing the wind turbines with a window both open andclosed. Results from the testing at one of the homes arenot presented due to the very high ground level winds
25 31.5 40 50 63 80 100 125 160nter Frequency, Hz
DEFRA (steady)
LwA = 107 dBA (34)
LwA = 106.8 dBA (39)
d levels at 305 meters compared to outdoor
25 31.5 40 50 63 80 100 125 160nter Frequency, Hz
Japan Ministry of Environment - Rattle
LwA = 107 dBA (34)
LwA = 106.8 dBA (39)
d levels at 305 meters compared to Japan Minis-
...._
..... -¼-
~ ~
I',._ -- ~ 1---A-r---~ ~ -._
- -
1,,. v""
__. l--
----r--- ...... - -- - - ~
-----..... -¼-
20nd Ce
soun
. ' !'A__
_
~
20nd Ce
soun
-
~
��9 m/s� which dominated the sound environment. Theremaining residence is designated Home “A” and wasapproximately 323 meters �1,060 feet� from the closestSiemens WTG. The home was near a string of multipleWTGs, four of which were within 610 meters�2,000 feet� of the house. The sound level data presentedherein include contributions from all wind turbines asmeasured by the recording equipment. The key opera-tional and meteorological parameters during thesemeasurements are listed in Table 11.
The room in Home “A” where interior measure-ments were made had the following characteristics:approximately 3.6 meters wide �12 feet� by 4.9 meterslong �16 feet�, no furniture, carpeted flooring, tworelatively new double-hung windows (no storm windows),sheetrock interior walls, and clapboard exterior walls. Thesound level meter was located in the center of the room.
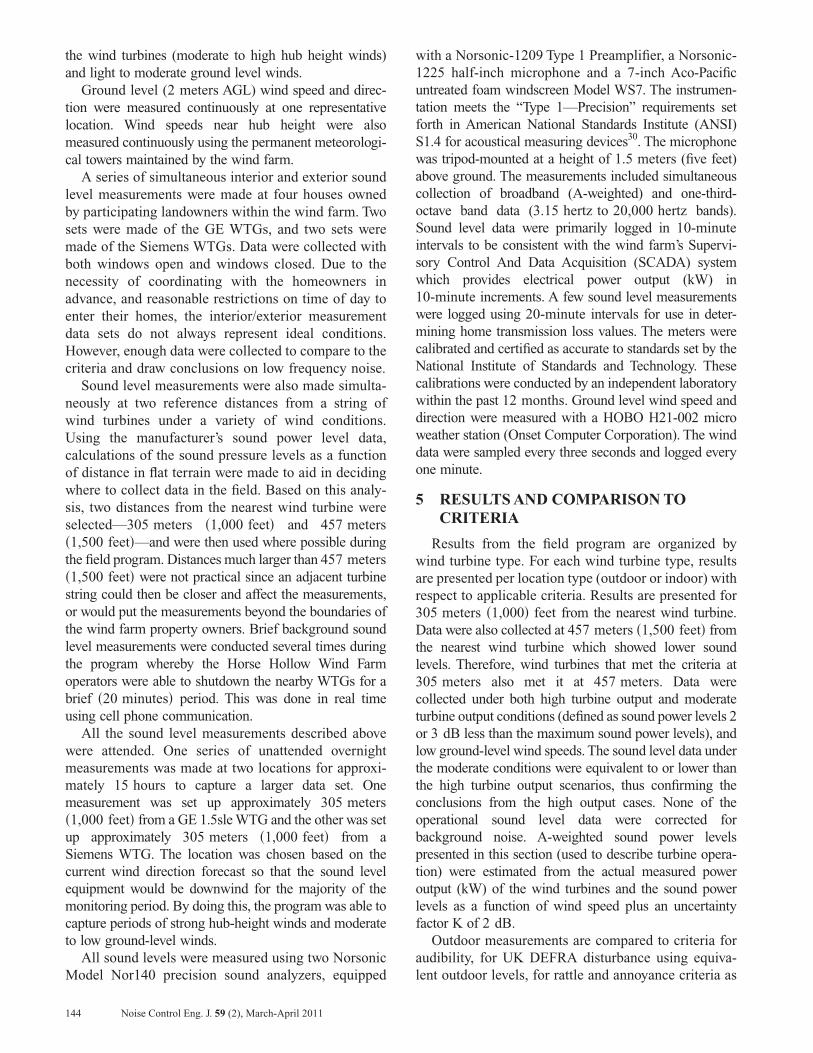
Figure 6 plots the indoor one-third octave bandsound levels �Leq� for Home “A”. The results show thatinfrasound is inaudible to even the most sensitive peopleapproximately 1,000 feet from these wind turbines with
Table 11—Summary of operational parameters—Siemens SWT-2.3-93 (Indoor).
Parameter Home “A” (closed/open)Distance to nearest WTG 323 metersTime of day 07:39-07:49/07:51-08:01WTG power output 1,884 kW/1564 kWA-weighted sound power level* 107 dB/106.7 dBMeasured wind speed @ 2 m 3.2 m/s /3.7 m/sLAeq 33.8 dB/38.1 dBLA90 28.1 dB/36.8 dBLCeq 54.7 dB/57.1 dB
* Includes K, uncertainty factor of 2 dB
30
40
50
60
70
80
90
100
16 31.5Octave Band
OctaveBandSoundPressureLevel,dB
ANSI S12.2 Clearly perceptibANSI S12.2 Moderately perceANSI S12.2 NC-30ANSI S12.2 NC-25ANSI S12.9 Part 4LwA = 107 dBA (34)LwA = 106.8 dBA (39)
Fig. 5—Siemens SWT-2.3-93 wind turbine outdoor
Noise Control Eng. J. 59 (2), March-April 2011
the windows open or closed (more than 20 dB below themedian thresholds of hearing). Low frequency sound at orabove 50 Hz may be audible depending on backgroundsound levels.
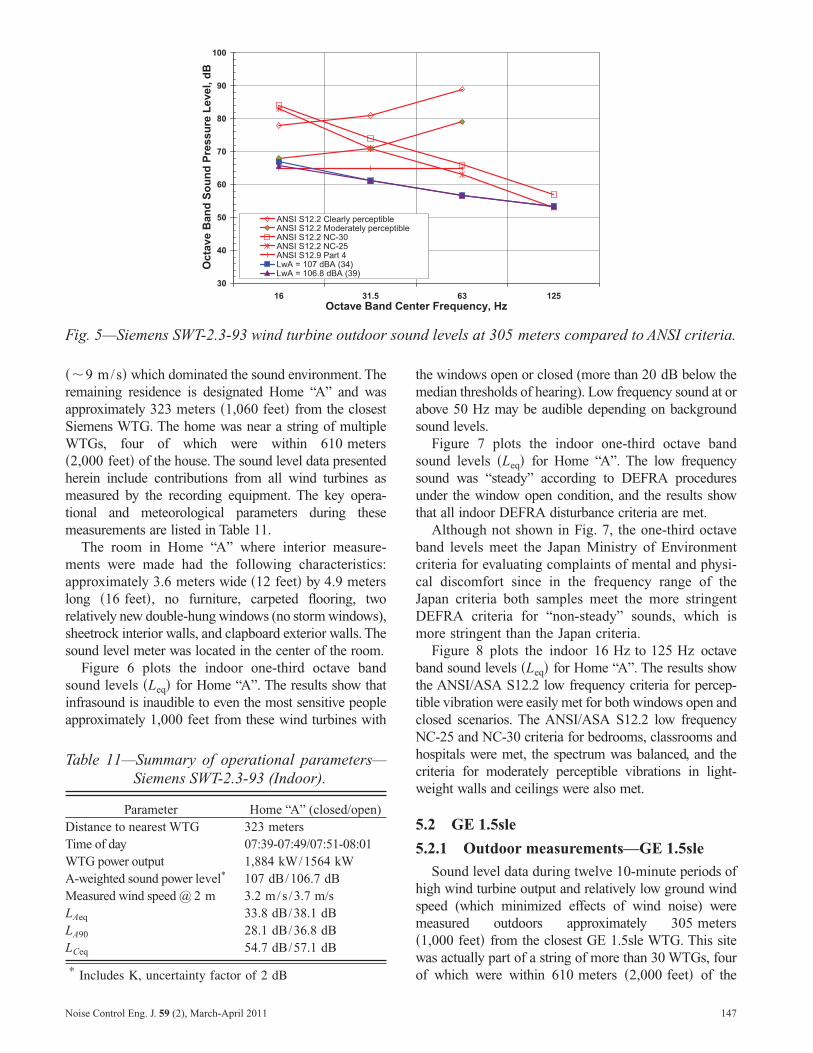
Figure 7 plots the indoor one-third octave bandsound levels �Leq� for Home “A”. The low frequencysound was “steady” according to DEFRA proceduresunder the window open condition, and the results showthat all indoor DEFRA disturbance criteria are met.
Although not shown in Fig. 7, the one-third octaveband levels meet the Japan Ministry of Environmentcriteria for evaluating complaints of mental and physi-cal discomfort since in the frequency range of theJapan criteria both samples meet the more stringentDEFRA criteria for “non-steady” sounds, which ismore stringent than the Japan criteria.
Figure 8 plots the indoor 16 Hz to 125 Hz octaveband sound levels �Leq� for Home “A”. The results showthe ANSI/ASA S12.2 low frequency criteria for percep-tible vibration were easily met for both windows open andclosed scenarios. The ANSI/ASA S12.2 low frequencyNC-25 and NC-30 criteria for bedrooms, classrooms andhospitals were met, the spectrum was balanced, and thecriteria for moderately perceptible vibrations in light-weight walls and ceilings were also met.
5.2 GE 1.5sle
5.2.1 Outdoor measurements—GE 1.5sle
Sound level data during twelve 10-minute periods ofhigh wind turbine output and relatively low ground windspeed (which minimized effects of wind noise) weremeasured outdoors approximately 305 meters�1,000 feet� from the closest GE 1.5sle WTG. This sitewas actually part of a string of more than 30 WTGs, fourof which were within 610 meters �2,000 feet� of the
63 125ter Frequency, Hz
d levels at 305 meters compared to ANSI criteria.
Cen
leptible
soun
147
monitoring location. Representative sound level data fromtwo 10-minute periods are presented herein and includecontributions from all wind turbines as measured by therecording equipment. One data set is representative oftime periods with low frequency sound level values nearthe maximum and the other data set is representative ofthe mean. The standard deviations for the low frequencyone-third octave band levels for the twelve measurementperiods were between 0.3–1.9 dB with the largest varia-tion in the 10–16 Hz bands and the lowest at 160 Hz.The key operational and meteorological parameters forthese two measurement periods are listed in Table 12.
Figure 9 plots the one-third octave band sound levels�Leq� for both samples of high output conditions. Theresults show that infrasound is inaudible to even the most
30
40
50
60
70
80
90
100
110
3.15 4 5 6.3 8 10 12.5 1Octave Band
SoundPressureLevel,dB
Infrasound
Fig. 6—Siemens SWT-2.3-93 wind turbine indoor steria (Home “A”).
20
30
40
50
60
70
80
90
100
110
3.15 4 5 6.3 8 10 12.5 11/3 Octave Ba
SoundPressureLevel,dB
Infrasound
Fig. 7—Siemens SWT-2.3-93 wind turbine indoor sria (Home “A”).
~ ~ ._ ~ ......_
----~ r---.__ ~
r'o__ ~
.. +-~ ~ ~ ,,.,
"' - ,i_ .. - ..-
......_ -ls.. i'-iL.
I"'--~•
' ~ ~ ~--- ~.. ~
148 Noise Control Eng. J. 59 (2), March-April 2011
sensitive people 305 meters �1,000 feet� from thesewind turbines (more than 20 dB below the median thresh-olds of hearing). Low frequency sound at and above31.5–40 Hz may be audible depending on backgroundsound levels.
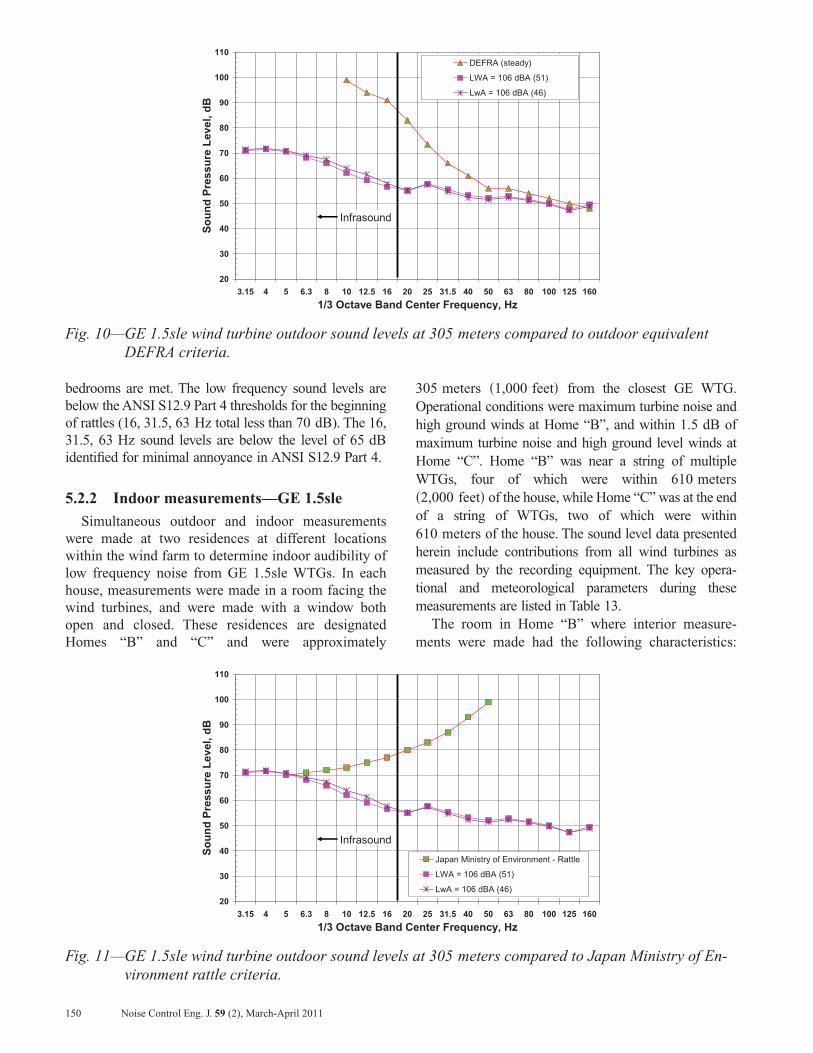
Figure 10 plots the one-third octave band soundlevels �Leq� for both samples of high output conditions.The low frequency sound was “steady” according toDEFRA procedures, and the results show the lowfrequency sound meet or are within 1 dB of outdoorequivalent DEFRA disturbance criteria.
Figure 11 compares the one-third octave band soundlevels �Leq� for both samples of high output conditions tothe Japan Ministry of Environment levels for evaluatingcomplaints on rattle. The rattle criteria is met at all
25 31.5 40 50 63 80 100 125 160ter Frequency, Hz
ISO 226 + WatanabeISO 226 + Watanabe - 5 dBWindow open; LwA = 106.7 dBA (02)Window closed; LwA = 107 dBA (01)
levels at 323 meters compared to audibility cri-
25 31.5 40 50 63 80 100 125 160nter Frequency, Hz
DEFRA (steady)DEFRA (non-steady)Window open; steady; LwA = 106.7 dBA (02)Window closed; non-steady; LwA = 107 dBA (01)
levels at 323 meters compared to DEFRA crite-
~
...... ~
......
' ~ \. ~ ~ \ I\.,
' ~ ~ =
--~ R A ~
.._;., ........_ r:: ~
.. - ..
, ~ ~ ~ 1, ~ ' i\: -is..._
"'"" ~ r,1,- -..... -A-. _
-- m
~ = ~ re- i--.-- --.--~
6 20Cen
ound
~ ~
, -.-
6 20nd Ce
ound
.....-+~....
~ R
-----

frequencies; at 5 Hz the mean value is 70 dB (standarddeviation=0.9 dB), while the two presented measure-
Table 12—Summary of operational parameters—GE 1.5sle (Outdoor).
Parameter Sample #46 Sample #51Distance to nearest WTG 305 meters 305 metersTime of day 23:10-23:20 00:00-00:10WTG power output 1,293 kW 1,109 kWA-weighted sound power level* 106 dB 106 dBMeasured wind speed @ 2 m 4.1 m/s 3.3 m/sLAeq 50.2 dB 50.7 dBLA90 49.2 dB 49.7 dBLCeq 62.5 dB 62.8 dB
* Includes K, uncertainty factor of 2 dB
20
30
40
50
60
70
80
90
100
16 31.5Octave Ban
OctaveBandSoundPressureLevel,dB
Fig. 8—Siemens SWT-2.3-93 wind turbine indoor steria for perceptible vibrations and NC-25
30
40
50
60
70
80
90
100
110
3.15 4 5 6.3 8 10 12.5 161/3 Octave Ba
SoundPressureLevel,dB
Infrasound
Fig. 9—GE 1.5sle wind turbine outdoor sound leve
~ ~ .__ ~
r---- --..... ' ---.... ~
"' ~-
-a::: ~ ½ :'lK. -~+-
Noise Control Eng. J. 59 (2), March-April 2011
ments are approximately 1 dB higher, an insignificantincrease. When one considers that the 5 Hz sound level is3 dB lower than the observed threshold of rattle, oneconcludes that the Japanese criteria are met.
The measured outdoor sound levels also meet theoutdoor equivalent Japan Ministry of Environmentcriteria for evaluating complaints of mental and physi-cal discomfort. This comparison is not presented in afigure since these criteria are generally less stringentthan the DEFRA criteria.
Figure 12 plots the 16, 31.5, 63 and 125 Hz octaveband sound levels �Leq� for both samples of high outputconditions. The results show that all outdoor equivalentANSI/ASA S12.2 perceptible vibration criteria are met.The results show that all outdoor equivalent ANSI/ASAS12.2 low frequency NC-25 and NC-30 criteria for
63 125ter Frequency, Hz
ANSI S12.2: Clearly perceptibleANSI S12.2: Moderately perceptibleANSI S12.2: NC-25Window Open; LwA=106.7 dBA (02)Window Closed; LwA=107 dBA (01)
levels at 323 meters compared to ANSI 12.2 cri-e “A”).
25 31.5 40 50 63 80 100 125 160nter Frequency, Hz
ISO 226 + WatanabeISO 226 + Watanabe - 5 dBLWA = 106 dBA (51)LwA = 106 dBA (46)
305 meters compared to audibility criteria.
-+ ...... ----¼-
"
' \. .i.. ----~ ~ "-- - -
' ~ ---
----~ ~
d Cen
ound(Hom
20nd Ce
ls at
'
~ ...-
149
bedrooms are met. The low frequency sound levels arebelow the ANSI S12.9 Part 4 thresholds for the beginningof rattles (16, 31.5, 63 Hz total less than 70 dB). The 16,31.5, 63 Hz sound levels are below the level of 65 dBidentified for minimal annoyance in ANSI S12.9 Part 4.
5.2.2 Indoor measurements—GE 1.5sle
Simultaneous outdoor and indoor measurementswere made at two residences at different locationswithin the wind farm to determine indoor audibility oflow frequency noise from GE 1.5sle WTGs. In eachhouse, measurements were made in a room facing thewind turbines, and were made with a window bothopen and closed. These residences are designatedHomes “B” and “C” and were approximately
20
30
40
50
60
70
80
90
100
110
3.15 4 5 6.3 8 10 12.5 11/3 Octave Ba
SoundPressureLevel,dB
Infrasound
Fig. 10—GE 1.5sle wind turbine outdoor sound levDEFRA criteria.
20
30
40
50
60
70
80
90
100
110
3.15 4 5 6.3 8 10 12.5 11/3 Octave Ba
SoundPressureLevel,dB
Infrasound
Fig. 11—GE 1.5sle wind turbine outdoor sound levvironment rattle criteria.
...... ~ ----.
-~ rl::: Ft-NI( -~~
--~ - - - - ---- --a::: ~ Pi::: r---><:: - -:::&-
~
150 Noise Control Eng. J. 59 (2), March-April 2011
305 meters �1,000 feet� from the closest GE WTG.Operational conditions were maximum turbine noise andhigh ground winds at Home “B”, and within 1.5 dB ofmaximum turbine noise and high ground level winds atHome “C”. Home “B” was near a string of multipleWTGs, four of which were within 610 meters�2,000 feet� of the house, while Home “C” was at the endof a string of WTGs, two of which were within610 meters of the house. The sound level data presentedherein include contributions from all wind turbines asmeasured by the recording equipment. The key opera-tional and meteorological parameters during thesemeasurements are listed in Table 13.
The room in Home “B” where interior measure-ments were made had the following characteristics:
25 31.5 40 50 63 80 100 125 160nter Frequency, Hz
DEFRA (steady)
LWA = 106 dBA (51)
LwA = 106 dBA (46)
t 305 meters compared to outdoor equivalent
25 31.5 40 50 63 80 100 125 160nter Frequency, Hz
Japan Ministry of Environment - Rattle
LWA = 106 dBA (51)
LwA = 106 dBA (46)
t 305 meters compared to Japan Ministry of En-
_....
-----f--
-¼-
~ I~
l'-,o
~ l'-,o_ L....o. ~ '-- - - ...... -...
,..... -
l-i...--
__...-~
~
~ - -- - - ---
----------
-
-¼-
6 20nd Ce
els a
. '\
~
---
6 20nd Ce
els a
-
-..
---
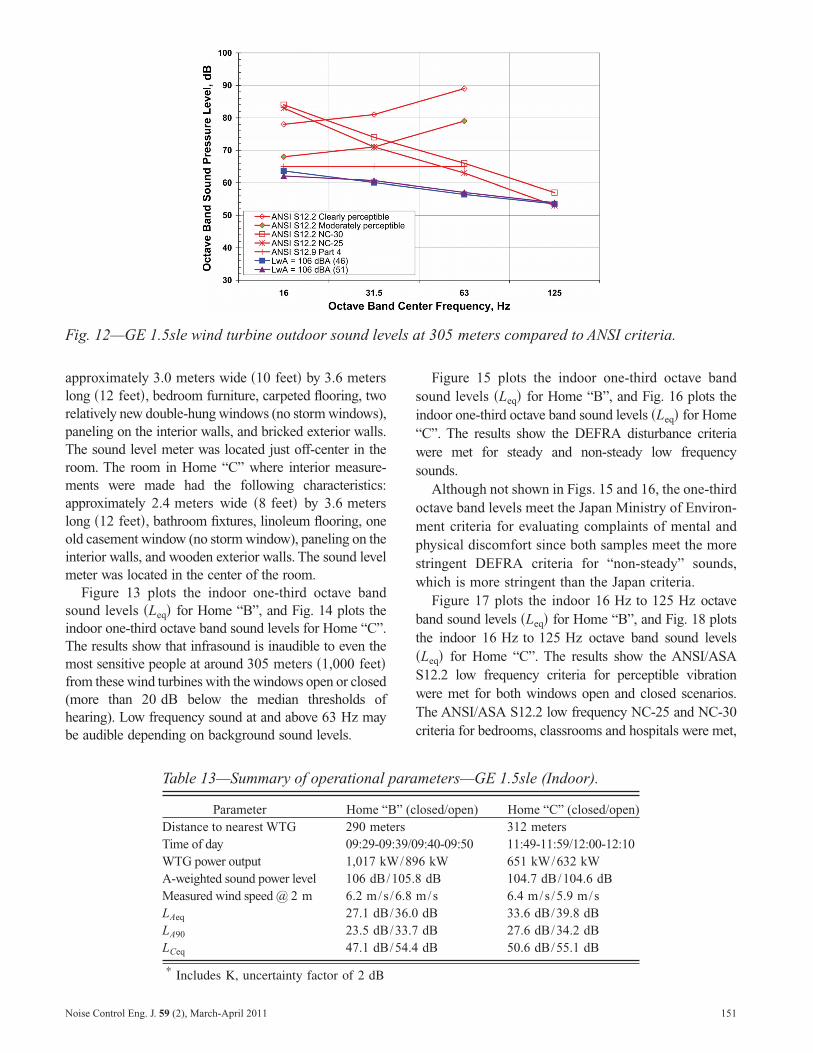
approximately 3.0 meters wide �10 feet� by 3.6 meterslong �12 feet�, bedroom furniture, carpeted flooring, tworelatively new double-hung windows (no storm windows),paneling on the interior walls, and bricked exterior walls.The sound level meter was located just off-center in theroom. The room in Home “C” where interior measure-ments were made had the following characteristics:approximately 2.4 meters wide �8 feet� by 3.6 meterslong �12 feet�, bathroom fixtures, linoleum flooring, oneold casement window (no storm window), paneling on theinterior walls, and wooden exterior walls. The sound levelmeter was located in the center of the room.
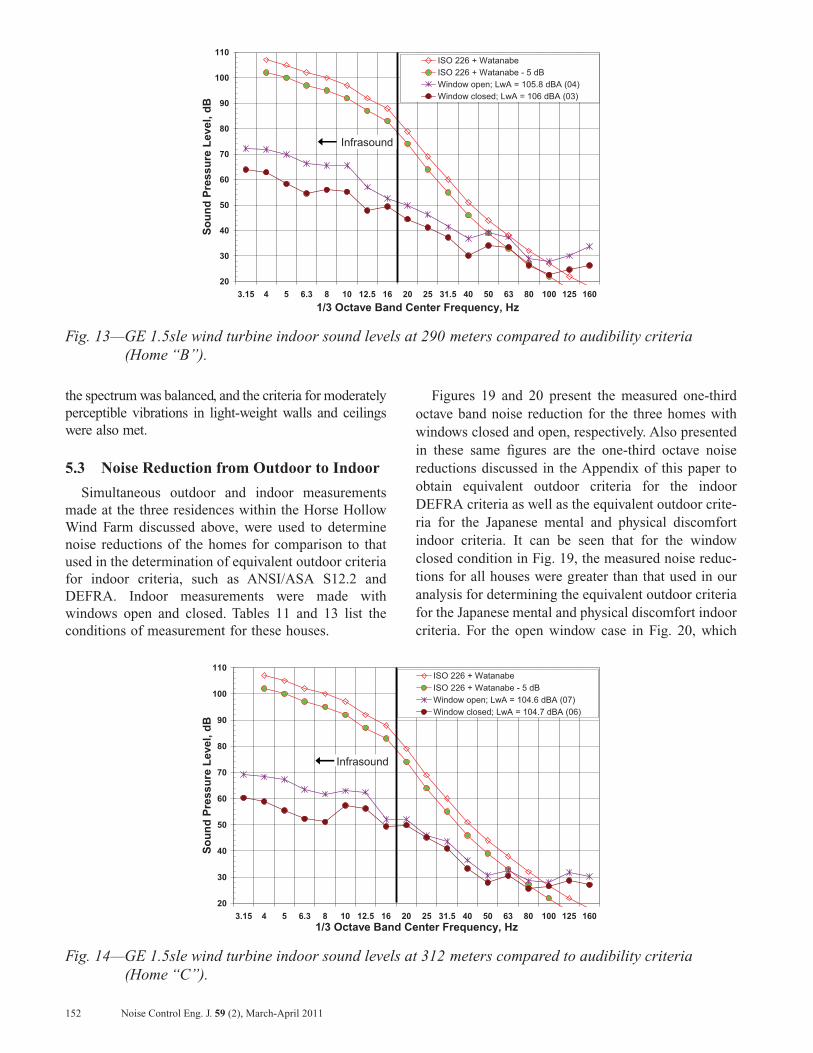
Figure 13 plots the indoor one-third octave bandsound levels �Leq� for Home “B”, and Fig. 14 plots theindoor one-third octave band sound levels for Home “C”.The results show that infrasound is inaudible to even themost sensitive people at around 305 meters �1,000 feet�from these wind turbines with the windows open or closed(more than 20 dB below the median thresholds ofhearing). Low frequency sound at and above 63 Hz maybe audible depending on background sound levels.
Table 13—Summary of operational
Parameter Home “Distance to nearest WTG 290 metTime of day 09:29-09WTG power output 1,017 kWA-weighted sound power level 106 dB/Measured wind speed @ 2 m 6.2 m/sLAeq 27.1 dBLA90 23.5 dBLCeq 47.1 dB
* Includes K, uncertainty factor of 2 dB
Fig. 12—GE 1.5sle wind turbine outdoor sound lev
100
al "'C
ai 90
> QI -' QI 80 ... ::I rn rn QI 70 ... a. "'C C:
60 ::I -0
II)
"'C C: 50 -+- ANSI S12.2 Clearly perceptiblecu al -+- ANSI S12.2 Moderately percep
QI -&- ANSI S12.2 NC-30 > 40 -¼- ANSI S12.2 NC-25 cu -+- ANSI S12.9 Part 4 -u --- LwA = 106 dBA (46) 0 -+- LwA = 106 dBA 51
30 16 31 .5
Octave Ban
Noise Control Eng. J. 59 (2), March-April 2011
Figure 15 plots the indoor one-third octave bandsound levels �Leq� for Home “B”, and Fig. 16 plots theindoor one-third octave band sound levels �Leq� for Home“C”. The results show the DEFRA disturbance criteriawere met for steady and non-steady low frequencysounds.
Although not shown in Figs. 15 and 16, the one-thirdoctave band levels meet the Japan Ministry of Environ-ment criteria for evaluating complaints of mental andphysical discomfort since both samples meet the morestringent DEFRA criteria for “non-steady” sounds,which is more stringent than the Japan criteria.
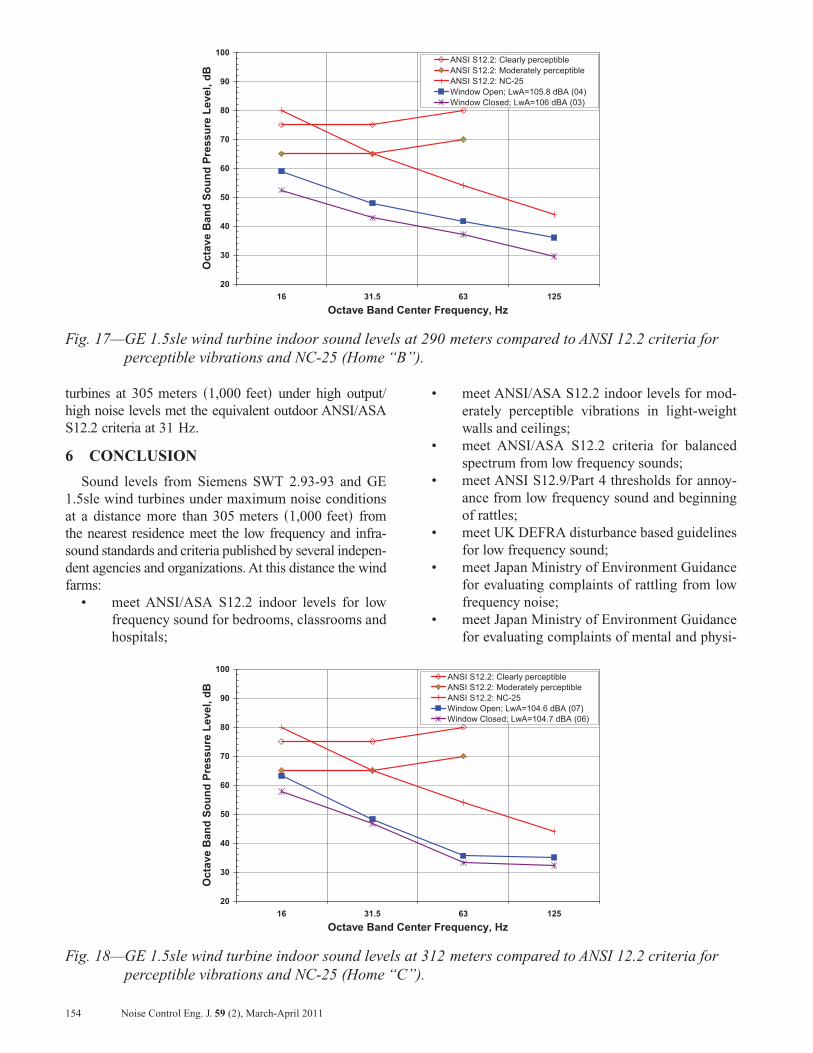
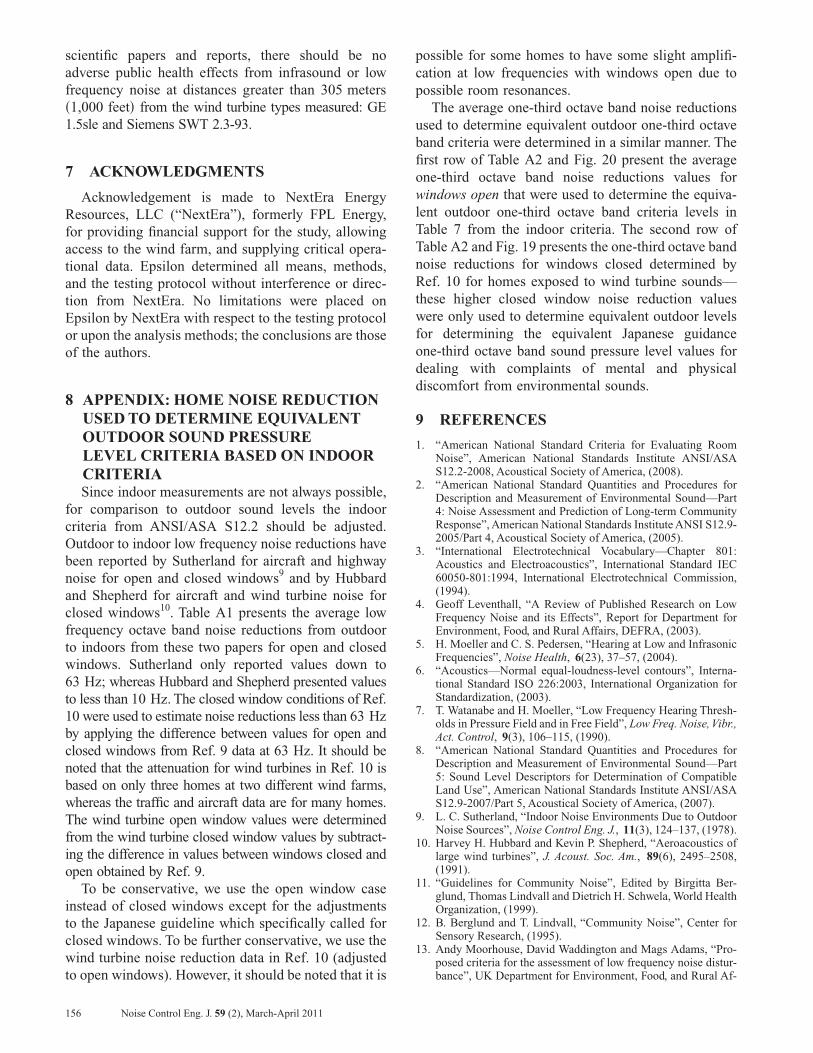
Figure 17 plots the indoor 16 Hz to 125 Hz octaveband sound levels �Leq� for Home “B”, and Fig. 18 plotsthe indoor 16 Hz to 125 Hz octave band sound levels�Leq� for Home “C”. The results show the ANSI/ASAS12.2 low frequency criteria for perceptible vibrationwere met for both windows open and closed scenarios.The ANSI/ASA S12.2 low frequency NC-25 and NC-30criteria for bedrooms, classrooms and hospitals were met,
meters—GE 1.5sle (Indoor).
losed/open) Home “C” (closed/open)312 meters
9:40-09:50 11:49-11:59/12:00-12:106 kW 651 kW/632 kW
dB 104.7 dB/104.6 dBm/s 6.4 m/s /5.9 m/sdB 33.6 dB/39.8 dBdB 27.6 dB/34.2 dBdB 50.6 dB/55.1 dB
t 305 meters compared to ANSI criteria.
t
t
63 125
ter Frequency, Hz
para
B” (cers:39/0
/89105.8/6.8/36.0/33.7/54.4
els a
tible
d Cen
151
the spectrum was balanced, and the criteria for moderatelyperceptible vibrations in light-weight walls and ceilingswere also met.
5.3 Noise Reduction from Outdoor to Indoor
Simultaneous outdoor and indoor measurementsmade at the three residences within the Horse HollowWind Farm discussed above, were used to determinenoise reductions of the homes for comparison to thatused in the determination of equivalent outdoor criteriafor indoor criteria, such as ANSI/ASA S12.2 andDEFRA. Indoor measurements were made withwindows open and closed. Tables 11 and 13 list theconditions of measurement for these houses.
20
30
40
50
60
70
80
90
100
110
3.15 4 5 6.3 8 10 12.5 11/3 Octave Ba
SoundPressureLevel,dB
Infrasound
Fig. 13—GE 1.5sle wind turbine indoor sound leve(Home “B”).
20
30
40
50
60
70
80
90
100
110
3.15 4 5 6.3 8 10 12.5 161/3 Octave Ba
SoundPressureLevel,dB
Infrasound
Fig. 14—GE 1.5sle wind turbine indoor sound leve(Home “C”).
~ ~ ._ ~
--..... -..._ K r--e.. ~
l'e... ~
~ ~ +-
---..., "' ,., ..... ~ "' = ~ ...__ - ~ . ~ ~
---,__
~ ~ ._ ~
r-----~ K I'-... ~
['-..,_ ~
~ =-~ ~ r--. ~ - = "' -r-e... ~ " r------~ ~-
152 Noise Control Eng. J. 59 (2), March-April 2011
Figures 19 and 20 present the measured one-thirdoctave band noise reduction for the three homes withwindows closed and open, respectively. Also presentedin these same figures are the one-third octave noisereductions discussed in the Appendix of this paper toobtain equivalent outdoor criteria for the indoorDEFRA criteria as well as the equivalent outdoor crite-ria for the Japanese mental and physical discomfortindoor criteria. It can be seen that for the windowclosed condition in Fig. 19, the measured noise reduc-tions for all houses were greater than that used in ouranalysis for determining the equivalent outdoor criteriafor the Japanese mental and physical discomfort indoorcriteria. For the open window case in Fig. 20, which
25 31.5 40 50 63 80 100 125 160nter Frequency, Hz
ISO 226 + WatanabeISO 226 + Watanabe - 5 dBWindow open; LwA = 105.8 dBA (04)Window closed; LwA = 106 dBA (03)
290 meters compared to audibility criteria
25 31.5 40 50 63 80 100 125 160nter Frequency, Hz
ISO 226 + WatanabeISO 226 + Watanabe - 5 dBWindow open; LwA = 104.6 dBA (07)Window closed; LwA = 104.7 dBA (06)
312 meters compared to audibility criteria
~ _._ -¾-_._
"
' ""' ' ~
~ I, ~ -",I(
~ ~ ~ ~ WK ['-. ~ _,,.,, ...... ~ ~ ~ ,_
~ _._ -¾-_._
" ~ ""'
' \.. ~ -:: ~ ~ ' ~ ""' ~ -......,_ ~ ,)I(._
" ....-~ ~
~
~
6 20nd Ce
ls at
" ~
_ ,.,~..._
20nd Ce
ls at
' ~
~ --
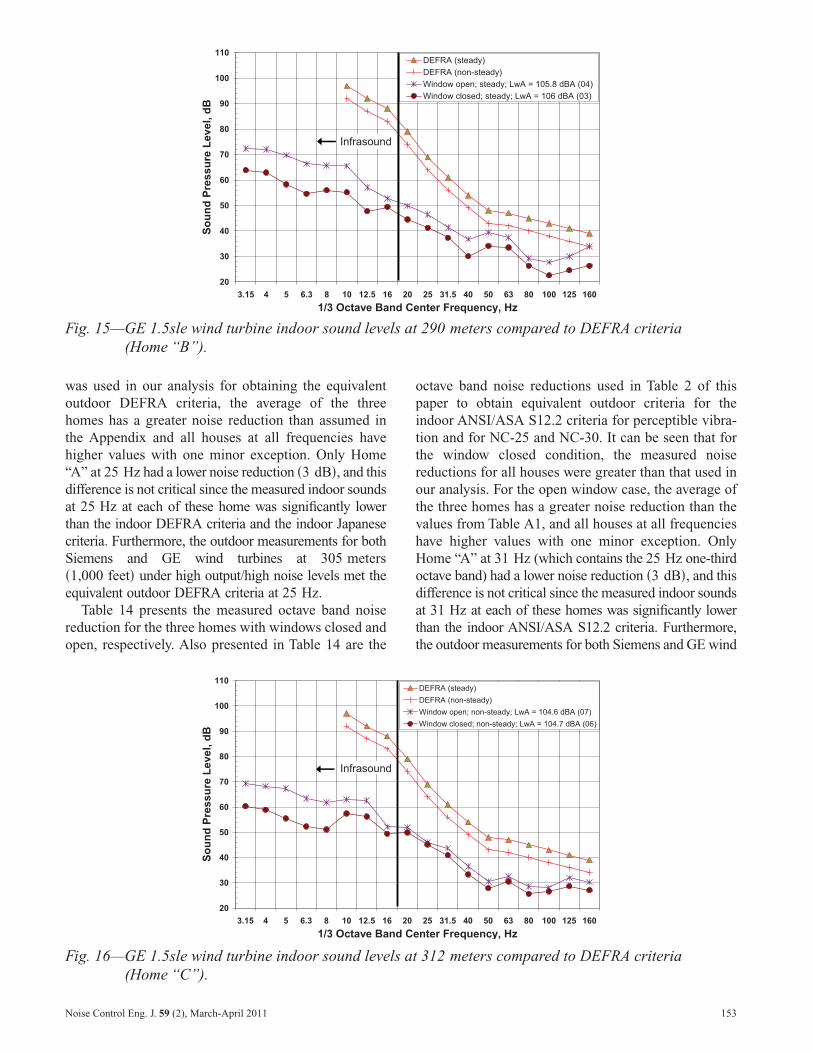
was used in our analysis for obtaining the equivalentoutdoor DEFRA criteria, the average of the threehomes has a greater noise reduction than assumed inthe Appendix and all houses at all frequencies havehigher values with one minor exception. Only Home“A” at 25 Hz had a lower noise reduction �3 dB�, and thisdifference is not critical since the measured indoor soundsat 25 Hz at each of these home was significantly lowerthan the indoor DEFRA criteria and the indoor Japanesecriteria. Furthermore, the outdoor measurements for bothSiemens and GE wind turbines at 305 meters�1,000 feet� under high output/high noise levels met theequivalent outdoor DEFRA criteria at 25 Hz.
Table 14 presents the measured octave band noisereduction for the three homes with windows closed andopen, respectively. Also presented in Table 14 are the
20
30
40
50
60
70
80
90
100
110
3.15 4 5 6.3 8 10 12.5 11/3 Octave Ba
SoundPressureLevel,dB
Infrasound
Fig. 15—GE 1.5sle wind turbine indoor sound leve(Home “B”).
20
30
40
50
60
70
80
90
100
110
3.15 4 5 6.3 8 10 12.5 11/3 Octave Ba
SoundPressureLevel,dB
Infrasound
Fig. 16—GE 1.5sle wind turbine indoor sound leve(Home “C”).
A..._ ,.__ ~ ~
~)tE--
+-~
"" ... "' ..... ~ ... "'\,_
......_ ..._ )I(..._ W" ~ ~.... -
A..._ -is. I':.... ~
~~
= ~ ~ -.....c. "" "' - 71< '" --- 'e..._ L------" ---.... la--' ~-
Noise Control Eng. J. 59 (2), March-April 2011
octave band noise reductions used in Table 2 of thispaper to obtain equivalent outdoor criteria for theindoor ANSI/ASA S12.2 criteria for perceptible vibra-tion and for NC-25 and NC-30. It can be seen that forthe window closed condition, the measured noisereductions for all houses were greater than that used inour analysis. For the open window case, the average ofthe three homes has a greater noise reduction than thevalues from Table A1, and all houses at all frequencieshave higher values with one minor exception. OnlyHome “A” at 31 Hz (which contains the 25 Hz one-thirdoctave band) had a lower noise reduction �3 dB�, and thisdifference is not critical since the measured indoor soundsat 31 Hz at each of these homes was significantly lowerthan the indoor ANSI/ASA S12.2 criteria. Furthermore,the outdoor measurements for both Siemens and GE wind
25 31.5 40 50 63 80 100 125 160nter Frequency, Hz
DEFRA (steady)DEFRA (non-steady)Window open; steady; LwA = 105.8 dBA (04)Window closed; steady; LwA = 106 dBA (03)
290 meters compared to DEFRA criteria
25 31.5 40 50 63 80 100 125 160nter Frequency, Hz
DEFRA (steady)DEFRA (non-steady)Window open; non-steady; LwA = 104.6 dBA (07)Window closed; non-steady; LwA = 104.7 dBA (06)
312 meters compared to DEFRA criteria
---_
" ~ ~
' ~ ' ""-.._ ')I.--. ~ ~ -.... -.... ....... x r+- -...
' ~ ~ " -+- -+-
-.. ~/ ~
·•-✓ ~
...__ "' _..... ~ .........
' ~ I\.
1, ~ ~
""-.._ ')I.--. ~ ~ ~ f---1...
-.... -.... _
~ --i-- -+- --
I'-,.., ~ ~ r+ ..- - ,. --.- --- ..
6 20nd Ce
ls at
--.-+-¾__.
'
R
r-.._
6 20nd Ce
ls at
--.--+--¾-__._
' ~
~
153
turbines at 305 meters �1,000 feet� under high output/high noise levels met the equivalent outdoor ANSI/ASAS12.2 criteria at 31 Hz.
6 CONCLUSION
Sound levels from Siemens SWT 2.93-93 and GE1.5sle wind turbines under maximum noise conditionsat a distance more than 305 meters �1,000 feet� fromthe nearest residence meet the low frequency and infra-sound standards and criteria published by several indepen-dent agencies and organizations. At this distance the windfarms:
• meet ANSI/ASA S12.2 indoor levels for lowfrequency sound for bedrooms, classrooms andhospitals;
20
30
40
50
60
70
80
90
100
16 31.5Octave Ban
OctaveBandSoundPressureLevel,dB
Fig. 17—GE 1.5sle wind turbine indoor sound leveperceptible vibrations and NC-25 (Home
20
30
40
50
60
70
80
90
100
16 31.5Octave Ban
OctaveBandSoundPressureLevel,dB
Fig. 18—GE 1.5sle wind turbine indoor sound leveperceptible vibrations and NC-25 (Home
154 Noise Control Eng. J. 59 (2), March-April 2011
• meet ANSI/ASA S12.2 indoor levels for mod-erately perceptible vibrations in light-weightwalls and ceilings;
• meet ANSI/ASA S12.2 criteria for balancedspectrum from low frequency sounds;
• meet ANSI S12.9/Part 4 thresholds for annoy-ance from low frequency sound and beginningof rattles;
• meet UK DEFRA disturbance based guidelinesfor low frequency sound;
• meet Japan Ministry of Environment Guidancefor evaluating complaints of rattling from lowfrequency noise;
• meet Japan Ministry of Environment Guidancefor evaluating complaints of mental and physi-
63 125ter Frequency, Hz
ANSI S12.2: Clearly perceptibleANSI S12.2: Moderately perceptibleANSI S12.2: NC-25Window Open; LwA=105.8 dBA (04)Window Closed; LwA=106 dBA (03)
290 meters compared to ANSI 12.2 criteria for).
63 125ter Frequency, Hz
ANSI S12.2: Clearly perceptibleANSI S12.2: Moderately perceptibleANSI S12.2: NC-25Window Open; LwA=104.6 dBA (07)Window Closed; LwA=104.7 dBA (06)
312 meters compared to ANSI 12.2 criteria for).
--+--+-
-----
d Cen
ls at“B”
d Cen
ls at“C”

ction
cal discomfort from low frequency noise;• have no audible infrasound to the most sensitive
listeners; and• might have slightly audible low frequency noise
at frequencies at 50 Hz and above depending on
Table 14—Summary of octave band noise reduction
Home Wind Turbine WindowsA Siemens SWT-2-3-93 ClosedA Siemens SWT-2-3-93 OpenB GE 1.5sle ClosedB GE 1.5sle OpenC GE 1.5sle ClosedC GE 1.5sle Open
Table A1 Noise Reduction Open
0
5
10
15
20
25
30
10 12.5 16 20 25 311/3 Octave Ban
1/3OctaveBandNoiseReduction,dB
Fig. 19—One-third octave band interior noise redu
0
5
10
15
20
25
30
10 12.5 16 20 25 311/3 Octave Ban
1/3OctaveBandNoiseReduction,dB
House A Bedroom - Siemens SWTHouse B Bedroom - GE 1.5 SLEHouse C Bathroom - GE 1.5 SLETable A.2 Noise Reduction- Windows O
Fig. 20—One-third octave band interior noise redu
-+.......
Noise Control Eng. J. 59 (2), March-April 2011
other sources of low frequency noises in homes,such as refrigerators or external traffic orairplanes.
In accordance with the above findings, and inconjunction with our extensive literature search of
terior measurements.
16 Hz 31.5 Hz 63 Hz 125 Hz5 6 16 144 3 12 1220 22 22 2713 17 18 2113 14 19 178 13 17 143 6 9 9
0 50 63 80 100 125 160nter Frequency, Hz
House A Bedroom - Siemens SWTHouse B Bedroom - GE 1.5sleHouse C Bathroom- GE 1.5sleTable A.2 Noise Reduction- Windows OpenAvg of Hubbard (1991)- Window Closed
—Windows closed.
0 50 63 80 100 125 160nter Frequency, Hz
—Windows open.
—In
.5 4d Ce
ction
.5 4d Ce
pen
155
scientific papers and reports, there should be noadverse public health effects from infrasound or lowfrequency noise at distances greater than 305 meters�1,000 feet� from the wind turbine types measured: GE1.5sle and Siemens SWT 2.3-93.
7 ACKNOWLEDGMENTS
Acknowledgement is made to NextEra EnergyResources, LLC (“NextEra”), formerly FPL Energy,for providing financial support for the study, allowingaccess to the wind farm, and supplying critical opera-tional data. Epsilon determined all means, methods,and the testing protocol without interference or direc-tion from NextEra. No limitations were placed onEpsilon by NextEra with respect to the testing protocolor upon the analysis methods; the conclusions are thoseof the authors.
8 APPENDIX: HOME NOISE REDUCTIONUSED TO DETERMINE EQUIVALENTOUTDOOR SOUND PRESSURELEVEL CRITERIA BASED ON INDOORCRITERIASince indoor measurements are not always possible,
for comparison to outdoor sound levels the indoorcriteria from ANSI/ASA S12.2 should be adjusted.Outdoor to indoor low frequency noise reductions havebeen reported by Sutherland for aircraft and highwaynoise for open and closed windows9 and by Hubbardand Shepherd for aircraft and wind turbine noise forclosed windows10. Table A1 presents the average lowfrequency octave band noise reductions from outdoorto indoors from these two papers for open and closedwindows. Sutherland only reported values down to63 Hz; whereas Hubbard and Shepherd presented valuesto less than 10 Hz. The closed window conditions of Ref.10 were used to estimate noise reductions less than 63 Hzby applying the difference between values for open andclosed windows from Ref. 9 data at 63 Hz. It should benoted that the attenuation for wind turbines in Ref. 10 isbased on only three homes at two different wind farms,whereas the traffic and aircraft data are for many homes.The wind turbine open window values were determinedfrom the wind turbine closed window values by subtract-ing the difference in values between windows closed andopen obtained by Ref. 9.
To be conservative, we use the open window caseinstead of closed windows except for the adjustmentsto the Japanese guideline which specifically called forclosed windows. To be further conservative, we use thewind turbine noise reduction data in Ref. 10 (adjustedto open windows). However, it should be noted that it is
156 Noise Control Eng. J. 59 (2), March-April 2011
possible for some homes to have some slight amplifi-cation at low frequencies with windows open due topossible room resonances.
The average one-third octave band noise reductionsused to determine equivalent outdoor one-third octaveband criteria were determined in a similar manner. Thefirst row of Table A2 and Fig. 20 present the averageone-third octave band noise reductions values forwindows open that were used to determine the equiva-lent outdoor one-third octave band criteria levels inTable 7 from the indoor criteria. The second row ofTable A2 and Fig. 19 presents the one-third octave bandnoise reductions for windows closed determined byRef. 10 for homes exposed to wind turbine sounds—these higher closed window noise reduction valueswere only used to determine equivalent outdoor levelsfor determining the equivalent Japanese guidanceone-third octave band sound pressure level values fordealing with complaints of mental and physicaldiscomfort from environmental sounds.
9 REFERENCES
1. “American National Standard Criteria for Evaluating RoomNoise”, American National Standards Institute ANSI/ASAS12.2-2008, Acoustical Society of America, (2008).
2. “American National Standard Quantities and Procedures forDescription and Measurement of Environmental Sound—Part4: Noise Assessment and Prediction of Long-term CommunityResponse”, American National Standards Institute ANSI S12.9-2005/Part 4, Acoustical Society of America, (2005).
3. “International Electrotechnical Vocabulary—Chapter 801:Acoustics and Electroacoustics”, International Standard IEC60050-801:1994, International Electrotechnical Commission,(1994).
4. Geoff Leventhall, “A Review of Published Research on LowFrequency Noise and its Effects”, Report for Department forEnvironment, Food, and Rural Affairs, DEFRA, (2003).
5. H. Moeller and C. S. Pedersen, “Hearing at Low and InfrasonicFrequencies”, Noise Health, 6(23), 37–57, (2004).
6. “Acoustics—Normal equal-loudness-level contours”, Interna-tional Standard ISO 226:2003, International Organization forStandardization, (2003).
7. T. Watanabe and H. Moeller, “Low Frequency Hearing Thresh-olds in Pressure Field and in Free Field”, Low Freq. Noise, Vibr.,Act. Control, 9(3), 106–115, (1990).
8. “American National Standard Quantities and Procedures forDescription and Measurement of Environmental Sound—Part5: Sound Level Descriptors for Determination of CompatibleLand Use”, American National Standards Institute ANSI/ASAS12.9-2007/Part 5, Acoustical Society of America, (2007).
9. L. C. Sutherland, “Indoor Noise Environments Due to OutdoorNoise Sources”, Noise Control Eng. J., 11(3), 124–137, (1978).
10. Harvey H. Hubbard and Kevin P. Shepherd, “Aeroacoustics oflarge wind turbines”, J. Acoust. Soc. Am., 89(6), 2495–2508,(1991).
11. “Guidelines for Community Noise”, Edited by Birgitta Ber-glund, Thomas Lindvall and Dietrich H. Schwela, World HealthOrganization, (1999).
12. B. Berglund and T. Lindvall, “Community Noise”, Center forSensory Research, (1995).
13. Andy Moorhouse, David Waddington and Mags Adams, “Pro-posed criteria for the assessment of low frequency noise distur-bance”, UK Department for Environment, Food, and Rural Af-
fairs, DEFRA NANR45 Project Report, University of Salsford,(2005).
14. Hayes McKenzie Partnership Ltd, “The Measurement of LowFrequency Noise at Three UK Wind Farms”, http://www.berr.gov.uk/files/file31270.pdf, UK Department of Tradeand Industry (DTI) contract number: W/45/00656/00/00, Lon-don, UK, (2006).
15. Japan Ministry of the Environment, “Handbook to Deal withLow Frequency Noise (2004)”, Government of Japan, 2004,available from www.env.go.jp/air/aq/low_noise2004/.
16. Kenji Kamigawara, “Community Responses to Low FrequencyNoise and Administrative Actions in Japan”, InterNoise03,(2003).
17. Geoff Leventhall, “Infrasound from Wind Turbines—Fact, Fic-tion or Deception”, Can. Acoust., 34(2), 29–36 (2006).
18. Kaj Dam Madsen and Torben Holm Pedersen, “Low FrequencyNoise from Large Wind Turbines. Final Report”, DELTA, Hor-sholm, Denmark, EFP-06 Project prepared for Danish EnergyAuthority, report AV 1272/10, www.delta.dk, (2010).
19. “Government statement regarding the findings of the SalfordUniversity report into Aerodynamic Modulation of Wind Tur-bine Noise”, http://www.berr.gov.uk/files/file40571.pdf, (2007).
20. Brian Howe, “Wind Turbines and Infrasound”, Prepared for theCanadian Wind Energy Association by Howe Gastmeier Chap-nik Limited (HGC Engineering), (2006).
21. William J. Gastmeier and Brian Howe, “Recent Studies of Infra-sound from Industrial Sources”, Can. Acoust., 36(3), 58–59,(2008).
22. N. A. A. Castelo Branco and M. Alves-Pereira, “VibroacousticDisease”, Noise Health, 6(23), 3–20, (2004).
23. Malcolm Hayes, “Low Frequency and Infrasound Noise Immis-
Noise Control Eng. J. 59 (2), March-April 2011
sion from Wind Farms and the potential for Vibro-Acoustic dis-ease”, Second International Conference on Wind Turbine Noise,(2007).
24. Malcolm Hayes, “Low Frequency and Infrasound Noise Immis-sion from Wind Farms and the potential for Vibro-Acoustic dis-ease”, Wind Farm Noise, www.hayesmckenzie.co.uk, (2008).
25. “Expert Review of the Vieques Heart Study Summary Reportfor the Vieques Heart Study Expert Panel Review”, http://www.atsdr.cdc.gov/news/viequesheartreport.html, Prepared forThe (U. S.) Agency for Toxic Substances and Disease Registry,(2001).
26. “Le retentissement du fonctionnement des éoliennes sur la santéde l’homme” (“Repercussions of wind turbine operations on hu-man health”), http://ventdubocage.net/documentsoriginaux/sante/eoliennes.pdf, (2006).
27. Chantal Gueniot, “Wind Turbines: The Academy Cautious”,Panorama du Médecin, (2006).
28. “Impacts sanitaires du bruit généré par les éoliennes” (“Thehealth impacts of noise generated by wind turbines”), AgenceFrancaise de securite Sanitaire de l’Environnementet du Tra-vaile (Agency for Environmental and Occupational HealthSafety) (AFSSET), (2008). http://www.afsset.fr/upload/bibliotheque/978899576914371931356311364123/bruit_eoliennes_vdef.pdf.
29. Wind Turbines—Part 14: Declaration of apparent sound powerlevel and tonality values, International Standard IEC TS 61400-14:2005, International Electrotechnical Commission, (2005).
30. American National Standard Specification for Sound LevelMeters, American National Standards Institute ANSI S1.4-1983, (1983).
157