Embed Size (px)
Citation preview

O.S. Ismail and and C.I. Chukwuemeka: Flame Detection and Suppression System for Petroleum Facilities
WIJE, ISSN 0511-5728; http://sta.uwi.edu/eng/wije/
41
Flame Detection and Suppression System for Petroleum Facilities
Olawale S. Ismail a,Ψ and Chimsom I. Chukwuemekab
Department of Mechanical Engineering, Faculty of Technology, University of Ibadan, Ibadan, Nigeria aE-mail: [email protected]
bE-mail: [email protected]
Ψ Corresponding Author
(Received 04 November 2014; Revised 02 July 2015; Accepted 30 July 2015)
Abstract: An adaptive model for fire (flickering flame in the infrared region) detection and subsequent suppression is
presented. The model applies a Pyro-electric Infrared sensor (PIR)/Passive Infrared Detector (PID) for infrared fire
detection. Sample analog signals were generated and simulated within the framework of the modeled PIR sensor/PID. The
signals were modeled around the flame flicker region (1-13Hz) and outside the region. A Joint Time Frequency Analysis
(JTFA) function was applied to model the Digital Signal Processing (DSP). This involved extraction of fire and non-fire
features from the sample signals. A Piecewise Modified Artificial Neural Network (PMANN) and the Intraclass Correlation
Coefficient (ICC) were employed in the decision framework. The PMANN generated polynomials which analysed and
‘memorised’ the signals from DSP. The ICC further categorised cases as 'fire' or 'non-fire' by comparing data from the
PMANN analyses. In cases of detected fire, valves to several fire suppression systems (like water sprinklers and foam
injection lines) can be opened. Hence, the Solenoid Hydraulic Valve was modelled to be controlled by a Proportional
Integral Derivative Controller (PIDC). The whole model of detection and suppression can be further developed, studied and
subsequently implemented.
Keywords: Flame detection, passive infrared detector, digital signal processing, artificial neural networks, fire suppression
1. Introduction
Petroleum facilities, also known as oil and gas storage
facilities are sites where combustible/flammable liquids
are received from shipping vessels, pipelines, tankers
etc. These products can be stored or blended in bulk for
the purpose of distribution by tankers, pipelines and
other methods of transfer and transportation. From this
definition, one expects the observation of very high
safety standards on such sites to prevent loss of any kind
especially by fire. Despite the progress made in the
design and installation of safety facilities for oil storage
sites, they remain one of the most hazardous places on
earth. Late detection and/or suppression of fires are
among the primary reasons why little fire outbreaks
leads to major oil storage site fire disasters. Two studies
on petroleum facilities (Persson and Lonnermark, 2004
and James and Cheng-Chung, 2006) listed the following
as the main causes of fire outbreaks in oil and gas
storage sites: lightning, maintenance error, operational
error, sabotage, equipment failure, crack and rupture,
static electricity, leak and line rupture, open flames,
natural disasters and runaway reactions. The results
show that most fires in these storage sites primarily
affect the tanks, with lightening being the main cause of
fire outbreaks.
Even though many problems can be traced to fire
outbreaks in oil storage sites, usually their spread is
associated with low quality engineering. A model
solution is proposed to the problem of early detection
and automatic suppression. This particular problem is
most rampant in oil and gas storage sites in local Nigeria
as well in some other developing nations. Although
several enhanced fire prevention/fighting engineering
mechanisms are already being employed to mitigate this
problem, research and development of new and better
ones still continue. This work is just another window
into that wide field of research.
2. Related Work
The use of fire detection systems incorporated with fire
suppression started with Philip W. Pratt of Abington, in
1872 (“Automatic fire suppression,” 2015, para 2). He
patented the first automatic sprinkler system. Thus, there
was a detection system in his design that automatically
actuated the sprinklers. Generally, from the anatomy of
fire, represented by Equation (1). There are four (4)
main areas of fire detection: smoke, gas (like CO2, CO,
H2S, etc.), heat and light. The light emitted cover both
the infrared and ultraviolet regions.
Conventional smoke detectors typically detect the
presence of certain particles generated by smoke and fire
by ionization or photometry. An important weakness of
such detectors is that the smoke has to reach the sensor.
For heat detectors, the heat must be sufficient enough to
activate the heat sensor. This may take a significant
ISSN 0511-5728 The West Indian Journal of Engineering
Vol.38, No.1, July 2015, pp.41-51
(1)
O.S. Ismail and and C.I. Chukwuemeka: Flame Detection and Suppression System for Petroleum Facilities
WIJE, ISSN 0511-5728; http://sta.uwi.edu/eng/wije/
42
amount of time to issue an alarm. The time delay can
cause an uncontrollable fire to develop. Therefore, it is
not possible to use them in open spaces. For UV
detectors, they are plagued by many false alarm signals,
which reduce their reliability (Nolan, 1996). With
minimal and controllable false alarms (using
sophisticated detection algorithms), infrared detection
remains the most reliable.
Several detection algorithms have been applied over
time in the area of infrared flame detection. Some of the
prominent algorithms include the statistical analysis of
the apparent source of the heat of fires (Zhu et al, 2008)
at a near infrared zone. After tests and experimentations,
it was concluded that the detector functioned well for
open flames, producing very few false alarms, while
smoldering fires were hardly detected, since there was
no direct radiation to the detector. They were only
detected when they had direct radiation. Several
Advanced Very High Resolution Radiometer (AVHRR)
fire detection algorithms were reviewed in another study
(Li et al 2000). The study aimed at uncovering their
principles of operation and limitations, while also
making possible recommendations for improvement.
Moreover, an adaptive method for hydrocarbon
flame detection was developed using a Joint Time
Frequency Analysis (JTFA) functions for Digital Signal
Processing (DSP) and Artificial Neural Network for the
decision mechanism (Javid et al., 2008). The JTFA
functions used were the Short Time Fourier Transform
(STFT) and The Fast Fourier Transform (FFT), with the
Hamming Window function applied to narrow the
coefficients to a particular range. That study gave
convincing results and was eventually developed into a
marketable practical application. Furthermore, using the
Markov Model decision algorithm and Lagrange wavelet
filter banks to extract fire features from signals recorded
by pyro-electric infrared sensors, a fire detector was
modeled which could easily detect fire within the
flickering flame frequency (Fatih et al., 2012). Out of
220 fire test sequences, they recorded 3 false alarms and
217 correct alarms. Each detection had a response time
of 77seconds.
Some of the most prominent suppression systems
include fire water distribution systems, sprinkler
systems, water spray and deluge systems, water flooding
systems, fire water control and isolation valves (Nolan,
1996). In developing countries (e.g. Nigeria), the
pipelines supplying water or other fire suppression
liquids to these systems contain manually operated
valves. This slows down the process of suppression
during emergencies. However, by applying
automatically actuated valves as proposed in this work,
it will ease the fire suppression process. Proportional
Integral Derivative Controllers (PIDC) has been applied
in many areas to automatically actuate valves. Some of
the applications include the study of The Position
Control System of a hydraulic cylinder based on
microcontrollers (Munaf, 2008). Using the MATLAB
software, a PIDC in connection to the hydraulic valve
was simulated. The purpose was to use the controlling
mechanism of the PIDC to cause the cylinder to function
automatically. Besides, pneumatic actuator systems were
designed and controlled using PIDCs and valves (Lai et
al., 2012). The pneumatic systems, being non-linear,
were controlled using linear control mechanisms like
PID controllers and valves.
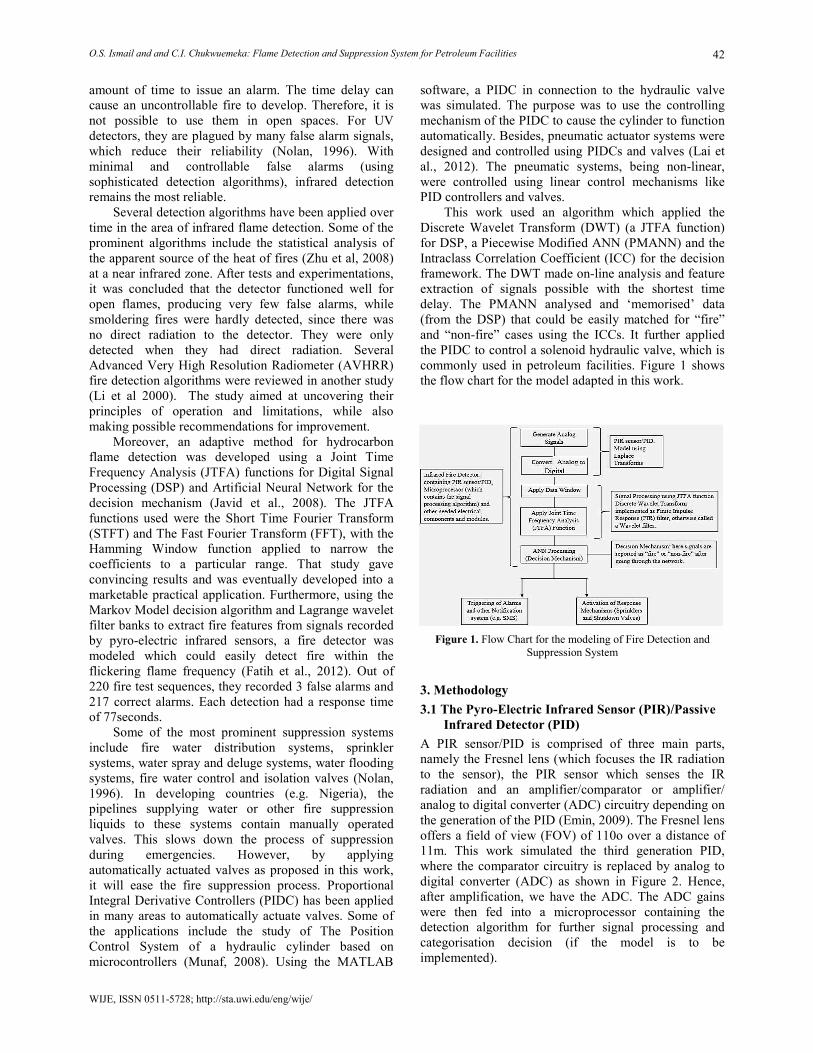
This work used an algorithm which applied the
Discrete Wavelet Transform (DWT) (a JTFA function)
for DSP, a Piecewise Modified ANN (PMANN) and the
Intraclass Correlation Coefficient (ICC) for the decision
framework. The DWT made on-line analysis and feature
extraction of signals possible with the shortest time
delay. The PMANN analysed and ‘memorised’ data
(from the DSP) that could be easily matched for “fire”
and “non-fire” cases using the ICCs. It further applied
the PIDC to control a solenoid hydraulic valve, which is
commonly used in petroleum facilities. Figure 1 shows
the flow chart for the model adapted in this work.
Figure 1. Flow Chart for the modeling of Fire Detection and
Suppression System
3. Methodology
3.1 The Pyro-Electric Infrared Sensor (PIR)/Passive
Infrared Detector (PID)
A PIR sensor/PID is comprised of three main parts,
namely the Fresnel lens (which focuses the IR radiation
to the sensor), the PIR sensor which senses the IR
radiation and an amplifier/comparator or amplifier/
analog to digital converter (ADC) circuitry depending on
the generation of the PID (Emin, 2009). The Fresnel lens
offers a field of view (FOV) of 110o over a distance of
11m. This work simulated the third generation PID,
where the comparator circuitry is replaced by analog to
digital converter (ADC) as shown in Figure 2. Hence,
after amplification, we have the ADC. The ADC gains
were then fed into a microprocessor containing the
detection algorithm for further signal processing and
categorisation decision (if the model is to be
implemented).

O.S. Ismail and and C.I. Chukwuemeka: Flame Detection and Suppression System for Petroleum Facilities
WIJE, ISSN 0511-5728; http://sta.uwi.edu/eng/wije/
43
Figure 2. Third Generation PID circuitry for capturing analog signals and converting them to digital signals
Such a sensor/detector can be modeled as a
capacitor with capacitance Cd with a Poly-Vinylidene
Fluoride (PVDF) film as the dielectric with thickness d
and surface area A (Odon, 2010). When IR radiation of
power Φ(t), varying in time is incident on the active
surface of the PIR sensor, an electric charge q(t) is
generated. This is transferred as a signal with
information content either as voltage V(t) on the detector
electrodes or current Ip(t) flowing through the low load
resistance of the detector output. Converting IR radiation
into an electric signal is done in 3 stages: converting
radiation power Φ(t) to thermal change on the sensor
surface i.e. temperature ∆T(t), the second stage is the
thermal to electric conversion i.e. ∆T(t) to Ip(t), and the
last stage is the current to voltage signal conversion i.e.
Ip(t) to V(t). The PID detects infrared radiations from
several sources within its range or field of view.
From automatic control theory, the procedures for
the creation of block diagrams for simulation involves
connecting the block transfer function in series, where
series connection implies multiplication. For our model,
we arranged them in the order: GT(s) (radiation to
thermal), GTIp(s) (thermal to electrical) and GIpV(s)
(electrical to voltage), describing properties of the
appropriate signal conversion stage. Hence, the
equivalent transfer function is expressed as Equation (2)
and a schematic of the process is shown in Figure 3:
G(s) = GT(s) × GTip(s) × GIpV(s) (2)
A Laplace transfer function was developed for the
simulation, expressed as Equation (3) (Odon, 2010):
where p is the pyro-electric coefficient, ƞ-absorption
coefficient of radiation, R-equivalent resistance, C-
equivalent capacitance, d-thickness of PVDF film, c
prime-volume specific heat, -thermal time constant
and -electric time constant. Using values for a
standard detector with small PVDF thickness, sample IR
radiations around the flickering flame frequency (1-
13Hz), and also far from it, were generated and
simulated on the MATLAB/SIMULINK software as
shown in Figure 4. The values for the various parameters
were obtained from standard values for PVDF IR sensor
(Piezo Film Sensors Technical Manual by Measurements
Specialties Inc.) and from other test results (Odon,
2010). The values of parameters for the PVDF PIR
sensor/PID are outlined in Table 1.
Figure 3. Schematic Diagram for Conversion of IR radiation to
Voltage Signal

O.S. Ismail and and C.I. Chukwuemeka: Flame Detection and Suppression System for Petroleum Facilities
WIJE, ISSN 0511-5728; http://sta.uwi.edu/eng/wije/
44
Figure 4. MATLAB/SIMULINK block for sample flickering flame signal (13Hz)
Table 1. Parameters for the PVDF PIR sensor/PID
Name Value Unit
Pyro-electric coefficient p 3×10⁻⁶ C/cm2.K
Volume specific heat c’ 2.4 J/cm3.K
Permittivity ε 106×10-14 F/cm
PIR film thickness d 25 Mm
Thermal conductivity gth 0.00135 W/cmK
Detector active surface A 132×10-2 Cm2
PIR detector Capacitance Cd 560 pF
Amplifier input capacitance CL Negligible pF
Amplifier input resistance RL 10 MΩ
Absorption coefficient of radiation η 1 -
Electrical time constant of detector-amplifier circuit τe 0.0056 S
Thermal time constant τth 0.0110 S
3.2 The Detection Algorithm
3.2.1 Digital Signal Processing
The digital signal processing algorithm was developed
using the Discrete Wavelet Transform (DWT) JTFA
function implemented in real-time as wavelet filters
(Schneiders, 2001). The signals were first passed
through a window function (the Hamming window) to
attenuate the input signal, thereby reducing spectral
leakage and causing the signal to be more periodic. A
window length of 256 was chosen. This is advantageous
since it reduces the response time of the detection
mechanism by two (Javid et al., 2008). The window
function is expressed as in Equation (4) (Robert, 2012),
With a 256 window length, a Nyquist sampling
frequency of 50Hz was chosen. The flickering flame
frequency of 13Hz (Fatih et al., 2012) was used as the
cutoff frequency. The Nyquist sampling frequency is
determined from fs ≥ 2 (cutoff frequency). Applying the
formula, we get 26Hz as our sampling frequency. But a
50Hz sampling frequency was chosen to widen the
frequency range in order to obtain a better sampled
signal.
For real signals, only half of the number of samples
(the same as the window length) contains essential
information without redundancy. Hence, using
Rayleigh’s Limit (Robert, 2012), the frequency
resolution is expressed as Equation (5), which becomes
Equation (6) for the signals:
Real-time wavelet filters are defined by their
Quadrature Mirror Filters (QMF) used for DWT. QMFs
are perfect reconstruction filter banks where the
calculation of coefficients for the filters at all levels is

O.S. Ismail and and C.I. Chukwuemeka: Flame Detection and Suppression System for Petroleum Facilities
WIJE, ISSN 0511-5728; http://sta.uwi.edu/eng/wije/
45
seen as making an orthonormal (orthogonal and
normalised) projection onto a new base. These filters
banks contain highpass (H) and lowpass (L) filters of
length N+1 (Schneiders, 2001), where N is the number
of points or filter order which is the same as window
length.
Depending on the number of levels, denoted as P,
the analysis filter was applied to the input signal to
calculate coefficients for the first level. Using N old
input points, the coefficient was then calculated for the
next level. Hence, the total number of old input samples
needed for computation of a new coefficient at a certain
decomposition level is defined by Equation (7)
(Schneiders, 2001):
where i is the decomposition level varying between
1 and the maximum, P, and N the order of the original
filters. From this point, coefficients were obtained as the
output at each level. This way made on-line analysis and
feature extraction possible with the shortest time delay
for each decomposition level. This is good for real time
situations like flickering flames and other radiation
emitting objects. Such structure was built on the
MATLAB software. The code produced a filter matrix
A, which was implemented as discrete (Finite Impulse
Response) FIR filter block on MATLAB/SIMULINK.
Since all coefficients are updated at every sample hit, the
time resolution increased. Hence, for filter structure as a
wavelet analyser the time resolution is expressed as
Equation (8) (Schneiders, 2001):
The time-resolution is equal to the sample time of
the system. For the DWT perfect reconstruction multi-
resolution tree the frequency resolution is a function of
the decomposition level P expressed as Equation (9)
(Schneiders, 2001):
Using the values for sampling frequency and
frequency resolution, the time resolution was determined
and decomposition level was set to be = 0.02s and P
= 6 as shown below.
And from Equation (6), we had
Using N=256 points, the filter lengths were
calculated as: L = H = N + 1 = 256 + 1 = 257
Substituting the values for the number of points N,
filter lengths for the highpass (H) and lowpass (L) filters
and the decomposition level P into our MATLAB code
generated the needed coefficients. These coefficients
were substituted into the Finite Impulse Response (FIR)
filter block on MATLAB/SIMULINK software, as
shown in Figure 5. Hence, the block was renamed
‘Wavelet Filter’. The coefficients obtained are given in
the matrix A.
A = 0.00, 2.82, 0.00, 0.00, 0.00, 0.00
The digital signal processing as described here
ensures that specific features of the signal are extracted,
so that false alarms can be reduced to the barest
minimum.
Figure. 5 MATLAB/SIMULINK block for sample flickering flame signal (13Hz)

O.S. Ismail and and C.I. Chukwuemeka: Flame Detection and Suppression System for Petroleum Facilities
WIJE, ISSN 0511-5728; http://sta.uwi.edu/eng/wije/
46
3.2.2 The Decision Mechanism
An Artificial Neural Network (ANN) algorithm and the
Intraclass Correlation Coefficient (ICC) constituted the
decision rule. Previous research employed neurons and
several complex scaling parameters to classify the
network and get the desired output (Javid et al., 2008).
The use of neurons for ANN is very difficult and
complex. Hence, in this model neurons were not used.
Instead the algorithm made use of polynomial
approximations or the Least Squares approximation
method, whereby polynomial equations were generated
to establish a link between the input and the output
(Chukwuka, 2014).
For this algorithm, the input parameters were
distributed into the network, rather than lumping them
into the network. Lumping the inputs into the network
creates several errors while distributing them reduces
these errors (Chukwuka, 2014). Four (4) distributions
were made, which generated four equations resulting in
a Piecewise Modified ANN (PMANN). Figures 6 and 7
are the algorithm flow charts.
The polynomial generated for our own case is
expressed as Equation 12 (Chukwuka, 2014):
where k is the number of inputs being considered. For
the purpose of simulation k=3. But the network was
trained with the model flame flicker frequency (13Hz)
signal, so that it would be able to differentiate fire cases
from non-fire during simulation.
Let Wi be the input weights and Sfi their scaling
factor, and ai, bi, ci and di be the coefficients of each
input considered. The coefficients are expressed as in
Equation (13):
Figure 6. Flow Chart for proposed PMANN
Figure 7. Inputs and Outputs of the Neural Network
For this model and simulation, the weight was set to
be Wi = 1.0 and scaling factor to be Sfi = 0.01. This
simplified the scaling process, making the equations
easily evaluated within the framework of the network.
The coefficients obtained could be matched for ‘fire’ and
‘non-fire’ cases using simple statistical correlations like
the ICC. The algorithm was designed to receive inputs,
sort them out, adjust their parameters and compute the
expected result. The polynomial equations obtained from
the above analysis were logged into a MATLAB m-file.
The ensuing programme ran for different data sheets
containing signal coefficients from the DSP.
Using the Intraclass Correlation Coefficient (ICC),
data from the PMANN analysis are differentiated into
“fire” and “non-fire” cases. The ICC is used to quantify
the degree to which measurements with a fixed degree of
relatedness match each other in terms of quantitative
trait. Besides, this statistical analysis can be applied to
assess the consistency (or agreement) of quantitative
measurements made by different observers measuring
the same quantity. All these are classified as reliability
analysis. Hence, this method was applied to analyse the
data gotten from PMANN. The coefficients obtained
from the data of sample signals of frequency 2Hz, 50Hz
and 13Hz (fire signal) were matched against those of the
13Hz (fire signal) used for training.
For a perfect match, the scenario was recorded as
“fire” otherwise it was recorded as “non-fire”. This
analysis was carried out on the SPSS 16.0 software. The
results obtained were for the “class 2” or “two-way”
random single and average measures (consistency/
absolute agreement) ICC with a 95% confidence
interval. Here, the measurement raters are chosen at

O.S. Ismail and and C.I. Chukwuemeka: Flame Detection and Suppression System for Petroleum Facilities
WIJE, ISSN 0511-5728; http://sta.uwi.edu/eng/wije/
47
random. The reliability of the analysis is interpreted
between the lower and upper bound of the confidence
interval (see Figure 8).
Figure 8. SPSS ICC Reliability Analysis
3.2.3 Suppression Mechanism
The fire suppression response mechanism involved the
modeling of control valves. The aim was to come up
with a model that could be able to control (open/close)
fire suppression systems (foam injection lines, water
deluge lines, and water sprinkler lines, etc.), pipelines
and also active pumps. By using Proportional, Integral
and Derivative Controllers (PIDCs), we simulated the
control of an Active Hydraulic Device (ADH) such as
hydraulic proportional valves (Yong, 2009).
Under normal system operations in these sites,
pumps used for loading and unloading of petroleum
products are always running to keep business moving.
Also, fire pipelines for suppression systems are always
pressurised for emergency cases. These valves can be
connected at key places along these pipelines, such that
immediately this model detector senses fire, signals are
sent to these valves for prompt control as the case may
demand.
Developed out of the ineffectiveness of the
Proportional (P) and Proportional Derivative (PD)
controllers, the PIDCs are better in function and
response since they integrate the Proportional (P) and
Proportional Derivative (PD) controllers. They have
several applications, including use at oil and gas storage
sites.The conve ntional PID equation is expressed as
Equation (14) (Yong, 2009)
where e is the controller error, that is the deviation
of the process variable u(t) from its set point uo.
Constants KC, Ti and Td are, respectively, the
proportional gain, integral time and derivative time
constants of the PIDC. They represent the characteristics
of the controller. The Laplace transfer function is
expressed as in Equation (15) (Katsuhiko, 2010).
In determining the values for Kc, Ti and Td for
simulation, the Zeigler-Nichols method of tuning PIDCs
was used (Katsuhiko, 2010). The method has two (2)
approaches, the process reaction method and continuous
cycling method. For the model, the process reaction
method was applied.
This is based on the assumption that the open-loop
step response of most process control systems has an S-
shape, called the process reaction curve. It is
characterised by two (2) constants, the delay time L and
time constant T. For the PIDC Kc = 1.2T/L, Ti = 2L and
Td = 0.5L. Substituting these into Equation (16), the
Laplace transfer function becomes
Generally, the control system makes the hydraulic
device active. So, the head-discharge relationship of an
AHD is usually dynamically modified via its control
system to change the opening or closing of its control
valve. The generalised dynamic characteristics of an
AHD are expressed as Equation (17) (Yong, 2009):
where Y corresponds to the solenoid of a hydraulic
proportional valve. Electric signals from a PIDC are
directed to the solenoid to either open/close the valve. Q
is flow rate and H is the head.
The solenoid of the hydraulic valve was assumed to
have first order dynamics (Roland, 2001) expressed by
Equation 18:
Using standard manufacturer values for a PIDC
(Munaf, 2008), the hydraulic proportional valve was
simulated on MATLAB/SIMULINK interface as shown
in Figure 9.
Figure 9. MATLAB SIMULINK block diagram for Hydraulic
Valve Response

O.S. Ismail and and C.I. Chukwuemeka: Flame Detection and Suppression System for Petroleum Facilities
WIJE, ISSN 0511-5728; http://sta.uwi.edu/eng/wije/
48
The values were varied to get different responses for
the same hydraulic valve constant (Munaf, 2008):
Kc = [5, 5, 2], Ti = [5, 1, 1], Td = [2, 1, 2] and valve
constant Kv = 1.0
Changing Ti from the valve dynamic equation also
changed its response to the PIDC. Generally, signal flow
through the whole model is as shown in Figure 10.
Figure 10. Signal Flow for whole model
4. Results and Discussion
Figures 11, 12 and 13 were obtained after infrared
signals modeled at the flickering frequency (13Hz), and
other frequencies for example 2Hz and 50Hz were
simulated using the MATLAB/SIMULINK block for the
PIR sensor/PID, respectively.
Figure 11. PIR Sensor/PID Output for fire at 13Hz
Figure 12. PIR Sensor/PID Output for radiation at 2Hz
Figure 13. PIR Sensor/PID Output for radiation at 50Hz
From these figures, the difference among the
various radiations can easily be seen. A step function,
sequence interpolator and pulse generator (see Figure 4)
were added together to generate the IR analog signals.
This accounted for the oscillatory nature of the graphs.
The fire radiation produced higher values (from -3 and 3
V) for voltage responsivity. If the model is to be
implemented, the voltages are fed into a microcontroller
with the Digital Signal Processing algorithm (DSP). A
similar case was achieved when the voltages were fed
into the MATLAB/SIMULINK interface containing the
corresponding DSP blocks discussed earlier (Figure 4).
For a Hamming window length of N = 256 and
wavelet filter implemented on SIMULINK as a discrete
Finite Impulse Response (FIR) filter block, the 256
samples (or coefficients) considered by the window
function were filtered and the recorded samples
narrowed down to 52 samples (or coefficients). This
further fine-tuned the detection process, for the results of
the signal processing for a simulation time of 10
seconds. After DSP, each signal produced coefficients
which were fed into the PMANN for the decision
mechanism.
Out of the 52 samples (or coefficients) produced by
the DSP algorithm, 18 were used in the training of the
network (these contains recorded information i.e. non-
zero samples as seen from Figures 14, 15 and 16). The
other 34 samples (or coefficients) could be rounded
up/down to zero; hence, they were not needed for the
training. The DSP output from the model fire signal
(13Hz) was our measured and expected output.
Therefore, it was used to train our network. After
training and classification, the other signals (2Hz and
50Hz) were then passed through the network for
analysis. Below are the results for the training and
analysis.
The blue graph is the expected (measured) output of
PMANN, while green is graph for the signal under
analysis (predicted). Figure 17 shows the training of the
network, hence, perfect match between the predicted and
measured. While Figures 18 and 19 are the results of the
analysis.

O.S. Ismail and and C.I. Chukwuemeka: Flame Detection and Suppression System for Petroleum Facilities
WIJE, ISSN 0511-5728; http://sta.uwi.edu/eng/wije/
49
Figure 14. Radiation at 2Hz after DSP
Figure 15. Radiation at 50Hz after DSP
Figure 16. Fire Radiation after DSP
Figure 17. PMANN training of signal at 13Hz (ideal, hence the
perfect match of both graphs)
Figure 18. PMANN analysis of signal at 2Hz
Figure 19. PMANN training of signal at 50Hz
Using the ICC, the samples (or coefficients) were
analysed and decisions were made for “fire” and “non-
fire” scenarios. Tables 2, 3 and 4 explain the decision
rule. Our estimated reliability between the 13Hz sample
signal and fire training signal gave 1, with 95% CI
(1.00), which matches exactly. Hence, such a scenario is
is recorded “fire” (see Table 2). As indicated in Table 3,
our estimated reliability between the 2Hz sample signal
and fire training signal gave an average of 0.004, with
95% CI (-1.660, 0.627), which is a miss-match. Hence,
such a scenario is recorded “non-fire”. Moreover, Table
4 shows that our estimated reliability between the 50Hz
sample signal and fire training signal is an average of
0.144, with 95% CI (-1.222, 0.670), which is a miss-
match. Hence, such a scenario is recorded “non-fire”.
If the model is to be implemented in real life using
appropriate electrical equipment, the detection
mechanism will record only real FIRE cases, and send
electric signals to the suppression valves. For the control
of valves along suppression systems pipelines, the model
hydraulic solenoid valve responded perfectly as expected
in real life.
Figure 20 obtained was consistent with that obtained
through experiments. Three cases of the PIDC are
studied. The stepwise input simulated the digital nature
of real life signals. The graphs perfectly correspond to a
device connected to a PIDC under the Zeigler-Nichols’
Process Reaction method of tuning, where the delay time

O.S. Ismail and and C.I. Chukwuemeka: Flame Detection and Suppression System for Petroleum Facilities
WIJE, ISSN 0511-5728; http://sta.uwi.edu/eng/wije/
50
(L) is common for all the controllers and the time
constant (T1, T2, T3) can be calculated from the slope of
the graph for each PIDC. Hence, it will perfectly control
depending on the nature of the pipeline to which it is
connected to. From the graph, the ‘PID’ controller gives
a normal forward control or open-loop control whereby
the valves open and close. It is the most suitable PIDC
for this application. Controllers ‘PID1’and ‘PID2’, gave
results for closed-looped control systems. Such systems
experience some measure of damping (represented by
the zigzag portion of the graphs). The damping is due to
feedback and feed forward mechanisms as the PIDC
tries to eliminate error. From the graph ‘PID1’ and
‘PID2’ have damping amplitudes (or ratios) within the
range of 0.2-0.3, which are within the Zeigler-Nichols
range of 0.21-4.0 (Roland, 2001).
Table 2. Intraclass Correlation Coefficient for 13Hz Sample Signals (e.g. open fires)
13Hz Sample Signal Intraclass
Correlation
95% Confidence Interval (CI) F Test with True Value 0
Lower Bound Upper Bound Value df1 df2 Sig
Single Measures 1.000 1.000 1.000 1.946E19 18 18 0.000
Average Measures 1.000 1.000 1.000 1.946E19 18 18 0.000
Table 3. Intraclass Correlation Coefficient for 2Hz Sample Signals (radiations from sources like Humans)
2Hz Sample Signal Intraclass
Correlation
95% Confidence Interval (CI) F Test with True Value 0
Lower Bound Upper Bound Value df1 df2 Sig
Single Measures 0.002 -0.454 0.457 1.004 17 17 0.497
Average Measures 0.004 -1.660 0.627 1.004 17 17 0.497
Table 4. Intraclass Correlation Coefficient for 50Hz Sample Signals (background radiations)
50Hz Sample Signal Intraclass
Correlation
95% Confidence Interval (CI) F Test with True Value 0
Lower Bound Upper Bound Value df1 df2 Sig
Single Measures 0.078 -.379 0.504 1.168 18 18 0.373
Average Measures 0.144 -1.222 0.670 1.168 18 18 0.373
Figure 20. Hydraulic Proportional Valve Response.
5. Conclusion
An adaptive model for fire detection and suppression
system has been discussed with emphasis on automatic
fire detection and controlled suppression mechanism.
First, the sensor was modeled using Laplace transforms
and the fire signal detection mechanism was modeled
using the Hamming window function and discrete
wavelet transforms. Then using a PMANN and ICC as
the decision rule, our detector could differentiate
between fire and non-fire radiations. Using model
equations of a PIDC and the standard dynamic equation
for a proportional hydraulic solenoid valve, with valve
constant being unity, the suppression mechanism was
studied and simulated.
The results shows that under normal conditions the
valve will control suppression systems (e.g. water
sprinkler lines, foam injection lines and other similar fire
suppression methods) and close pump lines in case of
fire. We must note that sprinklers used in buildings are
temperature activated. These are different from those
used outside and in areas such as oil and gas storage
sites. In Nigeria, most sprinklers used in loading gantries
at oil and gas storage sites are perforated cone shape
extensions of fire water lines. The detector controlled
valves can be used to operate such sprinklers. Better
O.S. Ismail and and C.I. Chukwuemeka: Flame Detection and Suppression System for Petroleum Facilities
WIJE, ISSN 0511-5728; http://sta.uwi.edu/eng/wije/
51
approaches can still be used to devise more efficient
models to mitigate the devastating effects of fire in
petroleum storage sites.
References:
Chang, J.I., Cheng-Chung, L. (2006), “A study of storage tank
accidents”, Journal of Loss Prevention in the Process Industries
Vol. 19 pp. 51–59.
Chukwuka, G.M., Aderemi, O.A., and Obolo, M.O., (2014), “Oil
well characterization and artificial gas lift optimization using
neural networks combined with genetic algorithm”, Discrete
Dynamics in Nature and Society, Vol.2014, DOI:
http://dx.doi.org/10.1155/2014/289239
Emin B.S. (2009), Pyro-electric Infrared (PIR) Sensor Based
Event Detection, Unpublished MSc Thesis, Department of
Electrical and Electronics Engineering and the Institute of
Engineering and Sciences, Bilkent University.
Fatih, E., Toreyin, B.U., Soyer, E.B., Inac, I, Gunay, O., Kose, K.
and Cetin, E.A, (2012),“Wavelet based flickering flame detector
using differential PIR sensors”, Fire Safety Journal, Vol. 53, pp.
13-18.
Hamdan, Majed (Marv) and Gao, Zhuqiang (2007), A Novel PID
Controller for Pneumatic Proportional with Hysteresis,
Unpublished M.S. Thesis, Department of Electrical
Engineering, Cleveland State University.
Javid, J.H., Shankar, B.B, Alan, W. and Zvi, B., (2008), “An
adaptive method for hydrocarbon flame detection”, Neural
Networks, Vol. 21, pp. 398–405.
Lai, W.K., Rahmat, M.F., and Abdul Wahab, N., (2012),
“Modeling and controller design of pneumatic actuator system
with control valve”, International Journal on Smart Sensing and
Intelligent Systems, Vol. 5, No. 3, pp.624-644.
Li Z., Kaufman Y.J., Ichoku, C., Fraser, R., Trishchenko, A.,
Giglio, L., Jin, J. and Yu, X., (2000), A Review of AVHRR-
based Active Fire Detection Algorithms: Principles,
Limitations, and Recommendations, Canada Centre for Remote
Sensing, Ottawa, Canada, and NASA Goddard Space Flight
Center, Greenbelt, MD.
Munaf, F.B., (2008), “Position Control System of Hydraulic
Cylinder Based on Microcontroller”, Journal of Engineering and
Development, Vol. 12, No. 3.
Nolan, D.P, (1996), Handbook of Fire and Explosion Protection
Engineering Principles for Oil, Gas, Chemical, and Related
Facilities, 1st edition, Noyes Publications, USA.
Odon, A. (2010), “Modeling and simulation of the pyro-electric
detector using MATLAB/Simulink”, Measurement Science
Review, Vol.10, No. 6, pp.195-199.
Ogata, Katsuhiko (2010), Modern Control Engineering, 5th
edition, Prentice Hall, Upper Saddle River, New Jersey, USA.
Persson, Henry and Lönnermark, Anders (2004), Tank Fires:
Review of Fire Incidents 1951–2003, BRANDFORSK Project,
SP Swedish National Testing and Research Institute, , Boras,
Sweden.
Measurement Specialities, Inc, (1999), Piezo Film Sensors
Technical Manual , Forge Avenue, Norristown, PA, USA.
Robert, J.S. and Sandra, L.H, (2012), Fundamentals of Digital
Signal Processing Using MATLAB, 2 edition, Cengage
Learning, First Stamford Place, Stamford, USA.
Roland, S.B., (2001), Advanced Control Engineering, 1st edition,
Butterworth-Heinemann, Linacre House, Jordan Hill, Oxford,
UK.
Schneiders, M.G.E., (2001), Wavelets in Control Engineering,
Unblished Master’s Thesis, Faculty of Mechanical Engineering,
Dynamics and Control Technology, Eindhoven University of
Technology.
Wikipedia (2015), Automatic Fire Suppression, Accessed 25th
February 2015 from
http://en.wikipedia.org/wiki/Automatic_fire_suppression
Yong, Z.Q. (2009), Control of Pneumatic Systems for Free Space
and Interaction Tasks with System and Environmental
Uncertainties, Unpublished PhD Thesis (Mechanical
Engineering), Faculty of the Graduate School, Vanderbilt
University
Authors’ Biographical Notes:
Olawale Saheed Ismail is a lecturer at the Department of
Mechanical Engineering, University of Ibadan. He is presently on
Sabbatical leave at the Department of Civil Engineering,
University of Liberia, as a faculty contract staff with the USAID
program.
Chimsom. I. Chukwuemeka graduated from the Department of
Mechanical Engineering, University of Ibadan, Ibadan, Oyo State,
Nigeria.