Embed Size (px)
Citation preview
THIS REPORT CONTAINS ASSESSMENTS OF COMMODITY AND TRADE ISSUES MADE BY
USDA STAFF AND NOT NECESSARILY STATEMENTS OF OFFICIAL U.S. GOVERNMENT
POLICY
Date:
GAIN Report Number:
Approved By:
Prepared By:
Report Highlights:
Israel is almost completely dependent on imports to meet its grain and feed needs. In recent years, dried
distillers grains with soluble (DDGS) and corn gluten feed (CGF) imports have increased significantly.
In MY 2015/16, 404,000 tons of CGF and DDGS were imported by Israel, of which 88 percent were
from the US, up nearly 357 percent compared to a decade ago. In the past two years, due to corn’s
attractive pricing, its imports increased significantly at the expense of feed wheat. In MY 2015/16 there
was a sharp decline of 49 percent in the import of different grains and feedstuff from the US, attributed,
among other things, to a strong dollar, as grains from the Black Sea Basin are more competitively
priced.
Oren Shaked
Ron Verdonk
More grain imports coming from Black Sea suppliers while local production and use data will be
little changed.
Grain and Feed Annual
Israel
4/5/2016
Required Report - public distribution
Executive Summary:
Israel is almost completely dependent on imports to meet its grain and feed needs. The maximum area
that can be planted with wheat is about 100,000 ha out of which only 61,000 ha were planted in the past
year. Soybeans and corn are not grown at all in Israel, totally relying on imports. Out of the total grain
and oilseeds imports (see figure 1) in MY 2015/16, 74 percent was used for livestock feed, 17 percent as
milling wheat, and nine percent were soybeans for oil and meal use. The grain, feedstuff and soybean
supply totaled 4.625 million tons. From MY 2005/06 through MY 2015/16 total grain, feedstuff and
soybean imports increased by 11 percent.
General:
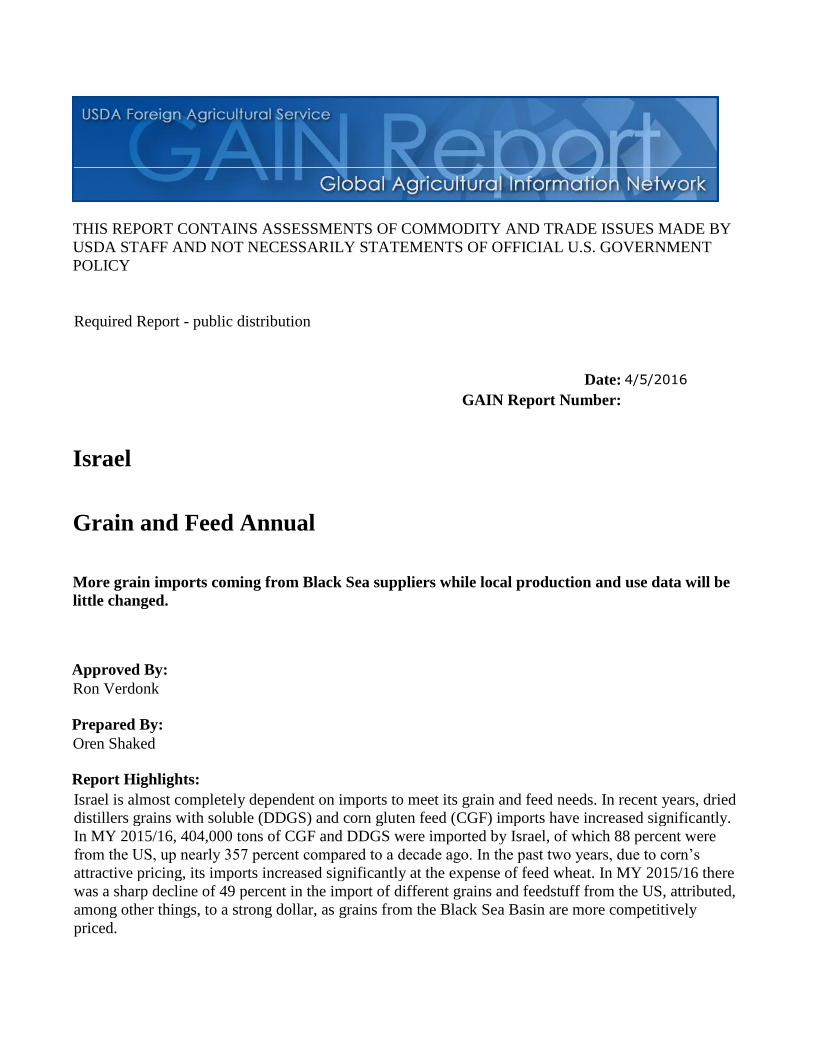
For some products Israel is almost self-sufficient while for others the economy is fully dependent on
imports. Figure 1 demonstrates Israel’s dependence on import of primary products. When a value
exceeds 100 per cent, it should be understood that the export from Israel is based on imports that were
processed. 100 percent means full dependency on import; 0 is for no need for any import. As can be
seen in Figure 1, Israel is over 90 percent dependent on imports to meet its grain/cereal needs.
The import dependency index is calculated using the following formula;
Figure 1: Israel’s Import Dependency Index of Primary Products
Source: CBS Israel
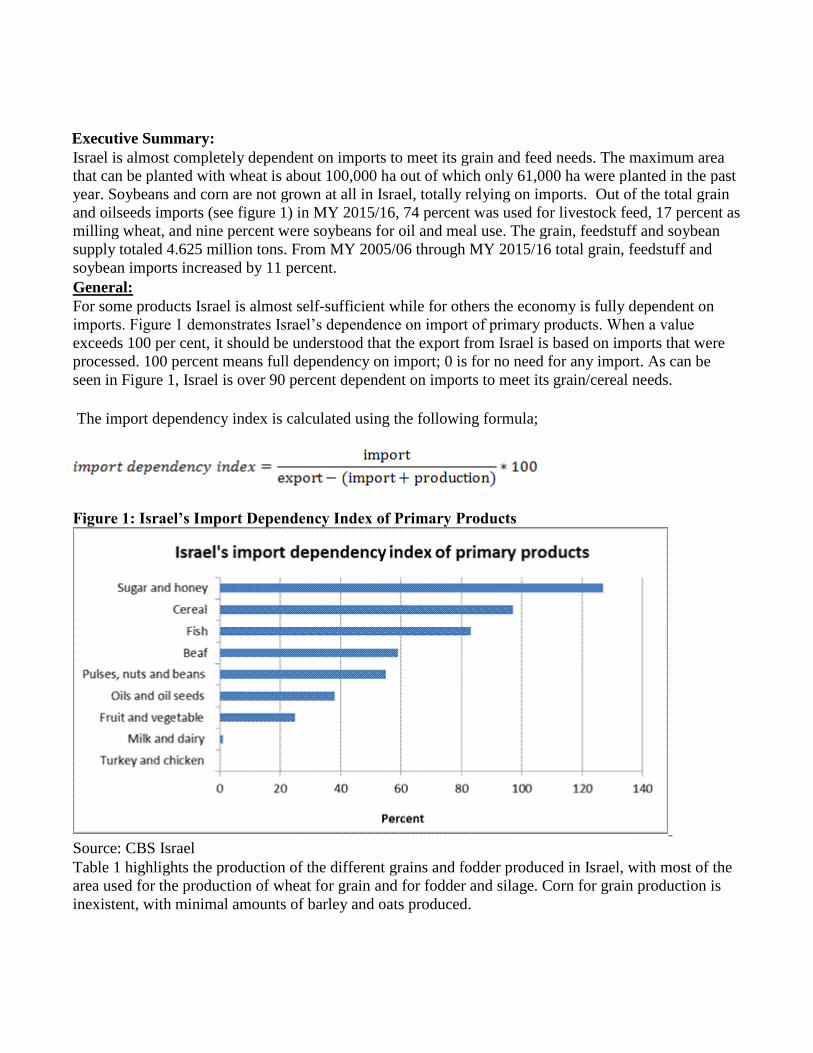
Table 1 highlights the production of the different grains and fodder produced in Israel, with most of the
area used for the production of wheat for grain and for fodder and silage. Corn for grain production is
inexistent, with minimal amounts of barley and oats produced.
Table 1: Israel’s Grain and Fodder Production in 2014
Crop Area planted
(HA)
Average yields
KG/HA
Total production
(MT)
Wheat for grain 57,000 2,500 142,500
Wheat for fodder and
silage
43,000 8,000 344,000
Barley for grain 5,000 3,000 15,000
Barley for fodder 1,700 8,500 14,450
Oats 5,000 11,000 55,000
Corn for fodder 7,000 18,500 129,500
Sweet corn 6,000 21,000 126,000
Popcorn 800 6,500 5,200
Sorghum for fodder 2,500 21,500 53,750
Source: Israel’s Field Crop Organization
Crop year 2015 was marked as the Sabbath year or shmita (literally "release") /shevit (literally
"seventh"), as it marks the seventh year of the seven-year agricultural cycle, as specified in the Torah,
for the land of Israel and still observed in contemporary Judaism. During shmita, the land is left fallow
and all agricultural activity, including plowing, planting, pruning and harvesting, is forbidden by Jewish
law.
Other cultivation techniques (such as watering, fertilizing, weeding, spraying, trimming and mowing)
may be performed as a preventive measure only, not to improve the growth of trees or other plants.
Additionally, any fruits which grow of their own accord are deemed “ownerless” and may be picked by
anyone. A variety of laws also apply to the sale, consumption and disposal of “shmita” produce:
Book of Exodus, "You may plant your land for six years and gather its crops. But during the seventh
year, you must leave it alone and withdraw from it. .... This also applies to your vineyard and your olive
grove." (Exodus 23:10–11).
Book of Leviticus, "God spoke to Moses at Mount Sinai, telling him to speak to the Israelites and say to
them: When you come to the land that I am giving you, the land must be given a rest period, a sabbath
to God. For six years you may plant your fields, prune your vineyards, and harvest your crops, but the
seventh year is a Sabbath of Sabbaths for the land. It is God's Sabbath during which you may not plant
your fields, nor prune your vineyards….(Leviticus 25:1–7)
The aforementioned underscore the extent to which religion continues to play a role in Israeli
agriculture. Since the shimta mostly fell in 2015 (from September 2014 to October 2015 according to
the Jewish calendar) all of the grains used for milling in Israel were imported. Therefore, any grains that
were grown in Israel were sold to non-Jewish and Palestinian communities or used for animal feed.
Commodities:
Wheat
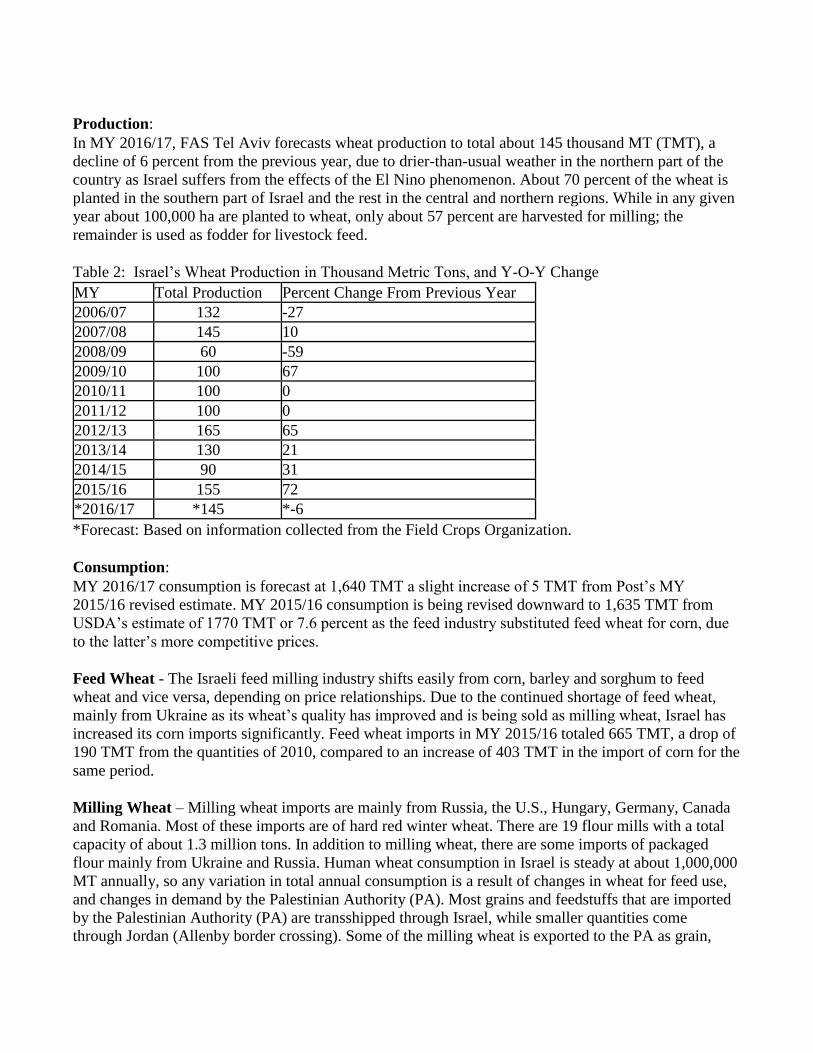
Production:
In MY 2016/17, FAS Tel Aviv forecasts wheat production to total about 145 thousand MT (TMT), a
decline of 6 percent from the previous year, due to drier-than-usual weather in the northern part of the
country as Israel suffers from the effects of the El Nino phenomenon. About 70 percent of the wheat is
planted in the southern part of Israel and the rest in the central and northern regions. While in any given
year about 100,000 ha are planted to wheat, only about 57 percent are harvested for milling; the
remainder is used as fodder for livestock feed.
Table 2: Israel’s Wheat Production in Thousand Metric Tons, and Y-O-Y Change
MY Total Production Percent Change From Previous Year
2006/07 132 -27
2007/08 145 10
2008/09 60 -59
2009/10 100 67
2010/11 100 0
2011/12 100 0
2012/13 165 65
2013/14 130 21
2014/15 90 31
2015/16 155 72
*2016/17 *145 *-6
*Forecast: Based on information collected from the Field Crops Organization.
Consumption:
MY 2016/17 consumption is forecast at 1,640 TMT a slight increase of 5 TMT from Post’s MY
2015/16 revised estimate. MY 2015/16 consumption is being revised downward to 1,635 TMT from
USDA’s estimate of 1770 TMT or 7.6 percent as the feed industry substituted feed wheat for corn, due
to the latter’s more competitive prices.
Feed Wheat - The Israeli feed milling industry shifts easily from corn, barley and sorghum to feed
wheat and vice versa, depending on price relationships. Due to the continued shortage of feed wheat,
mainly from Ukraine as its wheat’s quality has improved and is being sold as milling wheat, Israel has
increased its corn imports significantly. Feed wheat imports in MY 2015/16 totaled 665 TMT, a drop of
190 TMT from the quantities of 2010, compared to an increase of 403 TMT in the import of corn for the
same period.
Milling Wheat – Milling wheat imports are mainly from Russia, the U.S., Hungary, Germany, Canada
and Romania. Most of these imports are of hard red winter wheat. There are 19 flour mills with a total
capacity of about 1.3 million tons. In addition to milling wheat, there are some imports of packaged
flour mainly from Ukraine and Russia. Human wheat consumption in Israel is steady at about 1,000,000
MT annually, so any variation in total annual consumption is a result of changes in wheat for feed use,
and changes in demand by the Palestinian Authority (PA). Most grains and feedstuffs that are imported
by the Palestinian Authority (PA) are transshipped through Israel, while smaller quantities come
through Jordan (Allenby border crossing). Some of the milling wheat is exported to the PA as grain,
while the rest is milled in Israel and exported as flour.
Trade:
In MY 2016/17, Post forecasts total imports at 1,540 TMT an increase of 6 percent from its MY2015/16
estimate, which is being revised down 247 TMT or 15 percent from USDA’s MY2015/16 estimate of
1,700 TMT, as corn displaces feed wheat due to more attractive prices.
Feed Wheat - Due to the corn’s competitive pricing, FAS Tel Aviv estimates that feed wheat imports
will remain at lower-than-usual levels, totaling about 670 TMT in MY 2016/17, similar to the quantities
of MY 2015/16 and a 26 percent drop from the quantities of 2010. Most feed wheat is imported from
Ukraine.
Milling Wheat - MY2016/17milling wheat imports are expected to reach 870 TMT, which should
remain unchanged in the short term. The local production of milling wheat covers a maximum of 15
percent of annual consumption. The market share of U.S. wheat will decrease even further if the U.S
dollar maintains its present value against the euro and the Russian ruble. This year the share of U.S
wheat imports is at its lowest level with only 13 percent of the total milling wheat imports, compared to
a share of 50 percent in 2011.
Stocks:
MY 2016/17 stocks are forecast at 468 TMT. Post is revising MY2015/16 up to 428 TMT from
USDA’s estimate of 276 TMT. The increase in stocks is due to a slowdown in the consumption of feed
wheat as feed millers are substituting corn for feed wheat due to its attractive pricing.
The government’s milling wheat emergency stocks are usually at their annual high in July after the end
of the harvest in Israel. During this period, these stocks are usually at an estimated 150,000 MT, which
would be sufficient to cover about 2 months of demand. Stocks generally decline from July through
March-April to 30,000 tons, and rebound in June-July at the onset of the harvest.
Emergency stocks are based on the domestic wheat harvest size; however, in case of a shortage in local
wheat production, stocks are rebuilt with imported wheat. Emergency stocks are controlled by the
Israeli Ministry of Agriculture that also chooses, through tenders, the companies that are best suited for
storing these emergency stocks. In addition to the emergency stocks, local importers usually have some
milling wheat stocks, which are imported.
Feedstuff Stocks
The emergency feedstuff stocks include all the feed grains, oil meals, DDGS and CGF and stand at
about 120,000 tons per year. These stocks are sufficient to meet feed demand for approximately 2
weeks. Out of the total 120,000 tons, about 20,000 tons are feed wheat.
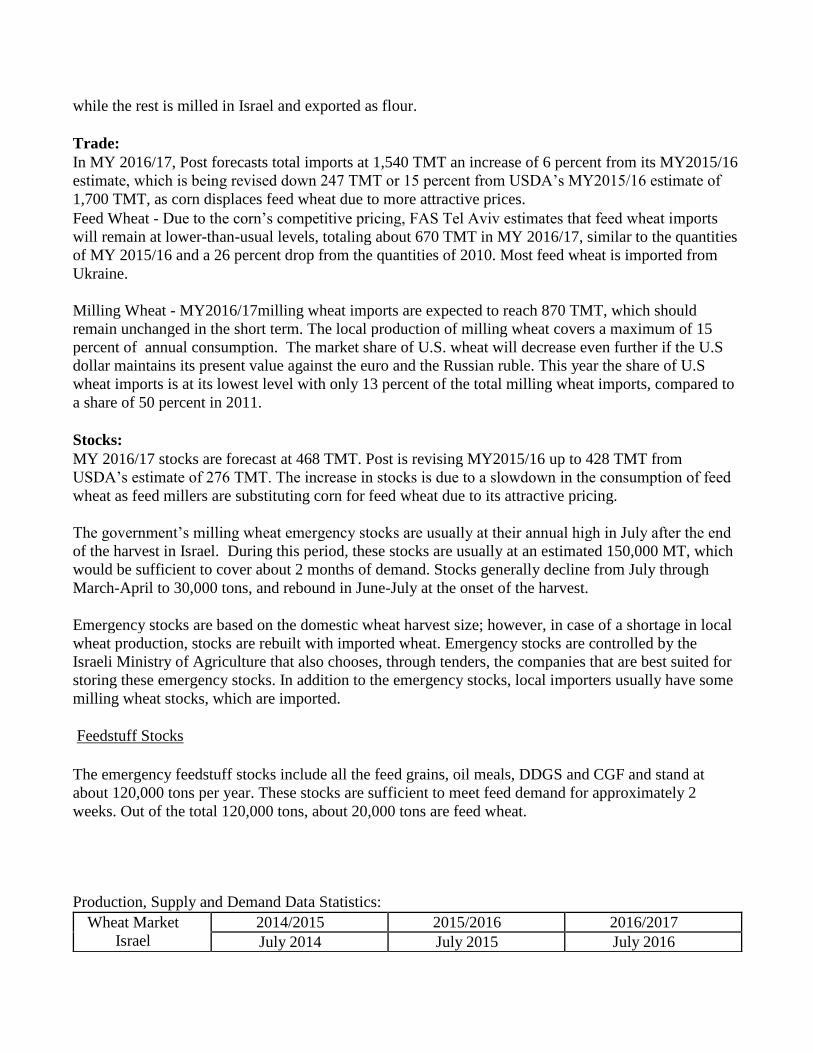
Production, Supply and Demand Data Statistics:
Wheat Market
Israel
2014/2015 2015/2016 2016/2017
July 2014 July 2015 July 2016
USDA
Official
New
Post
USDA
Official
New
Post
USDA
Official
New
Post
Area Harvested 70 70 70 70 0 70
Beginning Stocks 179 391 191 474 0 428
Production 90 90 160 155 0 145
MY Imports 1,582 1548 1,700 1453 0 1540
TY Imports 1,582 1548 1,700 1453 0 1540
TY Import from
US
79 148 0 102 0 100
Total Supply 1,851 2,029 2,051 2,068 0 2,113
MY Exports 5 5 5 5 0 5
TY Exports 5 5 5 5 0 5
Feed And
Residual
700 600 800 665 0 670
FSI Consumption 955 950 970 970 0 970
Total
Consumption
1,655 1,550 1,770 1,635 0 1,640
Ending Stocks 191 474 276 428 0 468
Total Distribution 1,851 2,029 2,051 2,068 0 2,113
1000 HA, 1000 MT, MT/HA
Barley
Production:
In MY2016/17, barley production is expected to reach 15 TMT from an area of 5,000 ha. There is a
limited amount of barley produced in Israel, 6,700 ha, out of which 1,700 ha are being grown for silage.
Most barley production is located in the south of Israel and the rest is in Beit-Sh’ean Valley (eastern
Israel). Production is about 3 MT per ha of grains and 8.5 MT per ha when cultivated for silage.
Consumption:
MY 2016/17 consumption is projected to be 295 TMT. Barley is the third biggest feed grain in Israel
after corn and feed wheat, and annual consumption is expected to range between 250-500 TMT in the
coming years. Most of it is sold to the Arab population (both in Israel and the Palestinian Authority) as
feed for their livestock, mainly sheep.
Trade:
MY 2016/17 imports are expected at 280 TMT, an increase of 15 percent from Post’s revised
MY2015/16 estimate of 244 TMT. The changes are mostly due to the price dynamics between the main
feed grains (corn, feed wheat, barley and sorghum) as determined by Israeli’s feed milling industry’s
choice. An increase in barley imports in MY 2016/17 will mostly be in lieu of feed wheat imports, as its
attractive price –a t least in the first quarter of 2016 - is 17 percent down from last year.
Barley and other grains are necessary in feed rations, due to the presence of the xanthophyll 1 pigment
in corn that turns the broiler meat yellow. Therefore to counteract the strong yellow color, Israeli feed
millers must use barley, sorghum, or feed wheat to reduce the yellow pigment in chicken meat, as Israeli
consumers relate the yellow color to poor health and obesity. In recent years, annual barley imports
varied between 190 and 550 TMT, and are projected to stay at these levels in the coming years.
MY 2015/16 Outlook
This year the supply of barley dropped by 56 TMT, a decline of over 17 percent from MY 2014/15
levels. Feed mills substituted some of the barley with wheat. There have been no imports of barley from
the U.S. in recent years, and this situation is not expected to change in the future, as most barley is
imported from Ukraine.
Stocks:
MY 2016/17 stocks are forecast at 25 TMT. Practically, all of the stocks will be from the government’s
emergency feedstuff stocks.
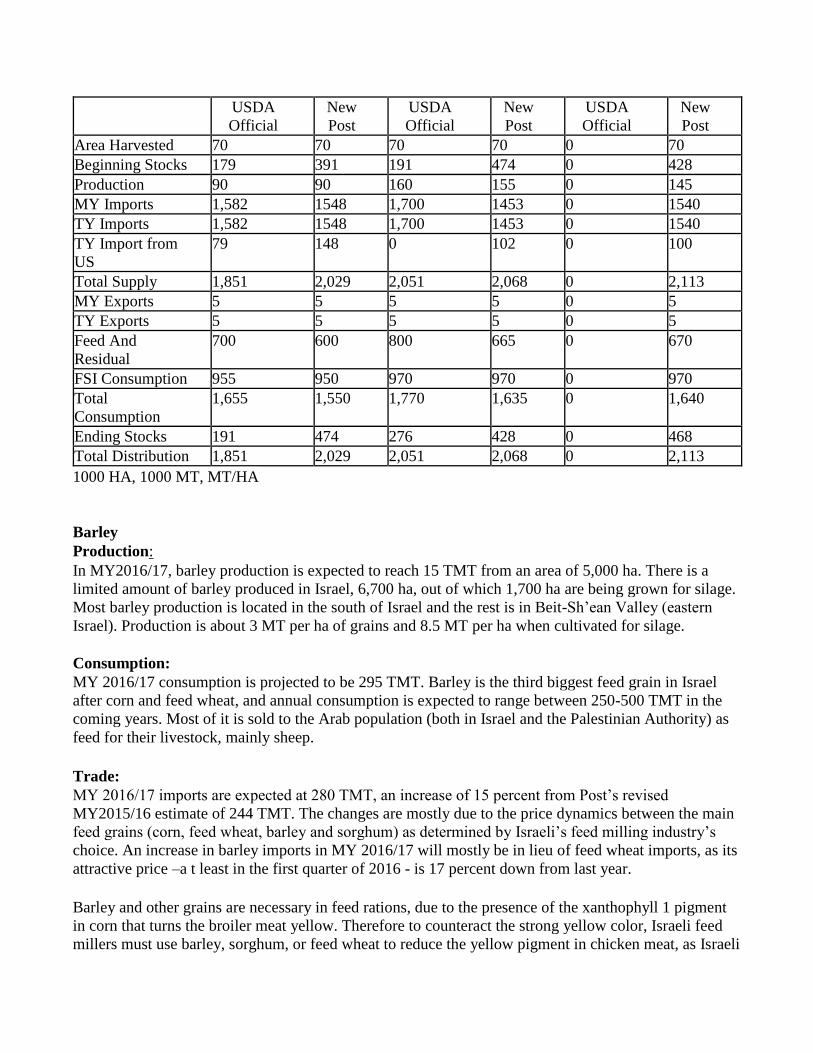
Barley Market
Israel
2014/2015 2015/2016 2016/2017
October 2014 October 2015 October 2016
USDA
Official
New
Post
USDA
Official
New
Post
USDA
Official
New
Post
Area Harvested 0 0 0 5 0 5
Beginning Stocks 31 25 24 35 0 21
Production 0 0 0 15 0 15
MY Imports 278 325 325 244 0 280
TY Imports 278 325 325 244 0 280
TY Import from
US
0 0 0 0 0 0
Total Supply 309 350 349 294 0 316
MY Exports 0 0 0 0 0 0
TY Exports 0 0 0 0 0 0
Feed And
Residual
275 305 300 263 0 285
FSI Consumption 10 10 10 10 0 10
Total
Consumption
285 315 310 273 0 295
Ending Stocks 24 35 39 21 0 21
Total Distribution 309 350 349 294 0 316
1000 HA, 1000 MT, MT/HA
Corn
Production:
Although corn is grown in Israel, none is cultivated for feed use. In CY 2015, total corn area planted
was 13,800 ha out of which 7,000 ha were grown for silage, 6,000 ha for human consumption as sweet
corn, either fresh or processed, and 800 ha for popcorn. This makes Israel 100 percent dependent on
imports for feed. This factor will not change because corn cultivation in Israel is fully dependent on
irrigation, and with water shortages and its high price, farmers prefer to use their water for higher value
crops.
Consumption:
MY 2016/17 consumption is forecast at 1,510 TMT.
Corn is the main commodity used in Israel’s feed industry, and its uses driven by poultry and egg
production, followed by dairy production, turkey production and other ruminants. In the last decade,
local meat production has increased in 28 percent from 594,000 tons to 763,000 ton in 2014 (last figure
available).
Broilers- In 2016, the production quota system has been eliminated, which could lead to surplus
production with volumes that cannot be absorbed by the local market. Growers are trying to work on an
internal quota control to avoid excess production. Already a change in the quota system that began in
1997 has shown its effect. From 1997 until 2014, broiler production increased by 113 percent. Annual
meat consumption, per capita, in Israel is 86 kg, ranking it third in the OECD after Australia and the
USA. The breakdown of the meat consumed in Israel is 80 percent chicken, 10 percent beef, 8 percent
turkey, 1 percent sheep and goat meat and 1 percent other.
Table Eggs - In MY 2015, it is estimated that table egg production was around 1.65 billion. Due to
extreme heat waves during the month of August and September 2015, the productivity of the layers was
lower, creating shortages in the local markets for a few weeks. High volumes of imports mainly from
Turkey, Ukraine and Spain bridged the gap. Several shipments were rejected by IVAHS due to
Salmonella spp. found in them.
The table eggs sector is covered by sector-specific policy measures with minimum guaranteed prices
and production quotas aimed at securing profitability for the majority of producers. Annual per capita
consumption in Israel is relatively high compared to other countries, averaging 238 eggs. It is estimated
that table egg production in the coming years will increase by about 1 percent per annum.
Milk - In 2015, local milk production increased by about 3.5 percent compared to 2014 and totaled
nearly 1,453 million liters compared to 1,400 million in 2014, with a market value of around $845
million. Production in 2016 is forecast to remain similar to 2015, between 1,400-1,450 million liters.
Local consumption per capita is about 180 liter per person, which is relatively low compared to western
countries’ consumption of 220 liters/person.
Beef Meat - In recent years, the local production of beef has increased significantly from 87,000 tons in
2001 to 132,000 tons in 2014, a 52 percent increase and is expected to grow at 2-3 percent per year. In
2015, the Israeli beef market was opened for imports from Eastern Europe and in 2016 it is expected
that U.S. beef will enter the market, as well as feeder cattle. An increase in beef consumption would
have some dampening impact on the poultry sector.
Turkeys - In recent years local turkey production has declined from over 137,000 MT in 2001 to
approximately 84,000 in 2014. It’s forecast that production will stabilize at 75,000-85,000 MT. The
consumption and production decrease was due to changing consumer preferences towards broiler meat.
Annual turkey consumption is about 8 kg per person.
Sheep Meat/Mutton – The local production of sheep meat increased significantly over the last 16 years,
from 11,000 tons to 39,000 tons, and with a market value of around $230 million. The Israeli
consumer’s taste is moving from turkey meat to sheep meat. The limiting factor for this product is the
high price charged for fresh chilled sheep meat.
Goat Meat – The goat meat industry is relatively small with a production of about 4,100 tons, a 71
percent increase compared to 1997, with a market value of $22 million. Most of the local goats are
raised for the dairy industry. The non-Jewish community is the main consumer of goat meat in Israel.
Pork Meat- Due to religious restrictions on pork consumption by the Jewish and Muslim population,
local pork production is relatively small and production levels remain unchanged since 1997, totaling
about 16,000 tons. Due to the unchanged production levels combined with a higher local demand for
pork meat, prices have increased by about 113 percent since 1997. It should be mentioned that
according to the “kosher law”, it’s not allowed to import non-kosher meat, however it’s allowed to
produce pork domestically. As such, demand must be met locally.
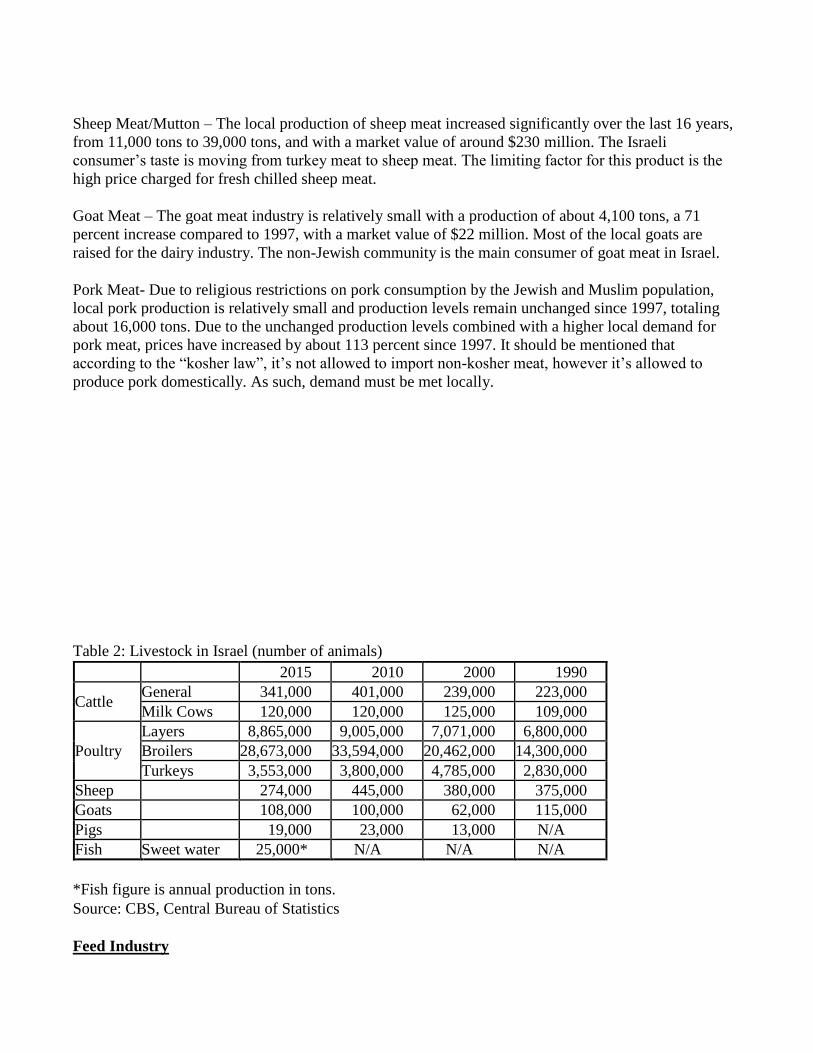
Table 2: Livestock in Israel (number of animals)
2015 2010 2000 1990
Cattle General 341,000 401,000 239,000 223,000
Milk Cows 120,000 120,000 125,000 109,000
Poultry
Layers 8,865,000 9,005,000 7,071,000 6,800,000
Broilers 28,673,000 33,594,000 20,462,000 14,300,000
Turkeys 3,553,000 3,800,000 4,785,000 2,830,000
Sheep 274,000 445,000 380,000 375,000
Goats 108,000 100,000 62,000 115,000
Pigs 19,000 23,000 13,000 N/A
Fish Sweet water 25,000* N/A N/A N/A
*Fish figure is annual production in tons.
Source: CBS, Central Bureau of Statistics
Feed Industry
About 90 percent of the local feed milling industry is controlled by 8 feed millers. The biggest feed
milling company is Ambar, with a market share of about 22 percent of the whole market with plans to
increase their production by about 12 percent in the coming years. There are about 150 feed centers in
Israel, which sell their feed mix mainly to the cattle industry. Out of the total feed centers, 15 are big-
sized feed centers, servicing big cattle growers, and the rest (135) are considered small-sized feed
centers, selling feed to small-sized cattlemen. Each small-sized feed center supplies feed to 100-300
cattle. In Israel due to the dry weather including, long dry summers and short winters with small
rainfall, the cattle for the meat industry lack grazing meadows. Most of the year farmers have to feed
cattle, making beef production in Israel relatively expensive.
The total market of the Israeli feed milling industry (feed millers and feed centers) is estimated at about
4 million tons of feed per year. Their typical mix is made of grains, oil meals (soy meal, sunflower and
canola) and other protein sources (DDGS and CGF). Part of the feeds prepared by the Israeli feed mills
is re-exported to Jordan and to the PA. It is estimated that about 15 percent is being re-exported.
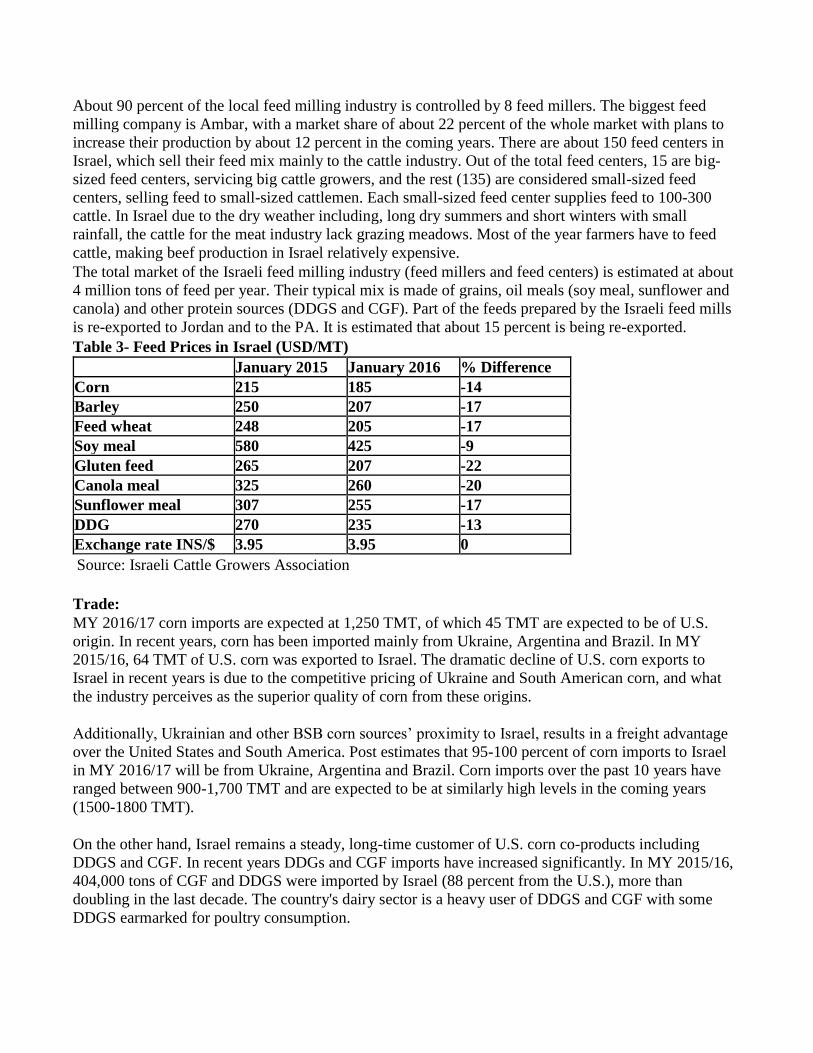
Table 3- Feed Prices in Israel (USD/MT)
January 2015 January 2016 % Difference
Corn 215 185 -14
Barley 250 207 -17
Feed wheat 248 205 -17
Soy meal 580 425 -9
Gluten feed 265 207 -22
Canola meal 325 260 -20
Sunflower meal 307 255 -17
DDG 270 235 -13
Exchange rate INS/$ 3.95 3.95 0
Source: Israeli Cattle Growers Association
Trade:
MY 2016/17 corn imports are expected at 1,250 TMT, of which 45 TMT are expected to be of U.S.
origin. In recent years, corn has been imported mainly from Ukraine, Argentina and Brazil. In MY
2015/16, 64 TMT of U.S. corn was exported to Israel. The dramatic decline of U.S. corn exports to
Israel in recent years is due to the competitive pricing of Ukraine and South American corn, and what
the industry perceives as the superior quality of corn from these origins.
Additionally, Ukrainian and other BSB corn sources’ proximity to Israel, results in a freight advantage
over the United States and South America. Post estimates that 95-100 percent of corn imports to Israel
in MY 2016/17 will be from Ukraine, Argentina and Brazil. Corn imports over the past 10 years have
ranged between 900-1,700 TMT and are expected to be at similarly high levels in the coming years
(1500-1800 TMT).
On the other hand, Israel remains a steady, long-time customer of U.S. corn co-products including
DDGS and CGF. In recent years DDGs and CGF imports have increased significantly. In MY 2015/16,
404,000 tons of CGF and DDGS were imported by Israel (88 percent from the U.S.), more than
doubling in the last decade. The country's dairy sector is a heavy user of DDGS and CGF with some
DDGS earmarked for poultry consumption.
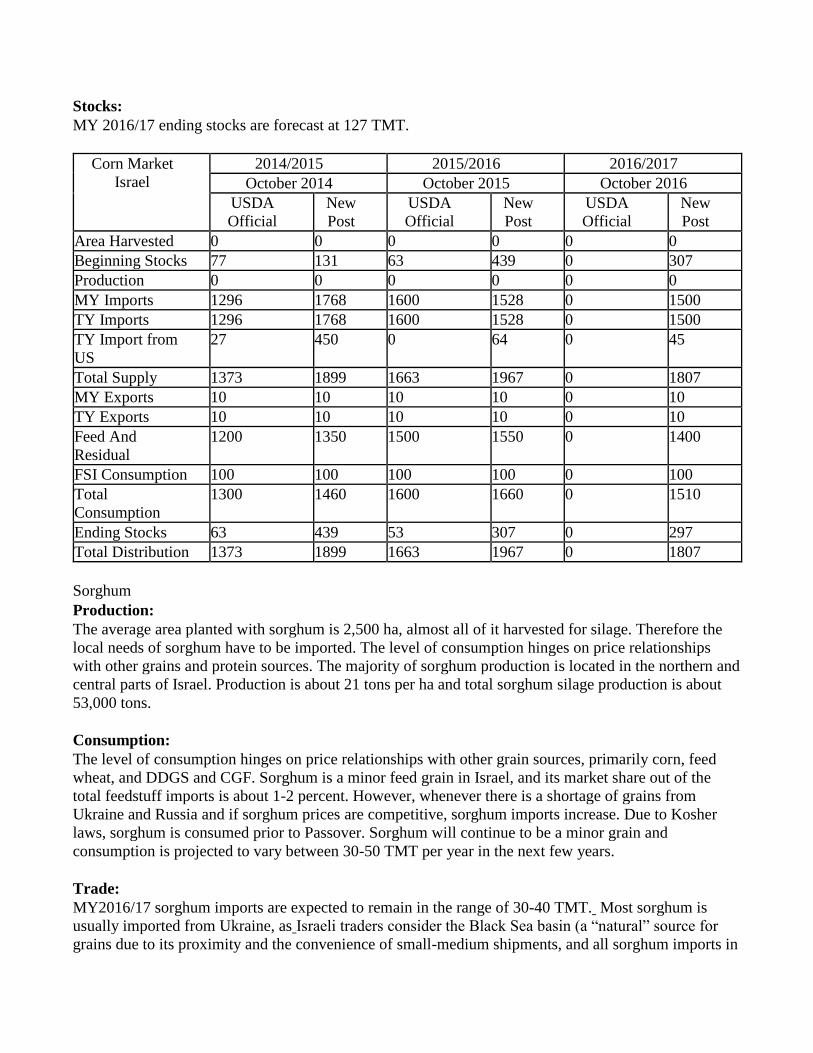
Stocks:
MY 2016/17 ending stocks are forecast at 127 TMT.
Corn Market
Israel
2014/2015 2015/2016 2016/2017
October 2014 October 2015 October 2016
USDA
Official
New
Post
USDA
Official
New
Post
USDA
Official
New
Post
Area Harvested 0 0 0 0 0 0
Beginning Stocks 77 131 63 439 0 307
Production 0 0 0 0 0 0
MY Imports 1296 1768 1600 1528 0 1500
TY Imports 1296 1768 1600 1528 0 1500
TY Import from
US
27 450 0 64 0 45
Total Supply 1373 1899 1663 1967 0 1807
MY Exports 10 10 10 10 0 10
TY Exports 10 10 10 10 0 10
Feed And
Residual
1200 1350 1500 1550 0 1400
FSI Consumption 100 100 100 100 0 100
Total
Consumption
1300 1460 1600 1660 0 1510
Ending Stocks 63 439 53 307 0 297
Total Distribution 1373 1899 1663 1967 0 1807
Sorghum
Production:
The average area planted with sorghum is 2,500 ha, almost all of it harvested for silage. Therefore the
local needs of sorghum have to be imported. The level of consumption hinges on price relationships
with other grains and protein sources. The majority of sorghum production is located in the northern and
central parts of Israel. Production is about 21 tons per ha and total sorghum silage production is about
53,000 tons.
Consumption:
The level of consumption hinges on price relationships with other grain sources, primarily corn, feed
wheat, and DDGS and CGF. Sorghum is a minor feed grain in Israel, and its market share out of the
total feedstuff imports is about 1-2 percent. However, whenever there is a shortage of grains from
Ukraine and Russia and if sorghum prices are competitive, sorghum imports increase. Due to Kosher
laws, sorghum is consumed prior to Passover. Sorghum will continue to be a minor grain and
consumption is projected to vary between 30-50 TMT per year in the next few years.
Trade:
MY2016/17 sorghum imports are expected to remain in the range of 30-40 TMT. Most sorghum is
usually imported from Ukraine, as Israeli traders consider the Black Sea basin (a “natural” source for
grains due to its proximity and the convenience of small-medium shipments, and all sorghum imports in
MY 2015/16 and MY 2014/15 were imported from the BSB, specifically Ukraine. Due to the high feed
wheat imports, sorghum imports in MY 2015/16 decreased by about 23 percent compared to the
previous year and totaled 30 TMT.
Stocks:
Since sorghum is consumed only prior to Passover, ending stocks are usually very low, totaling 1-2
TMT. The ending stocks of sorghum are not expected to change in the coming years.
Commodities: DDGS and Corn Gluten Meal
Production:
Israel does not produce DDGS or corn gluten meal.
Consumption:
MY2016/17 consumption of DDGS and corn gluten is expected to remain unchanged from MY2015/16
at 400 TMT. The slowdown we saw in the past few years in consumption is a result of low commodity
prices, especially for soybean meal, which is where substitution occurs in feed rations. For the past ten
years, Israel has been a growing market for DDGS and CGF, imported mainly from the U.S, while on
the other hand, U.S. feed grains have had a difficult time in the Israeli market due to competition from
the Black Sea Basin and from South America.
Trade:
MY 2016/17 imports of DDGS and corn gluten meal will remain unchanged from MY2015/16. In MY
2015/16 most imports were of U.S. origin with 202 TMT of DDGS and 153 TMT of corn gluten meal,
making Israel the second largest importer of corn gluten meal from the US.
Many countries in the Middle East import a limited amount of U.S. corn, which diminish the
opportunities to consign shipments of corn with DDGS and corn gluten feed. If these countries do not
bring in full vessels, U.S. corn co-products become more expensive than alternatives, thus reducing their
competitiveness. Additionally, the continued decrease of DDG imports in recent years is mainly due to
significantly higher imports of substitute protein sources, especially as soybean prices are currently very
attractive.
Stocks:
The government emergency stocks of DDGS and Gluten Meal together with stocks of the different feed
meals stand at 60 TMT.
Commodities:
Select