Embed Size (px)
DESCRIPTION
Israel from the perspec tive of foreign investors. Are the foreign investors here?. Saban-Apax-Arkin Cerberus Orascom Institutional Investors Capital Group Templeton Fidelity Boston Company Pioneer Investment management T Rowe Price Schroders. - PowerPoint PPT Presentation
Citation preview
Israel from the perspective of foreign investors

page 2
Are the foreign investors here?
Saban-Apax-Arkin Cerberus Orascom
Institutional Investors Capital Group Templeton Fidelity Boston Company Pioneer Investment management T Rowe Price Schroders
page 3
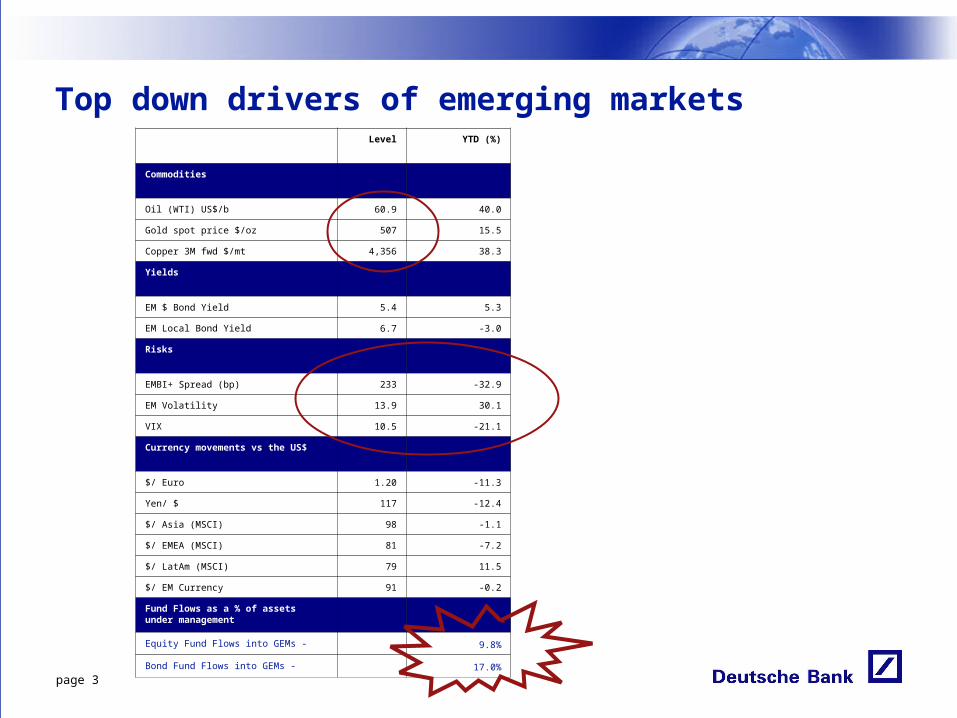
Level YTD (%)
Commodities
Oil (WTI) US$/b 60.9 40.0
Gold spot price $/oz 507 15.5
Copper 3M fwd $/mt 4,356 38.3
Yields
EM $ Bond Yield 5.4 5.3
EM Local Bond Yield 6.7 -3.0
Risks
EMBI+ Spread (bp) 233 -32.9
EM Volatility 13.9 30.1
VIX 10.5 -21.1
Currency movements vs the US$
$/ Euro 1.20 -11.3
Yen/ $ 117 -12.4
$/ Asia (MSCI) 98 -1.1
$/ EMEA (MSCI) 81 -7.2
$/ LatAm (MSCI) 79 11.5
$/ EM Currency 91 -0.2
Fund Flows as a % of assets under management
Equity Fund Flows into GEMs - 9.8%
Bond Fund Flows into GEMs - 17.0%
Top down drivers of emerging markets

page 4
Flow of funds into emerging markets in 2005 (1)
-1,000
0
1,000
2,000
3,000
4,000
5,000
6,000
7,000
8,000
9,000
10,000Ja
n-0
5
Feb-0
5
Mar
-05
Apr-05
May
-05
Jun-0
5
Jul-0
5
Aug-0
5
Sep-0
5
Oct
-05
YTD Cumulative fund flows into All dedicated EM funds

page 5
Flow of funds into emerging markets in 2005 (2)
-5%
0%
5%
10%
15%
20%
05-J
an-0
512
-Jan
-05
19-J
an-0
526
-Jan
-05
02-F
eb-0
509
-Feb
-05
16-F
eb-0
523
-Feb
-05
02-M
ar-0
509
-Mar
-05
16-M
ar-0
523
-Mar
-05
30-M
ar-0
506
-Apr
-05
13-A
pr-0
520
-Apr
-05
27-A
pr-0
504
-May
-05
11-M
ay-0
518
-May
-05
25-M
ay-0
501
-Jun
-05
08-J
un-0
515
-Jun
-05
22-J
un-0
529
-Jun
-05
06-J
ul-0
513
-Jul
-05
20-J
ul-0
527
-Jul
-05
03-A
ug-0
510
-Aug
-05
17-A
ug-0
524
-Aug
-05
31-A
ug-0
507
-Sep
-05
14-S
ep-0
521
-Sep
-05
28-S
ep-0
505
-Oct
-05
12-O
ct-0
519
-Oct
-05
26-O
ct-0
502
-Nov
-05
09-N
ov-0
516
-Nov
-05
23-N
ov-0
530
-Nov
-05
07-D
ec-0
514
-Dec
-05
Equity Weekly Flows (% of AUM) Bond Weekly Flows (% of AUM)
YTD Equity Cumulative Flows (% of AUM) YTD Bond Cumulative Flows (% of AUM)
– 10% of flows into equity funds allocated to emerging markets in 2005
– 17% of flows into bond funds allocated to emerging markets
page 6
0
20
40
60
80
100
120
140
160
Jan-
00
Apr
-00
Jul-0
0
Oct
-00
Jan-
01
Apr
-01
Jul-0
1
Oct
-01
Jan-
02
Apr
-02
Jul-0
2
Oct
-02
Jan-
03
Apr
-03
Jul-0
3
Oct
-03
Jan-
04
Apr
-04
Jul-0
4
Oct
-04
Jan-
05
Apr
-05
Jul-0
5
Oct
-05
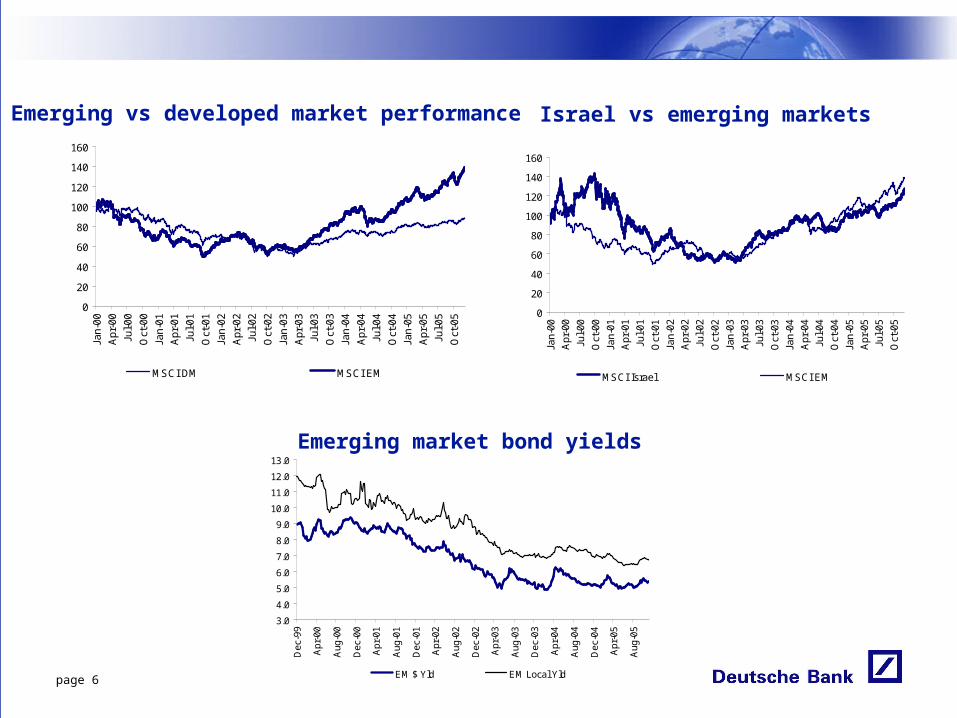
MSCI DM MSCI EM
3.0
4.0
5.0
6.0
7.0
8.0
9.0
10.0
11.0
12.0
13.0
Dec
-99
Apr
-00
Aug
-00
Dec
-00
Apr
-01
Aug
-01
Dec
-01
Apr
-02
Aug
-02
Dec
-02
Apr
-03
Aug
-03
Dec
-03
Apr
-04
Aug
-04
Dec
-04
Apr
-05
Aug
-05
EM $ Yld EM Local Yld
Emerging vs developed market performance Israel vs emerging markets
0
20
40
60
80
100
120
140
160
Jan-
00
Apr
-00
Jul-0
0
Oct
-00
Jan-
01
Apr
-01
Jul-0
1
Oct
-01
Jan-
02
Apr
-02
Jul-0
2
Oct
-02
Jan-
03
Apr
-03
Jul-0
3
Oct
-03
Jan-
04
Apr
-04
Jul-0
4
Oct
-04
Jan-
05
Apr
-05
Jul-0
5
Oct
-05
MSCI Israel MSCI EM
Emerging market bond yields

page 7
Valuations in emerging markets still lower, though gap closing
0
5
10
15
20
25
30
35
Dec
-96
Jun-
97
Dec
-97
Jun
-98
Dec
-98
Jun-
99
Dec
-99
Jun-
00
Dec
-00
Jun
-01
Dec
-01
Jun-
02
De
c-02
Jun-
03
Dec
-03
Jun
-04
Dec
-04
Jun-
05
EM PE DM PE
page 8
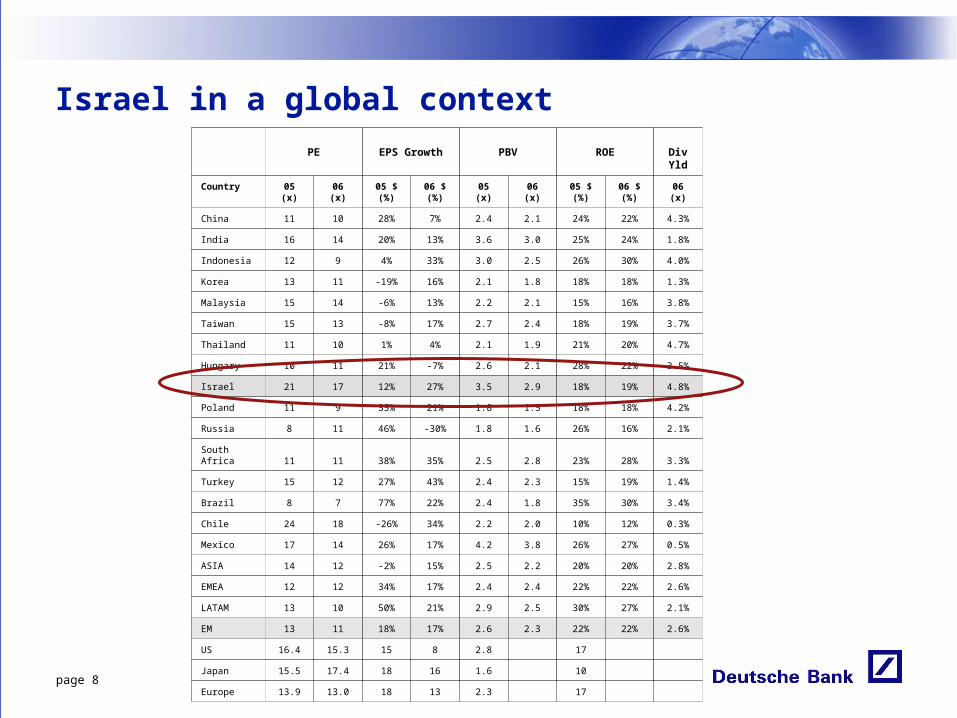
Israel in a global context
PE EPS Growth PBV ROE Div Yld
Country 05 (x)
06 (x)
05 $(%)
06 $(%)
05 (x)
06 (x)
05 $(%)
06 $(%)
06 (x)
China 11 10 28% 7% 2.4 2.1 24% 22% 4.3%
India 16 14 20% 13% 3.6 3.0 25% 24% 1.8%
Indonesia 12 9 4% 33% 3.0 2.5 26% 30% 4.0%
Korea 13 11 -19% 16% 2.1 1.8 18% 18% 1.3%
Malaysia 15 14 -6% 13% 2.2 2.1 15% 16% 3.8%
Taiwan 15 13 -8% 17% 2.7 2.4 18% 19% 3.7%
Thailand 11 10 1% 4% 2.1 1.9 21% 20% 4.7%
Hungary 10 11 21% -7% 2.6 2.1 28% 22% 3.5%
Israel 21 17 12% 27% 3.5 2.9 18% 19% 4.8%
Poland 11 9 35% 21% 1.8 1.5 18% 18% 4.2%
Russia 8 11 46% -30% 1.8 1.6 26% 16% 2.1%
South Africa 11 11 38% 35% 2.5 2.8 23% 28% 3.3%
Turkey 15 12 27% 43% 2.4 2.3 15% 19% 1.4%
Brazil 8 7 77% 22% 2.4 1.8 35% 30% 3.4%
Chile 24 18 -26% 34% 2.2 2.0 10% 12% 0.3%
Mexico 17 14 26% 17% 4.2 3.8 26% 27% 0.5%
ASIA 14 12 -2% 15% 2.5 2.2 20% 20% 2.8%
EMEA 12 12 34% 17% 2.4 2.4 22% 22% 2.6%
LATAM 13 10 50% 21% 2.9 2.5 30% 27% 2.1%
EM 13 11 18% 17% 2.6 2.3 22% 22% 2.6%
US 16.4 15.3 15 8 2.8 17
Japan 15.5 17.4 18 16 1.6 10
Europe 13.9 13.0 18 13 2.3 17

page 9
Performance of MSCI Israel equity market in global context
-10 0 10 20 30 40 50 60 70 80
Taiwan
Malaysia
Thailand
US
Europe
Indonesia
China
Chile
Hungary
South Africa
Poland
J apan
Israel
India
Turkey
Korea
Mexico
Brazil
Russia

page 10
-200 -150 -100 -50 0 50 100 150 200
Hungary
Turkey
Malaysia
Poland
Mexico
India
Chile
Indonesia
Thailand
South Africa
China
Israel
Korea
Taiwan
Russia
Brazil
-4.00 -3.00 -2.00 -1.00 0.00 1.00 2.00 3.00
TaiwanChinaIsrael
South AfricaChile
PolandMalaysia
Czech RepublicPeru
J ordanMexico
PakistanColombiaMorocco
EgyptArgentina
IndiaVenezuela
HungaryS. Korea
PhilippinesIndonesia
RussiaTurkey
ThailandCashBrazil
Deutsche Bank’s recommended weighting versus benchmark index
Foreign investors weighting versus benchmark index

page 11
Currency value as % of 2005 PPP fair value
US
Russia
Brazil
Turkey
Taiwan
Malaysia
Philippines
Korea
Czech Republic
Thailand
Hungary
Poland
Israel
Argentina
South Africa
India
IndonesiaChina
Chile
Mexico
0%
20%
40%
60%
80%
100%
120%
0 5,000 10,000 15,000 20,000 25,000 30,000 35,000 40,000 45,000GDP pc PPP terms US$
% o
f PPP fai
r va
lue
Cheap
Expensive

page 12
60 Day annualized Vol
Equity 5YR YTD Currncy
5YR YTD
Vol Avg chg (%)
Vol Avg chg (%)
Israel 11.0 24.9 -25.2 5.0 5.9 12.3
ASIA 14.4 19.6 1.7 3.6 4.2 -26.5
EMEA 18.4 17.5 43.5 8.0 11.4 -8.0
LATAM 22.3 20.9 51.4 9.8 11.3 13.3
EM 13.9 15.0 30.1 6.0 7.5 -9.7
US 11.1 17.5 13.0 nm nm nm
Japan 17.5 21.3 8.9 6.8 9.4 -26.1
Europe 11.2 17.4 7.3 8.6 10.1 7.4
1Y Beta 5YR
Current Avg
Israel 0.4 0.7
Turkey 1.3 1.3
Argentina 1.3 0.8
Brazil 1.5 1.2
Chile 0.7 0.6
Mexico 1.0 0.8
ASIA 0.9 1.1
EMEA 1.1 0.8
LATAM 1.3 0.9
EM 1.0 1.0
Country and currency volatility Beta to emerging markets
If we are not EM, what are we?
page 13
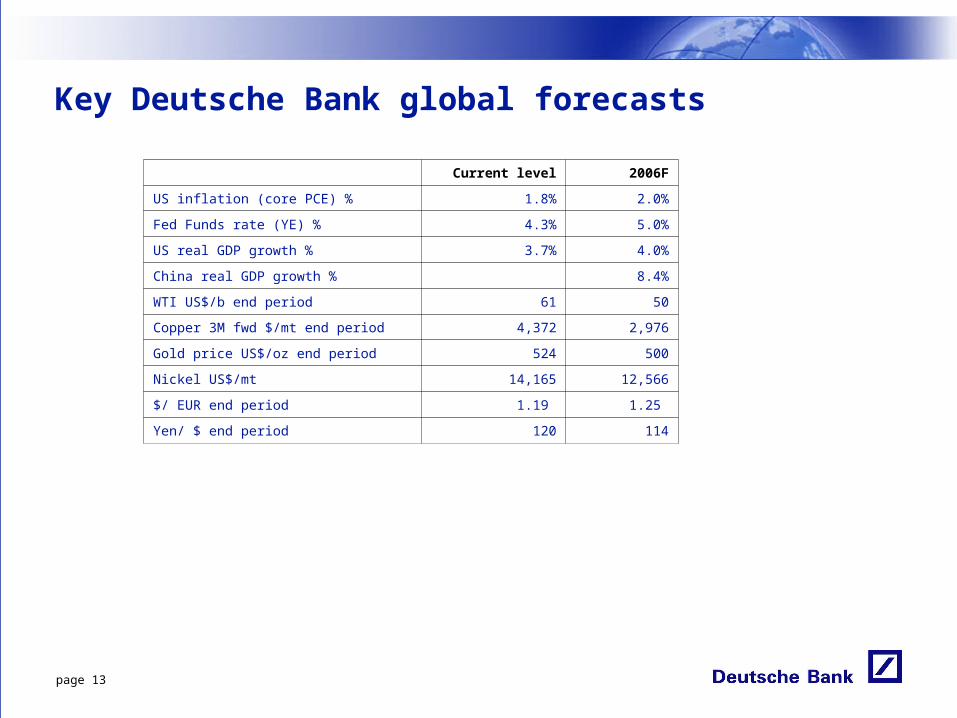
Key Deutsche Bank global forecasts
Current level 2006F
US inflation (core PCE) % 1.8% 2.0%
Fed Funds rate (YE) % 4.3% 5.0%
US real GDP growth % 3.7% 4.0%
China real GDP growth % 8.4%
WTI US$/b end period 61 50
Copper 3M fwd $/mt end period 4,372 2,976
Gold price US$/oz end period 524 500
Nickel US$/mt 14,165 12,566
$/ EUR end period 1.19 1.25
Yen/ $ end period 120 114

page 14
Deutsche Bank’s Israel forecasts2004 2005F 2006F
Nominal GDP (USDbn) 117.0 124.7 134.1Real GDP (YoY%) 4.4 4.5 4.1 Priv. consumption 5.0 5.0 4.5 Gov't consumption -2.4 1.0 1.0 Investment 4.0 5.5 5.0 Exports 17.4 7.9 6.5 Imports 11.8 6.0 5.3CPI 1.2 3.0 2.0Money (M1) 17.9 25.0 23.6Fiscal accounts, % of GDP -3.8 -1.5 -3.0Exports 36.6 40.2 45.1Imports 38.5 43.7 48.1Trade balance -1.9 -3.5 -3.0 % of GDP -1.6 -2.8 -2.2Current account balance 1.5 1.5 1.2 % of GDP 1.3 1.2 0.9FDI -1.5 3.5 1.0FX reserves (USDbn) 26.6 27.6 29.4ILS/USD (eop) 4.32 4.60 4.30ILS/EUR (eop) 5.88 5.20 5.46Debt Indicators (% of GDP) 106.0 100.1 96.3Industrial production 7.2 6.0 5.6Unemployment (pavg) 10.3 9.0 8.9
page 15
What can we do next?
Move to nominal reporting
Increase liquidity
Easy access to stock borrowing
Standardize OTC documentation
Netting
Free float


![Towards a Uniform Presentation of Logical Systems by ...€¦ · Also, from a categorical perspec-tive, Tarski s consequence operator [40] can be formalized as Indexed Closure Operators,](https://img.pdfslide.us/doc/110x75/5f0d089f7e708231d438592b/towards-a-uniform-presentation-of-logical-systems-by-also-from-a-categorical.jpg)