Embed Size (px)
DESCRIPTION
IsPOD Data Results Spring 2010 2010 NC IsPOD Evaluation All rights reserved. % Needy ID School Name Grades 3-5 Grades 1-2 SPARK Trained? 2009- 2010 ADM Using FG? FG Response Rates 2010 NC IsPOD Evaluation Conducted by NCAAHPERD/NC DPH All rights reserved. # Staff Trained
Citation preview
2010 NC IsPOD Evaluation All rights reserved.
SCOTLAND COUNTY
The North Carolina Alliance for Athletics, Health, Physical Education, Recreation,
and Dance (NCAAHPERD), launched In-school Prevention of Obesity and Disease (IsPOD) in 2007. The initiative began with a grant from the NC Health and Wellness Trust Fund and was expanded with grants from the Blue Cross
Blue Shield of North Carolina Foundation. The expansion to a state-wide program
is supported by a $3.6 million grant from the Kate B. Reynolds Charitable Trust. NCAAHPERD is engaged with a large network of health and physical education
groups seeking greater opportunities for a healthier and more creative North Carolina.
IsPOD Data Results
Spring 2010
2010 NC IsPOD Evaluation
Conducted by NCAAHPERD/NC DPH All rights reserved.
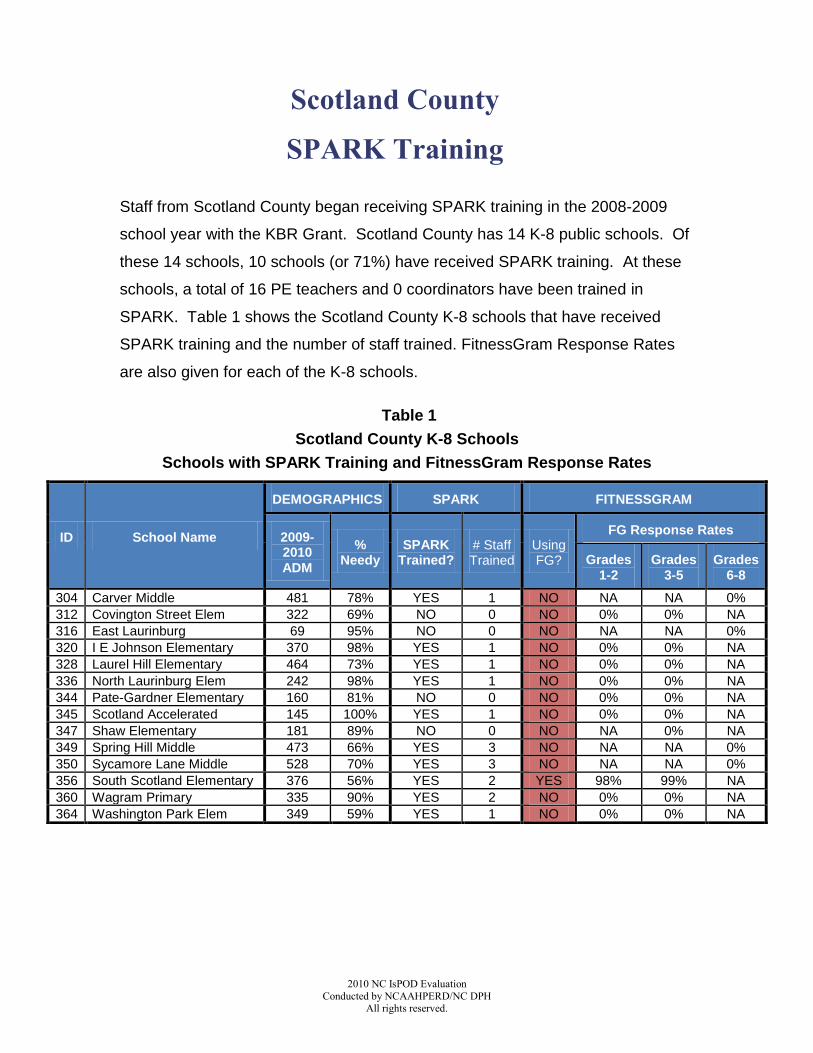
Scotland County
SPARK Training
Staff from Scotland County began receiving SPARK training in the 2008-2009
school year with the KBR Grant. Scotland County has 14 K-8 public schools. Of
these 14 schools, 10 schools (or 71%) have received SPARK training. At these
schools, a total of 16 PE teachers and 0 coordinators have been trained in
SPARK. Table 1 shows the Scotland County K-8 schools that have received
SPARK training and the number of staff trained. FitnessGram Response Rates
are also given for each of the K-8 schools.
Table 1
Scotland County K-8 Schools
Schools with SPARK Training and FitnessGram Response Rates
ID School Name
DEMOGRAPHICS SPARK FITNESSGRAM
2009-2010 ADM
% Needy
SPARK Trained?
# Staff Trained
Using FG?
FG Response Rates
Grades 1-2
Grades 3-5
Grades 6-8
304 Carver Middle 481 78% YES 1 NO NA NA 0%
312 Covington Street Elem 322 69% NO 0 NO 0% 0% NA
316 East Laurinburg 69 95% NO 0 NO NA NA 0%
320 I E Johnson Elementary 370 98% YES 1 NO 0% 0% NA
328 Laurel Hill Elementary 464 73% YES 1 NO 0% 0% NA
336 North Laurinburg Elem 242 98% YES 1 NO 0% 0% NA
344 Pate-Gardner Elementary 160 81% NO 0 NO 0% 0% NA
345 Scotland Accelerated 145 100% YES 1 NO 0% 0% NA
347 Shaw Elementary 181 89% NO 0 NO NA 0% NA
349 Spring Hill Middle 473 66% YES 3 NO NA NA 0%
350 Sycamore Lane Middle 528 70% YES 3 NO NA NA 0%
356 South Scotland Elementary 376 56% YES 2 YES 98% 99% NA
360 Wagram Primary 335 90% YES 2 NO 0% 0% NA
364 Washington Park Elem 349 59% YES 1 NO 0% 0% NA
2010 NC IsPOD Evaluation Conducte4d by NCAAHPERD/NC DPH
All rights reserved.
2
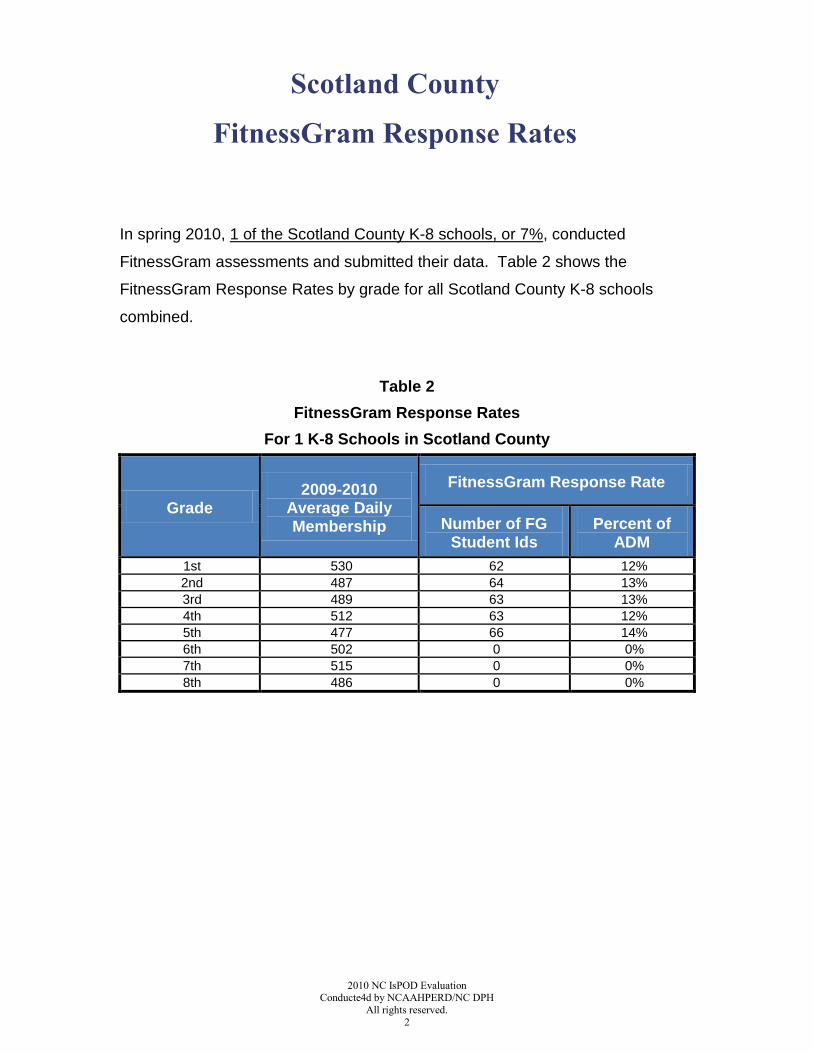
Scotland County
FitnessGram Response Rates
In spring 2010, 1 of the Scotland County K-8 schools, or 7%, conducted
FitnessGram assessments and submitted their data. Table 2 shows the
FitnessGram Response Rates by grade for all Scotland County K-8 schools
combined.
Table 2
FitnessGram Response Rates
For 1 K-8 Schools in Scotland County
Grade 2009-2010
Average Daily Membership
FitnessGram Response Rate
Number of FG Student Ids
Percent of ADM
1st 530 62 12%
2nd 487 64 13%
3rd 489 63 13%
4th 512 63 12%
5th 477 66 14%
6th 502 0 0%
7th 515 0 0%
8th 486 0 0%
2010 NC IsPOD Evaluation Conducted by NCAAHPERD/NC DPH
All rights reserved.
3
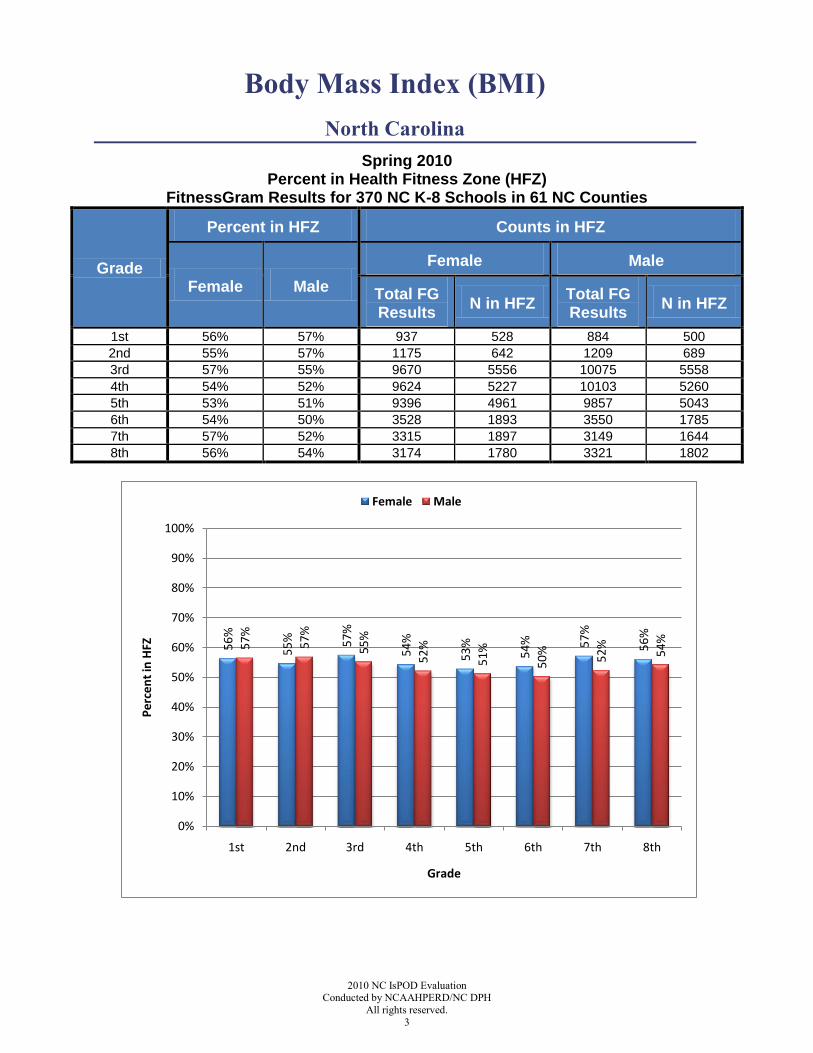
Body Mass Index (BMI)
North Carolina
Spring 2010 Percent in Health Fitness Zone (HFZ)
FitnessGram Results for 370 NC K-8 Schools in 61 NC Counties
Grade
Percent in HFZ Counts in HFZ
Female Male
Female Male
Total FG Results
N in HFZ Total FG Results
N in HFZ
1st 56% 57% 937 528 884 500
2nd 55% 57% 1175 642 1209 689
3rd 57% 55% 9670 5556 10075 5558
4th 54% 52% 9624 5227 10103 5260
5th 53% 51% 9396 4961 9857 5043
6th 54% 50% 3528 1893 3550 1785
7th 57% 52% 3315 1897 3149 1644
8th 56% 54% 3174 1780 3321 1802
56%
55% 57%
54%
53%
54% 57%
56%
57%
57%
55%
52%
51%
50%
52%
54%
0%
10%
20%
30%
40%
50%
60%
70%
80%
90%
100%
1st 2nd 3rd 4th 5th 6th 7th 8th
Pe
rce
nt
in H
FZ
Grade
Female Male
2010 NC IsPOD Evaluation Conducte4d by NCAAHPERD/NC DPH
All rights reserved.
4
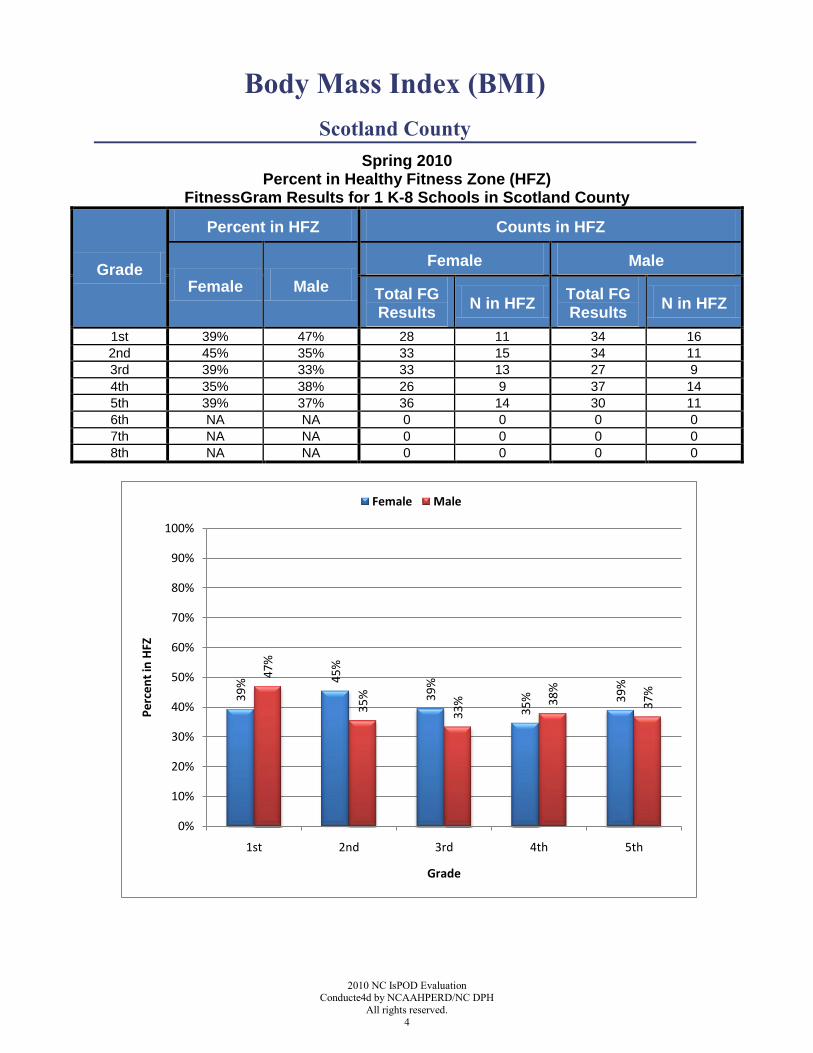
Body Mass Index (BMI)
Scotland County
Spring 2010 Percent in Healthy Fitness Zone (HFZ)
FitnessGram Results for 1 K-8 Schools in Scotland County
Grade
Percent in HFZ Counts in HFZ
Female Male
Female Male
Total FG Results
N in HFZ Total FG Results
N in HFZ
1st 39% 47% 28 11 34 16
2nd 45% 35% 33 15 34 11
3rd 39% 33% 33 13 27 9
4th 35% 38% 26 9 37 14
5th 39% 37% 36 14 30 11
6th NA NA 0 0 0 0
7th NA NA 0 0 0 0
8th NA NA 0 0 0 0
39% 45%
39%
35% 39%
47%
35%
33% 38%
37%
0%
10%
20%
30%
40%
50%
60%
70%
80%
90%
100%
1st 2nd 3rd 4th 5th
Pe
rce
nt
in H
FZ
Grade
Female Male
2010 NC IsPOD Evaluation Conducted by NCAAHPERD/NC DPH
All rights reserved.
5
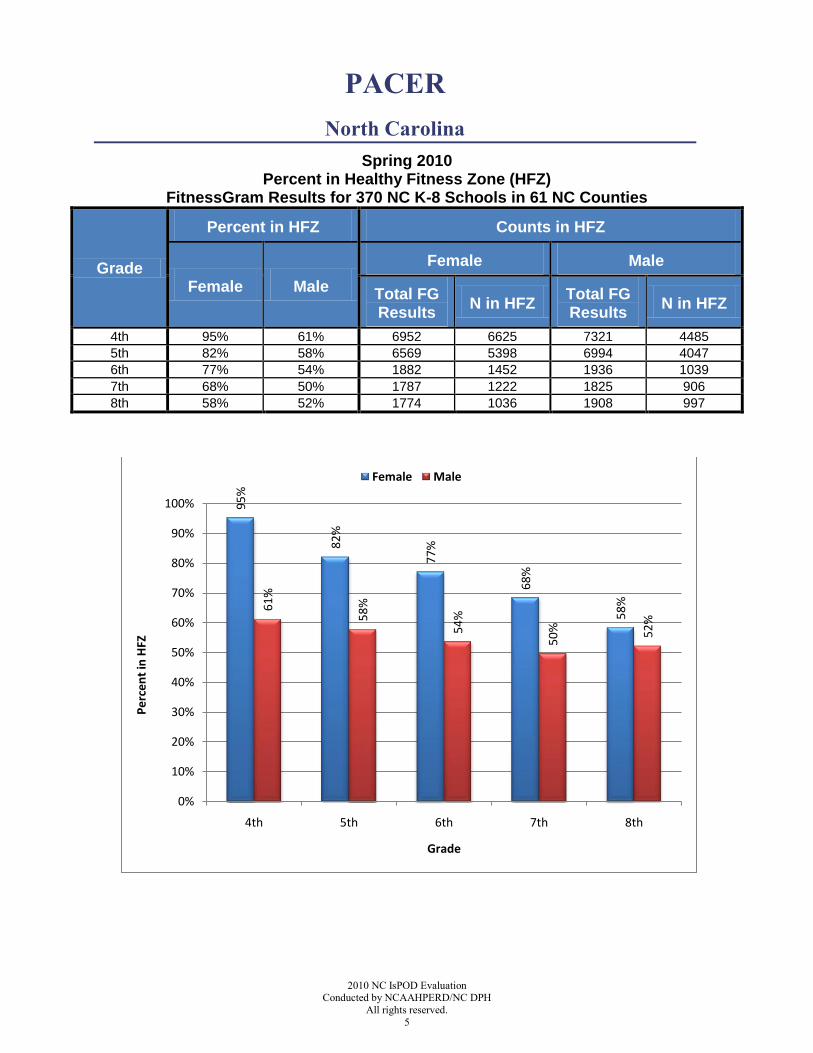
PACER
North Carolina
Spring 2010 Percent in Healthy Fitness Zone (HFZ)
FitnessGram Results for 370 NC K-8 Schools in 61 NC Counties
Grade
Percent in HFZ Counts in HFZ
Female Male
Female Male
Total FG Results
N in HFZ Total FG Results
N in HFZ
4th 95% 61% 6952 6625 7321 4485
5th 82% 58% 6569 5398 6994 4047
6th 77% 54% 1882 1452 1936 1039
7th 68% 50% 1787 1222 1825 906
8th 58% 52% 1774 1036 1908 997
95%
82%
77%
68%
58%61%
58%
54%
50% 52%
0%
10%
20%
30%
40%
50%
60%
70%
80%
90%
100%
4th 5th 6th 7th 8th
Pe
rce
nt
in H
FZ
Grade
Female Male
2010 NC IsPOD Evaluation Conducte4d by NCAAHPERD/NC DPH
All rights reserved.
6
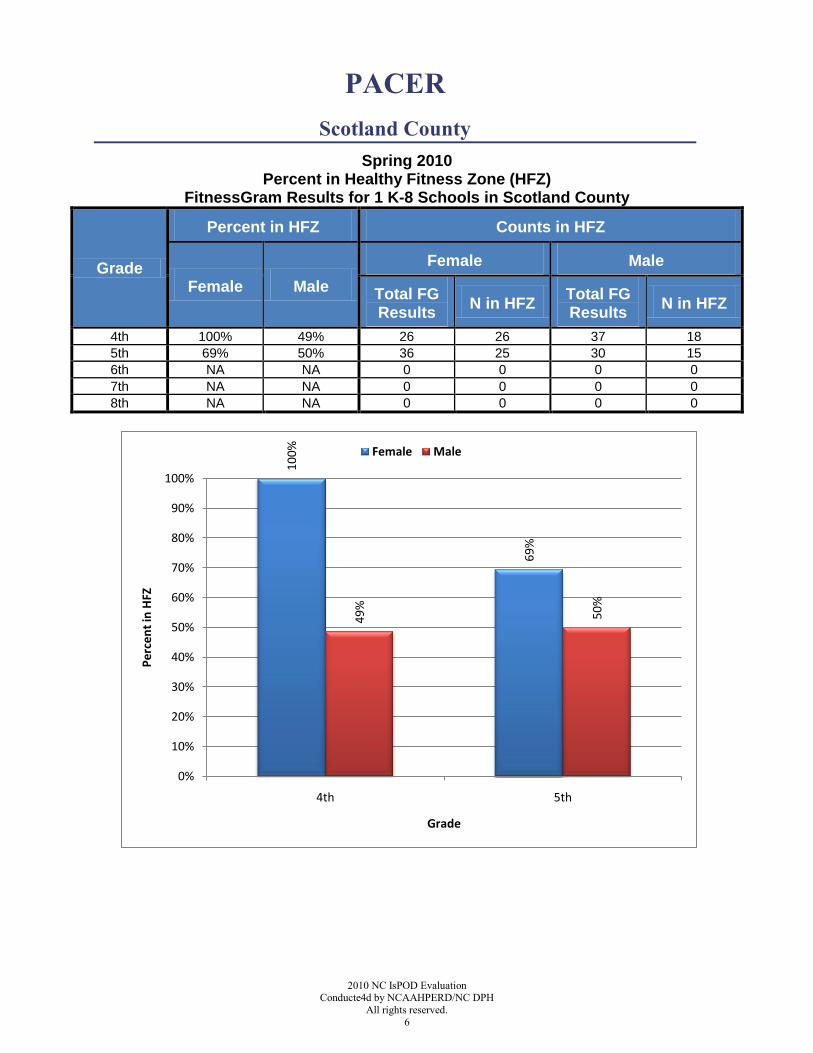
PACER
Scotland County
Spring 2010 Percent in Healthy Fitness Zone (HFZ)
FitnessGram Results for 1 K-8 Schools in Scotland County
Grade
Percent in HFZ Counts in HFZ
Female Male
Female Male
Total FG Results
N in HFZ Total FG Results
N in HFZ
4th 100% 49% 26 26 37 18
5th 69% 50% 36 25 30 15
6th NA NA 0 0 0 0
7th NA NA 0 0 0 0
8th NA NA 0 0 0 0
100%
69%
49%
50%
0%
10%
20%
30%
40%
50%
60%
70%
80%
90%
100%
4th 5th
Pe
rce
nt
in H
FZ
Grade
Female Male
2010 NC IsPOD Evaluation Conducted by NCAAHPERD/NC DPH
All rights reserved.
7
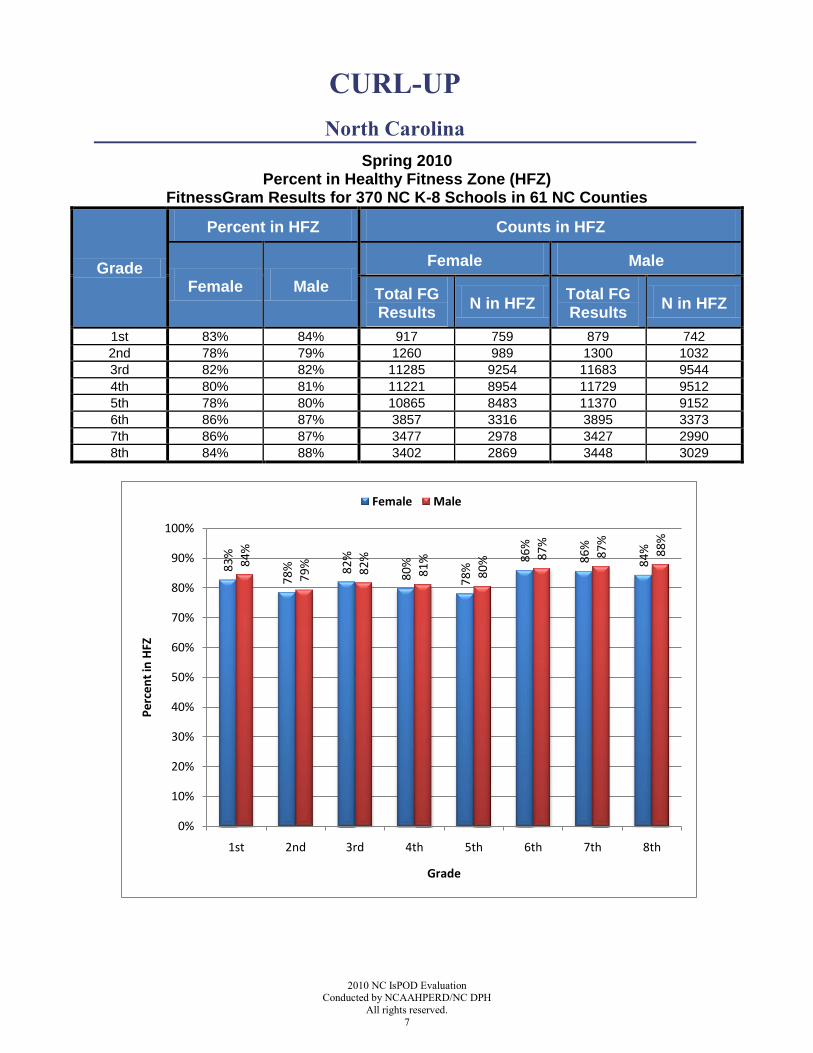
CURL-UP
North Carolina
Spring 2010 Percent in Healthy Fitness Zone (HFZ)
FitnessGram Results for 370 NC K-8 Schools in 61 NC Counties
Grade
Percent in HFZ Counts in HFZ
Female Male
Female Male
Total FG Results
N in HFZ Total FG Results
N in HFZ
1st 83% 84% 917 759 879 742
2nd 78% 79% 1260 989 1300 1032
3rd 82% 82% 11285 9254 11683 9544
4th 80% 81% 11221 8954 11729 9512
5th 78% 80% 10865 8483 11370 9152
6th 86% 87% 3857 3316 3895 3373
7th 86% 87% 3477 2978 3427 2990
8th 84% 88% 3402 2869 3448 3029
83%
78% 82%
80%
78%
86%
86%
84%
84%
79% 82%
81%
80% 87%
87%
88%
0%
10%
20%
30%
40%
50%
60%
70%
80%
90%
100%
1st 2nd 3rd 4th 5th 6th 7th 8th
Pe
rce
nt
in H
FZ
Grade
Female Male
2010 NC IsPOD Evaluation Conducte4d by NCAAHPERD/NC DPH
All rights reserved.
8
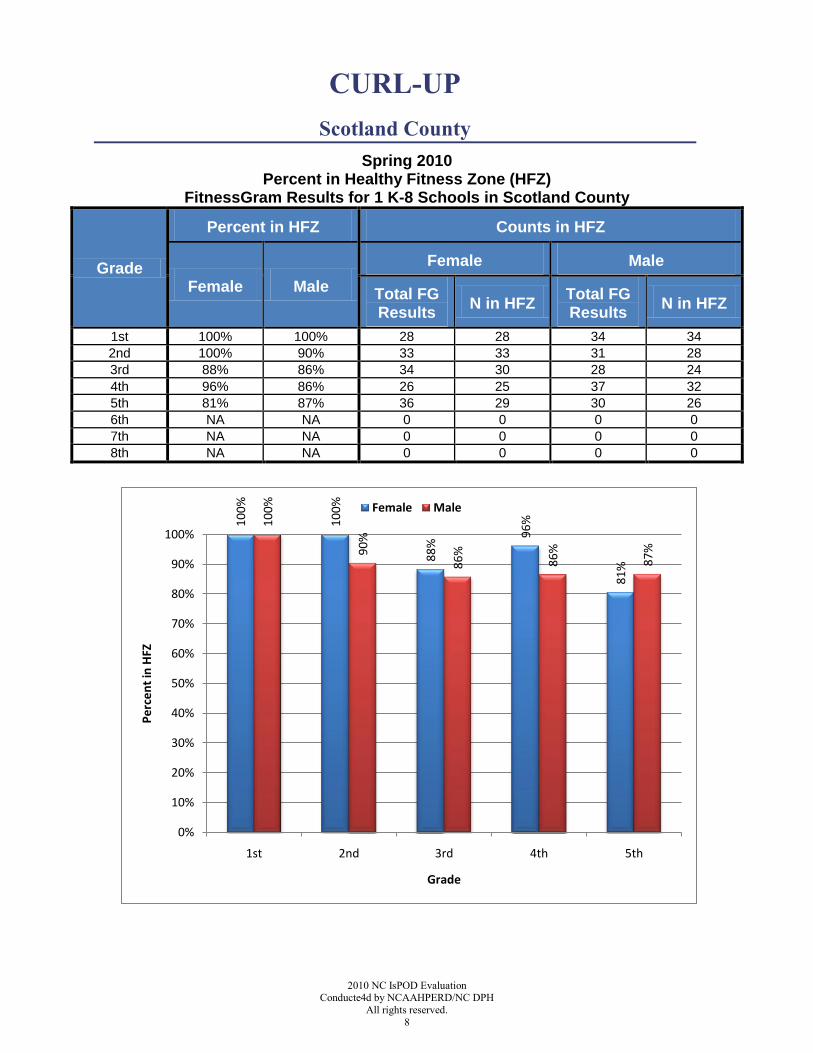
CURL-UP
Scotland County
Spring 2010 Percent in Healthy Fitness Zone (HFZ)
FitnessGram Results for 1 K-8 Schools in Scotland County
Grade
Percent in HFZ Counts in HFZ
Female Male
Female Male
Total FG Results
N in HFZ Total FG Results
N in HFZ
1st 100% 100% 28 28 34 34
2nd 100% 90% 33 33 31 28
3rd 88% 86% 34 30 28 24
4th 96% 86% 26 25 37 32
5th 81% 87% 36 29 30 26
6th NA NA 0 0 0 0
7th NA NA 0 0 0 0
8th NA NA 0 0 0 0
100%
100%
88%
96%
81%
100%
90%
86%
86%
87%
0%
10%
20%
30%
40%
50%
60%
70%
80%
90%
100%
1st 2nd 3rd 4th 5th
Pe
rce
nt
in H
FZ
Grade
Female Male
2010 NC IsPOD Evaluation Conducted by NCAAHPERD/NC DPH
All rights reserved.
9
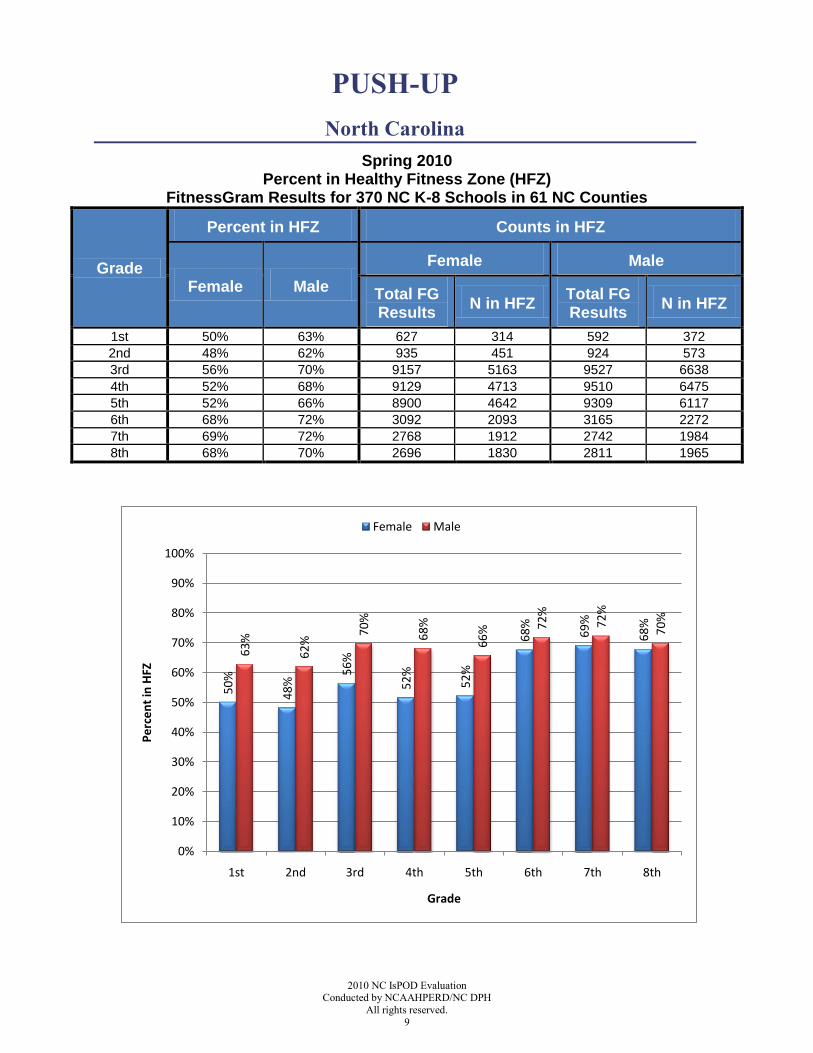
PUSH-UP
North Carolina
Spring 2010 Percent in Healthy Fitness Zone (HFZ)
FitnessGram Results for 370 NC K-8 Schools in 61 NC Counties
Grade
Percent in HFZ Counts in HFZ
Female Male
Female Male
Total FG Results
N in HFZ Total FG Results
N in HFZ
1st 50% 63% 627 314 592 372
2nd 48% 62% 935 451 924 573
3rd 56% 70% 9157 5163 9527 6638
4th 52% 68% 9129 4713 9510 6475
5th 52% 66% 8900 4642 9309 6117
6th 68% 72% 3092 2093 3165 2272
7th 69% 72% 2768 1912 2742 1984
8th 68% 70% 2696 1830 2811 1965
50%
48%
56%
52%
52%
68%
69%
68%
63%
62%
70%
68%
66% 72%
72%
70%
0%
10%
20%
30%
40%
50%
60%
70%
80%
90%
100%
1st 2nd 3rd 4th 5th 6th 7th 8th
Pe
rce
nt
in H
FZ
Grade
Female Male
2010 NC IsPOD Evaluation Conducte4d by NCAAHPERD/NC DPH
All rights reserved.
10
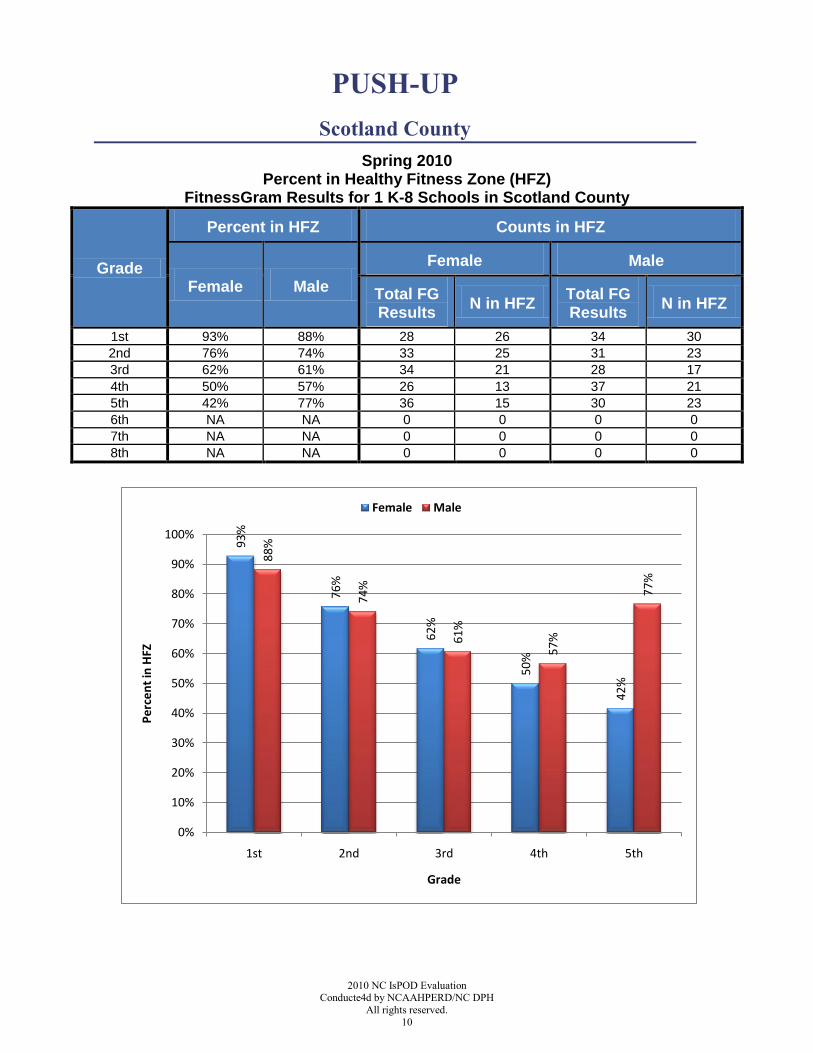
PUSH-UP
Scotland County
Spring 2010 Percent in Healthy Fitness Zone (HFZ)
FitnessGram Results for 1 K-8 Schools in Scotland County
Grade
Percent in HFZ Counts in HFZ
Female Male
Female Male
Total FG Results
N in HFZ Total FG Results
N in HFZ
1st 93% 88% 28 26 34 30
2nd 76% 74% 33 25 31 23
3rd 62% 61% 34 21 28 17
4th 50% 57% 26 13 37 21
5th 42% 77% 36 15 30 23
6th NA NA 0 0 0 0
7th NA NA 0 0 0 0
8th NA NA 0 0 0 0
93%
76%
62%
50%
42%
88%
74%
61%
57%
77%
0%
10%
20%
30%
40%
50%
60%
70%
80%
90%
100%
1st 2nd 3rd 4th 5th
Pe
rce
nt
in H
FZ
Grade
Female Male
2010 NC IsPOD Evaluation Conducted by NCAAHPERD/NC DPH
All rights reserved.
11
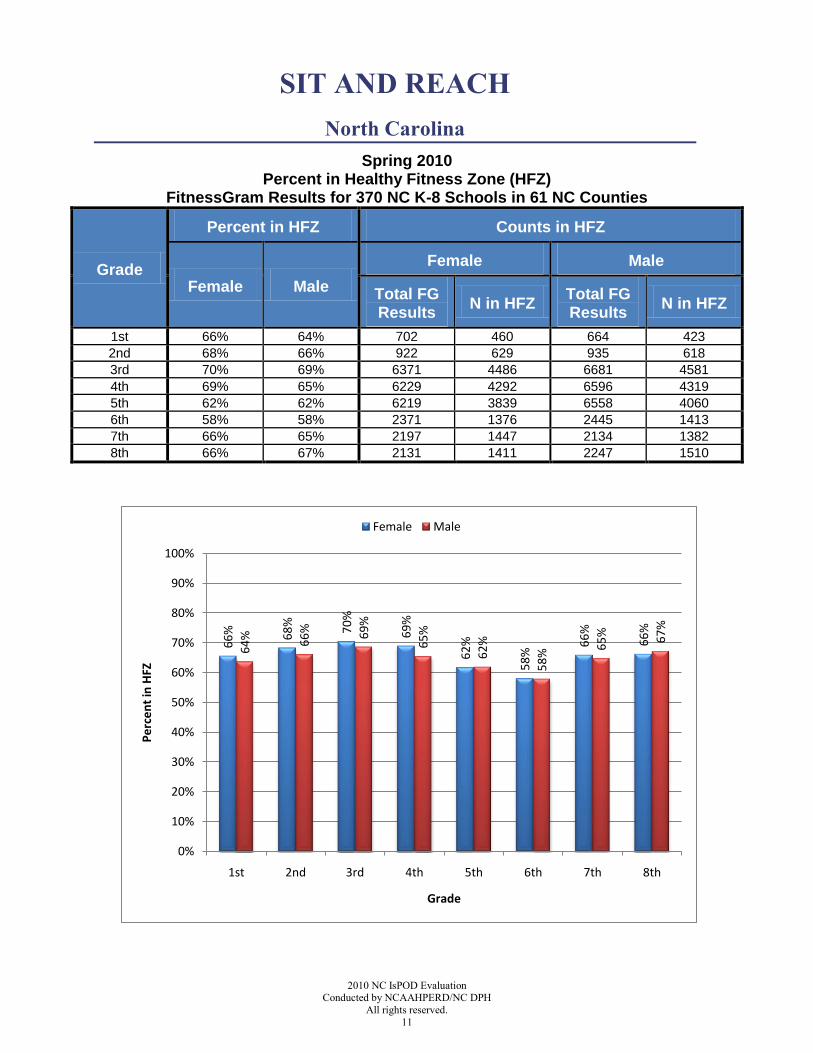
SIT AND REACH
North Carolina
Spring 2010 Percent in Healthy Fitness Zone (HFZ)
FitnessGram Results for 370 NC K-8 Schools in 61 NC Counties
Grade
Percent in HFZ Counts in HFZ
Female Male
Female Male
Total FG Results
N in HFZ Total FG Results
N in HFZ
1st 66% 64% 702 460 664 423
2nd 68% 66% 922 629 935 618
3rd 70% 69% 6371 4486 6681 4581
4th 69% 65% 6229 4292 6596 4319
5th 62% 62% 6219 3839 6558 4060
6th 58% 58% 2371 1376 2445 1413
7th 66% 65% 2197 1447 2134 1382
8th 66% 67% 2131 1411 2247 1510
66% 68%
70%
69%
62%
58%
66%
66%
64% 66% 69%
65%
62%
58%
65% 67%
0%
10%
20%
30%
40%
50%
60%
70%
80%
90%
100%
1st 2nd 3rd 4th 5th 6th 7th 8th
Pe
rce
nt
in H
FZ
Grade
Female Male
2010 NC IsPOD Evaluation Conducte4d by NCAAHPERD/NC DPH
All rights reserved.
12
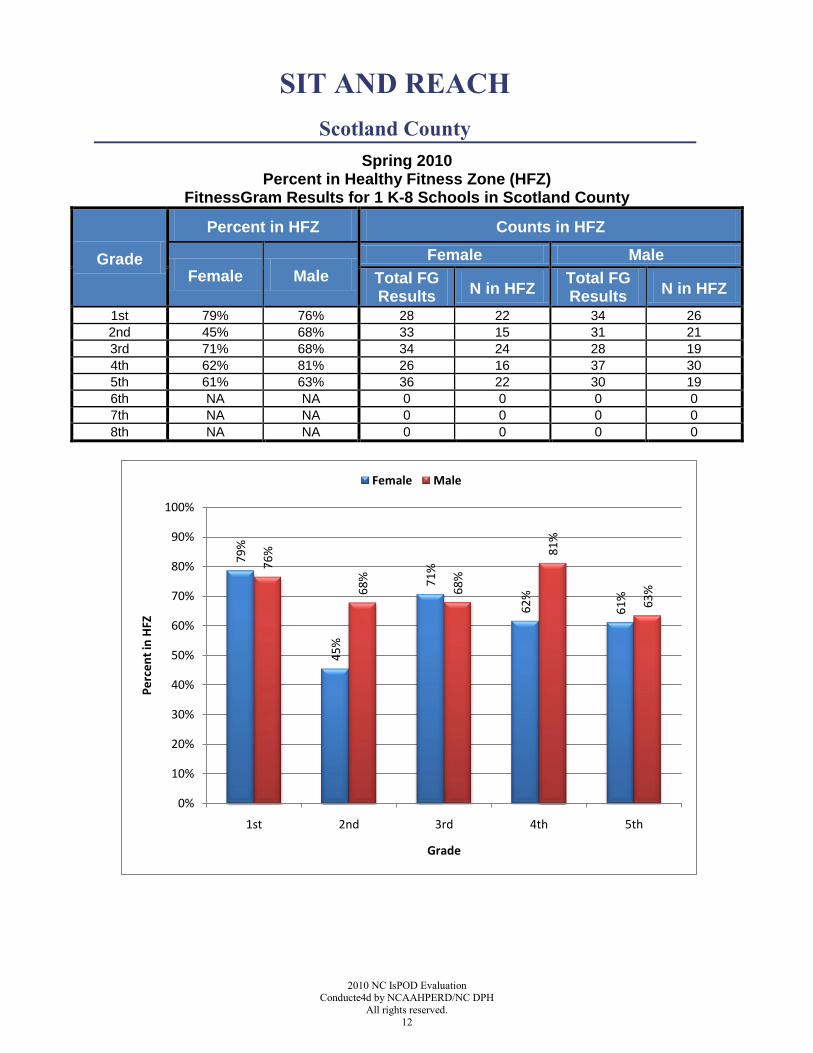
SIT AND REACH
Scotland County
Spring 2010 Percent in Healthy Fitness Zone (HFZ)
FitnessGram Results for 1 K-8 Schools in Scotland County
Grade
Percent in HFZ Counts in HFZ
Female Male
Female Male
Total FG Results
N in HFZ Total FG Results
N in HFZ
1st 79% 76% 28 22 34 26
2nd 45% 68% 33 15 31 21
3rd 71% 68% 34 24 28 19
4th 62% 81% 26 16 37 30
5th 61% 63% 36 22 30 19
6th NA NA 0 0 0 0
7th NA NA 0 0 0 0
8th NA NA 0 0 0 0
79%
45%
71%
62%
61%
76%
68%
68%
81%
63%
0%
10%
20%
30%
40%
50%
60%
70%
80%
90%
100%
1st 2nd 3rd 4th 5th
Pe
rce
nt
in H
FZ
Grade
Female Male
2010 NC IsPOD Evaluation Conducted by NCAAHPERD/NC DPH
All rights reserved.
13
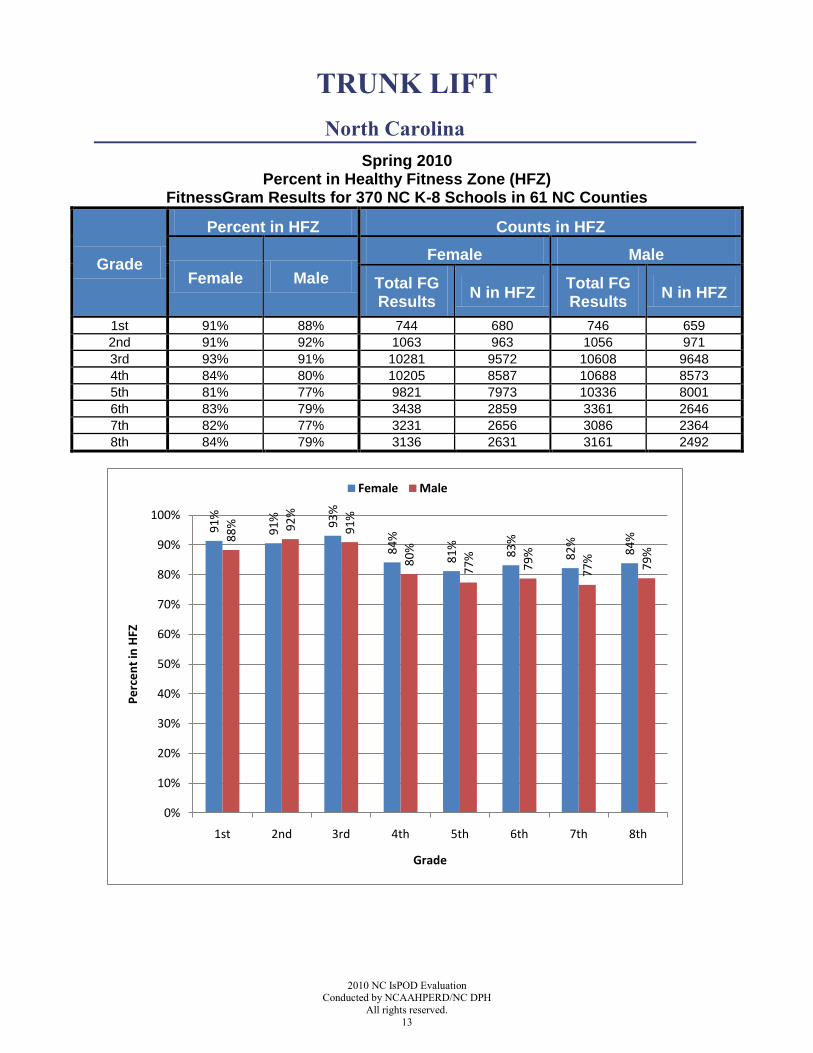
TRUNK LIFT
North Carolina
Spring 2010 Percent in Healthy Fitness Zone (HFZ)
FitnessGram Results for 370 NC K-8 Schools in 61 NC Counties
Grade
Percent in HFZ Counts in HFZ
Female Male
Female Male
Total FG Results
N in HFZ Total FG Results
N in HFZ
1st 91% 88% 744 680 746 659
2nd 91% 92% 1063 963 1056 971
3rd 93% 91% 10281 9572 10608 9648
4th 84% 80% 10205 8587 10688 8573
5th 81% 77% 9821 7973 10336 8001
6th 83% 79% 3438 2859 3361 2646
7th 82% 77% 3231 2656 3086 2364
8th 84% 79% 3136 2631 3161 2492
91%
91% 93%
84%
81%
83%
82%
84%88% 92%
91%
80%
77%
79%
77%
79%
0%
10%
20%
30%
40%
50%
60%
70%
80%
90%
100%
1st 2nd 3rd 4th 5th 6th 7th 8th
Pe
rce
nt
in H
FZ
Grade
Female Male
2010 NC IsPOD Evaluation Conducte4d by NCAAHPERD/NC DPH
All rights reserved.
14
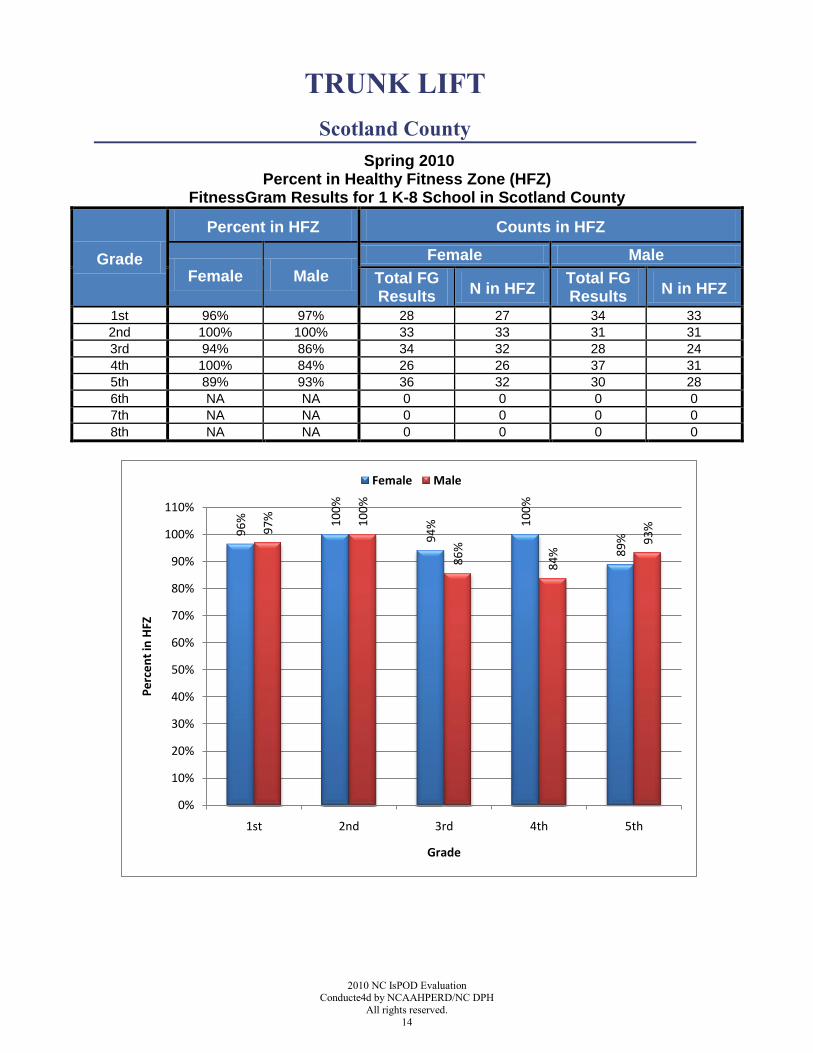
TRUNK LIFT
Scotland County
Spring 2010 Percent in Healthy Fitness Zone (HFZ)
FitnessGram Results for 1 K-8 School in Scotland County
Grade
Percent in HFZ Counts in HFZ
Female Male
Female Male
Total FG Results
N in HFZ Total FG Results
N in HFZ
1st 96% 97% 28 27 34 33
2nd 100% 100% 33 33 31 31
3rd 94% 86% 34 32 28 24
4th 100% 84% 26 26 37 31
5th 89% 93% 36 32 30 28
6th NA NA 0 0 0 0
7th NA NA 0 0 0 0
8th NA NA 0 0 0 0
96% 100%
94% 100%
89%
97% 100%
86%
84%
93%
0%
10%
20%
30%
40%
50%
60%
70%
80%
90%
100%
110%
1st 2nd 3rd 4th 5th
Pe
rce
nt
in H
FZ
Grade
Female Male