Embed Size (px)
Citation preview
7/26/2019 Ispe Om Cop Oee Apr2011stateartpharmaind
http://slidepdf.com/reader/full/ispe-om-cop-oee-apr2011stateartpharmaind 1/2
Overall Equipment Effectiveness (OEE) and Its Application in Pharma/Biopharma Manufacturing
Part 2 of 4 – OEE State of the Art in the Pharma Industry
Introduction
Overall Equipment Effectiveness (OEE) is finding increasing acceptance in the pharma industry. There
was considerable initial reluctance to adopt a measure which was not seen as readily translated from
other industries to pharma. Resistance was particularly strong in primary manufacturing (API) where
multi-purpose processing equipment is often used and throughput rates and efficiency are highly
product mix dependent. However, it is clear that leading Operational Excellence practitioners have
recognized the value of implementing a measure such as OEE and many companies are now using it
in all parts of their operations.
Practical application of OEE¹
A major reason for the hesitation in using OEE within pharma is the fact that historically plants were
not run to high levels of capacity utilization. The industry has operated with excessive levels of
capacity built up over time with the key objective of serving local or regional markets. The focus on
cost reduction and ongoing mergers have now exposed these high levels of excess capacity. It was
not unusual to find sterile formulation plants operating at OEE levels below 10%, whereas typical
solid oral formulation plants operated with OEEs of about 30%. Multi-purpose packaging lines also
have OEE levels of about 25 to 30%. In the primary end of manufacturing we usually find higher levels
of OEE – multi-purpose API plants can usually achieve OEEs of 70% and dedicated API plants should
be operating at 90%+.
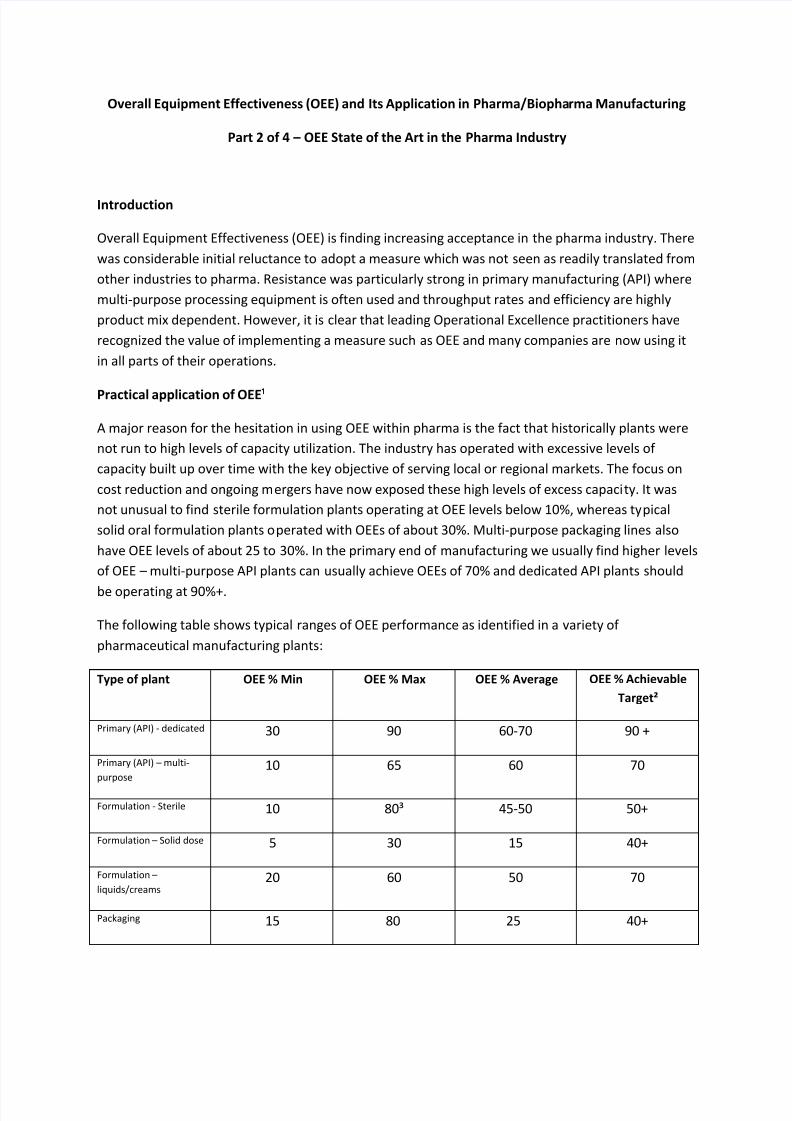
The following table shows typical ranges of OEE performance as identified in a variety of
pharmaceutical manufacturing plants:
Type of plant OEE % Min OEE % Max OEE % Average OEE % Achievable
Target²
Primary (API) - dedicated 30 90 60-70 90 +
Primary (API) – multi-
purpose10 65 60 70
Formulation - Sterile 10 80³ 45-50 50+
Formulation – Solid dose 5 30 15 40+
Formulation –
liquids/creams20 60 50 70
Packaging 15 80 25 40+

7/26/2019 Ispe Om Cop Oee Apr2011stateartpharmaind
http://slidepdf.com/reader/full/ispe-om-cop-oee-apr2011stateartpharmaind 2/2
Making it happen
Leading exponents of Operational Excellence are making OEE measures an integral part of their visual
management systems. Line by line measurements on a daily basis are making improvement
opportunities visible and encouraging process teams to adopt ownership of line efficiency.
Companies are reviewing OEE performance on a daily basis and use this to drive root cause analysisof below target performance.
In the remaining E-letters we will explore further practical aspects of deploying OEE in the pharma
industry.
To Follow:
Part 3 Applying OEE; approaches and supporting technologies
Part 4 Experience of implementing OEE – Identifying and overcoming barriers
¹ See the first e-letter in this series for detailed definitions of OEE and PEE.
² Target OEE must reflect product mix and shift operating patterns. Plants operating at less than 24/7 must
have targets adjusted to reflect local conditions.
³ This high level of OEE reflect a facility operating 24/7 with a single product meaning minimal changeovers.