Embed Size (px)
Citation preview

1
OCTOBER 28, 2014 | RELEASE 1.0
ISP Interconnection and its Impact on Consumer Internet Performance
A Measurement Lab Consortium Technical Report
MEASUREMENT LAB CONSORTIUM | measurementlab.net ISP Interconnection and its Impact on Consumer Internet Performance
2
Table of Contents
Table of Contents What is interconnection, and why study it? What are the key study findings? How do we use M-Lab data to study the impact of interconnection?
Methodology Study limitations
Case studies and results Cogent and Internap - New York City Cogent - Dallas, Los Angeles, and Seattle Level 3 - Atlanta and Chicago XO - Washington, D.C.
Conclusion Appendix What is Measurement Lab and how does it work?
Measurement tools Measurement points Data collection and openness
Open Data - Reproduce this research Access our data Review our measurement methodology Review our open infrastructure Discuss this research
© 2014 Measurement Lab Consortium
MEASUREMENT LAB CONSORTIUM | measurementlab.net ISP Interconnection and its Impact on Consumer Internet Performance

3
What is interconnection, and why study it? Interconnection is the mutual exchange of traffic across separate networks by contractual agreement between different Internet service providers (ISPs). Interconnection puts the “inter” in the Internet, joining many networks into a single system that permits one connected device to reach other connected devices, regardless of where or how they are connected. Interconnection is both definitive of the Internet, and a manifestation of a business relationship between two ISPs. In order to exchange traffic directly via interconnection, two ISPs physically connect in places where they both have facilities, such as in an Internet exchange point. This is usually achieved by linking short wires between routers belonging to one ISP and routers 1 2
belonging to a second ISP. Making this physical connection is rarely expensive or tricky – much less so than laying new undersea cable, or digging ditches to install new fiber or other network infrastructure. The traffic that flows through interconnections is the lifeblood of the Internet – nearly all of the value of the Internet comes from the exchange of traffic across networks, even when the ISPs involved are fierce competitors. As a result, the business arrangements associated with interconnection are not inconsequential, and can be complex and hotly negotiated. Once ISPs agree on an arrangement, interconnections are typically maintained as common infrastructure between both parties. In some cases, traffic to and from more than one Access ISP may transit a single interconnection, or conversely, a given 3
Access ISP may have multiple and distinct interconnection points with a given Transit ISP. 4
Further study could productively explore the differences and how they result to this scope of research. While interconnection has a profound impact on all aspects of Internet performance, it is nearly always implemented and visible only to ISPs and the engineers who run their networks. It’s thus both remote from consumers, literally and conceptually, and difficult to observe. Studying the way interconnection impacts network performance provides insight into the health of Internet infrastructure, and the way in which its management and maintenance directly impacts consumers. This work expands on current consumer Internet performance research, moving from a focus on the performance of Access ISPs’ edge
1 To be precise, these are nearly always fiber optic cables, not copper (or other) wires. These wires are distinct from the long wires that ISPs use in order to connect more distant points. 2 These routers are different from the routers most people have at home. In particular, they forward a lot more traffic and they participate in the Border Gateway Protocol, which determines how traffic flows on the Internet at large. 3 We use the term “Access ISP” to refer to consumer-facing ISPs that sell Internet service to individual consumers and businesses. The bill you pay monthly for Internet service is paid to an Access ISP. Access ISPs provide access to the Internet itself, deploying network infrastructure that reaches individual homes, businesses, and connected mobile devices. 4 We use the term “Transit ISP” to refer to the ISPs that sell long-haul connectivity, usually to other ISPs. Transit ISPs own and provide access to undersea cables and cross-continent fiber, and do the job of carrying traffic from Access ISP customers to its destination anywhere on the Internet and back. Note that an Access ISP can also take on the role of a Transit ISP these being terms that define a relationship between ISPs and not mutually exclusive categories. (Many Access ISPs in the US also act as Transit ISPs, for instance.)
MEASUREMENT LAB CONSORTIUM | measurementlab.net ISP Interconnection and its Impact on Consumer Internet Performance

4
networks to an analysis of how the Internet performs as an integrated system, including the 5
complex business and technical relationships that shape the expectations and experience of consumers.
What are the key study findings? Using Measurement Lab (M-Lab) data, and constraining our research to the United States, we observed sustained performance degradation experienced by customers of Access ISPs AT&T, Comcast, Centurylink, Time Warner Cable, and Verizon when their traffic passed over interconnections with Transit ISPs Cogent Communications (Cogent), Level 3 Communications (Level 3), and XO Communications (XO). In a large number of cases we observed similar patterns of performance degradation whenever and wherever specific pairs of Access/Transit ISPs interconnected. From this we conclude that ISP interconnection has a substantial impact on consumer internet performance -- sometimes a severely negative impact -- and that business relationships between ISPs, and not major technical problems, are at the root of the problems we observed. Observed performance degradation was nearly always diurnal, such that performance for access ISP customers was significantly worse during peak use hours, defined by the Federal Communications Commission (FCC) as the hours between 7pm and 11pm local time. 6
This allows us to conclude that congestion and under-provisioning were causal factors in the observed degradation symptoms. 7
It is important to note that while we can infer that performance degradation is interconnection-related, we do not have the contractual details and histories of individual interconnection agreements. As such, we cannot conclude whether parties apart from the two we identify are also involved (e.g. in the case that an Access ISP shares an interconnection point with another, etc.). We leave this non-technical question open for further study by others and focus here on the impact of what we can observe on consumer performance through measurement.
5 We use the common term “edge network” to refer to the connection between access ISPs and their customers (also typically referred to as the "last mile”). Since these networks are generally owned by the ISP and contain individual per-customer infrastructure, they are usually the most expensive per-bit-of-capacity infrastructure for an ISP, and can be difficult to maintain and monitor. This is in part why consumer internet performance analysis has often focused on edge networks rather than interconnection. 6 http://www.fcc.gov/reports/measuring-broadband-america-2014 7 Network congestion can be observed via rising round trip times (latency due to queueing), increased packet retransmission rates and decreased download throughput occurring during periods of high network use (e.g. peak use hours as defined by the FCC). Under ideal conditions, all of the metrics collected by M-Lab’s Network Diagnostic Tool would be essentially uniform or flat over time, and the inherent limitations of the network -- those that determine the baseline download throughput, round trip time, and packet retransmission rate -- would be constant. Under such conditions, these performance metrics would show no variations by time-of-day or from day-to-day, except perhaps an upward trend reflecting various service and equipment upgrades. However, when there is insufficient capacity in some shared portion of the network there will be performance degradation or “sags” during daily peak use hours, as traffic load increases and strains limited network capacity. During these peak use times download throughput will drop, and round trip times and packet retransmission rates will likely rise. An important point to remember about diurnal variations: they nearly always reflect human behavior and are, for the metrics measured by M-Lab, likely symptoms of congestion related to insufficient capacity.
MEASUREMENT LAB CONSORTIUM | measurementlab.net ISP Interconnection and its Impact on Consumer Internet Performance

5
How do we use M-Lab data to study the impact of interconnection?
Methodology By establishing a diverse set of measurement points in well-connected Transit ISPs , and 8
allowing consumers to test their connection to these locations, M-Lab exposes diverse performance characteristics about the capacity between the Access ISPs’ edge networks used by consumers and the Transit ISP networks on which the M-Lab measurement points (and much online content) are situated. M-Lab’s data reflects how consumer Internet performance varies based the network infrastructure that traffic traverses, including variations caused by the conditions of interconnection points. In conducting this research, we looked at M-Lab data across the US to identify patterns of performance degradation that occurred wherever a given Access ISP and a given Transit ISP exchanged traffic over an interconnection point. We define “degradation” as a drop in download throughput, an increase in round trip time, or an increase in packet 9 10
retransmission rate, measured against a respective baseline of historical performance on a 11
given Access ISP/Transit ISP pair. We identify degradation as interconnection-related when a given drop or increase in pertinent metrics occurs across multiple locations for the same Access ISP/Transit ISP pair during the same time period. For example, in the case of New York City, where we have two measurement points each housed within separate Transit ISPs, we look at performance across the same set of Access ISPs to each of these two separate Transit ISPs, and compare them. Through this comparison, we are able to identify likely cases of interconnection-related degradation.
8 When placing measurement points, M-Lab selected Transit ISP locations such that as many Internet users as possible were one interconnection away from the measurement point. We did this by choosing ISPs that were not themselves Access ISPs, but were well connected with Access ISPs. Thus traffic from tests run by Access ISP customers should cross exactly one interconnection to reach a given measurement point. We did this in order to measure representative Internet performance – performance across ISP boundaries to popular locations where many ISPs interconnect (and thus, representative of traffic accessing popular content and services). We were not interested in simply performance within Access ISPs’ edge networks. 9 Download throughput is a measure of how much data can be transferred in 10 seconds over a single connection between a test client and a measurement point. Download throughput, along with all metrics included here, is measured with M-Lab’s Network Diagnostic Tool. See our Methodological Overview for more details on this and other metrics. 10 M-Lab’s Network Diagnostic Tool measures the round trip time using timers built into standard TCP implementations. Round trip time is the time it takes for a packet to reach a M-Lab measurement point and return to the measuring client. Each individual test measures average (mean) round trip time for the duration of the test. The median of these averages within a sample population across a unit of time is what we are showing when we refer to “round trip time.” 11 Packet retransmission rate is the ratio of packets retransmitted to packets sent. It is a proxy for packet loss.
MEASUREMENT LAB CONSORTIUM | measurementlab.net ISP Interconnection and its Impact on Consumer Internet Performance

6
When we identify a pattern of degradation across locations for a given Access ISP/Transit ISP pair, we also look at the performance of that Access ISP to different transit providers across other locations. If we don’t see the same pattern in those cases, we are more safe in concluding that the observed problem is not specific to the network of a given Access ISP. We then check the performance of the other Access ISPs to the impacted Transit ISP location. If we see Access ISPs that do not evince the same pattern, we are more safe in concluding that this is not a problem specific to the network of the given Transit ISP. Satisfied that the pattern is manifest across other locations and that it is neither a problem endemic to the specific Access ISP nor the specific Transit ISP, we can infer that the issue is likely caused by an interconnection relationship between the Access ISP/Transit ISP pair. This comparative process is reflected in Figure A.
(Figure A) Here we demonstrate how we are able to determine that interconnection is a factor in consumer Internet performance. We do this by comparing M-Lab test results across Access ISP/Transit ISP pairs. Two consumers, connected to two separate access ISPs, run an M-Lab test, illustrated in steps 2 through 4. The first consumer, connected via Access ISP A, runs an M-Lab test against an M-Lab measurement point hosted in Transit ISP X’s network. Her results show poor performance (step 2). She then runs a test against a measurement point hosted in Transit ISP Y’s network (step 3). That time her results show good performance. The second consumer, connected via ISP B, runs an M-Lab test against a measurement point hosted in Transit ISP X (step 4). Unlike the first consumer, his results show good performance. Since the first consumer and the second consumer achieved good performance when testing against Transit ISP Y, and only the second consumer achieved good performance when testing against Transit ISP X, the problem can be narrowed down to the interconnection relationship between ISP A and Transit ISP X.
MEASUREMENT LAB CONSORTIUM | measurementlab.net ISP Interconnection and its Impact on Consumer Internet Performance

7
Using this framework, our research found that the interconnection relationships between ISPs appear to have a notable impact on the quality of service that end-users experience. Below we review representative case studies in which the interconnections between Access ISPs and Transit ISPs appear to have had a negative impact on consumer experience. These cases differ in degree – in its most extreme manifestations, interconnection-related performance degradation resulted in significant barriers to Internet access for end-users. The FCC defines “broadband” as speeds above 4 Mbps, a circa-2010 standard that the 12
Commission is currently considering increasing to 10 Mbps or perhaps higher, and 13
describes 0.5 Mbps as the minimum rate deemed necessary for web browsing and email. 14
However, during the extended episodes of degradation observed in this study, consumers using broadband services to reach the universe of sites and services on the other side of impacted interconnections would have experienced sub-broadband performance – that is, median speeds less than 4 Mbps, and sometimes even as low as 0.5 Mbps.
Study limitations Before reviewing these findings it is important to specify limitations in the scope of our research and the breadth of our conclusions. While we feel safe pinpointing the interconnection relationship between Access/Transit ISPs as a factor in performance degradation, and making the case that in many instances network congestion at interconnection points was a causal factor, it is important to note that we cannot determine which actors or actions are “responsible” for observed degradation. We cannot tell whether any particular ISP between the user and a measurement point is “at fault,” what the contractual agreement between ISPs did or did not dictate vis-a-vis interconnection, or whether specific network modification was done to alleviate or magnify a given incident. Similarly, we cannot identify the precise cause of performance problems (e.g. a broken router) in a path between a client on a given Access ISP and a M-Lab measurement point, although we take steps to narrow the range of possible causes. Our data shows that traffic from specific Access ISP customers across interconnections with specific Transit ISPs experienced degraded performance, and that this degradation forms a pattern wherever specific Access ISPs and Transit ISPs exchange traffic. Speculating beyond that is not within the scope of this report. Also important to note is that routing decisions made by ISPs can result in traffic from a given Access ISP consumer in a given location crossing points of interconnection outside of the immediate vicinity of the consumer (what we describe below as circuitous routing). Routing decisions change over time and could themselves be related to issues with interconnection (e.g. as a network attempts to spread load across less congested links by
12 Here we follow the FCC’s use of the term “broadband” as a shorthand for the statutorily defined “advanced telecommunications capability” from Section 706 of the Telecommunications Act of 1996. 13 https://www.fcc.gov/reports/sixth-broadband-progress-report 14 http://www.fcc.gov/guides/broadband-speed-guide
MEASUREMENT LAB CONSORTIUM | measurementlab.net ISP Interconnection and its Impact on Consumer Internet Performance

8
routing traffic more broadly). Future study could interrogate the routes taken, and delineate more clearly which routes between Access ISP/Transit ISP pairs appear to cross problematic interconnection points and where these points are. For now, we are including the possibility of circuitous routing as an artifact of consumer performance changes (circuitous routing would impact M-Lab and non-M-Lab traffic alike), and are looking simply at the pairwise relationship between specific Access ISPs and specific Transit ISPs, without pinpointing the location of a given problem to one or another specific interconnection point between the two entities. We view this work as a beginning, and look forward to expanding its scope and complexity with collaboration and insight from the global Internet research community. We invite those who are interested in interconnection analysis to visit the M-Lab Observatory and explore the processed data, review our methodological choices, independently reproduce the work, and dig into the raw data.
MEASUREMENT LAB CONSORTIUM | measurementlab.net ISP Interconnection and its Impact on Consumer Internet Performance

9
Case studies and results
Cogent and Internap - New York City
M-Lab has substantial data for customers of Cablevision, Comcast, TWC, and Verizon in the New York City region. During the period between April to June 2013 and late February 15
2014, we observed decreases in download throughput, increases in round trip time, and increases in packet retransmission rates that impacted customers of Comcast, Time Warner Cable, and Verizon Access ISPs when connecting across M-Lab’s Cogent-hosted measurement point in New York City (Figure 1). Degradation was expressed diurnally, with the worst performance occurring during peak use hours, pointing to congestion and under-provisioning. As the degradation symptoms increased, the daily window during which consumers connecting to this site could achieve “normal” performance narrowed further. By January 2014, customers of Comcast, Time Warner Cable, and Verizon were only able to achieve download throughput that met the FCC’s definition of broadband (4 Mbps) between 2:00 am and 1:00 pm (Figure 4).
(Figure 1) Median download throughput achieved by customers of Comcast, Time Warner Cable, and Verizon in the New York City area when connecting across Transit ISP Cogent, January 2013 to September 2014. 16
During the same time period, customers of the Access ISP Cablevision uniformly experienced good performance when connecting to this same Cogent-hosted measurement point (Figure 2). This indicates that Cogent had sufficient capacity in at least some portion of their network and rules out any across-the-board problems with Cogent's network as the cause of degradation observed for other Access ISPs.
15 Determinations about other Access ISPs in this region could not be made due to small sample sizes. The small sample sizes are most likely due to the other Access ISPs having minimal market share in the New York region. 16 For a little over a week in May 2014, M-Lab’s measurement point in Cogent’s network in NYC was powered down for routine maintenance. During this time the measurement point did not receive tests, and data was not collected. You can see this in (Figures 1, 5, and 6) as a small gap in Sample Count.
MEASUREMENT LAB CONSORTIUM | measurementlab.net ISP Interconnection and its Impact on Consumer Internet Performance
10
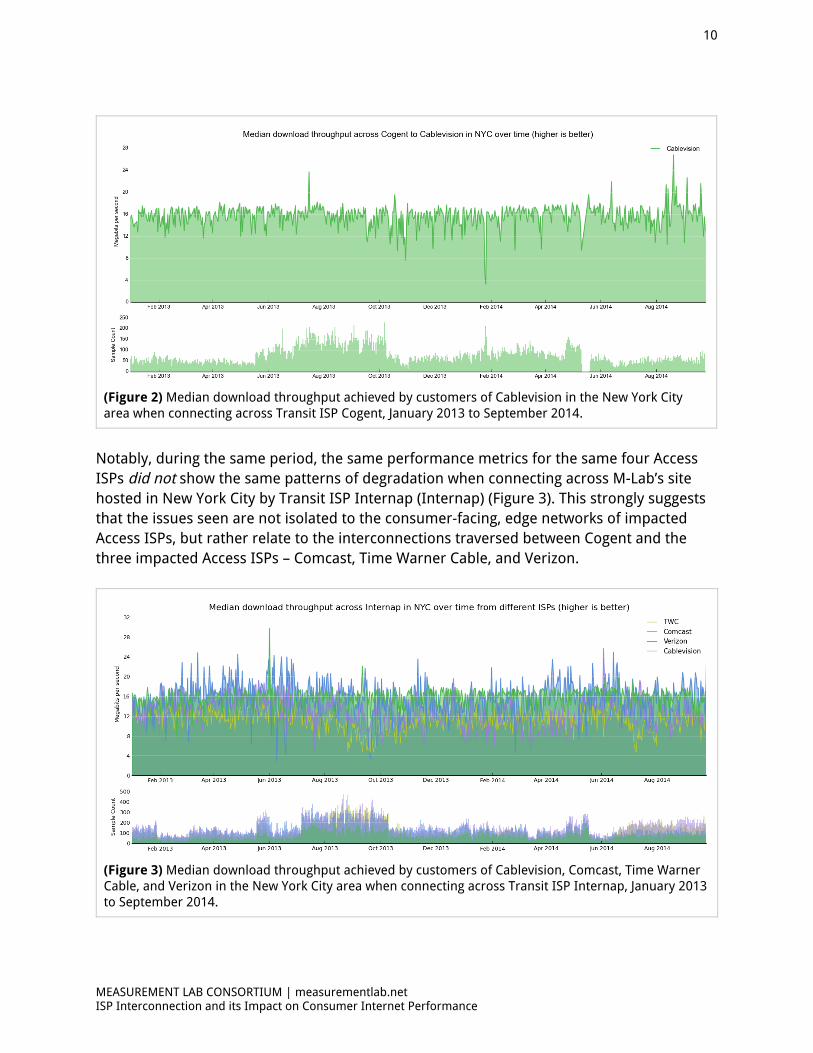
(Figure 2) Median download throughput achieved by customers of Cablevision in the New York City area when connecting across Transit ISP Cogent, January 2013 to September 2014.
Notably, during the same period, the same performance metrics for the same four Access ISPs did not show the same patterns of degradation when connecting across M-Lab’s site hosted in New York City by Transit ISP Internap (Internap) (Figure 3). This strongly suggests that the issues seen are not isolated to the consumer-facing, edge networks of impacted Access ISPs, but rather relate to the interconnections traversed between Cogent and the three impacted Access ISPs – Comcast, Time Warner Cable, and Verizon.
(Figure 3) Median download throughput achieved by customers of Cablevision, Comcast, Time Warner Cable, and Verizon in the New York City area when connecting across Transit ISP Internap, January 2013 to September 2014.
MEASUREMENT LAB CONSORTIUM | measurementlab.net ISP Interconnection and its Impact on Consumer Internet Performance

11
The three degraded Access ISPs failed to achieve median download throughputs above 4 Mbps when connecting over Cogent in New York City for most of the period between Spring 2013 and March 2014. 17
While daily median download throughput overall hovered around 4 Mbps, performance degradation was much worse during peak use hours. For much of the time between Spring 2013 and March 2014, download speeds during peak use hours remained well below 4 Mbps. By January 2014, the download throughput rate during peak use hours for Comcast and Verizon traffic over Cogent’s network was less than 0.5 Mbps, the minimum rate necessary for web browsing and email according to the FCC (Figure 4). Note that only between 2:00 AM and 1:00 PM were the three affected Access ISPs (Comcast, Time Warner Cable, and Verizon) able to attain speeds above 4 Mbps across the Transit ISP Cogent. During peak use, only Cablevision achieved sustained rates above 4 Mbps across Cogent, while all Access ISPs achieved sustained rates above 4 Mbps across Internap throughout the day.
(Figure 4) Median download throughput achieved by customers of Comcast, Time Warner Cable, and Verizon in the New York City area, by hour of the day during an average day in January 2014, when connecting across Transit ISP Cogent. This view shows the extent of download throughput degradation during peak use hours. The FCC defines peak use hours as 7pm to 11pm, local time.
In addition to reduced download throughput, the three Access ISPs saw increased packet retransmission rates and increased round trip times (Figures 5 and 6). Of the three, retransmission and round trip time increases were more pronounced for Verizon and Comcast. By January 2014, Verizon and Comcast both showed a median packet retransmission rate of more than 2 percent, and a round trip time of more than 80 ms, with higher degradation during peak use hours.
17 TWC experiences a return to normal performance briefly for a period from June 11 to July 16, 2013. Why or how this happened is not explicable from the data and is outside of the scope of this research.
MEASUREMENT LAB CONSORTIUM | measurementlab.net ISP Interconnection and its Impact on Consumer Internet Performance
12
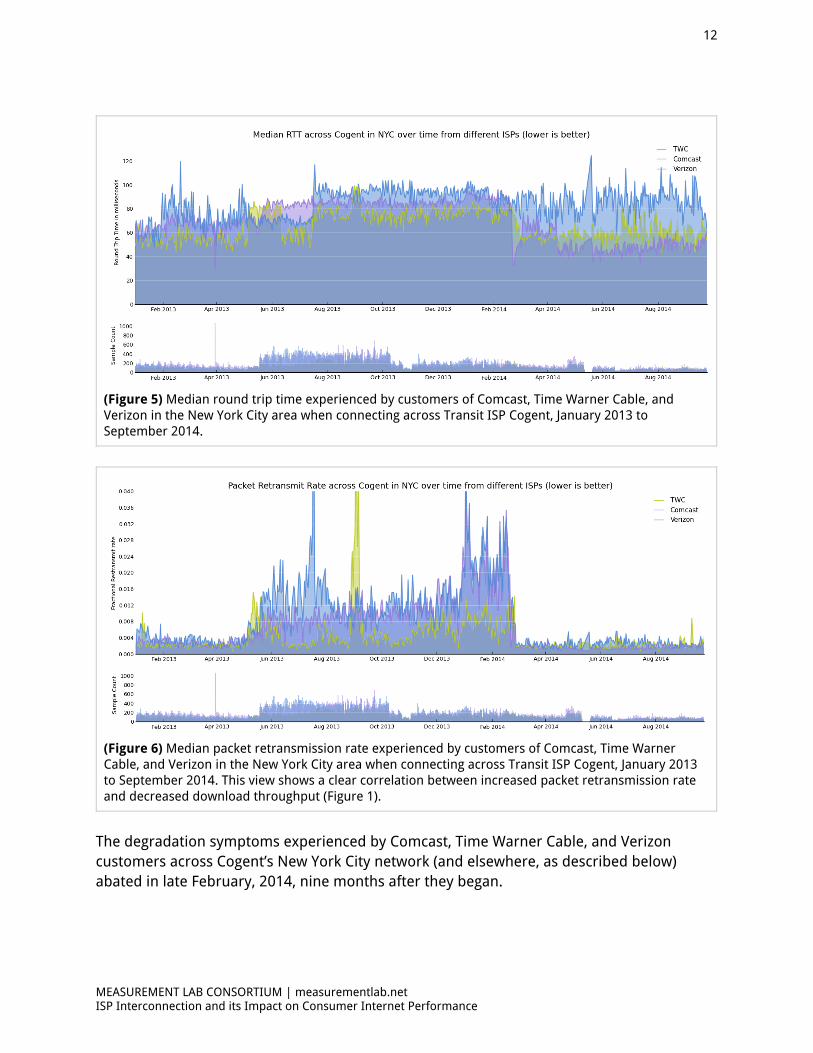
(Figure 5) Median round trip time experienced by customers of Comcast, Time Warner Cable, and Verizon in the New York City area when connecting across Transit ISP Cogent, January 2013 to September 2014.
(Figure 6) Median packet retransmission rate experienced by customers of Comcast, Time Warner Cable, and Verizon in the New York City area when connecting across Transit ISP Cogent, January 2013 to September 2014. This view shows a clear correlation between increased packet retransmission rate and decreased download throughput (Figure 1).
The degradation symptoms experienced by Comcast, Time Warner Cable, and Verizon customers across Cogent’s New York City network (and elsewhere, as described below) abated in late February, 2014, nine months after they began.
MEASUREMENT LAB CONSORTIUM | measurementlab.net ISP Interconnection and its Impact on Consumer Internet Performance

13
Cogent - Dallas, Los Angeles, and Seattle M-Lab hosts measurement points in Cogent’s network in Dallas, Los Angeles, Seattle, and New York City. When looking at Access ISP performance across all of these locations during the same period as the onset of congestion for New York, we see the same degradation patterns in download throughput for a larger set of Access ISPs. 18
Between February to June 2013, and February 2014, download throughput decreased for customers of AT&T, CenturyLink, Comcast, Time Warner Cable, and Verizon across M-Lab’s Cogent hosted sites in Dallas and Los Angeles. During the same time period, similar reductions in download throughput were observed for Centurylink and Comcast customers across M-Lab’s Cogent-hosted site in Seattle. While the onset of degradation symptoms 19
varied by Access ISP, by June 2013 symptoms were clear (Figures 7 and 8). As in New York 20
City, the patterns of reduced download throughput across Cogent hosted sites for specific Access ISPs were diurnal in nature and most pronounced during peak hours. Certain Access ISPs experienced degradation in the form of increased round trip times and packet retransmit rates across certain Cogent interconnections. However, these symptoms were not unique to Cogent-hosted sites. While degradation was consistent, its presence in connections to other Transit ISPs meant that it could not be correlated explicitly with Access ISP interconnection traversal with Cogent.
(Figure 7) Median download throughput achieved by customers of AT&T, CenturyLink, Comcast, Time Warner Cable, and Verizon in the Los Angeles area when connecting across Transit ISP Cogent, January 2013 to September 2014.
18 Barring sample size issues, noted below. 19 Sample sizes for AT&T, Time Warner Cable, and Verizon to the Seattle site were too small to allow conclusions (See the Excluding Datasets with Insufficient Samples section in our Methodological Overview) 20 In Los Angeles, Comcast’s median download throughput rate shows a slower decline in performance than other impacted Access ISPs, and Comcast clients across other Cogent interconnections. It’s not until October 2013 that reduction in speed across the Los Angeles site matches the full severity of other Access ISPs.
MEASUREMENT LAB CONSORTIUM | measurementlab.net ISP Interconnection and its Impact on Consumer Internet Performance

14
(Figure 8) Median download throughput achieved by customers of AT&T, CenturyLink, Comcast, Time Warner Cable, and Verizon in the Dallas area when connecting across Transit ISP Cogent, January 2013 to September 2014. 21
In New York City, Access ISP Cablevision customers did not experience the same degradation symptoms as Comcast, Time Warner Cable, and Verizon customers when connecting across the Cogent network. Similarly, in Dallas and Los Angeles during the relevant time period, customers of Access ISP Cox did not experience a significant pattern or degree of degraded download throughput when connecting across Cogent sites (Figure 9). In Seattle, Cox sample sizes were insufficient to allow a conclusion.
(Figure 9) Median download throughput achieved by customers of Cox in both the Dallas and Los Angeles areas when connecting across Transit ISP Cogent, January 2013 to September 2014.
21 For a week, ending September 5 2014, a bug in mlab-ns, M-Lab’s nameserver, reduced the number of tests going to Cogent in Dallas, and Level 3 in Atlanta, Chicago, and Miami. This bug was fixed on September 5, and test traffic samples returned to normal distribution. You can see this in (Figures 8 and 9) as a small gap in Sample Count.
MEASUREMENT LAB CONSORTIUM | measurementlab.net ISP Interconnection and its Impact on Consumer Internet Performance

15
(Figure 10) Median download throughput achieved by customers of AT&T, CenturyLink, Comcast, Time Warner Cable, and Verizon in the Los Angeles area, by hour of the day during an average day in January 2014, when connecting across Transit ISP Cogent. This view shows the extent of download throughput degradation during peak use hours. The FCC defines peak use hours as 7pm to 11pm local time.
(Figure 11) Median download throughput achieved by customers of AT&T, CenturyLink, Comcast, Time Warner Cable, and Verizon in the Dallas area, by hour of the day during an average day in January 2014, when connecting across Transit ISP Cogent. This view shows the extent of download throughput degradation during peak use hours. The FCC defines peak use hours as 7pm to 11pm local time.
MEASUREMENT LAB CONSORTIUM | measurementlab.net ISP Interconnection and its Impact on Consumer Internet Performance

16
(Figure 12) Median download throughput achieved by customers of CenturyLink and Comcast in the Seattle area, by hour of the day during an average day in January 2014, when connecting across Transit ISP Cogent. This view shows the extent of download throughput degradation during peak use hours. The FCC defines peak use hours as 7pm to 11pm local time.
The similarity and close timing of the degradation symptoms across these various Cogent-connected locations reveals a national pattern (Figures 10, 11, and 12). The presence of measurements that were not impacted by the same degradation symptoms from Access ISPs Cablevision and Cox (in locations where we had substantial data), provides evidence that Cogent had sufficient capacity in the vicinity of the measurement point and in at least some of their interconnections. The diurnal character of degradation, and the severity of degradation symptoms localized during peak use, indicates network congestion and under-provisioning. Congested interconnections traversed between the Access ISPs AT&T, CenturyLink, Comcast, Time Warner Cable, and Verizon, and the transit network Cogent, were likely a contributing factor in the observed performance degradation impacting consumers across the US. It is interesting to speculate about causes of the performance degradation in these cases: we see similar patterns of congestion between Cogent and some, but not all, Access ISPs in four different geographical locations. It is very unlikely that the interconnections involved in all locations share any common physical infrastructure (Seattle and New York City, etc.), pointing to a non-technical (business) issue at the root of the problems, and not a systemic technical failure in one or another portion of a network.
MEASUREMENT LAB CONSORTIUM | measurementlab.net ISP Interconnection and its Impact on Consumer Internet Performance

17
Level 3 - Atlanta and Chicago Degraded performance tied to interconnection relationships between ISPs was not isolated to Access ISPs’ interconnection relationships with Cogent. While the problems for Access ISPs across Cogent were clear and in some cases dramatic, patterns demonstrating a similar correlation between interconnection relationships and end-user performance were also present in measurement points on other Transit ISPs, including similar diurnal behavior in which performance declined during peak use hours. In Atlanta and Chicago, where M-Lab hosts measurement points within the network of Transit ISP Level 3 Communications (Level 3), we see patterns of performance degradation for Comcast, Time Warner Cable, and Verizon customers. The data patterns for Level 3 in Atlanta and Chicago are not coordinated across separate Access ISPs in the same way seen in Cogent-connected locations – where separate Access ISPs all experienced similar symptoms within a short time period, in multiple regions. However, the degradation of performance is consistent and closely timed within the measurements of each individual Access ISP across all observed Level 3-connected locations. Observing synchronized patterns of degradation across geographically disparate locations between the same Access ISP/Transit ISP pair points to a business relationship as the root of the problem, and not a technical failure. M-Lab also hosts a measurement point within Level 3’s network in Miami. However, sample sizes for Time Warner Cable and Verizon in Miami were too low to include as evidence in this report. Verizon Of the Access ISPs connecting across Level 3 sites, Verizon shows the clearest patterns of degraded performance. Starting in May 2011, data shows Verizon customers in Atlanta and Chicago experienced persistent high round trip times that consistently exceeded 100 ms. Beginning around June 2013, these symptoms were joined by degraded download throughput, particularly during peak use hours. The June 2013 reduction in download throughput for Verizon traffic across Level 3 sites reverses a gradual increase in download throughput that began in 2011 and culminated in April 2013 with median download throughput of 22.4 Mbps in Atlanta and 20.3 Mbps in Chicago. Download throughput in Atlanta and Chicago has not returned to pre-degradation rates since. In Atlanta, the degradation that began in June 2013 continues as of publication, and since August 2013 download throughput rates have remained less than 15 Mbps with repeated
MEASUREMENT LAB CONSORTIUM | measurementlab.net ISP Interconnection and its Impact on Consumer Internet Performance

18
periods where download throughput dropped to 10 Mbps (Figure 13). While we do see brief improvements in March and May 2014, these are neither permanent nor do they restore previous levels of download throughput performance. Chicago demonstrates the same patterns and timing as Atlanta, with greater variations and substantially poorer performance (Figure 14). As in Atlanta, download throughput for Verizon customers in Chicago begins to decline in June 2013, and experiences the same minor and short-lived increase in March and May 2014. In Chicago, between September 22
2013 and March 2014, download throughput remained consistently less than 10 Mbps, with a low of 4.9 Mbps in February 2014. The performance change that occurred between March and May 2014 led to an increase in download throughput of 5.9 Mbps. Despite this, download throughput to the Chicago sites had yet to exceed 14 Mbps, and the most recent data suggests that download throughput has declined again. In both Atlanta and Chicago, declines in download throughput are most notable during peak use hours, and results in a marked difference between peak use and off-peak performance. Diurnal differences in throughput are less severe in Atlanta compared to Chicago, but typically represent at least a 5 Mbps difference during evening hours, with performance in excess of 15 Mbps only available for a few hours in the early morning. For several months in early 2014, peak download throughput in Chicago remained at 1-2 Mbps (Figure 15). The pattern of roughly synchronized degradation for Verizon traffic across Level 3 sites, irrespective of their relative baselines, points to the business relationship between Verizon and Level 3 as a factor in observed performance degradation.
22 In the case of Chicago this decline in was preceded by another, from November 2012 until February 2013, in which download throughput during peak use hours decreased to 9 Mbps. This earlier decline is isolated to Chicago, and thus isn’t evidence of interconnection-related performance degradation. However, its impact on end-user performance is notable.
MEASUREMENT LAB CONSORTIUM | measurementlab.net ISP Interconnection and its Impact on Consumer Internet Performance

19
(Figure 13) Median download throughput during peak use hours, off-peak hours, and overall achieved by customers of Verizon in the Atlanta area connecting across Transit ISP Level 3, January 2012 to July 2014. The FCC defines peak use hours as 7pm to 11pm local time. This view shows clear variations between peak use and off-peak download throughput performance.
(Figure 14) Median download throughput during peak use hours, off-peak hours, and overall achieved by customers of Verizon in the Chicago area connecting across Transit ISP Level 3, January 2012 to July 2014. The FCC defines peak use hours as 7pm to 11pm local time. This view shows clear variations between peak use and off-peak download throughput performance.
MEASUREMENT LAB CONSORTIUM | measurementlab.net ISP Interconnection and its Impact on Consumer Internet Performance

20
(Figure 15) Median download throughput achieved by customers of Verizon in the Chicago area, by hour of the day during an average day in February 2014, when connecting across Transit ISP Level 3. This view shows the extent of download throughput degradation during peak use hours. The FCC defines peak use hours as 7pm to 11pm local time.
Time Warner Cable Time Warner Cable shows two marked and synchronized instances of performance degradation. Both occur for Time Warner Cable customers across the Atlanta and Chicago Level 3 connected sites, and both incidents involve degradation of median round trip time (increased latency), which is most pronounced during peak use hours (Figures 16 and 17). 23
This synchronized increase across disparate locations again points to the business relationship between the two ISPs as a causal factor in observed performance, and not a systemic technical failure. The increase in round trip times in both Atlanta and Chicago began between July and August 2012, and spiked across all sites in September 2012, culminating in a 10 ms - 35 ms increase in round trip times during peak use hours, varying somewhat by site. This spike abated by November 2012. Other Access ISPs connecting to these same Level 3 connected sites did not experience this same spike in peak use round trip times. In addition, Time Warner Cable customers connecting to non-Level 3 measurement points did not experience similar latency increases, either.
23 Even without observable reductions in throughput or increases in retransmission rate, increased round trip time hurts most interactive websites and Internet applications because they involve exchanging hundreds or thousands of messages between the client and server. This increased round trip time can lengthen the response time to the user by many seconds. For interactive applications, round trip time is just as important as throughput in determining performance.
MEASUREMENT LAB CONSORTIUM | measurementlab.net ISP Interconnection and its Impact on Consumer Internet Performance

21
(Figure 16) Median round trip times during peak use hours, off-peak hours, and overall experienced by customers of Time Warner Cable in the Atlanta area connecting across Transit ISP Level 3, January 2012 to July 2014. The FCC defines peak use hours as 7pm to 11pm local time. This view shows variations between peak use and off-peak round trip times.
(Figure 17) Median round trip times during peak use hours, off-peak hours, and overall experienced by customers of Time Warner Cable in the Chicago area connecting across Transit ISP Level 3, January 2012 to July 2014. The FCC defines peak use hours as 7pm to 11pm local time. This view shows variations between peak use and off-peak round trip times.
A second increase in round trip times for Time Warner Cable customers across these sites begins in December 2013, and as of publication is ongoing. Furthermore, by September 2014 the degradation is no longer pronounced only during peak use hours, but is evident throughout the day, with round trip times between 70 ms - 80 ms across the board.
MEASUREMENT LAB CONSORTIUM | measurementlab.net ISP Interconnection and its Impact on Consumer Internet Performance

22
Notable here is not the severity of these degradation symptoms, but their coordinated timing across locations of interconnection between Time Warner Cable and Level 3. This, combined with the lack of the same symptoms at the same time for other Access ISPs sending traffic across an interconnection with Level 3 in these locations, and the similar lack of symptoms for Time Warner Cable when it traversed interconnections with other Transit ISPs, provides evidence, again, of interconnection-related performance degradation related to the business relationship between the two ISPs. Comcast Like Time Warner Cable, Comcast performance across Level 3 connected sites also shows synchronized increases in round trip time in different incidents over the past two years. The first increase in round trip times for Comcast traffic across the Atlanta, Chicago, and Miami sites begins by June 2012, and culminates between January and March 2013, at which point median round trip times during peak use hours reached 60 ms - 75 ms for Comcast traffic across Level 3 connected sites (Figures 18, 19, and 20). 24
This gradual and notable increase was followed by a sharp and synchronized improvement of performance for Comcast traffic across Level 3 sites. After months of high round trip times, by June 2013 there was only a 1 ms - 5 ms difference between peak and off-peak median round trip times for Comcast across Level 3 connected sites, and round trip times at peak hours had reduced by 10 ms - 20 ms overall. The second increase begins just months after this brief improvement, around July 2013, and was sustained through March 2014. The onset of degradation and peak hour variation aligns between Atlanta, Chicago, and Miami, showing persistently high round trip times for Comcast during these times.
24 In Chicago, round trip times in December 2012 spiked briefly above these levels.
MEASUREMENT LAB CONSORTIUM | measurementlab.net ISP Interconnection and its Impact on Consumer Internet Performance

23
(Figure 18) Median round trip times during peak use hours, off-peak hours, and overall experienced by customers of Comcast in the Atlanta area connecting across Transit ISP Level 3, January 2012 to July 2014. The FCC defines peak use hours as 7pm to 11pm local time. This view shows variations between peak use and off-peak round trip times.
(Figure 19) Median round trip times during peak use hours, off-peak hours, and overall experienced by customers of Comcast in the Chicago area connecting across Transit ISP Level 3, January 2012 to July 2014. The FCC defines peak use hours as 7pm to 11pm local time. This view shows variations between peak use and off-peak round trip times.
MEASUREMENT LAB CONSORTIUM | measurementlab.net ISP Interconnection and its Impact on Consumer Internet Performance
24
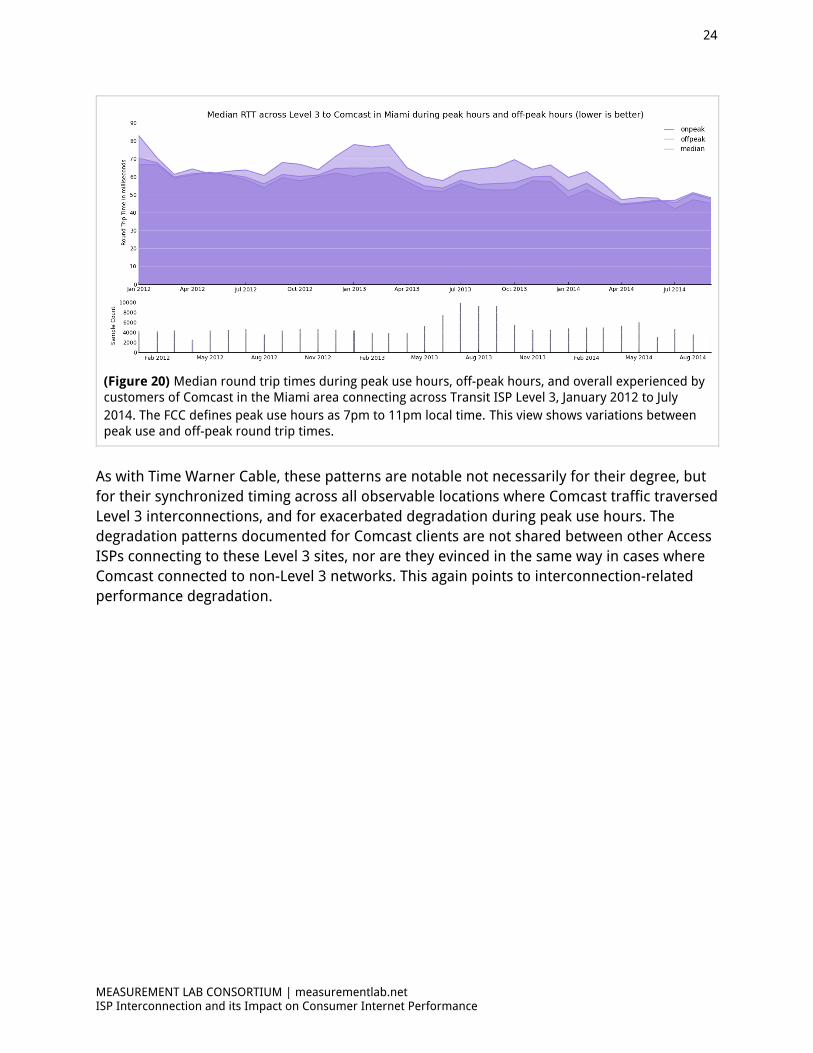
(Figure 20) Median round trip times during peak use hours, off-peak hours, and overall experienced by customers of Comcast in the Miami area connecting across Transit ISP Level 3, January 2012 to July 2014. The FCC defines peak use hours as 7pm to 11pm local time. This view shows variations between peak use and off-peak round trip times.
As with Time Warner Cable, these patterns are notable not necessarily for their degree, but for their synchronized timing across all observable locations where Comcast traffic traversed Level 3 interconnections, and for exacerbated degradation during peak use hours. The degradation patterns documented for Comcast clients are not shared between other Access ISPs connecting to these Level 3 sites, nor are they evinced in the same way in cases where Comcast connected to non-Level 3 networks. This again points to interconnection-related performance degradation.
MEASUREMENT LAB CONSORTIUM | measurementlab.net ISP Interconnection and its Impact on Consumer Internet Performance

25
XO - Washington, D.C. The data also shows sustained patterns of performance degradation for customers of Comcast and Time Warner Cable connecting to M-Lab’s site hosted by the Transit ISP XO Communications (XO) in Washington, D.C. While Time Warner Cable and Comcast do not share the same patterns and timing of decline, each experienced sustained periods of degradation whose impact on customers was likely similar and whose manifestation was diurnal, with the worst symptoms occurring during peak use hours. Unlike Cogent and Level 3, M-Lab did not have another XO hosted site against which to compare patterns to determine whether they were repeated across XO’s network. Thus, while we observe performance degradation, we cannot determine whether this is linked to Access ISPs’ interconnection relationships with XO, is the result of sustained problems in the Comcast and Time Warner Cable edge networks for the Washington, D.C. area, or some combination of both. The patterns seen here do echo those found in the more conclusive cases of Level 3 and Cogent, and are in themselves important for understanding consumer-facing network performance. Comcast Comcast customers connecting across M-Lab’s XO hosted site experienced two major periods of performance degradation with decreased download throughput and increased packet retransmission rates. As elsewhere, these patterns were most pronounced during peak use hours, although degradation did impact overall performance. The first period of degraded download throughput begins in December 2012 (Figure 21). By March 2013, speeds had dropped as low as 3.9 Mbps overall, with download throughput during peak use hours hovering around 1 Mbps between January 2013 and April 2013 (Figure 22). These symptoms were partially alleviated by May 2013, with a return to previous overall performance rates of 12 Mbps. The second period of degraded performance begins November 2013 and is largely resolved in March 2014. After March 2014, Comcast performance across XO has returned to download throughput rates consistently greater than 12 Mbps.
MEASUREMENT LAB CONSORTIUM | measurementlab.net ISP Interconnection and its Impact on Consumer Internet Performance

26
(Figure 21) Median download throughput during peak use hours, off-peak hours, and overall achieved by customers of Comcast in the Washington, D.C. area connecting across Transit ISP XO, January 2012 to July 2014. The FCC defines peak use hours as 7pm to 11pm local time. This view shows clear variations between peak use and off-peak download throughput performance.
(Figure 22) Median download throughput achieved by customers of Comcast in the Washington, D.C. area, by hour of the day during an average day in January 2014, when connecting across Transit ISP XO. This view shows the extent of download throughput degradation during peak use hours. The FCC defines peak use hours as 7pm to 11pm local time.
MEASUREMENT LAB CONSORTIUM | measurementlab.net ISP Interconnection and its Impact on Consumer Internet Performance

27
Time Warner Cable Time Warner Cable customers connecting to M-Lab’s XO-hosted site experienced a substantial and consistent reduction in download throughput during peak use hours beginning around December 2012, as with Comcast. Between January 2013 and April 2014, Time Warner Cable customers rarely achieved over 7 Mbps download throughput during peak use hours, compared to 13.1 Mbps seen in December 2012 (Figure 23 and 24). Within this window, there were months at a time where download throughput during peak 25
use hours stayed below 4 Mbps. Since January 2014, Time Warner Cable traffic has shown moderate improvements in download throughput during peak use hours, and in August 2014 M-Lab found a rapid change in the peak use/off-peak performance gap. However, September 2014 showed a likely return to degraded peak-hour download throughput.
(Figure 23) Median download throughput during peak use hours, off-peak hours, and overall achieved by customers of Time Warner Cable in the Washington, D.C. area connecting across Transit ISP XO, January 2012 to September 2014. The FCC defines peak use hours as 7pm to 11pm local time. This view shows clear variations between peak use and off-peak download throughput performance.
25 December 2012 through February, 2013; May 2013 through June, 2013; December 2013 through April, 2014
MEASUREMENT LAB CONSORTIUM | measurementlab.net ISP Interconnection and its Impact on Consumer Internet Performance

28
(Figure 24) Median download throughput achieved by customers of Time Warner Cable in the Washington, D.C. area, by hour of the day during an average day in January 2014, when connecting across Transit ISP XO. This view shows the extent of download throughput degradation during peak use hours. The FCC defines peak use hours as 7pm to 11pm local time.
The degradation experienced by Comcast and Time Warner Cable customers connecting across the XO site were not seen for other Access ISPs. AT&T and Verizon maintained fairly consistent performance to XO in Washington, D.C., without indication of substantial peak /off-peak differences found elsewhere. For AT&T particularly, we observe both a fairly steady increase in download throughput between January 2012 and late 2014, and much less variation between peak use and off-peak performance (Figure 25). We speculate that this performance trend could be tied to some sort of progressive upgrade within AT&T’s edge network in the Washington, D.C. area.
MEASUREMENT LAB CONSORTIUM | measurementlab.net ISP Interconnection and its Impact on Consumer Internet Performance

29
(Figure 25) Median download throughput during peak use hours, off-peak hours, and overall achieved by customers of AT&T in the Washington, D.C. area connecting across Transit ISP XO, January 2012 to July 2014. The FCC defines peak use hours as 7pm to 11pm local time. This view shows a relatively stable increase, with few variations between peak use and off-peak download throughput performance.
As we noted at the beginning of this section that, because M-Lab has only one measurement point in a single XO site, we cannot make conclusions as to whether the degradation seen for Time Warner Cable and Comcast traffic was related to traversal of the interconnection with XO. What we can see are very different patterns of performance for different Access ISPs, with AT&T showing itself the most stable among the three. Further, the diurnal nature of the performance problems seen for Comcast and Time Warner Cable point to network congestion and under-provisioning as a likely problem.
MEASUREMENT LAB CONSORTIUM | measurementlab.net ISP Interconnection and its Impact on Consumer Internet Performance

30
Conclusion In conducting this research we worked to identify the relationship between interconnection and the Internet performance experienced by consumers in the United States, using M-Lab’s extensive dataset of network measurements. This research is made possible by the scale and opportunity provided by M-Lab’s data, which contains over five years of network measurements from a diverse population of Access ISP consumers in the US, measuring performance across interconnections with specific Transit ISPs. By maintaining measurement points across the US, M-Lab allows researchers to compare performance between Access ISP/Transit ISP pairs in multiple locations, and narrow down the cause of observed performance degradation to the interconnection relationship between specific ISPs. In conducting this research we find a consistent theme across multiple Access ISPs and Transit ISPs: the interconnection relationships between network operators matter. The quality of service that millions of consumers experience on a daily basis for periods of multiple months can be directly tied to these relationships. Further, these relationships are not simply technical. We see the same patterns of degradation manifest in disparate locations across the US. Locations that it would be hard to imagine share any significant infrastructure (Los Angeles and New York City, for example). We thus conclude that the business relationships between impacted Access ISP/Transit ISP pairs is a factor in the repeated patterns of performance degradation observed throughout this research.
MEASUREMENT LAB CONSORTIUM | measurementlab.net ISP Interconnection and its Impact on Consumer Internet Performance

31
The table below summarizes our findings, which indicate a proliferation of performance issues, and that these issues cannot be laid at the feet of any one Access ISP, or any one Transit ISP: no Access ISP performs badly to all Transit ISPs, and no Transit ISP performs badly for all Access ISPs. Therefore, if the problem is not at one end, and not at the other, it must be in the middle around the interconnection between the two.
(Figure 26) An overview of download throughput between Access ISP and Transit ISP pairs during 2013. For each of the 28 graphs, the Y axis shows the % of hours with the given download throughput, and the X axis shows the download throughput (Mbps). In brief, the left side is bad, the right side is good; up and to the left is the worst, up and to the right is the best. Red, on the left, indicates sub-broadband speeds - download throughput below 4 Mbps. What this table demonstrates is not simply a proliferation of performance issues, but that these issues cannot be laid at the feet of any one Access ISP, or any one Transit ISP: no Access ISP performs badly to all Transit ISPs, and no Transit ISP performs badly for all Access ISPs. Therefore, if the problem is not at one end, and not at the other, it must be in the middle around the interconnection between the two.
MEASUREMENT LAB CONSORTIUM | measurementlab.net ISP Interconnection and its Impact on Consumer Internet Performance

32
Appendix
MEASUREMENT LAB CONSORTIUM | measurementlab.net ISP Interconnection and its Impact on Consumer Internet Performance

33
What is Measurement Lab and how does it work?
(Figure B) M-Lab’s places its measurement points in Transit ISP networks. These are the same networks where popular content and services are often hosted. When a user measures against an M-Lab measurement point, they are measuring across the interconnection between their Access ISP and a given Transit ISP. This allows users to better understand their performance when accessing popular Internet services, and allows M-Lab researchers to understand aggregate performance results in terms of Access ISP/Transit ISP interconnection relationships.
M-Lab is a consortium of research, industry, and public interest partners dedicated to open, verifiable measurement of global Internet performance. All of the data collected by M-Lab's global measurement points is made openly available in the public domain, and all of the 26
measurement tests hosted by M-Lab are open source. Anyone with the time and skill can review the underlying methodologies and assumptions on which M-Lab's infrastructure, tests, and data rely. M-Lab believes that transparency and peer-review are key to good science, and good science is key to good measurement.
26 All data is offered under a Creative Commons 0 (CC0) “No Rights Reserved” license. This allows access and reuse with no conditions or restrictions. More here: https://creativecommons.org/about/cc0
MEASUREMENT LAB CONSORTIUM | measurementlab.net ISP Interconnection and its Impact on Consumer Internet Performance

34
Measurement tools M-Lab gathers its data by providing network measurement tools that allow everyday users to test and measure their Internet performance. These tools are required to be open source and are designed and developed by researchers from across the M-Lab consortium. Currently, M-Lab hosts 16 separate measurement tools, all measuring different aspects of Internet performance. End-users come to use M-Lab’s tools in a variety of ways. Popular applications, like BitTorrent’s μTorrent client, embed M-Lab’s tools as a tuning mechanism. Getting data from a M-Lab tool before initiating traffic from a given application allows the application to tune its performance to real-time network conditions. The tools are also embedded in hardware devices (routers and measurement whiteboxes), and are hosted on a number of websites. However a user reaches a M-Lab test, the testing methodology is similar: a stream of data is sent from the user’s device (laptop, mobile, or other client-side gadget) to the nearest M-Lab measurement point. The measurement point receives the test data and sends its own stream of data back to the user. M-Lab tools attempt to send streams of data that do not appear to be tied to a particular online application, which helps to avoid network caching and other effects that may skew test results. As a result, network performance characteristics are evaluated based on how the core network reacts -- in a given test instance -- to this stream of data. The test from which the data used in this study is collected is the Network Diagnostic Tool.
Measurement points M-Lab hosts measurement points -- three servers and a switch -- in Transit ISP networks in well-peered locations. These are locations where the ISPs that interconnect to comprise the Internet exchange traffic. By placing its measurement points in these strategic locations, M-Lab ensures that what it measures is generally representative of “real” Internet performance. That is, the traffic from a M-Lab test client crosses at least one network boundary (from a user’s Access ISP across the boundary with the Transit ISP in whose network a given M-Lab measurement point is hosted), the same boundaries that content and services requested by Internet users cross. This distinguishes M-Lab from other Internet measurement platforms that allow consumers to test their performance against a measurement point within their Access ISP’s own network, and thus only measure “edge network” performance.
Data collection and openness Once a test completes, the user who runs the test gets some information about the performance of their connection at that time. M-Lab measurement points store this same information and add it to M-Lab’s near-petabyte of public domain network performance data. It is this data that is used here to analyze how interconnection impacts performance characteristics.
MEASUREMENT LAB CONSORTIUM | measurementlab.net ISP Interconnection and its Impact on Consumer Internet Performance

35
Open Data - Reproduce this research M-Lab is committed to collaborative, open, and iterative Internet science. Below we provide the documentation necessary for anyone interested to reproduce and deepen the research we present here, including detailed documentation of our infrastructure, and our testing methodologies. For a step-by-step walkthrough of the methods used in this research, see our Methodological Overview, here: https://code.google.com/p/m-lab/wiki/InterconnectionStudyMethodology
Access our data ● Images in this report: The graphs and images used in this report may be
downloaded here: http://measurementlab.net/static/observatory/Measurement_Lab-Interconnection_Study_2014-Images.zip
● Raw dataset: The raw data on which this research was based is available on Google Cloud Storage, in CSV file format. You can download it here: https://console.developers.google.com/m/cloudstorage/b/m-lab/o/interconnection-study-2014/telescope-data-2014-10-16-raw.tgz (447.41 MB)
● Telescope research tool: Telescope is a custom tool we wrote to enable this research. It retrieves data from the online M-Lab dataset and organizes the information to facilitate interconnection analysis. Its full source code and documentation are available under the open source Apache 2.0 license for external researchers to freely use and extend. You can examine and build from the source here: https://github.com/m-lab-tools/telescope
● Telescope input files: Telescope retrieves data from the M-Lab dataset based on input files that specify parameters of the desired data, such as time, M-Lab measurement point, and Access ISP. External researchers can reproduce the study’s raw dataset by running Telescope v1.0 on these input files. You can download these 27
input files here: https://console.developers.google.com/m/cloudstorage/b/m-lab/o/interconnection-study-2014/telescope-data-2014-10-16-selectors.tgz (3.93 KB)
Review our measurement methodology ● Network Diagnostic Tool: The Network Diagnostic Tool (NDT) is the test from which
we gathered the data used to conduct this research. NDT is developed by researchers at Internet2 and provides a sophisticated speed and diagnostic test suitable for both the novice and the network researcher. NDT reports upload and download speeds, attempts to determine what problems limited speeds, and provides details diagnostic reporting on what it found. You can review NDT’s source code here:
27 Note that Telescope’s output will change if the M-Lab dataset in BigQuery changes. The M-Lab BigQuery dataset is stable, but can change due to changes in the M-Lab software that converts the data to BigQuery format, or due to measurement points sending additional data to BigQuery. At the time of the study, data past September 24th, 2014 had not yet been published, but data produced after this date will appear in Telescope results after this data becomes available in BigQuery.
MEASUREMENT LAB CONSORTIUM | measurementlab.net ISP Interconnection and its Impact on Consumer Internet Performance

36
https://code.google.com/p/ndt/source/checkout and review its test methodology here: https://code.google.com/p/ndt/wiki/NDTTestMethodology.
Review our open infrastructure M-Lab assists scientific research by providing a platform of widely-distributed measurement points provisioned with ample connectivity. M-Lab makes these available for use by researchers, who host their own measurement tools across the M-Lab platform (tools such as NDT). The M-Lab operating system is a derivative of PlanetLab.
● To learn more about the technical details of the M-Lab platform, and the architecture of a M-Lab measurement point, review our technical documentation.
● M-Lab welcomes the participation of industries, institutions, and researchers who would like to help expand the platform and ensure its growth and success. Find out more about how to contribute to the M-Lab platform on our website at: http://www.measurementlab.net/contribute
Discuss this research Did we miss something? Is there an angle we should explore next? Are you just a big fan of this work? Whatever it is, join our research discuss mailing list and talk with others about this work, future work, and how we can all make collaborative open research better. Join the discussion at: [email protected] https://groups.google.com/a/measurementlab.net/forum/?fromgroups#!forum/discuss
MEASUREMENT LAB CONSORTIUM | measurementlab.net ISP Interconnection and its Impact on Consumer Internet Performance

37
This report carries a Creative Commons license, which permits non-commercial re-use of Measurement Lab
Consortium content when proper attribution is provided. This means you are free to copy, display and distribute
Measurement Lab’s work, or include our content in derivative works, under the following conditions:
∙ Attribution. You must clearly attribute the work to Measurement Lab, and provide a link back to www.measurementlab.net.
∙ Noncommercial. You may not use this work for commercial purposes without explicit prior permission from Measurement Lab.
∙ Share Alike. If you alter, transform, or build upon this work, you may distribute the resulting work only under a license identical to this one.
For the full legal code of this Creative Commons license, please visit creativecommons.org. If you have any questions
about citing or reusing Measurement Lab Consortium content, please contact us.
© 2014 Measurement Lab Consortium
This report was prepared by MLab researchers a broad array of those who manage the platform, actively analyze MLab test data, and regularly engage with the research community who use or contribute to MLab. As a research consortium, MLab researchers chose to reflect collective authorship for this document in order to focus discussion and scrutiny on the data and the issues it reveals on the topic of ISP interconnection. This research does not imply the participation or approval of any or all of the MLab Steering Committee members.
MEASUREMENT LAB CONSORTIUM | measurementlab.net ISP Interconnection and its Impact on Consumer Internet Performance