Embed Size (px)
Citation preview
J oumal qfG/aci%gy, Va!. 44, No. 1+7, 1998
Isotopic diffusion in polar firn: itnplications for interpretation of seasonal clitnate paratneters in ice-core
records, with etnphasis on central Greenland
KURT M. CUFFEY,I ERIC]' STEIC2*
1 Departmenl qfGeologica/ Sciences, Bar 351310, enivenil)' of fl ashing/oll, Seallle. Washing/all 98195-/310. US.A. 2Deparlmenl qfGeological Sciences and Q]wlemm] Isolope [abom/oJ], Box 351310, University of l Vash.ing/on,
Seall/e, I I aslzing/on 98195-1310, US.A.
ABSTRACT. rfit were poss ible to pro perly extract seasonal inform ati o n from ice-core isoto pic reco rds, pa leoclim ate resea rche rs could retrieve a wealth ofn ell" info rma ti on conce rning the nature of climate cha nges a nd th e mea ning of trends observed in ice-co re proxy records. It is wide ly recogni zed , howeve r, tha t the difTusiona l sm oo thing of the seasonal record makes a "proper extrac ti o n" \"Cry diffic ult. In thi s paper, wc exa mine the extent to which seasona l informati on (sp ecifically the amplitude and shape o f the seasona l cycle) is irrecove rably destroyed by difTusion in the firn. Fi rst, wc show tha t isoto pic difTusion in firn is reasonably well understood . \Ve do this by show ing that a sli g htl y mod ifi ed \'C rsion of the Whillans a nd Grootes (1985) th eory ma kes a tenable a prio ri predicti on of th e d ecay of seasona l iso topic a mplitudes with depth a t the G ISP2 site, tho ugh a sma ll acuustmentto onc pa ra m eter significantl y impro\'es th e prediction. Furth er, wc calculate the a mplitude decay at various other ice-core sites and show th at these predi ctions compare favorabl y with publi shed data from So uth Pole a nd locati ons in so uthern and centra l Green la nd a nd the Anta rctic Pen insul a . \Ve th en present numerica l expe riments wherein syntheti c ice-core reco rds a re created , difTused, sampled , reconstructed a nd compa red to th e o rig ina l. These sho\\' that, a ft er difTusi\'e mixing in the entire firn co lumn, seasonal a mplirudes can be reconstructed to within about 20% error in centra l Greenland but that a ll information abo ut sub-a nnua l signa ls is perm anentl y los t th ere. Furthe rmore, most of the erro r in the amplitude reconstructi o ns is due to the unknowablc \'a ri a ti o ns in the suba nnua l sig na l. fin a ll y, wc explore how th ese results ca n be a pplied to o ther locations and sugges t that D ye 3 has a high potenti a l fo r meaningful seasona l reconstructi o ns, whil e Siplc Dome has no pote nti a l at a ll. An optimal ice-core site fo r seasona l reconstructions has a hig h acc umula ti o n rate and a low temperature.
MOTIVATIONS AND GOALS
lee-co re paicoclimate studies rely hea\'il y o n the stable isotope ra tios 8180 a nd DD to prO\'ide de ta il ed reco rds of pas t tempera tures. The ice-co re isotope reco rds arc themsekes continua ll y modifi ed by difTusion, a t first rapidl y in firn , and then more slowly in so lid ice Oohnsen, 1977; Whill a ns a nd Graotes, 1985). The eflect 0[" firn diffusion is to hom o geni ze the iso tope reco rd o n a length sca le that is genera ll y sma ll compa red to th e record ofindi\ 'idua l clim ate cha nges, as measured a long a n ice core. Howe\-c r, the seasona l iso to pic reco rd will be mod ifi ed considerably by difl'usion in th e firn. Therefore, resea rche rs ha\'C large ly a \ 'o idcd interpre ting the seasonal isotope record (exceptions arc referred to below ), e \"C n th ough asp ec ts of the seasonal climate a re quit e impo rta nt.
Two or th ese aspec ts d ese rve spec ia l attention. First, it is desirable to know th e seasona l cyc le amplitude (defin ed as the deviation of max imum summer or minimum winter 15
\'a lues from the a nnual mea n ) ror inferringeha nges in mean summer a nd mean winter temperatures (e.g. Jouze l and others, 1983; ~ rorga n a nd Va n Ommen, 1997), for inferring changes in a nnual tem pe ra ture va ri ability, for stud ying aspects of climate dyna mics f"romthe historica l perspecti\'e (e.g. Ba rl ow and others, 1997), fo r identifying how climate trends vary from onc loca ti o n to a nother (Kuivinen a nd others, 1996; R owe and others, 1996), for understa nding the relationship be tween sta ble-isotope rati os and temperature (Peel a nd others, 1988; Aristarain a nd others, 1986; Van Om men a nd ~10rgan, 1997), fo r understa nding the rela tionship between temperature and climate forcing from shortli\ "Cd e\'ents such as \'olca nic e ruptions (\Vhite a nd others, in press ), a nd possibl y fo r inferring the histo ry of sea-ice ex tent (Fisher a nd Koe rner, 1988). Onc partic ul a rl y intrig uing use o f seasonal iso topic d a ta is the recent suggestion by L. Ba rl ow th at Greenland experi enced unusua ll y cold
* Present address: Institute of Arctic a nd Alpine Resea rch , Campus Box 450, U nivers ity of Colorado, Boulder, Colorado 80309, U.s.A .
ummers a t the time of the dem ise of th e Norse settlements in so uthern Greenland (Pring le, 1997; Barlow and others, 1997). The seasonal isotope records used in a ll of these studies, except Fisher a nd Koerner 's, have been modified to some extent by difTusion, a nd thi s may aflect res ults (less so for the hig h-acc umulati on si tes on the Antarctic Pen insul a tha n for the dry inland sites ).
273
Journal rifGlaciolog}!
A second aspec t of the seasona l climate desen'ing specia l attention is the seasonal di stribution of prec ipitation. If the accumulat ion rate is not constant through a year, either due to seasonal wind scour (Fisher a nd other, 1983) or due to seasonal variation of precipitation (Bromwich and others, 1993), the mean annual 8 \'alue will not accurately reflect the true mean annual temperature (Da nsgaard, 1964; Fisher and Koerner, 1988; Peel and others, 1988; Steig and others, 1994; Shuman and others, 1995). Changes in the magnitude of thi s bias will appea r in iso tope reco rds as climatic temperature changes that in fact never happened, or will change the appa rent magnitude of real temperature changes. For instance, attention has recently fo cused on changing seasona lit)' of precipitation as one of the possible reasons (Faweett and others, 1997) for the low sensitivity of 8 values to temperature changes at major climate transitions (Cuffey and others, 1995; J ohnsen a nd others, 1995). It may be possible to infer a long-term hi story of precipitation seasonality Crom properties of isotope reco rds a lone using a measure of the devia tion of the annua l 8-depth curve from sinusoida l, such as the difference between mean and m edian (measured from the frequency di st ribution of 8 va lues fo r a given yea r ). This is because the annual temperature cycle is roughly sinusoidal, with mean a nd median nearl y identica l (thi s can be seen, for example, from the. ymmetry of the cur\'es in fi gure 8 ofShuman and others (1996)). A significant seasona l bias to precipitation will deform this curve in a manner tha t m ay be statistica lly measurabl e.
A goal of the presen t paper is to determine how acc urately one can reconstruct these two seasonal pa rameters (a mplitude and dev iation from sinuso idal shape) from detail ed iso tope reco rds that have undergone diffusion in polar firn. vVe focus on firn diffusion because information that survi\'es the firn diffusion will sun·ive for a long time in the ice beneath, due to the much slower rate of diffusion there Uohnsen, 1977; Whillans and Grootes, 1985, fi g. 7). Th.is sun·i\·al time will depend on the strain rate and temperature at the ice-core site. Johnsen's calculations suggest survival times of as much as IQ 000 yea rs at Greenl and sites (hi s fi g ures 4, 5 and 6).
To accompli sh this goal, we must have an accurate quantitative physical understanding of the firn-diffusion process. We will first use data from the GISP2 ice-co re record in centra l Greenland (Stui\'er and others, 1995) to show tha t the firn-diffusion theory of Whillans a nd Grootes (1985) is essenti a lly correct; thi s theory predi(,ts rather well the measured decay of the seasonal 8180 cycle in the GISP2 record. We will introduce two minor modifications. One of these modifications is based on physic and concern the enhancement of vapor diffusivity at high a ltitude due to the low atmospheric pressure there. The other is simply a parameter adjustment that is physica ll y plausible and which improves the pred iction. Next, we broaden our geographic perspecti\'e by predicting the seasona l cycle decay at other ice-core sites, using the modified theory, and show th at these predicti ons a re in good agreement with published data (i'om four core sites. These results g ive us confidence that we can model the diffusion process reasonably well. \Ve then use synthetic "data" records, with known seasonal parameters, to eva luate the accuracy of reconstructions, These synthe tic data are diffused and sampled to mimic a rea l ice-core record. The diffusion process is mat hem atically reversed a nd wc compare the undiffused records with the originals. These synthetic ana lyses a re specificall y designed for
274
central Greenland ice cores, but we indicate how results can be modified for different locations, as long as the Whillans a nd Grootes (1985) theo ry applies (dry firn ).
I. DIFFUSION IN FIRN
1.1. Calculating diffusion
According to the \Vhillans and Grootes (1985) theory, the isotopic composition of fi rn will change through time t as
d8 828 dt = a(T,p) 8z2 (1)
a = mP(T) w(T , p) (2) pRT
in a reference frame fixed to the firn , which is not deformin g, and which has no strong density and temperature grad ients (the effect of such gradients has been shown by \I\Thillans and Grootes (1985) to be neglig ibl e in firn ). Here, z is depth (\'a riation in horizonta l directions is ignored ), 8 refe rs to either 0180 or 8D, a is isotopic diffusivity, m is mola r weight of water, R is the gas constant, P is saturation vapor pres ure [or water vapor over ice, p is urn density and T is absolute temperature. The function w is the effective diffusivit y of water \'apor through firn, accounting for the blocking effect of ice grains that interfere with vapor paths. \ tVhillan ' and Grootes rela ted thi s to density and diffusivity o[ 'water vapor in air 0 " using a simple linear relation
w = Oa(T) (1 - !!...) Pc
p:::; Pc (3)
where Pr is the pore close-off density, approximately 820 kg m - 3. Col beck (1993) re\·iewed theo ry a nd experimenta l data on vapor diffusion in snow and concluded that water vapor diffuses more effec tively in low-density snow than in air, so that w ~ 50". For our purposes, wc will write a more general rel a tion
(4)
and use our data to constra in "y a nd pO. \Ve use the relations for P and Oa reported in Whillans and Grootes (1985), with onc modification. The wate r-vapor diffusi\'ity is inversely proportional to the total a ir pressure, due to th e reduction in mean [ree pat h of diffusing gas molecules a pressu re increases (R eil', 1967). Because the air pressure decreases with increasing altitude, we include this dependence explicitly and write
(5)
where Pa is the air pressure in atmospheres, and 0,,1 is the diffusivity of water vapor in air at I atl110sphere press ure, and is equa tion (9) from \ Vhillans and Graotes (1985) (compare to G eiger and Poirer, 1973, equation 13.63). For central Greenland, the nominal effect of the lower atmospheric pres ure is to enhance the diffusivity by a factor o[ approximately 1.5, because atmospheric pressure there is approximately 0.68 atmospheres (Stearns and Weidner, 1991; Steams, 1997).
The possibility that wate r-vapor diffusivity is enhanced in snow by as much as "Y = 5 is at first sight disturbing. However, the ev idence for a high "Y specificall y only applies for vapor diffusion that is driven by a tempera ture g radient. In our case, the diffusion is driven by gradients in iso topic COI11-
position. The isoto pic diffusivit y in so lid ice is severa l o rde rs o f m ag ni tude less tha n the corresp onding diffusivity in ,·a por. Thus, in co ntras t to its role in the rmally driven diffusion, the solid ice here acts essentiall y as a pass i" e obstructi on to the diffusive flux. Therdore, wc expect that --y = I. \Ve a re not ce rta in o f thi s, however, a nd "" ill a t first a llow--y to va ry. Below, we. how that --y = I ac tua ll y a llows the bes t fit to da ta.
The most appro pri ate value for p* is harder to predict, because the blocking effect of the so lid ice matri x dep end s no t onl y on the vo id frac ti on but a lso o n the tortuos ity a nd connec ti vit y of the vapor paths. Th e la tter enha nce the blockage effec t so that p* < 917 kg m :~ . Simplicit y is the primary justificati o n for the functi ona l form (1 - pi p*) but the d ata of Schwa nder a nd others (1988, p. 143) show tha t a linear re lation is approximately co rrect.
C onsider a sec ti o n of an isotope record , oflength L, such tha t there is no net fl ux of vapor into o r o ut of the end s of the secti on. This co uld represent, for insta nce, a perfec tly sinuso ida l reco rd, with a secti on ta ken from peak-to-peak. Then Equa tion (I) has the well-known soluti o n
00
8(z. t) = Ao + L All eos( A1/z) cxp ( -A~ o. t) n=1
(n7r) A,,= L (6)
where the coeffi cients An a rc the Fo uri er coeffi cients fo r th e initi a l isotope curve 8(z, 0). [n an ice sheet, wc need to include the effects o f ve rtical strain a nd a va riablc iso topic diffu si,·it y. Wc do thi s fo llowing Ha mmer a nd others (1978), as fo llows. Introduce a new depth coordina te, Lz == z, a nd let o a nd L be functi o ns of tim e. Assume the sec ti on o f fi m stra ins uniforml y such that L(t) = Lo[l + E(t) ]. Then wc can write the solutio n to Equati on (I) as
00
8(z. t) = Ao + L All eos(;" z) n = l
; " = (711i) (7)
where 0 * is a ti me-averaged cffecti" e d i ff usivit )'
*() - ~ 1'/ O'(T) cl 0' t - ? T . t 0 (1 + E(T)J-
(8)
On a n infinite do ma in, the corresp o nding soluti on to Equa tion (I) is the convolution of the initi a l 8 profil e a nd a G a uss ia n filt er with a standa rd devia ti o n with respec t to Z of 2~(1 + E) (H a berman, 1987). A s J ohnsen (1977) a nd H a mmer a nd others (1978) have pointed out, the effect o f diffusion is thus to ave rage over a leng th scale proporti o na l to ~(1 + E) (sce below, Equati on (10)). We find it m os t intuitive to refer to the length scale containing approxim ately two-thirds o f th e a\'Craging filter (plus a nd minus one sta nda rd dev ia ti o n), norma li zed to the annual laye r thi ckness. This is 4~ divided by the thickness of a nnua l laye rs a t the surface. This quantity is used la ter in Fi gure 12.
To ca lculate 0'* fo r applicati on to the GISP2 data, it is necessary to specify a relation for the stra in as a fun ctio n o f ti m e o f bu ri al in the fi m. The stra in ra te consists of a densifi cati o n term and a n ice-flux divergence term (sce e.g. C uffey a nd others, (994) that is consta nt .with depth a nd time, a nd has a n a pproximate value o f --17, where b is the ice-equi valent accumul ati on rate (0.24 m a I), a nd H is the ice-equivalent ice-shee t thickness (3000 m ). In thi s stud y, wc o nl y consider th e upper 200 m of the ice sheet (less tha n
Cl!fRy alld Sleig: ImlojJic diffusion ill poLmjlTll
7% of the tota l ice thickn ess ), so our assumption of a constant stra in rate is reaso na ble a nd rela tively unimporta nt. Wc use the density pro fil e measured a t GISP2 (All ey a nd Koci, 1990). In practice, to calculate the integra l in Equati o n (8) from ice-core data, wc com'erl it to a dep th integra l th a t is weighted according to th e local age- depth g radi ent in the ice shee t. D efin e a new ve rtical coo rdinate, C, which is depth below the ice-sheet surface. Then, using Equa ti ons (2) a nd (4),
1 .l( (1 0'((') ~ cl ' a*(t ) = -
E( ( ,))2 d(' ( t + 1 --y m l ( (PD lI ) ( pp* p2 ) dt d ' t p* R (Po)2 o T (1 + 1',)2 d(' (
b Ej = - - t(C) (9)
H where (10 is the density o f snow at the surface. The ca lculations a re independent o f this parame ter because 0.* is di vided by the square of Lo in Equati on (7). The age of fim at a g ive n depth , t((), a nd hence the depth age gradient, are kn own from counting a nnual b cyc les, a nd is confirmed indepe ndentl y by both v isua l stratigraphy a nd elec trical conducti v it y measureme nts ( ~feese and o thers, 1994). Th e group PDaT - 1 is tempera ture-dependent. ] 0 incorpora te this most acc urately, we use the Cuffey a nd others (1994) tempera ture model to track PDaT- 1 as a function of time along the paths of layers being buri ed . Thi s is potenti a ll y importa nt in the upper 30 o r so meters o f the firn , because the diffusi"ity will \'a r)' by a lmost a facto r o f 2 betwee n 29 '" and 3-~ qc. The tempera ture model is fo rced by a mean annu a l surface tempera ture that is the ca libra ted blBO history 8 = 0.53T - 18.2 (C uffey and oth e rs, 1994; Stui" er and n l hc rs, 1995). AbO\'e 12 m , \\"here the seasona l \'ari a ti o n in tempe ra ture is importa nt , we assume the temperature va ries sinuso ida ll y in response to a sinuso ida l surface-temperature fo rc ing of amplitude 20 C. \\'e use the correspond ing annua l time-a"erage of PD"T- 1 in Equati o n (9) (Bow, 1982).
All subsequent difTusio n calculati ons in this paper use Equati o ns (7) and (9). We address the unde termined constants --y a nd p* in the foll o wing secti on.
1.2. A test of this diffusion m.odel
To tes t o ur understa nding o f rirn diffusion, wc measure th e decay o f the a nnual b1B O cycle with depth in th e GISP2 core and compa re with model calc ul at ions. This test is imperfec t, because we do not have independent info rm a tio n about how the seaso na l OIBO amplitude a t depositi on cha nged during the pas t severa l centuri es.
Fo r a n a nnual b cycle, delimited from summer peak to summer peak, we define the seaso nal a mplitude as half th e average o f th e magnitudes of the summe r to winter a nd \I"inter to summer b cha nges. For the GISP2 core, the 8 record was m easured a nd a na lyzed by Stuiver a nd others (1995). Wc use data from 1.5 to 200 m below the surface. Th e upper m e te r is excluded because rapid diffusion not de. cribed by the Whill ans a nd G rootes model is possible there due to ventil a ti on (Cla rke a nd others, 1987). \Ve norma li ze the a mplitudes to their value a t the top o f the firn column, which is chosen as the inte rsection on a log- log plot of the Z = 0.1 line a nd a bes t-fit line through the upper 10 m o f amplitude vs depth data .
If we consider onc a nnua l laye r at a time, the thickn ess
275
Journal rifClaciology
of each a nnual layer at ti me of deposition corresponds to the Lo in Equa tion(7); thin layers diffuse more rapidly tha n thick layers Uo hnsen, 1977). To compare model predictions with the a mplitude data, we take a 2 m average layer thickness around each yea r a nd calculate the corresponding unstraincd surface thickness, which we use fo r Lo in Equation (7). Using thi s average fo r Lo simply makes the result easier to compa re with the data (comparing a sm ooth curve to noisy da ta is easier than comparing a noisy curve to noisy data ). Using Equation (7), we ca lcul ate the a mplitude decay of a single sinusoid for each year ( ~ = 27f). We perform the same calcul ation for va rious va lues of p' and f.
1.3. R esults of the test, furth er tests a nd implications fo r firn processes
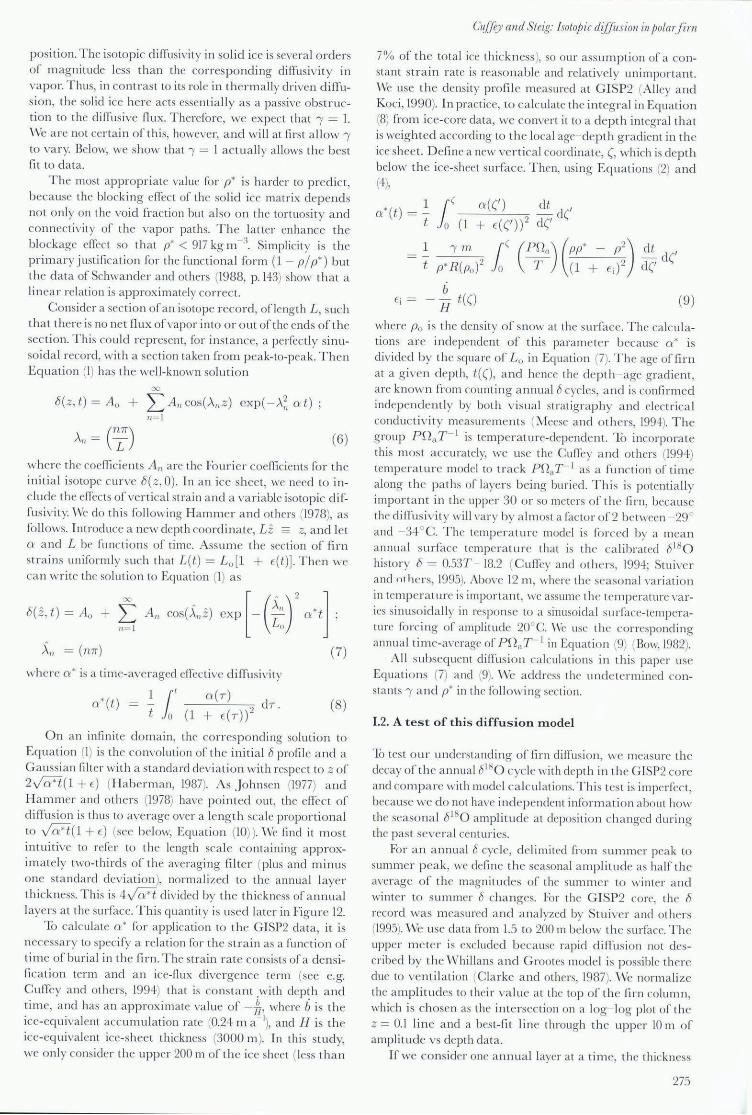
First we ca lculate the seasonal a mplitude decay using I = I and the suggested p' value from Whillans and Grootes (1985) (p' = 820), and find that the match to the GISP2 8180 data is very good in the upper firn (Fig. I), but that the calculation underpredicts amplitudes by a factor of 5 at the base of the firn co lumn. Though not perfect, we think this ma tch is impressive given that Whill a ns a nd Grootes did no adj usting of parameters, and that their theory is independent of ice-core data . A factor of 5 underprediction of amplitudes at the base of the firn corresponds to an overprediction of the isotopic diffusivity by a multipl e of only 1.7. For comparison, a factor of 5 overprediction of the diffusivity wo uld lead to underprediction of amplitudes by 4 orders of magnitude.
(1)
"0 ::J
.t:: Q.
E co "0 (1)
. ~ co E .... 0 z
1
0.8 ,
0.6
0.4
0.2
0 0 50
.,
100
WG model measured gamma=5
200 300
Time of burial (years)
Fig. 1. T he decay ofseasonal amplitude qfCISP2 8180 cycles, as a func tion of time rif burial. T he measured amplitudes rif Stuiver and others (1995) are shown, along with the a priori prediction of the Whillans and Crooles (1985) model, and the prediction if the diffilsivity rif water vapor is enhanced by Cl
factor rif 5 throughout thefirn column.
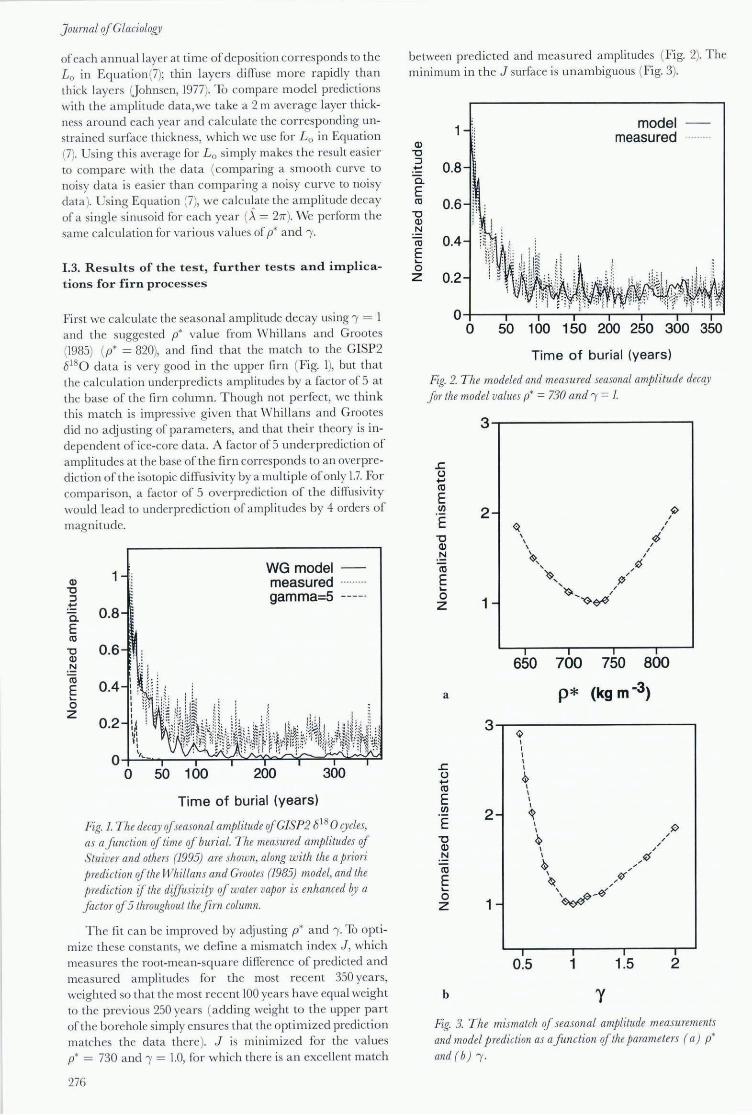
The fit can be improved by adjusting p' a nd f. To optimize these constants, we define a mismatch index J, which measures the root-mean-squa re difference of predicted and measured amplitudes for the most recent 350 years, weighted so that the most recent 100 years have equal weight to the previous 250 yea rs (adding weight to the upper part of the borehole simply ensures that the optimized prediction matches the data there). J is minimized for the values p' = 730 and I = 1.0, for which there is a n excellent match
276
between predicted and measured amplitudes (Fig. 2). The minimum in the J surface is una mbiguous (Fig. 3).
(1)
"0 ::J
.t:: C. E co "0 (1) N
co E .... o Z
0.8
0.6 :: i
0.4
0.2
, :
model measured
O;---,---.---~--~~~~~~~
o 50 100 150 200 250 300 350
Time of buri al (years)
Fig. 2. The modeled and measured seasonal amplitude decay Jor the model values p' = 730 and I = 1.
£ U +-' co E CIJ
E -C (1) N
co E .... o Z
a
£ U +-' co E CIJ
E -C (1) N
co E .... 0 z
b
3.-------------------~
2-
1 -
I I I I
650 700 750 800
P* (kg m-3)
3 ~
I I I I I
~ I I I I
2- ~ I
~ I
~ / /
I / /
I /I(f ~ /
\ /~
/
~ / \
¥-~ 1-
I I I I
0.5 1 1.5 2
y
Fig. 3. The mismatch of seasonal amplitude measurements and model p rediction as afunction of the jJarameters (aJ p' and (b) f.
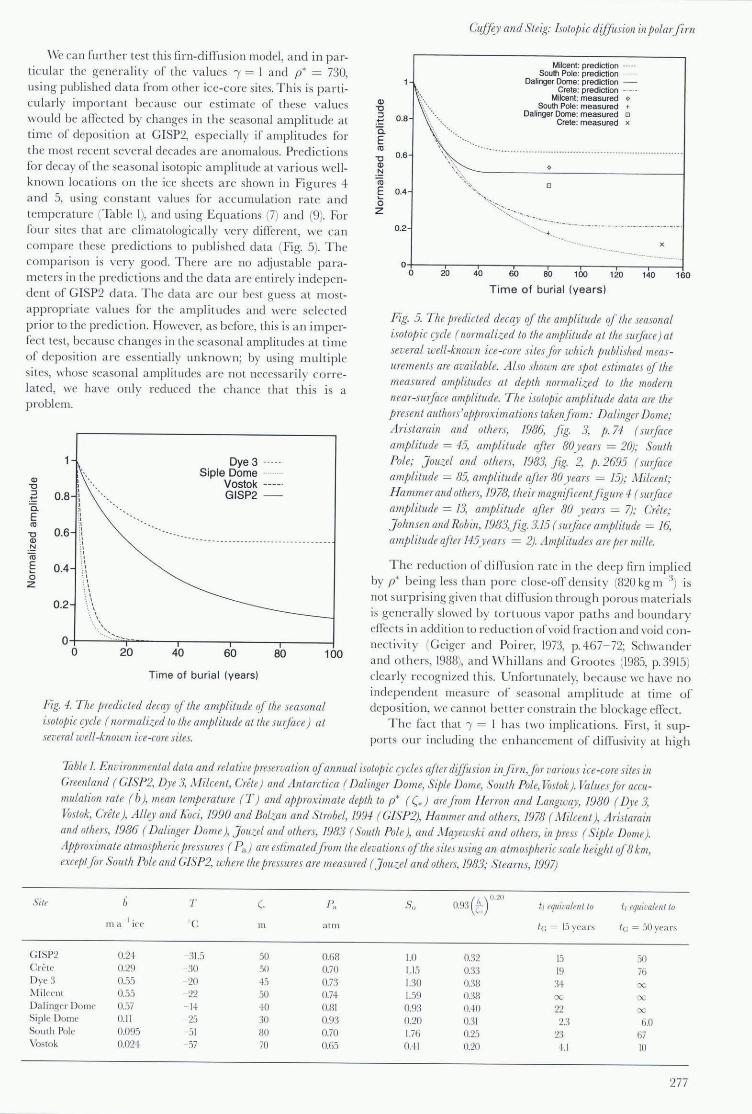
\Ve can further test this rirn-d iffusion model, a nd in pa rticular the ge nera lit y of the values I = I and p* = 730, using published da ta from other ice-co re sites. This is p a rtic ul a rl y important because our estimate of these values would be affected by changes in the seasonal amplitude at time of depos ition a t GISP2, esp ecia ll y if amplitudes for the most reccnt seve ra l decades a re a nomalous. Predic tions for decay of the seasonal isotopic amplitude at vario us wcl lknown locations o n the ice sheets a re shown in Fig ures 4 a nd 5, using consta nt values for acc umul ati on ra te a nd temperature (Table I), and using Equations (7) and (9). For four sites that are climatologically very different, we ca n compa re these predicti ons to published data (Fig. 5). The comparison is very good. There a re no adjustable parameters in the predictions and the da ta a re entirely independent of GISP2 da ta. The data a re o ur best guess a t m ostappropri ate values for the amplitudes and were sclected prio r to the prediction. However, as before, this is a n imperfecttest, because cha nges in the seasonal amplitudes at time of deposition a re essenti a ll y unknown; by using multipl e sites, whose seasona l a mplitudes a re not necessari ly correlated , we have onl y reduced the chance that t hi s is a proble m.
Q)
"0 :J
.-t= a. E co
"0 Q) N
co E 0 z
0.8
0.6
0.4
0.2
I , :t , , , , , " " " " " :0 :0 :0
" " " '. ' " ,. " '. ' '. '
': \
Dye 3 Siple Dome
Vostok GISP2
....... >" o~---" -" '~~~~~- -r-------r-------r-------r-----~
o 20 40 60 80 100
Time of burial (years)
Fig. -I. T he predicled dew)) of Ihe amplilude of the seasonal isolopic cycle (norlllalized to the alllj)lilude atllie surface) at several well-known ice-core sites.
Q)
"0 ::l .-t= 0. E co
"0 Ql
.~ co § 0 Z
GUJfe)1 and Steig: Isotopic diffilSiol7 in polar fim
0.6
0.6
0.4
0.2
Milcent: prediction .... South Pole: prediction
Dalinger Dome: prediction -Crete: prediction _ ....
Milcent: measured 0
South Pole: measured + Dalinger Dome: measured 0
Crete: measured x
o
o
x
O+----.----,----,r----r---,r----r----.---~ o 20 ~ W W 100 l m 140
Time of burial (years)
Fig. 5. The jmdicted decCl..-Y of the amplitude if the seasonal isotop ic cycle (normalized to the amlJlitude at the sll1jace) at several well-known ice-core sites for which jJUbhshed measumnents are available. Also shown are Sl)ot estimates of the measured amphtudes at depth normalized to the modern near-surface amj)litude. The isotopic amjJlitude data are the present authors'approximalions takenfrom: Dalinger Dome; Aristarain and others, 1986, fig. 3, p.74 (surface amj)litude = 45, amplitude after 80 years = 20); Soulh Pole; J ouzel and others, 1983, fig. 2, p. 2695 (sUljace amplitude = 85, amplitude after 80 years = 15); :vl i/cent; Hammerand olhers, 1978, their magllijicenlfigure 4 (sur/ace amplitude = 13, amplitude after 80 years = 7); Grele: J olznsen and Robin, 1983,fig. 3.15 (Sll1jclce amplitude = 16, amj)litude after /-I5)wlTS = 2). Amplitudes are per mille.
160
The reducti on of d iffu sion rate in th e deep rirn implied by p* be ing less than p o re close-off density (820 kg m :1) is not surpri sing gi\'C n tha t d i ffu sion throug h porous mater ia ls is genera ll y slowed by to rtuous \'apor pa ths a nd bounda r y effec ts in addition lO red uction of \'oid frac tion and void co nnectivity (Geiger and Po i re I', 1973, p. 467- 72; Schwande r and o thers, 1988), and Whi ll ans and Grootes (1985, p. 3915) clearly recognized thi s. U nfo rtunatel y, because we have no independent measure o f seasonal amplitude at time of de pos iti on, we cannot be tte r constrain the blockage effect.
The fac t that I = I has two implications. Fi rs t, it supports o ur including the enhancement 0 (' diffusivit y at hig h
Table I. Environmental data and relalive preservation if annual isotopic C)lcles after difJusioll infim,Jor various ice-core sites in Greenland (GfSP2, D..ye 3, }\1ilcenL, Crife) and Antarcliea ( Dalinger Dome, Siple Dome, SOLlth Pole, Vostok). ValuesJor accu lIlulation rate ( b), mean temperalure (T) alld aj)proximate depth to p* ((.) arefrom Herron and LangwCl..-Y, 1980 ( Dye 3, Vostok, Grele), Alley and floci, 1990 and Bolzan and Slrobel, 1994 (G1SP2), Hammer and olli ers, 1978 ( Mileent), Aristamill and others, 1986 ( Dalinger Dome), J ou::eL and others, 1983 ( South Pole), and l\I(~vewski and others. in jJress (Siple Dome). Approximate almospheric pressures ( Fa) are eslimaledj'7'Om the elevations if the sites using an atmosj)lzeric scale height of 8 km, except/I)], South Pole and GISP2, where the pressures are measured (J ouzel and otlzers, 1983; Steams, 1997)
Sile {i T C P,. Su ( t' ) 1J .20
0.93 ~ I, eqait'tltfllllo I, equi1'atenllo
ma I ire C m rt l lll le: = 15 years le: = 50 years
G ISP2 0.2+ 31.5 50 0.68 1.0 0.32 15 .'i0 Cri.' lc 0.29 30 50 0.70 1.15 0.33 19 76 Dye 3 0.5.1 20 +5 0.73 1.30 0.38 3+ cc
!\li JcClll 0.55 22 50 0.7+ 1.59 0.38 x x Dali ngcr Dome 0.57 1+ +0 0.81 0.93 0.+0 22 :xl
Siplc Dome 0. 11 25 30 0.9:1 0.20 0.31 2.3 6.0 Soulh Pole 0.095 51 80 0.70 1.76 0.25 23 67 \'05lOk 0.02+ 57 70 0.65 0.+1 0.20 +.1 ID
277
J ournal rifG/aci% g)'
altitude. Second, it shows tha t a significant enh ancement of water-vapor diffusivity in snow rel ativc to a ir is not appropriate in this case. Using the recommcnded enhancement of Colbeek (1993), , = 5, in fac t leads to unques tionably excessive diffusion (Fig. 1). This supports our contention that "apor nux driven by grad ients in isotopic composition should be ca lculated in a m a nner diflerent from vapor flu x driven by temperature grad ients.
The satisfa ctory predictions of Equations (7) a nd (9), the physically very plausible val ues for the optimized parameters and the independence of the theore tical framework from ice-core data together provide strong e, ·idence that the \ Vhill a ns and Grootes theo ry is "substantiall y co rrect", a. they assert. In particul a r, the theory seem s to incorporate properly the important env ironmental variables, temperature a nd accumu lation rate.
One furth er implication of our value for p* concerns the mobilit y of gases in the Grn column. Sowers a nd others (1992) divided the firn air column (which is the inte rconnected air column from the surface of the ice sheet down to the depth at which pores become comple tely surrounded by ice) into three sec tions with res pect to mobility of gases: an upper, convective zone, a diffusive co lumn and a non-diffusive zone deep in the firn. To first approximation, our p* corresponds to the boundary between Sowers and others' diffusive and non-diffusive zones. Our analysis supports the validity of the non-diffusive zone concept, and the correspondingly smaller age difference between the gas record a nd the ice record in an ice core (Sowers a nd others, 1992). p* = 730 implies a non-diffusive zone of approx imately 25 m thickness. However, our analysis is not well-suited to finding thi s bounda ry due to the variability of seasonal a mplitudes.
1.4. Johnsen's theory and constant diffusion-length hypothesis
The Whillans and Grootes (1985) theory was motivated in part by the ea rlier-published theo ry ofJohn sen (1977). The t wo theories share their m ost important components: a n isotopic diffusivity proportio nal to both water-vapor pressure a nd diffusivity in air, sto rage of water m olecul es in the solid matrix a nd slowed diffusion at increased densities. Consequent ly, predicti ons from both theori es as to how firn diffusion depends on the temperature and accumulation rate a re fund amentally in agreement, though the later theory adds elements that are essential for quantita tive acc uracy.
J ohnsen (1977, equation (5)) noted that the tota l extent of diffusion of the isotopic record between the surface and the base of the firn can be convenientl y expressed as the diffusion length Le defined by
Ab (- 271"2 Lr2 ) -= exp . Ao b2
(10)
where Ab a nd Aa are seasona l amplitudes a t the base and top of the firn , resp ec tively. In o ur notation, PiL c = poV2a*t. J ohnsen suggested th a t Lr is approximatelya constant, not because the rate of di [fusion is independent of temperature and acc umulation ra te but because the density- depth profile depends on these variables; warmer sites densify fas ter, co untering the increase of P and Da at higher temperatures.
To investigate the dependence of Lr on temperature and acc umula ti on rate in our m odified Whill a ns a nd Grootes theo ry, we link diffusion calculations (Equations (7) and
278
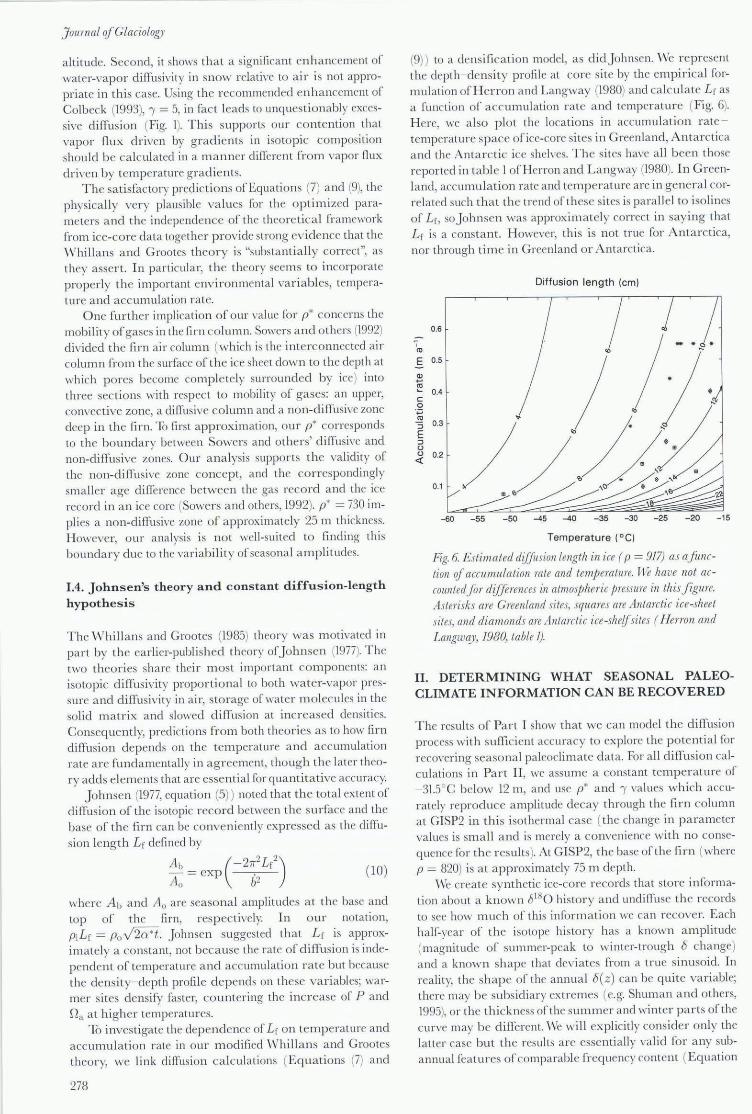
(9)) to a densification model, as didJohnsen. We represent the depth- density profile at core site by the empirica l formul ation ofH erron and Langway (1980) and calcul a te L r as a fun ction of accumu lation rat e a nd temperature (Fig. 6). H ere, we a lso p lot the locations in acc umul a tion rate temperature space of ice-core sites in Greenland, Antarctica a nd the Antarctic ice shelves. The sites have a ll been those repor ted in tabl e I ofHerron and Langway (1980). In Greenland, accumulation rate and temperature are in genera l correlated such tha t th e trend of th ese sites is para ll el to iso lines of L r, soJ ohnsen was approxim ately correct in saying that L r is a constant. Howe"er, thi s is not true for Antarctica, nor through time in Greenland or Antarctica.
'Ill
E Q) .. ~ c 0
''::; ~ ::J
E ::J U u <l:
Diffusion length (cm)
0.6 / _ .. 0.5
0.4
0.3
0.2
0.1 / .h,
~ \ ~ OB Q \ Z
-60 -55 -50 -45 -40 -35 -30 -25 -20 -15
Temperature (OC)
Fig. 6. ESlimaled diffusion length in ice ( p = 917) as afunclion qf accumulation rale and temperature. fiVe have not accollntedJor differences ill atmospheric pressure in this figure. Asterisks are Greenland sites, squares are Antarctic ice-sheet sites, and diamonds are Antarctic ice-shelf siles ( Henon and Langwaj', /980, table J).
H. DETERMINING WHAT SEASONAL PALEOCLIMATE INFORMATION CAN BE RECOVERED
The results of Part I show that we can model the diffusion process with sufficient accuracy to explore the po tenti a l for recO\·ering seasonal paleoclimate data. For all diffusion calcul ations in Part Il, we ass ume a constant temperature of - 31.5°C below 12 m, and use p' and , values which accurately reproduce a mplitude decay through the rim column a t GISP2 in thi s isothermal case ( the change in para meter " a lues is sm a ll a nd is merely a convenience with no conseq uence for the r esults). At GISP2, the base of the rim (where p = 820) is a t approxi mately 75 m depth.
\ Ve create synthetic ice-co re records that store information about a known 6180 hi story and undiffuse the reco rds to see how much of this inform ation we can recover. Each h a ll~year or the isotope hi story has a known a mplitude (magnitude of summer-peak to winter-trough 6 cha nge) and a known shape that deviates from a true sinusoid. In reality, the shap e of the annua l 6(z) can be quite va ri able; there may be subsidiary extremes (e.g. Shuman a nd others, 1995), or the thickn ess or the summer and winter parts of the curve may be different. We will explicitly consider only the latter case but the results are essentia ll y "alid fo r a ny subannual features of comparable frequency content (Equation
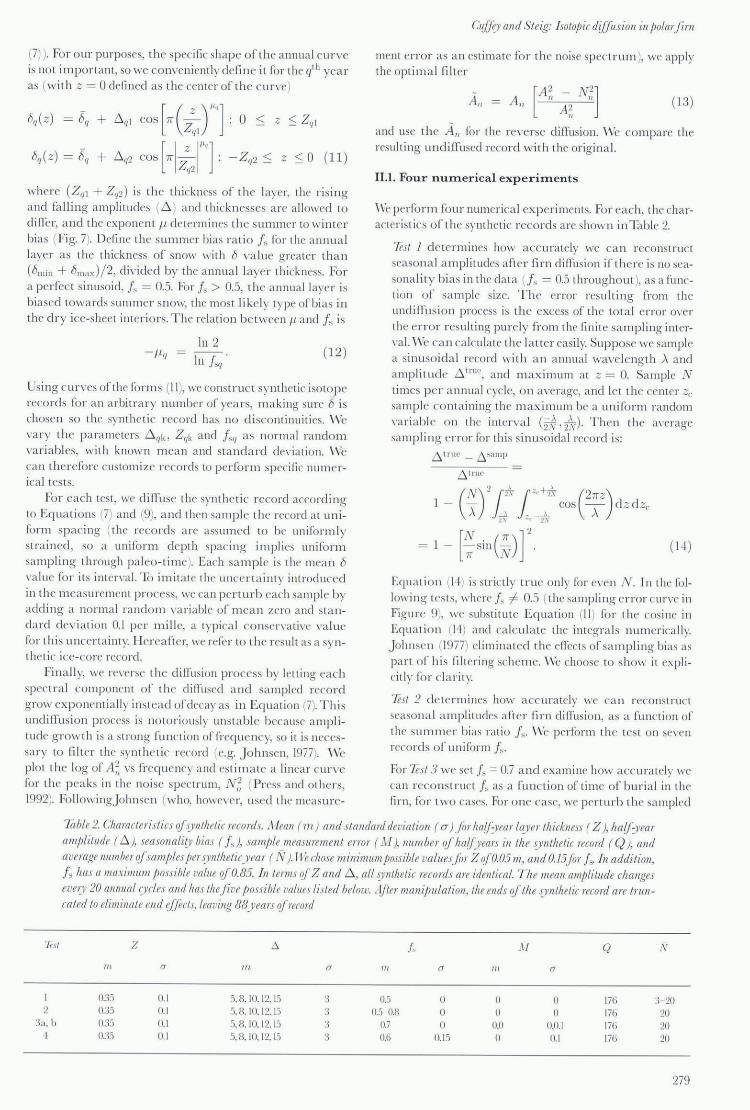
(7)). Fo r o ur purposes, the spee iflc shap e o f the a nnu a l curve is no t impo rta nt, so we conveni entl y defin e it fo r the qth yea r
as (with Z = 0 defin ed as the eenter of the c un'e )
8q(z) = b" + Ll,,\ cos [7r (~J 1',, ] ; 0 :S Z :S Zql
8q(z) = b" + Ll,,2 cos HZ:J"'] ; -Zq2:S z ::::: 0 (ll )
where (Zq\ + Z,,2) is th e thickness o f thc layer, the r ising
a nd fa lling a mplitudes (6 ) a nd thi ckn esses a rc a ll owed to differ, a nd the ex po nent I-" determines the s ummer lO winte r
bi as (Fig. 7). Defin e th e summer bias ra ti o j~ fo r th e a nnua l
layer as th e thickness of snow with 8 \ 'a lue greater tha n
(b lll in + bll1ax )/2, divided by th e a nnu a l layer thickness. For
a perk'c t sinusoid, j , = 0.5. Fo r i~ > 0.5, the a nnu a l laye r is biased to wa rds summe r sn ow, the 1l1 0stlike ly type of bi as in
th e dry ice-sheet interiors. The rela ti o n b e twee n f.1 a nd i, is
In 2 - J1.q = - - .-.
In i,,, (12)
Using eun"Cs of the fo rms (11 ), wc co nstruc t synthetic isoto p e records fo r a n a rbitra r y number of yea rs, m a king sure b is
chosen so th e sy nth e ti c reco rd has no disconLinuities. "Vc
var y thc p a ra meters Ll"k. Z"k a nd i,,, as norm a l ra ndo m varia bles, with known m ea n a nd sta nda rd de\'ia ti o n. \ Vc
ca n th e re fo re customi ze records to perfo rm sp ecific nume rical tes ts.
For each test, wc diffuse th e sy nth e tic r ecord acco rding
to Equa ti o ns (7) a nd (9), a nd then sa mple the record at uni
fo rm sp ac ing ( the records a rc ass umed to be unifo rml y stra ined , so a unifo rm de pth spac ing implies uniform sampling through pa leo-time). Each sample is the mean b \'a lue fo r its inten ·a l. To imita te the unccrta inL Y introduced
in the m easurement process, wc ca n pcrturb each sample by
add ing a no rm a l ra ndo m \'ari abl e o[ m ean ze ro and sta nda rd de \ 'ia ti on 0.1 per nl.ill e, a typica l conse rvati\'e va lue
fo r thi s unce rta int y. H e reaftcr, we refer to the rcsult as a syn
the ti c ice-co re record .
Fin a ll y, wc re\'c rse the diffusion process by letting each spec tra l eomponelll o f th e diffused a nd sampled record
g row ex po nentiall y instead o f decay as in Equa ti on (7). Thi s
undifTusio n process is notorio usly un sta bl e bcca usc a mplituclc g rowth is a strong fun cti on of frcque ncy, so it is neces
sa ry to fi It er the synthe tic rcco rd (c.g. J o hnsen, 1977). \ Vc
plot the log of A~, \'s freque ncy a nd estima te a linear cur\ 'e for the p eaks in th e no ise sp ec trum, N,~ (Press a nd othe rs, 1992). Fo ll owingJ ohnse n (wh o, howeve r, used th e l11easure-
Oiffey and Steig: Isotopic diffusion in polar fim
ment erro r as a n es tim ate [o r the noise sp ectrum ), wc appl y
the optimal filt er
- [A~, - N~] All = A" A; (13)
and use the A " for th e 1"C \ "C rse diffusio n. " re compa re th e
resulting undifTused record with the orig ina l.
ILL Four nutnerical experitnents
We perfo rm fo ur numerica l experim ents. For each, th e cha r
acteri stics o f th e sy nthetic records a rc shown in Ta blc 2.
Test I d e te rmines ho\\' accurately wc ca n reco nstruct seaso n a l a mplitudes a fter urn diffusio n if there is no sea
so na lit y bias in the da ta Us = 0.5 throug ho ut ), as a fun c
ti on o f sampl e size. The er ror resulting from the undi ffu s io n process is the excess of th e to ta l error O\'C r
the erro r res ulting pure ly from the finit e sampling inter
\·a l. \ Vc ca n ca lculate th e la tter easily. Suppose wc sampl e a inusoida l reco rd with a n a nnu a l wa \ 'C !cng th A a nd amplitude Ll tnl<', a nd m a ximum a t z = O. Sa mple N times p e r a nnua l cycle, o n ave rage, a nd let th e ce nter Ze
sample cO llla ining the m a ximum be a unifo rm ra ndom
\'ari a b!c o n the inten 'a l (2.~ . 2;V) ' Then the al'erage sampling error for thi s s inusoidal reco rd is:
6 t r ll~ _ t,. " 'lIiP
Lltrll~
(N) 21'* j "'+'* (27rZ) 1 - - cos - dz dzc /\ -1 __ ..0.. A
1.\ -, :! .\
[N ] 2
1 - -;t;ill(~) (1'.!)
Equa ti o n (1+) is strictly true o nl y for eve n N . In the fol
lowing tes ts, where is i= 0.5 ( the sampling e r ror curve in Figure 9), wC' substitute Equa tion (11) [o r the cosine in
Equa ti o n (1+) a nd ea leul a te the integra ls numerica ll y.
J ohnse ll (1977) elimina ted the effec ts of sampling bias as pa rt o f hi s filt ering sche m e. \\'e choose to sh o w it expli
citl y fo r cl a rity.
Test 2 d e te l'lllines how acc ura tely we ca n reconstruct
seaso na l a mplitudes a ft e r firn diffusio n, as a fun ction of
the summe r bias ra ti o j~ . \\re perform th e tes t o n seven
reco rds o [ uniform k Fo r Test 3 wc se t f, = 0.7 a nd exa mine how acc ura tely wc ca n reco nstruct i, as a fun c ti o n of tim e o [ burial in th e
fim , fo r two cases. Fo r o nc case, wc perturb th e sa mpled
7c/ble 2. Clw)'{/{teristics of5,.Yllthetic records . .Ileal! (m ) and standard deviat ion ( a ) ./iJ1 ha(f:yearla..yer th ickness ( Z ), 11O(f -year amplitude ( Ll ), seasonali£y bias ( i~). sample measurement en or ( j\f ). number qflLO/.f)ears ill the synthetic record ( Q ), and average !lumber qfsamjJ/es j1fT ~))n theti[)'ea r ( N). 11 e dIOse minimum possible valuesfor Z qfo.05 m, and 0.15 fo r is. i ll addition, j~ has a maximum jJossib/e value of 0. 85. in terms qf Z al/d 6 , all 5,.l'ntlzetic records are identiwl. Th e mean ampLitude changes eVeI), 20 ann /lal {),des and has thefive jJossible vallles listed below. i !fteT manijJuLation.the ends of the s)mtiletic record are trunw tN/ to eliminate end l!fficts./eaving 88 years I!fre{ord
Te ,l
2 h , h
+
III
0.35 0.35 0.35 0.35
Z
a
0.1 0.1 0.1 0.1
to.
/11 a In
:), 8. 10. t2. t.~ 3 05 '),8. 10. 12. 15 3 0.5 0.8 5, 8, 10. 12, 1.'i :3 0.7 5, 8, 10, 12.15 :) 0.6
j', /If
a ill
0 0 0 0
° 0,0 0.15 0
(J
0 tl
0,0.1 0. 1
Q
176 176 176 176
3 20 20 20 20
279
Journal cifGlaciology
Depth
Fig. 7 Exam/Jles rifhow the parametn /-ialfects the seasonally biased isotope-depth curves given by Equation (J I). If the annual temperature and isotopic com/Josition rifjnecijJitation follows a sinusoidaL pallern through the yem; then the curves conesjJond to: uniform snowfall throughout the year (top curve), and increasingly depleted snowfall in the winter ( Lower curves). Th is fig ure specificaLly shows the roLe rif /-i on!)'- The synthetic records we actually 71 51' me not uniform and symmetric like these curves because we allow Z and .0., and sometimes /-i, to vmy randomly ( TabLe J).
"da ta" to mimic the measurement error (or a real icecore reco rd. In the other, we do not, in order to mi mic an ideal record tha t has lost information via the diffusion process alone.
For Test 4 we use a synthetic reco rd that is as close as possible to a rea l ice co re. Both .0. and j , vary along the reco rd , and the sampled diffused reco rd is perturbed to mimic measurement error. \ Ve plot the error in reconstructions of both amplitude and Is as funct ions of time of burial.
For a ll these tests, wc repon the ave rage magnitude of error for reconstructed a mplitudes (.0. r
) a nd reconstructed seasonality bias factors (f~ ) as
E/',. = ~ t i .0. ~ ~ .0.q i Q q=l q
q= ~ t iI~~ - ISqi Q q=l Isq
(15)
where the q refers to a given half-year, which a re Q in number. If diffusion removes all information about the original seasonal history, there wi ll be no annual cycles and E/',. = l. If diffusion removes a ll information about the sub-annual seasona l hi tory, then a ll recovered Is va lues an ' 0.5 (i.e. perfect sinusoids are recovered from orig ina lly non-sinusoida l shapes) and Ef will be a number (call it EfO ) that depends on the pa rent history'S Isq values. It is most intuitive to
define thc "information content" remaining after a g iven time of buria l as the error relative to the e rror after diffusion has eliminated all information about the original hi story:
I /',. = 1 - E/',.
Ef Jr=l--.
Ero (16)
\Vhen I = I, all information about the orig inal isotope history is recoverable. Wh en I = 0, nothing is known of the orig ina l .0. or Is history.
280
11.2. R esults of numeric al test s
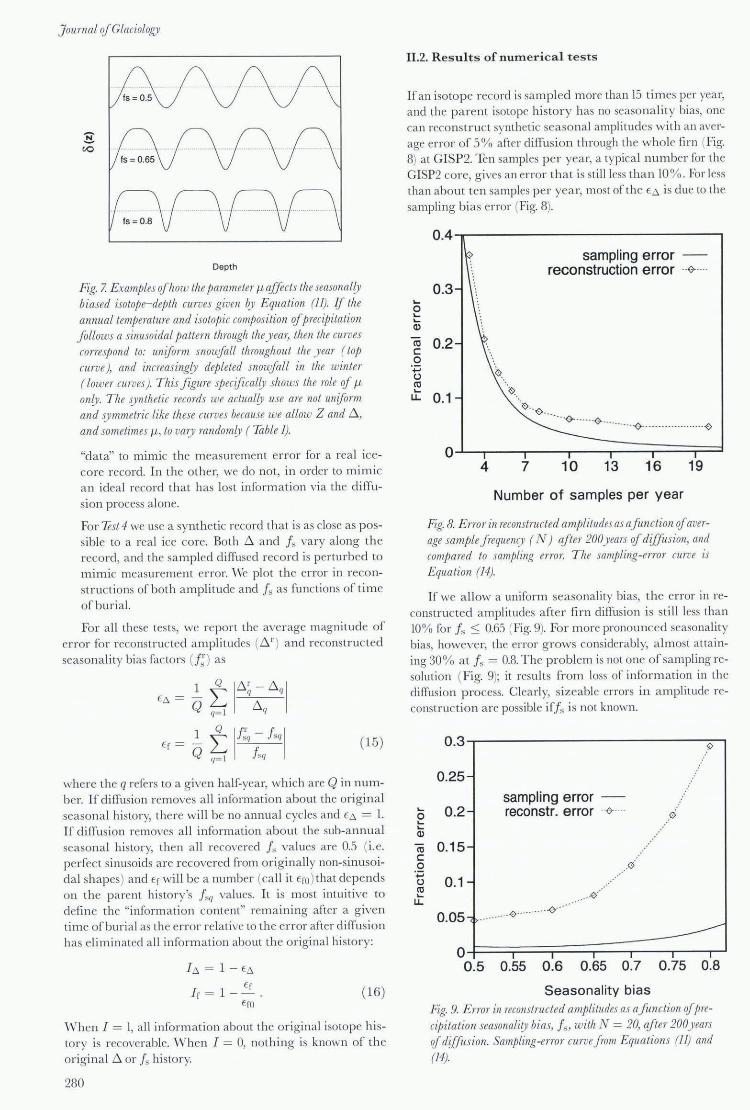
If an isotope rccord is sampled more than 15 ti m es per yea r, and the parent isotope histo ry has no seasonalit y bias, one can reconstruct sYl1lheti c seasona l amplitudes with an average error of 5% after diffusion through the whole firn (Fig. 8) at GISP2. Ten samples pe r year, a typical number [or the GISP2 co re, g ives an error that is stilllrss than 10 % . For less than about ten samples per year, most of the E/',. is due to the sampling bias error (Fig. 8).
... o ... ... Q)
O.4-y----------------,
0.3
sampling error reconstruction error -<7- ---
~ 0.2 o .... u co ...
u.. 0.1
0-. . .~ .
·0··0-·-·_· ·~ ·· ... . o -· ·--··-- ~···----· · · · --·-····- o
4 7 10 13 16 19
Number of samples per year
Fig. 8. Error in reconstructed amplitudes as afunction rif average sam/JLe frequency ( N) ajter 200 years rif diffusion, and com/JaTed to sampling error. T he sampLing-error curve is Equation (14).
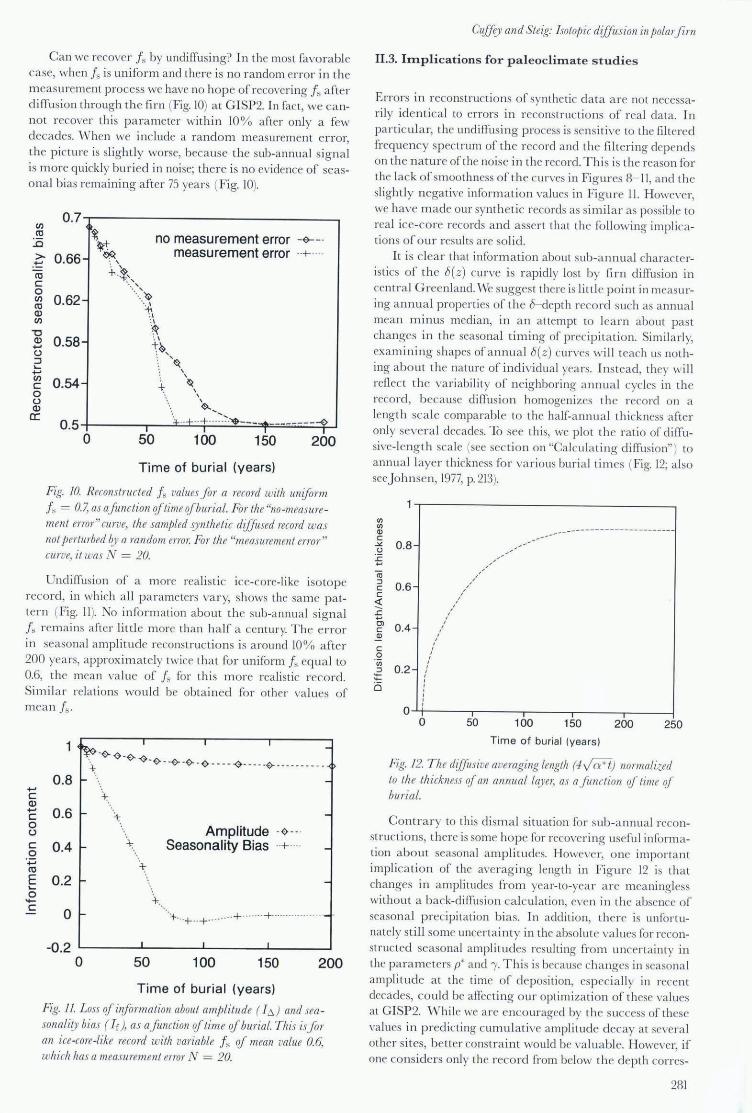
If we a llow a uniform seasonality bias, the error in reconstructed amplitudes after Grn diffusion is still less than \0% for j~ :::; 0.65 (Fig. 9). For more pronounced seasonality bias, however, the error grows considerably, a lmost allaining 30% a t Is = 0.8. The problem is not one of sampling resolution (Fig. 9); it resu lts from loss of inform ation in the diffusion process. Clearly, sizeable errors in amplitude reconstruction are poss ible ifj , is not known.
... 0 ... ... Q)
co c 0 ';:;
c..> co ...
u..
0.3 t;;>
0.25-
sampling error .-
0.2- reconstr. error --0" <:5
0.15-.0'
0.1-{:;
0.05.., .-·0"'-'- - . ~'
----O~~~~~~==~~ 0.5 0.55 0.6 0.65 0.7 0.75 0,8
Seasonality bias Fig. 9. En-or in recollstructed ampLitudes as afunction of precipitation seasonaLity bias, Is, with N = 20, after 200),em-s of diffusion. Sampling-error curveJrom Equations (I I) and (14).
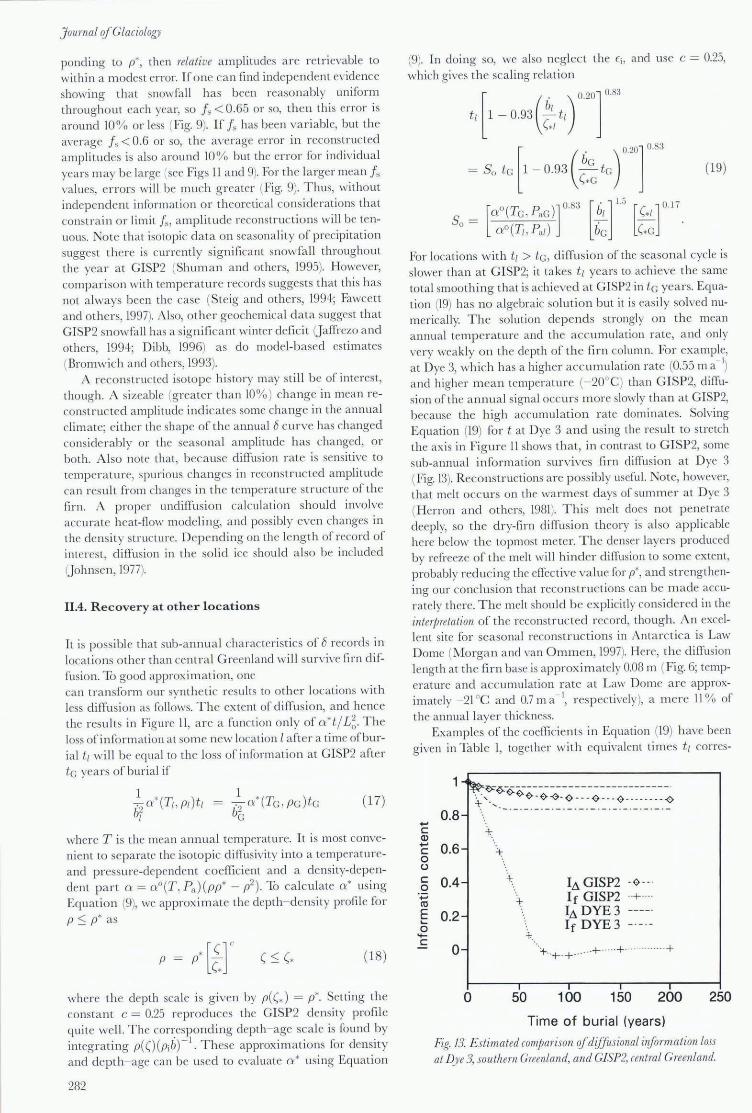
Can wc recover j~ by undiffusing? In the most favora ble case, when is is unifo rm and there is no random error in the meas urement proces we haye no hop e of recovering j , after diffusion th rough the firn (Fig. 10) a t GISP2. In fact, we cannot recover this p a ra meter within 10 % a fter only a few decades. \Vhen we include a random m easurement error, the picture is slightly worse, because the sub-annua l sign a l is m ore quickl y buried in noise; there is no evidence of seasona l bias remaining a fter 75 years (Fig. 10).
(fl co :0
0.7...-----------------,
.? 0.66
t ~+ ~ . , + .~,
no measurement error -~-. measurement error .+ ..
co c o
.-t; ,
~ 0.62 ... ->~
.. :f-Q) (fl
"0 Q) ..... u ~ .... ..... (fl
c o u Q)
c:
0.58
0.54
·. 1 ·.1
~ :I
+~, '~ ,
'~ + \ \
. ~" 4- .. + .. + ... :: .. ~--- .... --_~,..---~
0 .5~-----.,~-=~;---~~~~~~
o ~ 100 1~ ~O
Time of burial (years)
Fig. iO. Reconstructed is values Jor a record with uniform j, = 0.7, as afunction of time qfburial. For the "no-measurement mM" curve, the sam/)led synthetic diffused record was not perturbed ~Y a random error. For the "measurement enor" curve, it was N = 20.
U ndiffusion of a more realisti c ice-core-like iso tope reco rd , in which a ll pa rameters va r y, shows the same pa ttern (Fig. 11). No info rm ati on about the sub-annua l sig na l i s remains after litt le more than ha lf a centur y. Th e error in seasona l amplitude reconstructi ons is a round 10 % after 200 yea rs, approx ima tely twice tha t fo r uniform j~ equa l to 0.6, the mcan va lue of is for thi s m ore realisti c reco rd. Simil a r relati ons wo uld be obta ined for other values of mean j , .
..... c Q) ..... c 0 u c 0 ..... co E .... 0 ..... c
1
0.8
0.6
0.4
0.2
0
-0.2
~ 1_
-t;'" .~~-~-<) __ ..
o
* ~ ~ ~-~-----<)--- - .~ - -.-------
+ ..
I
50
Amplitude -0-
Seasonality Bias .+ ..
-
-
-
-
"-t. -+ .+ ....... + ...... + ................ -
I I
100 150 200
Time of burial (years)
Fig. ll. Loss of info rmation about amplitude ( h ) and sea sonali£y bias ( I f), as a function qf time qf burial. This isfor an ice-care-like record with variable j , qf mean vallle 0.6, which has a measurement error N = 20.
Cuff!,)1 and Steig: isotopic diffusion in J)olarfim
11.3. I lTIplications for paleocliIIlate studies
Errors in reconstructions of synthetic da ta a re not necessarily identical to errors in reconstructions of real data. In pa rti cula r, the undiffusing p rocess is sensitive to the filtered frequency spectrum of the record and the filtering depends on the na ture of the noise in the record. Thi s is th e reason for the lack of smoothness o f the curves in Fig ures 8- 11, and the slightly negati\·e informa tion va lues in Figure 11. However, we have m ade our synthetic records as si milar as possible to real ice-core records and assert that the following implicati ons of o ur res ults are so lid.
It is clear that informa tion about sub-annua l cha racteristics of the 8(z) curve is rapidly lost by firn diffusion in centra l Greenland. We suggest there is litt le point in measuring a nnua l properti es o f the 8- depth reco rd such as annua l mean minus median, in a n attempt to lea rn about past changes in the seasona l timing of prec ip ita ti on. Similarl y, examining shapes ofannua I 8(z) cunTS w ill teac h us nothing abo ut the nature of individual years. Instead, they will refl ec t the va ri ability o r neighboring an nua l cycles in the reco rd , because diffusion homogeni ze. t he record on a leng th scale comparable to the half-annu a l thickness after onl y seve ra l decades. To sce thi s, we plot the rati o of di ffusi\ ·e-I e ng th scale (see sect ion on "Calcula ting di ffusion" ) to annua l laye r thickness fo r \·ar ious buria l t imes (Fig. 12; a lso seeJ ohnsen, 1977, p. 213).
If) If) Q)
c: ~ 0.8 .s:: ... '" ~ 0.6 c: <l: ::c ... g> 0.4 Q)
c: Q If)
; 0.2 o
, , , , , , , , , , , , , I
, , , ,
, , , ,
, , , , ,
, ,
/////
---
O~-----,------.-----.-----.-----~ o 50 100 150 200 250
Time of burial (years)
Fig. 12. T he diffusive averaging length (4vc;*t) normalized to the th ickness qf an annual taye}; as afllnction of Lime of bll rial.
Contra ry to this di sm a l situati on for sub-a nnual reconso·uctions, there is some hop e for recove ring useful in fo rmati on about seasonal amplitudes. Howe\'C r, one important implicati on of the a\·e rag ing length in Fig ure 12 is tha t changes in amplitudes from year-to-year a rc meaningless withou t a back-diffusion calcul ati on, e\·e n in the absence of seasona l precipitation bias. In addition, there is unfortunately still some uncerta inty in the absolute va lues for reconstructed seasonal amplitudes res ulting from uncerta inty in the pa ra meters p* and T Thi s is because changes in seasona l ampl itude at the time of deposition, esp ecia ll y in recent decades, could be affecting our optimizati on of these values at GISP2. \,Vhile we are encouraged by the success 0 [" these va lues in predicting cumul a tive amplitude decay at severa l other sites, better constra int would be valuable. H owever, if onc considers only the reco rd from below the depth eon-es-
281
J ournal rifGlaciology
ponding to p*, then relative amplitudes a re retri evable to within a modcst error. If onc can find independent cvidenee showing that snowfa ll has been reasonably uniform throughout each year, so j , < 0.65 or so, then this error is a round 10 % or less (Fig. 9). If j~ has been va riabl e, but the a" erage f , < 0.6 or so, the average error in reconstructed amplitudes is a lso a round 10 % but the error for individua l years m ay be la rge (sce Figs II a nd 9). For the la rger mean f s "alues, crrors ""ill be much g reater (Fig. 9). Thus, without independent information or theoretical considerations that constra in or limit f" amplitude reconstructions will be tenuous. Note that isotopic data on seasonality of prec ipitation suggest there is currently significat1l snowfa ll throughout the year a t GISP2 (Shum a n a nd others, 1995). Howe" er, compari son with temperature records sugges ts that this has not a lways been the case (Steig and others, 1994; l:;awce tt and othe rs, 1997). Also, other geochcmical d a ta suggest that GISP2 snowfa ll has a significant winter defi cit Uaffrczo and others, 1994; Dibb, 1996) as do model-based estimates (Bromwich and others, 1993).
A reconstructed isotope hi story may sti 11 be of interest, though. A sizeable (g reater than 10 % ) cha nge in mean reconstructed amplitude indicates some cha nge in the annual clim ate; either the shape of the annual 8 curve has changed considerabl y or the seasona l amplitude has changed, or both. Also note that, beca use diffusion rate is sensiti" e to tempera ture, spurious cha nges in reconstructed amplitude can res ulL from changes in the temperature structure of the Grn. r\ proper undiffusio n calculati on should invoh'e acc urate heat-now modeling, a nd poss ibly even changes in the density structure. Depending on the leng th of record of interes t, diffusion in the so lid ice should a lso be included Oohnsen, 1977).
11.4. R ecovery at oth er locations
Tt is poss ible that sub-annua l cha racteristi cs of 8 records in locations other than centra l Greenl and will survive Grn diffusion. To good approx ima tio n, onc can transform our synthetic results to other locations with less diffusion as follows. The ex tent of diffusion, and hence the results in Figure 11 , a re a functi on only of O'.*t / L~. The loss of information at some new locati on l after a time of burial tt will be equal to the loss of information a t GISP2 after te years of burial if
(17)
where T is the mean annua l temperature. It is most convenient to sepa rate the iso topic diffusivity into a temperatureand pressure-dependent coeffi cient and a density-dependet1l part 0'. = O'.°(T. Pa)(PP* - p2) . To calculate 0'.* using Equa tion (9), we approxim ate the depth- density profile for p ::; p* as
(18)
where the depth sca le is g ivcn by p((* ) = p*. SeLLing the consta nt C = 0.25 reproduces the GISP2 density profil e quite well. The corresponding depth- age scale is found by integ ra ting p(()(pJj)- I. These approximations for density and depth- age can be used to eva luate 0'.* using Equation
282
(9). In doing so, we also neglect the Ci, and use c = 0.25, which gives the sca ling relation
For locations with t [ > l e, diffusion of the seasonal cycle is slower than a t GISP2; it takes t l yea rs to achieve the same total smoothing that is achi eved a t GISP2 in te years. Equation (19) has no a lgebraic solutio n but it is easily soh'ed numerica ll y. The solution depends strongly on the mean annual temperature and the a ccumulation ra te, and onl y very weakl y on the depth of the firn column. For example, at Dye 3, which has a higher a cc umulation rate (0.55 m a I) and higher m ean temperature (-20°C) than GISP2, diffusion of the a nnua l signal occurs m ore slowly tha n at GISP2, because the hig h accumulation rate domin a tes. Soh'ing Equation (19) for t at D ye 3 a nd using the result to stretch the axis in Figure II shows that, in cot1lras t to GISP2, some sub-annual information survives firn diffusion a t D ye 3 (Fig. 13). Reconstructions a re poss ibly useful. Note, however, that melt occurs on the warmes t days of summer at Dye 3 (Herron and o thers, 1981). This melt does not penetrate deeply, so the dry-fim diffusion theory is al so applicable here below the topmost meter. The denser layers produced by re freeze of the melt will hinder diffusion to some ex tent, probably reducing the efTective va lue for p*, and streng thening our conclusion that reconstructions can be m ade accurately there. The melt should be explicitly considered in the interpretation of the reconstructed record, thoug h. An excellent site for sea sonal reconstruc tions in Anta rctica is Law Dome (Morgan and van Ommen, 1997). Here, the diffusion length at th e firn base is approx imately 0.08 m (Fig. 6; temperature and accumulation ra te a t Law Dome a re approximately - 21°C a nd 0.7 m a I, resp ectively), a m ere 11 % of the annual layer thickness.
Examples of the coeffi cients in Equati on (19) have been g iven in Tabl e I, together with equivalent times t l corres-
.... c Q) .... c 0 u c 0 .;:; co E ... 0
'+-C
1 .. ~~~~~_~ ____ __ _______________ _
+. '. ~ ~~- () -- -() ---0- - -- - - - -~
0.8 -
0.6
0.4
0.2-
0-
o
. "- ---_._._ ._---_ ._._.- - _._._.-
+
+.
50
I~ GISP2 -0-
I f GISP2 + ·-I~ DYE 3 If DYE 3
.+-+ .+_ .... -+ . __ . +- ..... -- -_ .. -+
I I
100 150 200
Time of burial (years)
250
Fig. 13. Estimated comjJarison rif diJJusional inform ation loss at Dye 3, southern Greenland, and GISP2, central Greenland.
ponding to 15 and 50 years of burial a t GISP2. Very dry and cold sites like Vostok lose information rapidly due to th e sma ll acc umulation ra te. Siple Dome is a n example of the worst possible location, one with a high temperature but relatively low acc umul a tio n rate. Of course, the high-acc umulati on sites in southern Greenland and on the Antarctic Peninsul a have the b est preservation. H owever, the presence of surface melt a t such sites changes the interpreta tion of the reconstructed records. \ Ve suggest tha t to atta i n seasonal reco rds that have been neither significantl y influcnccd by melt nor corrupted irrecoverabl y by diffusion, a se t of ice cores should be drill ed a t loca tions where the accumulation is as high as possible but the melt negligibl e. In Greenla nd, such a location wo uld exist somewhere on the ice divide between GISP2 and Dye 3. In Anta rctica, such location s may ex ist on loca l dom es close to the coas t.
CONCLUSION
The Whill ans and G roo tes (1985) theo ry for isotope diffusion in firn makes gcner a lly acc urate predicti ons in central Greenl a nd , demonstra ting that diffusiona l vapor flux through firn pore sp aces and the consequent smoothing of isotopic profil es is reasonably well understood. Centra l Greenl and data suggest , but do not prove, that the diffusivity o f wa ter vapor in firn a ir is acc uratel y predicted by the rcl a tions used by \ Vhilla ns and Grootes, if onc acco unts for the increase of diffusiv ity at high a ltitude, and tha t the blocking effect of the so lid matri x can be described by using an effecti ve pore-i sola tion density of p* = 730 kg m 3 Compari son of model predictions with limited d ata from southern Green land, thc Anta rctic Peninsula a nd the South Po le lend further credence to the "apor-flu x diffusion model a nd our minor modifica ti o ns to it.
lVleaningful reconstructi ons of the shapcs of annual isotopc cycles at GISP2 a r e not poss iblc but m ay be possible a t locations with substanti a lly higher acc umul ati on rates (e.g. D ye 3 in G ree nland a nd L aw Dome in Anta rctica ). Consequentl y, we will not be a bl e to infer a hi story of prec ipita tion seasona lity at GISP2 using 8180 records a lone. Reconstructi ons of seasonal amplitude a re accura te to within a bout 10%, if there is littl e seasonal bias in the isotope reco rd. However, without indep e ndent informa tion about seasona l bias, onc should not inte rpret changes in reconstructed a mplitudes as changes in seasona l amplitude a t thc time of depos ition but rat her as a change in seasonal climate of uncerta in nature. To recover seasona I isotopic reco rd s, ice cores should be drill ed fo r thi s purpose a t locati ons with as high a n acc umulati on ra te as poss ible without thcre being significant melt.
ACKNOWLEDGEMENTS
Wc th a nk lVL Stui" er a nd P. Grootes fo r making availa bl e iso topic data from GISP2, and S. J ohnsen and an anonymous revi cwcr for helpful comments. 'Vc a lso thank P. L omba rd for valuable input, a nd R. Alley, B. H a llet, D. MOl-se, C. R ay m ond and E. \Va ddington for constructi ve criticism s, and P. Grootes fo r reading an ea rlier version of thi s pa per. This pap er is based, in p a rt, on work done under a U.S. Nati ona l Science Founda ti o n Gradu ate R esea rch Fellowship to K. G ( 1 992~94) .
CuJfey and Steig: Isotopic diffusion in polmjirn
REFERENCES
All ey, R. B. a nd B. R. Koc i. 1990. R ece nt warmi ng in cent ra l G reenl and? Alln. Glaciol. , 14,6 8.
Arista ra in. A.J. , J. J ouzel and :\1. Po urchc l. 1986. Past AntarCl ic Pen insu la climate (1850- 1980) deduced fro m a n ice core iso tope record. Clill/olir Change, 8 (1), 69 89.
Bari ow, L. K . and 8 olhas. 1997. Interdi scip linary ill\'estigati o ns oflhe cnd of the Norse wcs tern se ttl ement in G reenl and. /lolorelle, 7 (4). +89- +99.
Bolza n, j. F. a nd 1\1. Strobe\. 1994. Acc umulati on-ra te " a ri ations a round SUlll mit. G reenl a nd.] Glariol., 40 (134), 56- 66.
BO\,', W. A. 1982. Iso topic d iffus ion in po lar ri rn. (:\1. Sc. thes is, O hi o State
Uni \'crs it y.) Bromwich, D. H ., F. \\. Robasky, R . A. Keen and J. F Bolza n. 1993.
\Iodeled va ri ations of prec ip itatio n over the Green land ice sheet.] Cli male, 6 (7),1253 1268.
C larkc, G. K. C., D. A. fi sher a nd E. D., Vadd ington. 1987. Wi nd pumping: a potenti a ll y significa nt heat source in ice sheets. IlIterllaliollal ,. fssoriolioll of ~)'drologiral SriellteS Publicalioll 170 (Symposium a t \fa ncou"er 1987 The Ph)'Sical Basis of Ice Sheel ,IIodelling ), 169-180.
Col beck, S. C. 1993. T he "apor di fTusion coeflic ielll fo r snow. 'I aler Resour. Res., 29 (1), 109 11.1.
Cuffcy, K . M. , R . B. All ey, P. 1\1. G rooles, J. 1\1. Bolza n and S. A nandakr ishna n. 1994. Ca libra ti on of the 1"0 isotopic pa\rol hcrmomc ter for cent ra l Green la nd , using borehole tem peratures.] Glacial., 40 (135), 3+1 349.
C uffey. K. M ., G. D. Claw, R. B. A ll ey, :\1. Sluive r, E. D. Wa dd inglon a nd R. \I '. Sa ltus. 1995. Large Arct ic tempe rat ure change a t t he Wiscons in Holoeene g lac ia l tra nsition. Srieuce, 270 (5235), +55+58.
Dansgaard , W. 1964. Stable isotopes in p recipitat ion. Tellus, 16 (+), +36 +68.
Dibb, j. E . 1996. O verv iew or fi e ld d a ta 0 11 the deposit io n o r aerosol-assoc iated spec ies to the surface snow of po lar glac iers, pa rticu larly rcccnl work in G recnl a lld. III \\'o lff, E . \\ '. and R. C. Bales. eds. Chemiral C\rhange belwemlhe almos/)herealld jlolar SIlOll '. Be rl in, etc.. Sp ringcr-Ve rlag, 249-27+. (NATO ASr Seri es I: Globa l E m 'irolllncntal C ha nge +3.)
Fawce ll . P..J. . ;\ . 1\1. Agllstsd6ttir. R . B. Alley and C. A. Shum an. 1997. Thc )hu nger Dryas term ination a nd North Atlalll ic deep water fo rm at ion: insights from c1i malc model simul a ti o ns a nd G reenl and ice core data. Paleole{[lIograjlhl'. 12 (1 ),23- 28.
Fi sher. D. A . and R. I\1. Koerner. 1988. T he rlrcns of wind on 8!1"0 ) and accu lll ulat io n g ive an in ferred record or seasona l b anlplitudl'" from the A?;ass iz Ice Cap, Ell esmere Isla nd, Canada. Anll. Glaciol., 10.3,1·-37.
Fi sher. D. A . . R . 1\1. Koerner, \\'. S. B. Palcrson, \\". Dansgaa rd, 1\. Gu ndestrllp a nd N. Rech. 1983. EfrcCl of w ind scouring o n c limat ic records ri'om ice-core oxyge n-isotopc profi les .. \(illlre, 301 (5897). 205 209.
Ge iger. G . H . and D. R. Poircr. 1973. 7/'{[ us/lorl /Ihfllolllena ill 1Il,lalhllg)'. Read ing. 1\1A. Add ison-\\'es ley.
Habe rm an, R. 1987. Elemelllal)' a/,/)/ied /wrlial dijfirmlial eqllaliolls 1£ 'ilh FOllrier Jeries alld bOlllld{//~l' I'a llle /Imblelll s. Serond edilioll . Engclwood C lifE, 1\.J. Premiec-Ha ll.
HammLT. C. u., H . B. C lauscn, \\'. Dansgaa rcl, N. Gu ndest ru p. S. j.Johnsen and N. R ceh. 1978. Dat ing of G reenland ice cores by 1I0w Ill odels. isotopes, " olcanic debris, and co nti ne nta l dust. ] Glacial .. 20 (82),3-26.
Herro n. :\1. \1. and C. C. Langway.J r. 1980. Fim c1e nsilicalion: an empir ical moc!t· \. ] Glariol.. 25 (93), 373 385.
Herron. :\1. I\I.. S. L. Hen'on and C. C. La ngway. J r. 1981. C li ma tic signal of ice mel t fea tures in so uth ern G ree nl a nd . . \ alllre, 293 (5831), 389 391.
J affrczo, j. -L. . C. I. Da"idson, !\1. L e-grand andJ E. Dibb. 199+. Sulfate and :'II S1\ in t he a ir and snow on the Greenl and ice shec l. ] Geojll!),s. RCJ., 99 (0 11, 12+1 1253.
J oh nse n. S. J. 1977. Stable isotope ho m ogeni zation of po lar fi rn an d ice. IlIlernalional Assorialiou o/ f-i)'drologiwl Sriellce.\ Publiwlioll 118 (Sympos ium at G rcnoble 1975 - Isolo/les alld Imjlurilies ill SIIOU' (llld Ire ). 210 219.
J ohnscn, S . .J. a nd G. de Q Robin. 1983. Di ffusion of stable isotopes. III Robin , G. dc Q, er!. The riimalic record ill /)olar ice sheel.\. Camhridge. Cambridge Uni" ers ity Press, 57~63.
J ohnscn, S.J , D. Dah l ~J e n scn , W. D a nsgaa rd and N. S. G un dcs trup. 1995. Creen la nd paleo tempera tures de ri" cd ri'om G RIP boreho le temperatu re a ncl icc core is()lopc pro fil es. TeIlID. 47B (5). G2+- 629.
.Jouzcl..J. , L. 1\lerli , ·al. j. R. Pet it and C. Lori us.1983. C li ma tic in lormat ion O\'c r the las t cent un ' deduced from a dera il ed isotopic record in th e
Sout h Po lc- snow. J. Gco/II!)'5. Res., 88 (C+), 2693 2703. Kui, ·inl"l'l. K . c., :\1. P. Lawson, C. 1\1. Rowe and H. B. C la usen. 1996. Sea
sona l oxygen isotope records rro m G reenl and ice co res as c1 imatologica l ind icato rs. !' Comparison wit h coasta l temperatures. [Abstracl.[ EOS. 77 (+6), EI II .'-lee ting Supplement, F1 82.
1\ lcese. D. A. (llId 8 olhers. 199+. Preli mina ry de pth-age scak of the G ISP2 ice
core. CRREL SjJeC. Re/I. 9+-1. 1\ rorgan, v. a nd T D. \'an Om m c n. 1997. Seasona lit )" in Late Holocene
cl imate from ice core reco rds. Holocelle, 7(3), 351 - 354·.
283
Journal rifGlaciology
Peel , D. A., R. 1\lukaney and B. :--1. Om·ison. 1988. Stable-isotope/a ir-temperature relationshi ps in ice co res from D olleman Island and the Pa lmer Land plateau. Antarctic Peninsula. Alln. Glaciol., 10, 130- 136.
Press. \.'1/. H ., S. A. Teukolsky, \ V. T. Vetterli ng and B. P Flannery. 1992. lvillnerical recipes ill FORTRAA' Ihe arl '!I scienlific com/JlIling. Second edition. Cambridge, Cambridge universi ty Press.
Pringle. H. 1997. Death in Norse Greenland. Science, 275 (5302),92+-926. Reif, F. 1967. Slatistiral jJh)'Sics. New York, 1\IcG raw Hill . (Berkeley Phys ics
Course 5.) Rowe, C.1\1., K. C. Kuivinen, D.j. Bathke and H. B. C lausen. 1996. Seaso
na l oxygen isotope records li'om Grcenland ice cores as climatologica l indicators. 2. Comparison with atmospheric ci rcu lation. [AbstracLI £OS, 77 (46), Fall Meeting Supplement, F182.
Schwander, ]. . B. Stauffer and A. Sigg. 1988. Air mixing in Gm ancl the age of the air at pore close-off. Ann. Glaciol .. 10, 141 - [.1.5.
Shuman, C. A., R. B. Alley, S. Anandakrishnan. j. W. C. White, P 1\1. Grootes and C. R. Stearns. 1995. Temperature a nd acc umulation at the G reenl and Summit: compari son of high-reso lution isotope profiles and satel lite passive microwave brightness temperature trends. ] Geo/lhys. Res., 100(0 5),9165-9177.
Shuman, C. A. , 1\1. A. Fahnestock, R. A. Bindschadlcr, R . B. Alley a nd C. R . Steams. 1996. Composite temperature record from the Greenland Summit, 1987- 1994: synthesis o[ mu ltiple automatic weather station records and SSl\ lfI brightness temperatures. J Climate, 9(6), 1421-1428.
SOlVers, T., M. Bender, O. R aynaud and Ye. S. Korotkevich. 1992. olsN ofN1
in air trapped in polar ice: a tracer of gas transporl in the urn and a
poss ible cons traint on ice age- gas age differences. J. Geophp. Res.,
97 (01+), 15,683-15,697.
Stearns, C. R . 1997. Automatic weather station data from central Greenland. In The Greenland Summ£i ice cores. Boulder, CO, Uniwrsity of Boulder. National Sno\\' and Ice Data Cemer; National Geophysica l Data Center. World Data Celller A for Palcoclimatology, CD-ROM.
Stearns, C. R . a nd G. A. Weidner. 1991. T he polar automatic weather station proj ect of the Uni"ersity of Wisconsin. /11 Weller, G .. C. L. Wilson and B. A. B. Severi n, eds. !lIlematiol/al COl/ferel/CP Oil the Role iflhe Polar Regiol/s ill Global Challge: /JrO(eedillgs '!la I'On.ferel/(f held]lIlIe 11-/5,1990 allhe el/iomil)' oJAlaska Fairbal/ k.r. Tal. !. Fairbanks. AK, Un iversity of Alaska. Geophysica l Institute/Celller for G lobal C hange and Arctic System Research, 58- 62.
Steig, E. ]. , P 1\1. Grootes and 1\1. Stuiver. 1995. Seasonal precipitation timing and ice core record s. Sciellet, 266, 1885- 1886.
Sluivcr, 1\1. . PM. Grootes and T. F. Braziunas. 1995. The GISP2 0180 climate record of the past 16,500 yea rs and the role of the Sun, ocean and volca noes. QJlal. Res .. 44 (3), 341-354.
Van Ommcl1, T. D. and V. MOI·gan. 1997. Ca libra ting the ice core pa leo thermomctcr using seasonality. ] Geoph)'S. Res .. 102 (0 8), 9351-9357.
Whillans, 1. 1\1. and P. 1\1. Grootes. 1985. Isotopic diffusion in cold snow and Grn. J. Geopl!ys. Res.. 90 (02). 3910-3918.
Wh ite, D. E., J. Vv. C. Whi te, E.]. Steig and L. K. Barlow. In press. Reconstructing an nua l and seasonal d inlatic responses fro III \·olcanic events since A. D. 1270 as recorded in the deuterium signa l of the GISP2 ice core. ] Geoph)'S. Res.
}\lIS received 27 iV/ay 1997 and accepted in revisedJorm 16 December 1997
284