Embed Size (px)
Citation preview

1
Isomerization rates and mechanisms for the 38-atom Lennard-Jones cluster determined using molecular dynamics and temperature accelerated molecular dynamics
J.C. Hamilton Sandia National Laboratories, Livermore, California 94551
Donald J. Siegel Mechanical Engineering Department, University of Michigan, Ann Arbor, Michigan 48109
B.P. Uberuaga and A.F. Voter Los Alamos National Laboratory, Los Alamos, New Mexico 87545
We have simulated the isomerization of 38-atom Lennard-Jones clusters (LJ38) – a well-known prototype system for global-optimization and energy landscape analyses – over a wide range of temperatures using a combination of molecular dynamics (MD) and temperature accelerated dynamics (TAD). At high temperatures, we find that (surprisingly) MD with steepest descent quenches (MDSDQ) is effective for finding the global minimum of LJ38 as well as for determining the isomerization rates between the stable fcc isomer and the group of metastable icosahedral isomers. Importantly, the MDSDQ-determined isomerization rate was found to be approximately seven times greater than in previous studies based on discrete path sampling (DPS). The long simulation times enabled by TAD allows for the determination of isomerization rates at low temperatures, and reveals that isomerization proceeds primarily via processes with relatively low activation barriers. Using TAD we have found a new LJ38 isomerization pathway with a smaller activation barrier than any pathway published previously. In addition, we have determined that correlated events play an important role in the accurate determination of isomerization rates. We conclude that the slower rates observed by DPS are due to the omission of correlated events and some low energy pathways.

2
I. INTRODUCTION
Predicting the lowest energy state for a given collection of atoms is a long-standing challenge that spans the fields of condensed matter physics, chemistry, materials science, and molecular biology.1 The difficulty of this global optimization problem varies dramatically depending on the details of the atomic system. Lennard-Jones clusters represent a prototypical system and have been studied in great detail.2 For most small clusters, the lowest energy states are based on Mackay icosahedra and are easy to find. However for a few cluster sizes, it is much more difficult to find the lowest energy state due the complicated nature of the energy landscape. The 38-atom Lennard-Jones cluster (LJ38) is of particular interest, because it is simple to describe yet represents a challenging global optimization problem. It is thus an excellent test case for the study of energy landscapes. LJ38 can adopt two different types of low-energy structures, as shown in Fig. 1. The lowest energy state is an fcc crystal in the form of a regular truncated octahedron. Somewhat higher in energy there are a large number of states based on a 5-fold icosahedral structure. Because fcc and icosahedral states involve radically different crystal structures, it is difficult to make the transition from one to the other. The transformation of the crystal structure requires that the cluster pass through liquid-like states. Except at very low temperatures, the free energy of the ensemble of icosahedral states is lower than the free energy of the fcc states. This makes it difficult to find the global minimum using simulated-annealing and many other global optimization methods. While finding the lowest energy state for LJ38 is challenging, finding isomerization rates and mechanisms for transformations between the fcc and icosahedral states is even more difficult. To determine isomerization rates, it is typically necessary to consider a large amount of information regarding low-lying metastable states and the transition states connecting these metastable states to form pathways from fcc to icosahedral states. To date, isomerization rates and pathways for LJ38 have been determined using a master equation (ME) approach3 and using discrete path sampling (DPS).4 This problem has been studied in detail by David Wales who has performed extensive studies of the transition rates and isomerization mechanisms of LJ clusters, summarized in his book on the subject of energy landscapes.5 In this paper we take an alternative, dynamical approach to this problem. We study the LJ38 cluster using high-temperature molecular dynamics with steepest-descent quenches (MDSDQ), and in addition employ temperature accelerated dynamics (TAD) simulations at low temperatures.6 We find that MDSDQ is effective for finding the fcc global minimum. Calculating the isomerization rates using MDSDQ, we find they are more than 5 times faster than those previously reported using ME or DPS. TAD simulations are in fairly good agreement with the MDSDQ results thereby offering a way to extend the fcc-to-icosahedral isomerization rate calculations to much lower temperatures. (We will discuss the origin of the small rate differences between TAD and MDSDQ at the end of this paper.) Importantly, we find that TAD is an excellent method for finding low energy pathways for isomerization. Indeed, TAD reveals a previously unknown lowest energy path for conversion between the LJ38 fcc and icosahedral structures. This reaction path plays an important role in determining the transition rate at low temperatures.

3
II. COMPUTATIONAL METHODS AND DETAILS
The potential energy for Lennard-Jones clusters is given by
∑<
σ−
σε=
ji
6
ij
12
ij rr4E .
The bond strength is determined by ε, and the equilibrium separation is determined by σ. As is customary, we employ reduced units; i.e. ε = σ = 1. In these units, temperature is expressed in units of kBT/ε and time in units of εσ2m where m is the atomic mass. In both the MDSDQ simulations and the TAD simulations, the cluster was free to rotate and translate. We did not find it necessary to apply any constraining potential, as has been imposed in some parallel-tempering studies to prevent cluster dissociation at high temperatures.7 For the MDSDQ, a standard molecular dynamics simulation was run at constant temperature using a Langevin thermostat with a time step of 0.00650 (units εσ2m )
and a friction coefficient of 0.0308 (units
€
ε mσ2 ). At regular time intervals of 6.5 x
104 (units εσ2m ), the trajectory was interrupted and the configuration was quenched using a steepest-descent algorithm. This approach was originally proposed for mapping the energy landscape of liquids.8 The technique has previously been employed to find minimum energy configurations of Si clusters.9 Other, more recent, papers describe optimization using similar combinations of annealing and quenching.10 We were somewhat surprised (and pleased) to find that MDSDQ could reliably find the global optimum for LJ38, typically considered a difficult global optimization problem. Molecular dynamics simulations are limited to relatively short lengths of time. We used MDSDQ to directly determine isomerization rates at temperatures kBT/ε ≥ 0.132, as discussed in the next section. To access lower temperatures (slower rates), we used temperature accelerated dynamics (TAD).6 In this approach, thermostated molecular dynamics is performed at a relatively high temperature, Thigh, while the dynamical evolution of the system is monitored for transitions out of the initial state. Each time the system escapes from the starting basin, the saddle point for that escape pathway is found using the nudged elastic band (NEB) method.11,12,13 Knowing the energy of this saddle point, the high-temperature escape time is extrapolated to give a corresponding low-temperature escape time - i.e. the time at which this particular escape would have occurred in a corresponding hypothetical simulation at the desired low temperature (Tlow). This extrapolation assumes that rate constants in the system are accurately approximated by harmonic transition state theory. The system is then placed back into the starting basin, rethermalized, and the high-temperature dynamics are continued. In this way, a list of low-temperature escape times is generated. It can be shown6 that there is a time (the "stop time") at which the high-temperature trajectory can be terminated, knowing,

4
with a desired confidence, that the shortest-time event in the list is the actual escape that would have occurred first in the real dynamics at Tlow. The system is then moved to the state corresponding to this first event at Tlow, and the TAD procedure is begun again in the new state. It is important to note that this chosen first event at Tlow is not simply the lowest-barrier pathway; rather it is the one that would have occurred first in this particular realization of the dynamics. The other important point is that, in this TAD procedure, there is no need to discover all the pathways for escape from the basin. Typically, only a small number of escapes are observed at Thigh before the stop time is reached. The stop time is a function of Thigh, Tlow, the time of the current shortest-time event at Tlow, the desired uncertainty level (δ), and a pre-specified, assumed lower bound on the pre-exponential factors in the system (νmin). In this study, we used Thigh = 0.163 (units kBT/ε), δ = 0.01 (i.e., 99% confidence level), and νmin = 16.24 (units
€
ε mσ2 ). Transitions were detected by interrupting the trajectory regularly (much the same as in MDSDQ) and performing a minimization. A transition was declared if any bond length changed by more than 0.176 (units σ). In this work, we also made three additional assumptions/approximations to improve the computational efficiency of the TAD simulations. The first assumption involved the identification of symmetry-equivalent states (including states with permutations of the atom numbering) visited during the simulation. By combining information obtained during repeated visits to each set of symmetry-equivalent states significant computational speedup was obtained. As more time is spent in a set of symmetry-equivalent states through repeated visits, the average stop time for accepting a transition out of those states is reduced. In order to quickly identify symmetry-equivalent states we first calculated the potential energy. If two states varied in energy by less than 0.00079 (units ε) we proceeded to check the sum of all the distances between atom pairs, providing an additional test for symmetry equivalence. A consequence of utilizing this symmetry equivalence is that during post-processing, a direct playback of the sequence of states visited in the TAD run will contain some transitions that are not physically correct, because the actual transition was to a symmetry-transformed version of the state. To generate the detailed minimum energy paths shown in Figs. 5 and 6, we had to first transform each minimum and saddle along the path to the correct symmetry equivalent form before applying the nudged elastic band method. Our second approximation was to ignore all transitions with small reverse barriers, <0.29 (units ε), by returning them to the starting state as non-transitions. (The reverse barrier is defined as the energy barrier to return from the final state to the initial state.) In rough terms, this has the effect of lumping states connected by very small barriers into a superstate or superbasin, introducing an approximation that we believe is inconsequential for this system. Although these particular low barriers are ignored in the rate determination by TAD, they are revealed by NEB calculations linking the states visited by TAD. As we will see in Fig. 6, the barriers for these neglected saddle points are typically much smaller than the barriers for the accepted transitions. Our third assumption was to pre-specify the minimum barrier for transitions out of the fcc minimum (ignoring those with low reverse barriers) to be 3.429 (units ε). As described elsewhere [13] knowledge of the minimum barrier for escape from a state allows the TAD procedure to reach its stop time, and accept an event, more quickly. The

5
higher this minimum barrier is, the greater the speedup relative to regular TAD. In this case, the minimum barrier was postulated based on the behavior of the first few simulations, which showed a high barrier for escape from the fcc minimum. Later, we used the cumulative total high-temperature time in this state from all of our TAD runs with Thigh=0.163, along with some additional runs at Thigh=0.188, to verify that this minimum-barrier assumption was valid -- i.e., we verified that, with 1% uncertainty, the minimum barrier for escape from the fcc state was at least 3.429 (units ε), assuming the lowest prefactor in the system was no lower than νmin = 16.24 (units
€
ε mσ2 ). We did not use a pre-specified minimum barrier for any other states in the system. This “gambling” approach, in which the TAD runs are validated after the fact, was first used in a study of shuffling events on fcc(100) metal surfaces.14 In both the MDSDQ and the TAD simulations, we needed criteria for determining when the trajectory had made a complete transition from the fcc state to the icosahedral superbasin and vice versa. An fcc-to-icosahedral transition was declared when, after starting in the fcc state with E=0.0, the system first arrived in a state with E=0.793 (units ε). These same energies were used to define the reverse transition in an analogous way. Using the above implementation of TAD, we were able to determine isomerization rates from the fcc to the icosahedral configuration of LJ38 at temperatures as low as kBT/ε = 0.075. We also found TAD to be an excellent tool to find the fast pathways for isomerization at low temperatures. Since TAD determines the basins visited and the transition states joining them, it provides a map of the basins’ state-to-state pathway followed during isomerization. III. GLOBAL OPTIMIZATION AND ISOMERIZATION RATES
Figure 2 shows a plot of the energies for basins found during a typical MDSDQ run at kBT/ε = 0.138. At this temperature the configurations were stored and quenched at time intervals of 6.5x10⁴. The zero of energy has been chosen as the energy of the global minimum (fcc) cluster. As described in Ref. 15, the points at E < 0.67 are fcc states, the points at 0.67 < E < 2.33 are icosahedral states, and states at E > 2.33 are liquid-like states. Thus the points at zero energy represent the fcc global minimum and the other points represent states with icosahedral or liquid-like structures. During this run the system is seen to move back and forth between the two funnels several times. At this temperature, it is thus clear that it would be straightforward to start the system in an icosahedral state and find the fcc global minimum. We estimate that the mean CPU run time to find the fcc global minimum (starting from an icosahedral state at temperature kBT/ε = 0.163) is ~100 minutes using a single 2 GHz G5 PowerPC processor. Given enough runs, similar to the MDSDQ run shown in Fig. 2, it is possible to determine the mean time required for the cluster to escape from the fcc funnel to icosahedral funnel, and the mean time to return. Since these times follow Poisson statistics, we can easily determine the probable error associated with the measurement. We have performed such runs as a function of temperature in order to obtain the escape and return rates. The results are shown as an Arrhenius plot in Fig. 3. Here the error bars represent plus or

6
minus one standard deviation. The values plotted for the discrete path sampling technique are digitized from Fig. 6 of Ref. 3. From Fig. 3, it is obvious that our MDSDQ rates are somewhat larger than the previously published DPS rates. Over the range of temperatures covered by MDSDQ, the rate for escape from the fcc funnel is about 7 times faster than predicted by DPS, whereas the rate for return from the icosahedral funnel varies from 7 to 11 times faster than predicted by DPS. Indeed, our ability to find the global minimum and determine isomerization rates using MDSDQ is due in part to the isomerization rates being in reality larger than previously calculated. In order to understand these effects we turn now to a discussion of the temperature accelerated dynamics (TAD) runs. IV. TRANSITION RATES AT LOW TEMPERATURES
As described above, TAD allows much longer simulation times at low temperatures than does ordinary molecular dynamics. To determine the fcc-to-icosahedral isomerization rates using TAD, we started a number of simulations (typically on the order of 100 runs at each temperature) in the fcc minimum. Each simulation was continued until it reached a state with an energy characteristic of the icosahedral state, as described in Section II, or until it reached a predetermined number of transitions or CPU time without showing a transition to the icosahedral state. The rate constant was then computed as the number of successful events divided by the total TAD time of all the trajectories. At the lowest temperature (kBT/ε =0.075), the typical boost factor (computational speedup relative to direct molecular dynamics) was approximately 1010. The boost factor is high when the typical barriers are high and increases as the temperature (Tlow) is lowered. Although the boost factor is even greater at temperatures lower than kBT/ε =0.075, the overall rate of isomerization (measured in wall-clock time or CPU time) slows down to the point where it is difficult to determine a rate constant. We also note that because the typical barriers are lower in the icosahedral and liquid-like super basins, we did not obtain boost factors nearly so large for the reverse process. In fact, while we observed a few icosahedral-to-fcc transitions in the TAD runs, they were infrequent enough that we made no attempt to determine a statistically meaningful reverse rate constant using TAD. Figure 4 shows an Arrhenius rate plot for the whole temperature range simulated using MDSDQ and TAD. The rates determined by both methods are nearly in agreement and have been fit by a single straight line on the Arrhenius plot. (We discuss the reason for a slight discrepancy between the MDSDQ and TAD rates in section VI). The error bars shown represent a single standard deviation for a Poisson distribution. Using TAD, we are able to simulate the fcc-to-icosahedral isomerization rate over a doubling of the temperature and ~15 orders of magnitude in the rate. The slope of the Arrhenius line corresponds to an activation energy of 4.35, in reasonable agreement with the barrier heights described below and shown in figures 5, 6, and 7. A remaining issue is the difference in rates between the present molecular dynamics simulations and methods such as discrete path simulation (DPS)4 which enumerate all relevant metastable states and activation energies between these states, and then use master equation3 dynamics to predict isomerization rates. As shown in Fig. 4, our

7
molecular dynamics simulations show escape rates between 6 and 7.5 times faster than previous discrete path sampling determinations over the temperature range for which DPS results have been published. We also found that escape rates determined from MDSDQ runs were approximately 2 times faster than the escape rates from the TAD runs reported. As we discuss in the next two sections, there are two reasons for the rate discrepancies between DPS, TAD, and MDSDQ. One reason (see Sec. V) can be traced to the difficulties associated with calculating all of the lowest energy isomerization reaction pathways. The second (see Sec. VI) pertains to a broader issue, the issue of correlated events that are not included in transition rate theory. V. ISOMERIZATION REACTION PATHWAYS During a TAD simulation, for every detected transition, the initial and final states are tabulated and the activation energy is calculated using the nudged elastic band method. Thus, once a TAD simulation completes the escape from the fcc state into an icosahedral state, the event list includes all the saddles and minima along the fcc-icosahedral reaction path. Figures 5 and 6 show examples of such paths. The paths we display have been modified (making them "reduced paths") by deleting all path segments in which the system starts in a given state, makes a number of transitions, and then returns to the same given state before continuing. These segments are deleted because it is not necessary that they be traversed to allow the escape from the fcc state to the icosahedral superbasin. We are interested in low temperature escape paths, so we look for paths with the "lowest highest barrier". Figure 5 plots one complete path from the fcc state to an icosahedral state. This particular run was selected because it shows isomerization by a path having the "lowest highest barrier" found using TAD. This path has a lower highest barrier (at 4.219 energy units) than any path previously described in the literature.3 Fig. 5 distinguishes the saddles and minima explicitly visited in TAD from the additional ones that were ignored due to the low-reverse-barrier approximation. Figure 6 plots the details of twelve different escape paths obtained at kBT/ε=0.088, selected to illustrate the nature of the path having relatively low highest barriers. All these paths were generated using the nudged elastic band method after the TAD simulations were complete, as discussed in Section II. Fig. 6 shows the details of a number of paths seen in TAD runs at kBT/ε=0.088. These paths were selected because they represent the two mechanisms with the lowest activation barriers for isomerization. The paths shown in red reach the icosahedral basin after crossing a highest barrier at 4.219. The paths shown in blue reach the icosahedral basin after crossing a highest barrier at 4.272. This second type of low barrier path has been described in reference 3. The common features shared by all the paths in figure 6 have been emphasized by shifting the paths along the x-axis so that the 4.219 barrier is at the zero of hyperdistance. In addition to mapping the paths with relatively low activation energies, we also investigated the contribution of various paths to the overall isomerization rate from fcc to icosahedral. In order to obtain adequate statistics,104 runs at kBT/ε=0.088 were initiated in the fcc state. Of these runs, 94 reached the icosahedral basin before the runs were terminated. Fig. 7 presents a histogram of the highest barriers for these 94 escapes. The highest barrier for 13 of these paths was 4.219, while the highest barrier for 12 of the

8
paths was 4.272. There were also substantial numbers of paths which escaped over these barriers (4.219 or 4.272) but then went over slightly higher barriers (>4.219 or >4.272) in the icosahedral funnel before reaching a low lying state in the icosahedral. We found 32 paths which passed over the 4.219 barrier and then passed over a somewhat higher barrier. We found 15 paths which passed over the 4.272 (and the 4.219) barrier and then passed over a somewhat higher barrier. The remainder of the escapes, 22 in number, followed higher energy pathways which involved a range of other barriers and were less easily categorized. A major motivation for analysis of these isomerization pathways was to understand the mechanisms responsible for the observed rate discrepancies between our MD and TAD runs and previous studies using DPS or ME approaches. The reaction pathways discussed above show that about half of the total rate can be attributed to paths which reach the icosahedral basin by passing over a highest barrier of EA=4.219. These paths were probably not included in the DPS or ME approaches. The fact that it, and perhaps other paths as well, were missed is probably one reason our rates are higher than those reported previously. In this regard, it is worth discussing the difference between the two basic approaches to determining isomerization rates in a system like this. Using a master equation approach or discrete path sampling, as were employed for the prior work on this LJ38 system, the goal is to discover all (or all relevant) paths through state space that connect the desired initial and final states. This path information (e.g., all minima and saddles and their connectivity) can then be converted to a rate constant at any temperature of interest for the overall isomerization process. The advantage of this path-based approach is that even when the overall rate constant is extremely low, the rate can be determined if the paths can be found. The disadvantage of this approach is that it can be hard to know whether all paths have been found. The rate constant will be in error (i.e., will be reduced) by each missing path contribution. An alternative approach, the one we have explored here for the LJ38 system, is to use direct dynamical simulation to obtain the rate constants. The advantage of this dynamical approach is that not all the paths need to be found. Instead, dynamical evolution of the system automatically samples the paths in the correct proportion and the rate constant is a directly observable property of the dynamical simulation. If many simulations of the isomerization process are performed, all the important paths will be seen. However, an estimate of the rate can be made even if only a few simulations are performed and many important paths are never observed. The rate estimate will have larger statistical error bars, but it will be an unbiased estimate. There is a major disadvantage of this approach, however, which is that if the rate is too low, no rate can be estimated because no isomerization event will be observed on the time scale of the simulation. For systems in this category, only the path-based approach is viable. The LJ38 system has been generally assumed to be in this low-rate-constant category, which is why the pioneering path-based studies on this complex system2,3,5 have been so valuable. VI. CORRELATED EVENTS We conclude with a brief discussion of correlated events and their effect on the calculated escape rates from the fcc superbasin to the icosahedral superbasin. In our

9
simulations, correlated events manifest themselves as small rate discrepancies between TAD and MDSDQ runs. They are also responsible for a portion of the discrepancy seen in Fig. 2 between MDSDQ and DPS. In order to understand these rate discrepancies we examined the distribution of residence times in the fcc ground state in MDSDQ runs. The residence time in the ground state was defined as the elapsed time between the system entering the fcc ground state and the system moving to the first low lying fcc excited state at 2.0728 energy units. (This state is the metastable state adjacent to the zero energy fcc state at the left side of figs. 5 and 6.) The distribution of residence times measured at two different temperatures is plotted as a histogram for simulation temperatures of kT/ε=0.138 and kT/ε=0.163 and clearly shows a bimodal distribution. At these temperatures roughly a quarter of the hops out of the fcc basin have residence times on the order of 0.3 time units, independent of temperature (this residence time is comparable to the time associated with the phonon vibrations of the cluster). The remainder of the residence times are ~10,000 time units at kT/ε=0.163 and ~1,000,000 time units at kT/ε=0.138. The long residence time events are well characterized by transition state theory, which assumes that the system equilibrates (rethermalizes) in a given basin and later escapes with a rate determined by an Arrhenius equation. The short residence times occur when the system starts in an excited state, falls into the stable fcc state, and then immediately continues to another excited state with symmetry equivalence to the initial excited state. This process, which occurs repeatedly in these molecular dynamics runs, boosts the overall escape rate from the fcc basin. As such correlated events are not considered in transition rate theory, and they cannot contribute to the calculated rate in TAD or DPS. Consequently both TAD and DPS underestimate the escape rate from the fcc to the icosahedral basin. In the present case DPS underestimates the escape rate by a factor of about 7, whereas TAD underestimates the escape rate by a factor of about 2. We attribute the TAD error to correlated events, whereas the DPS error is due both to correlated events and to the computational omission of some low energy pathways for LJ38. VII. SUMMARY
Contrary to expectation, we have found it possible to use molecular dynamics (monitored via steepest descent quenches) to find the global minimum for LJ38. Furthermore, we were able to determine isomerization rates using this technique. Our success in using MDSDQ is due in part to the fact that the isomerization rates are somewhat higher than previously estimated. Needless to say, the ever increasing power of today’s computers played a role as well. We have also shown that temperature accelerated dynamics can play a very useful role in the study of such systems. Because TAD allows simulations of very long times at very low temperatures, we can extend rate simulations over a much wider range of temperatures than are possible with MD alone. Simulations at such low temperatures are of particular interest in mapping out fast pathways for reactions. TAD turns out to be an excellent approach to finding the “lowest highest barriers” for these complex reactions.

10
In particular, for LJ38, we have discovered a new low-barrier pathway for isomerization that makes a significant contribution to the rate at very low temperatures. We note that when using either MDSDQ or TAD to study isomerization rates, there is no need to find every possible pathway between the initial and final states. Rather, because these two methods follow the dynamical evolution of the system from state to state, the ensemble of dynamically important pathways is automatically sampled correctly and the isomerization rate is directly observable. Finally we note that missing pathways and missing correlated hops lead to errors in rate calculations based on transition state theory. VII. ACKNOWLEDGMENTS Work at Los Alamos National Laboratory was carried out under the auspices of the National Nuclear Safety Administration of the U.S. Department of Energy under Contract No. DE-AC52-06NA25396, funded by the Office of Science, Office of Basic Energy of Sciences. Work at Sandia National Laboratory was supported by the U. S. Department of Energy, Basic Energy Sciences, Division of Materials Science, under Contract No. DE-AC04-94AL85000.
11
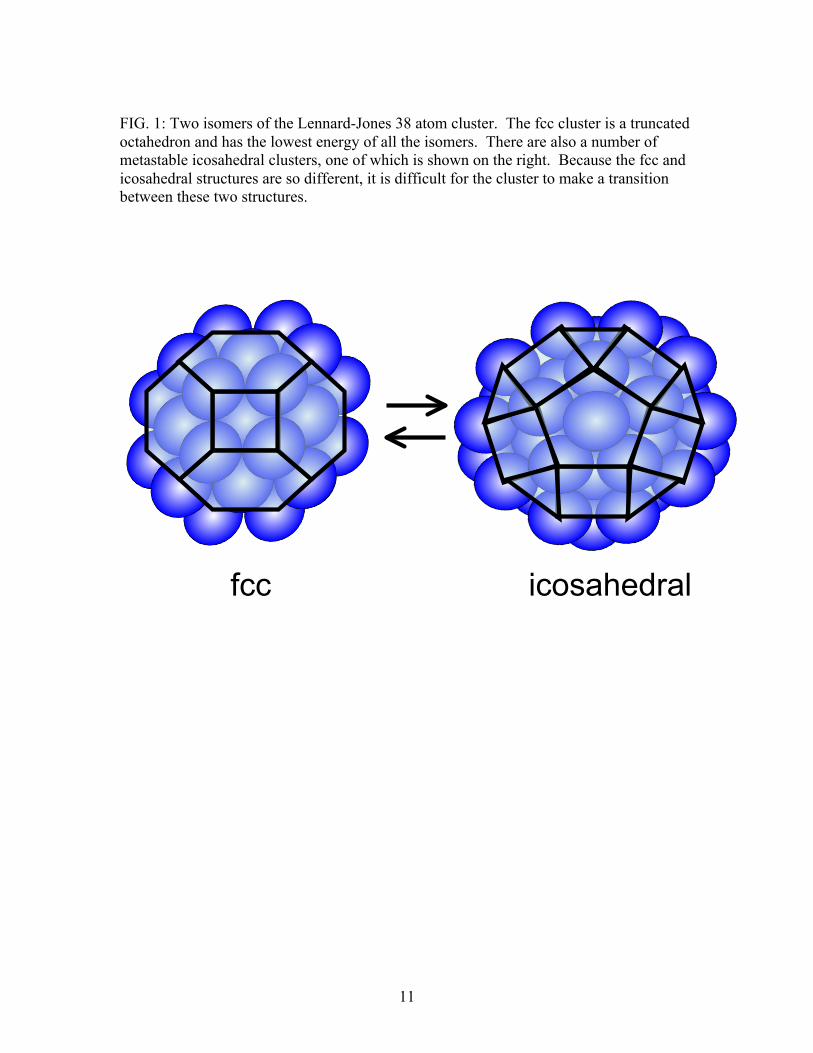
FIG. 1: Two isomers of the Lennard-Jones 38 atom cluster. The fcc cluster is a truncated octahedron and has the lowest energy of all the isomers. There are also a number of metastable icosahedral clusters, one of which is shown on the right. Because the fcc and icosahedral structures are so different, it is difficult for the cluster to make a transition between these two structures.
fcc icosahedral

12
FIG. 2: Plot of energy vs. time for typical LJ38 MDSDQ run at temperature kBT/ε = 0.138. The energies (units ε) are for the quenched states. The time unit is εσ2m . In these energy units, the states at E = 0.0 are the fcc state (global minimum). The states at 0.67 < E < 2.33 are icosahedral states. The highest energy states are liquid-like. The system moves back and forth between the fcc and icosahedral funnels several times during the course of this run.
0
1
2
3
4
5
6
0 2 107 4 107 6 107
Ener
gy
Time
fcc
icosahedral
liquid-like
0 2 x 10⁷ 4 x 10⁷ 6 x 10⁷ Time

13
FIG. 3: (color online) Isomerization rates as a function of reciprocal temperature determined using molecular dynamics with steepest descent quenching (MDSDQ) compared with discrete path sampling (DPS) results.3 Rate units are
€
ε mσ2 . The solid lines give the escape rates from the fcc basin into the icosahedral basin. The dashed lines give the return rate to the fcc basin. The (red) points with error bars represent our MDSDQ results and the circular (blue) points represent DPS results.3 The error bars on the MDSDQ points represent one standard deviation.
10-9
10-8
10-7
10-6
10-5
10-4
5.5 6 6.5 7 7.5 8
MDSDQ fcc->icosaMDSDQ icosa->fccDPS fcc->icosaDPS icosa->fcc
Rate
ε/kBT
II

14
FIG. 4: (color online) Fcc-to-icosahedral isomerization rates determined using MDSDQ and temperature accelerated dynamics (TAD). Rate units are
€
ε mσ2 . The rates for ε/kBT<7.8 were determined using MDSDQ. The rates for ε/kBT>7.0 were determined using TAD. (TAD and MDSDQ were both used for ε/kBT≈7.2) The solid line is a single exponential fit to the data from both methods. The activation energy obtained from this exponential fit is 4.35, which is in reasonable agreement with the activation barriers extracted from TAD runs as shown in figures 5, 6, and 7. Previous DPS results are shown by the dashed line.
10-19
10-17
10-15
10-13
10-11
10-9
10-7
10-5
6 7 8 9 10 11 12 13 14
RateMD RateTAD RateDPS Rate
Rate
ε/kBT
II

15
FIG. 5 (color online): A complete isomerization path having the "lowest highest barrier" from the fcc state to the icosahedral basin is shown. The temperature for this run was kBT/ε=0.088. The initial fcc state is at hyperdistance zero. The final icosahedral state is at hyperdistance of about 29. The highest barrier on this past occurs at hyperdistance of about 11 and energy of 4.219. The small (blue) dots show energies along the minimum energy path determined using the nudged elastic band procedure. The large dots (red) show which minima and saddles were explicitly considered in the TAD simulation. Peaks and valleys without a large dot are those stationary points that were ignored due to the small reverse-barrier criterion imposed during the TAD runs.
0
1
2
3
4
5
0 5 10 15 20 25 30
TAD PointsNEB Points
Ener
gy (u
nits
ε)
Hyperdistance (units σ)
16
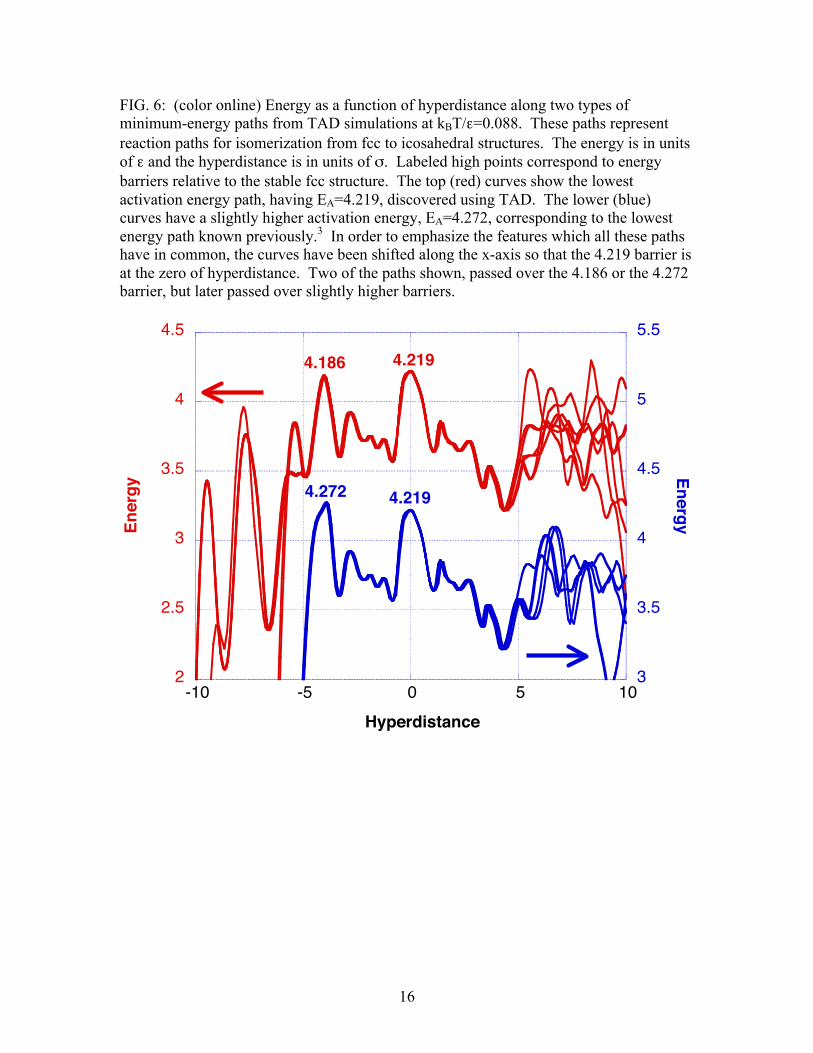
FIG. 6: (color online) Energy as a function of hyperdistance along two types of minimum-energy paths from TAD simulations at kBT/ε=0.088. These paths represent reaction paths for isomerization from fcc to icosahedral structures. The energy is in units of ε and the hyperdistance is in units of σ. Labeled high points correspond to energy barriers relative to the stable fcc structure. The top (red) curves show the lowest activation energy path, having EA=4.219, discovered using TAD. The lower (blue) curves have a slightly higher activation energy, EA=4.272, corresponding to the lowest energy path known previously.3 In order to emphasize the features which all these paths have in common, the curves have been shifted along the x-axis so that the 4.219 barrier is at the zero of hyperdistance. Two of the paths shown, passed over the 4.186 or the 4.272 barrier, but later passed over slightly higher barriers.
2
2.5
3
3.5
4
4.5
3
3.5
4
4.5
5
5.5
-10 -5 0 5 10
Energy
Energy
Hyperdistance
4.272 4.219
4.2194.186

17
FIG. 7: Histogram of the highest barriers encountered for all 84 escape pathways from fcc observed using TAD at kBT/ε=0.088. Because these are very low temperature simulations, all these paths have relatively low highest barriers. The lowest highest barrier observed in all these runs is EA=4.219. The paths with EA=4.272 correspond to the lowest barrier previously known for this system. The stacked bars serve to distinguish between runs which began by going over the lowest highest barrier of 4.219, runs which began by going over the lowest highest barrier of 4.272, and runs which followed other pathways involving higher barriers which were not easily characterized. It is clear that paths starting by going over the 4.219 initial barrier make a substantial contribution to the overall rate of isomerization.
0
5
10
15
20
4.21
94.
230
4.23
34.
272
4.29
24.
297
4.30
34.
353
4.37
04.
382
4.38
54.
391
4.41
74.
443
4.45
84.
466
4.48
14.
487
4.53
6>4
.54
4.219 initial barrier4.272 initial barrierlarger initial barrier
Num
ber o
f Esc
apes
Highest Barrier on Path

18
FIG. 8 (color online): Distribution of residence times in the fcc ground state. This is a histogram showing the relative probability of finding residence times ranging from 10-3 to 108 time units (note log scale). The peaks on the left represent times of the magnitude of a period of a phonon vibration. The peaks on the right represent times of the magnitude predicted by an Arrhenius rate law. The correlated hops with residence times less than one time unit increase the population of the excited state substantially with respect to a Boltzmann distribution, thereby increasing the escape rate well over that predicted by transition state theory.
0
0.02
0.04
0.06
0.08
0.1
10-3 10-1 101 103 105 107
kT/e=0.138kT/e=0.163
Rel
ativ
e P
roba
bilit
y
Residence Time in fcc Ground State
kT/ε=0.138 kT/ε=0.163

19
1 J. Maddox, Nature (London) 335, 201 (1988). 2 D.J. Wales, M.A. Miller and J.P.K. Doye, J. Chem. Phys. 110, 6896 (1999); J.P.K. Doye, M.A. Miller and D.J. Wales, J. Chem. Phys. 111, 8417 (1999) 3 M.A. Miller, J.P.K. Doye and D.J. Wales, Phys. Rev. E60, 3701 (1999). 4 D.J. Wales, Mol. Physics 100, 3285 (2002). 5 D.J. Wales, Energy Landscapes With Applications to Clusters, Biomolecules and Glasses, (Cambridge University Press, Cambridge, 2003). 6 M.R. Sorensen and A.F. Voter, J. Chem. Phys. 112, 9599 (2000). 7 J.P. Neirotti, F. Calvo, D.L. Freeman, and J.D. Doll, J. Chem. Phys. 112, 10340, (2000). 8 F.H. Stillinger and T. A. Weber, Phys. Rev. A28, 2408 (1983) and F.H. Stillinger and T. A. Weber, Science 225, 983 (1984). 9 B. P. Feuston, R.K. Kalia and P. Vashishta, Phys. Rev. B35, 6222 (1987). 10 A. Möbius et al., Phys. Rev. Lett. 79, 4297 (1997). I.L. Garzón et al., Phys. Rev. Lett. 81, 1600 (1998). 11 H. Jónsson, G. Mills, and K. W. Jacobsen, in Classical and Quantum Dynamics in Condensed Phase Simulation’s, edited by B. J. Berne, G. Ciccotti, and D. F. Coker (World Scientific, Singapore,1998). 12 G. Henkelman, B.P. Uberuaga, and H. Jónsson, J. Chem. Phys. 113, 9901 (2000). 13 G. Henkelman and H. Jónsson, J. Chem. Phys 113, 9978 (2000). 14 F. Montalenti, A.F. Voter and R. Ferrando, Phys. Rev. B. 66, 205404 (2002). 15 J.P. Neirotti, F. Calvo, D.L. Freeman and J.D. Doll, J. Chem. Phys. 112, 10340, (2000).