Embed Size (px)
Citation preview
International Journal of Basic Medical Sciences and Pharmacy (IJBMSP)
Vol. 8, No. 1, June 2018, ISSN: 2049-4963
© IJBMSP
www.ijbmsp.org
1
Isolation and spectroscopy study of the psoralens from Ficus
Sycomorus sap. Its thermal and kinetic effects in collagen forms.
Christos Petrou1*
, Stelios Mavromoustakos2, Constantinos Potamitis
3, Petros Chatzigeorgiou
4,
George Efthimiou2, Eugene Kokkalou
5, Madalina G. Albu
6*, and Thomas Mavromoustakos
3,4
1Department of Life and Health Sciences, University of Nicosia, 76 Makedonitissis Ave., Nicosia P.O. 24005, Cyprus 2Intercollege Nicosia, Nicosia, 8 Markou Drakou Street, 2409 Engomi, Nicosia, Cyprus 3National Hellenic Research Foundation, Institute of Organic and Pharmaceutical Chemistry, Athens, Vas. Constantinou 48, 11635, Greece 4National and Kapodistrian University of Athens, Chemistry Department, Athens, Panepistimiopolis, Zographou 15784, Greece 5University of Thessaloniki, Department of Pharmacy, Thessaloniki, 54124, Greece 6Leather and Footwear Research Institute, Collagen Department, Bucharest, 031215, Romania
Email: [email protected]
Abstract – Psoralen and antioxidants were isolated for the first time from Ficus Sycomorus (FS) sap, localised in the trunk of
the tree and are characterized by 1D and 2D NMR spectroscopy. The bioactive constituents of the sap were incorporated in the
collagen gel, which is prepared further in membranes and matrices forms, using a methodology developed in our laboratories.
Collagen gels with FS content were dried by different processes like freeze-drying and free drying at 25 oC in order to obtain
matrices and membranes because they will be used as vehicles for topical systems with controlled release of bioactive
components from FS. The thermal and structural changes caused by the presence of psoralens in membranes and matrices have
been studied using Differential Scanning Calorimetry, UV and IR. In addition, in vitro kinetic studies revealed the possible
mechanisms of the FS release and showed that FS extract has the potential to be used in these forms as a future therapeutic
approach for psoriasis.
Keywords – Ficus Sycomorus, psoralen, psoriasis, differential scanning calorimetry, Raman spectroscopy
1. Introduction
Psoriasis is a chronic skin disease with autoimmune
origin, characterized by a thickening and disorganization
of the skin's protective barrier. Usually, red scaly patches
are caused on the skin surface.
Several approaches including methotrexate, anthraline,
immunosuppresives, vitamin D, and retinoids have been
proposed for psoriasis treatment, but no effective therapy
has been established yet. Novel therapeutic approaches
including monoclonal antibodies such as infliximab, and
efalizumab have been used but their effectiveness is
associated with questionable safety profile [1]. Therapies
based on compounds isolated from natural products have
also been proposed and used for a long time. Such
therapeutic approach is the Psoralen Ultraviolet-A
(PUVA) one. PUVA is a type of treatment where the
patient receives a medicine containing a psoralen before
being exposed to ultraviolet light [2]. The therapeutic
value of the molecules isolated from the natural sources,
especially of psoralenes, with or without UV activation are
under extent investigation [3]. The absence of UV-A
activation in psoriasis treatment is of high value and it is a
challenging strategy which minimizes the cost of therapy.
Ficus Sycomorus sap is a well known psoralen rich natural
source [4-5]. The sap of Ficus Sycomorus is traditionally
used against psoriasis and leucoderma.
Collagen is the most predominant and important
protein of the skin. There are different types of collagens
characterized by a variety extend of triple helical and non-
helical domains. Type I collagen is the most interesting for
industrial uses. It has a basic structural unit of
tropocollagen which is a molecular rod about 300 nm in
length and 1.4 nm diameter and 300000 Da of molecular
weight. In the extracellular matrix it forms fibrils by
longitudinal and lateral staggering with a typical cross
striation of 70 nm period. Fibrils are aggregated into fibril
bundles originating fiber framework. Type I collagen is
widely used as a raw material for transdermic and topical
delivery systems owing to its low antigenicity and its
ability to support cell adhesion and development [6-8].
The use of type I fibrillar collagen as biocompatible and
bioresorbable biomaterial is well-known and its
applications are much diversified in medical, cosmetic and
pharmaceutical field [9].
Collagen sponges (matrices and membranes) can be
used in drug delivery and are mentioned in the literature to
be superior from the other materials for the following five
reasons: (a) partial open porosity for quick release of the
drug after implantation into the tissue; (b) partial close
porosity for “secondary” release of the drug enclosed
within pores; (c) “tertiary” release of the drug partially
immobilized within the fibrillar collagen structure; (d) a
three-dimensional structure which works as a “natural”
distance barrier between the drug incorporated into the
sponge and the surrounding environment and (e) a network
which enhances cell penetration and new tissue formation
C. Petrou1et al. / IJBMSP, Vol. 8, No. 1, pp. 1-16, June 2018 2
[10].
Topic drug delivery systems have been a great field of
interest in the recent time with promising future
applications. The main advantages of such systems are
controlled release of the drug to the affected tissue. The
drug is mainly delivered to the skin by means of drug
delivery systems. This work presents new natural forms,
for psoriasis treatments, based on collagen forms
(membranes and matrices) containing FS extract which
could be used as drug delivery topics.
This research activity presents new topical delivery
systems based on collagen membranes and matrices
containing Ficus sycomorus (FS) is a psoralen source with
potential for the treatment of psoriasis and other skin
diseases [1, 4]. The composition of aqueous FS extract
showed the presence of gallic tannins, resinonins, reducing
sugars, alkaloids and flavone aglycones 11. Due to this
complex composition the FS extract can be used for
antisporiatic treatment. FS sap is able to release in a
controlled way the psoralens from its extract for possible
psoriasis treatment. FS sap was obtained by aqueous
extraction and it is used for the collagen preparations. The
constituents of the FS extract have been isolated and
analyzed. Four different bioactive compounds namely,
psoralen, angelicin, chlorogenic and neochlorogenic acids
were isolated by HPLC and then identified by 1D and 2D
COSY NMR spectroscopy.
The in vitro release of psoralen by a specific kinetic
mechanism has been studied. In addition, spectroscopic
methodologies UV, IR and thermal analysis using
Differential Scanning Calorimetry to investigate the
structural and thermal changes in the presence of FS
extract have been applied.
2. Materials and Methods
2.1. Extraction and Isolation
All solvents and reagents used in the phytochemical
analysis and isolation of the bioactive constituents were
purchased from Riedel-de Haen and Sigma Aldrich. All
the solvents were of analytical quality and used without
further purification. A quantity of the Ficus Sycomorus sap
was collected from the plant stems of five different trees
planted across the southern coastline of Cyprus during the
spring time of the years 2007 and 2008 and was kept in
freeze. Ficus Sycomorus is not systematically planted in
Cyprus.
For the extraction, a quantity of the sap was diluted with
water and filtered under vacuum. Then, the diluted sap was
extracted successively with solvents of different polarity.
The solvents were used in the following order:
dichloromethane, diethyl ether, ethyl acetate and n-
butanol. The extracts were checked for the presence of
furanocoumarins on thin layer chromatography using the
solvent system AcOEt/AcOH/H2O, 8/2/4, upper phase
(TLC, Merck pre-coated silica gel plates, type G60-F254).
Purifications of the extracts were performed with flush
chromatography on silica gel column using AcOEt/MeOH
as the eluent. Final purification was achieved by
semipreparative high performance liquid chromatography
(HPLC) (Waters HPLC system, Mod. 1525 equipped with
a Waters dual λ absorbance detector) on normal-phase
support (Waters Spherisorb@ Silica 10 μΜ 10Χ25 mm).
The eluent was used as a mixture of DCM (A)/AcOEt (B)
(in the presence of 2% AcOH) and the flow rate was set to
1.5 ml/min and UV detection at 365 and 254 nm. The
linear gradient Scheme is presented in Table 1.
Table 1. The linear gradient scheme used in HPLC experiments.
%B Time (min)
5 0
50 50
100 20
100 5
5
Analytical HPLC was performed on the same system,
with the same solvent system and gradient using an
analytical column (Waters Spherisorb@ Silica 5 μΜ
10Χ25 mm) and 1ml/min flow. Single peaks were
produced with at least 95% of the total constituent peak
integrals. The final verification of the isolated structure
was solved by NMR techniques as it is discussed later.
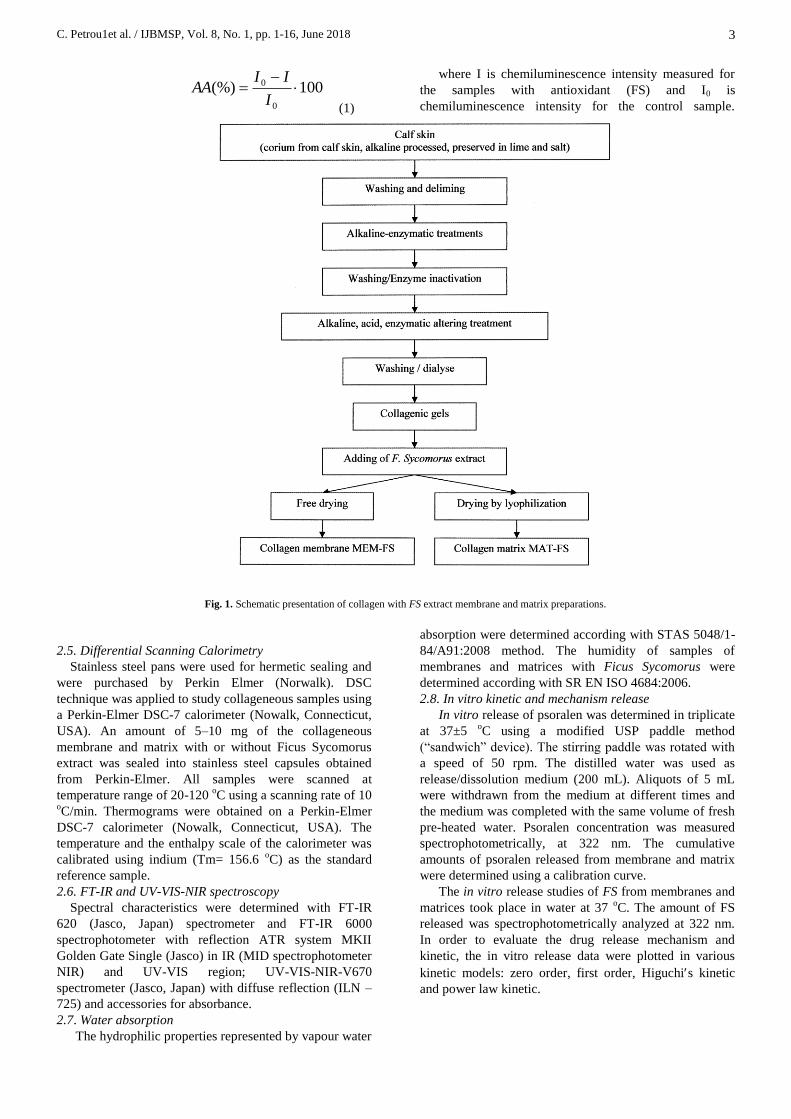
2.2. Collagen preparation
Type I fibrillar collagen gels having a concentration of
1.1% w/w were extracted from bovine hide by basic and
acidic treatments at 25 oC using the current technology in
INCDTP Division ICPI-Collagen Department [8]. These
gels were conditioned by specific drying techniques used
for collagenic biomaterials such as free drying in air at 25 oC with Venticell oven and lyophilization with Delta 2 - 24
LSC, Martin Christ, Germany (freeze-drying at –80 oC,
2x10⁻² torr) in order to obtain collagen membranes
(MEM) and matrices respectively (MAT). The collagen
forms were named as follows: MEM-FS – collagen
membrane with 5% FS extract and MAT-FS – collagen
matrix with 5% FS extract. The schematic presentation of
collagen with Ficus Sycomorus extract forms obtained is
presented in Fig. 1.
2.3. NMR spectroscopy
The deuterated solvents used for the NMR experiments
were CH3OH-d4 (purity > 99.96 %) purchased by Deutero
GmbH and NMR tubes by Norell (S-5-600-7). NMR
spectra were recorded on a Varian 600 MHz spectrometer.
Each sample was dissolved in CH3OH-d4. The gradient
selected version of the DQF-COSY experiment was used,
provided in Varian libraries of pulse programs. The 1H
spectral window used was 6000 Hz. The homonuclear 2D
proton spectra were acquired with 1024 data points in F2
dimension, 16 scans, 256 points in F1 dimension and a
relaxation delay of 1 sec.
2.4. Antioxidant Activity
Measurement of antioxidant activity: Antioxidant
activity (AA%) of FS extract, collagen gel and their
combination is investigated by chemiluminescence
technique (Turner Design 20/20, SUA) in the presence of
luminol and H2O2 at pH = 8.6 (in TRIS-HCl 0.2M) at
=420-430 nm and 10-3M/L concentration. Antioxidant
activity is evaluated by Equation 1.
C. Petrou1et al. / IJBMSP, Vol. 8, No. 1, pp. 1-16, June 2018 3
100(%)0
0
I
IIAA
(1)
where I is chemiluminescence intensity measured for
the samples with antioxidant (FS) and I0 is
chemiluminescence intensity for the control sample.
Fig. 1. Schematic presentation of collagen with FS extract membrane and matrix preparations.
2.5. Differential Scanning Calorimetry
Stainless steel pans were used for hermetic sealing and
were purchased by Perkin Elmer (Norwalk). DSC
technique was applied to study collageneous samples using
a Perkin-Elmer DSC-7 calorimeter (Nowalk, Connecticut,
USA). An amount of 5–10 mg of the collageneous
membrane and matrix with or without Ficus Sycomorus
extract was sealed into stainless steel capsules obtained
from Perkin-Elmer. All samples were scanned at
temperature range of 20-120 oC using a scanning rate of 10
oC/min. Thermograms were obtained on a Perkin-Elmer
DSC-7 calorimeter (Nowalk, Connecticut, USA). The
temperature and the enthalpy scale of the calorimeter was
calibrated using indium (Tm= 156.6 oC) as the standard
reference sample.
2.6. FT-IR and UV-VIS-NIR spectroscopy
Spectral characteristics were determined with FT-IR
620 (Jasco, Japan) spectrometer and FT-IR 6000
spectrophotometer with reflection ATR system MKII
Golden Gate Single (Jasco) in IR (MID spectrophotometer
NIR) and UV-VIS region; UV-VIS-NIR-V670
spectrometer (Jasco, Japan) with diffuse reflection (ILN –
725) and accessories for absorbance.
2.7. Water absorption
The hydrophilic properties represented by vapour water
absorption were determined according with STAS 5048/1-
84/A91:2008 method. The humidity of samples of
membranes and matrices with Ficus Sycomorus were
determined according with SR EN ISO 4684:2006.
2.8. In vitro kinetic and mechanism release
In vitro release of psoralen was determined in triplicate
at 37±5 oC using a modified USP paddle method
(“sandwich” device). The stirring paddle was rotated with
a speed of 50 rpm. The distilled water was used as
release/dissolution medium (200 mL). Aliquots of 5 mL
were withdrawn from the medium at different times and
the medium was completed with the same volume of fresh
pre-heated water. Psoralen concentration was measured
spectrophotometrically, at 322 nm. The cumulative
amounts of psoralen released from membrane and matrix
were determined using a calibration curve.
The in vitro release studies of FS from membranes and
matrices took place in water at 37 oC. The amount of FS
released was spectrophotometrically analyzed at 322 nm.
In order to evaluate the drug release mechanism and
kinetic, the in vitro release data were plotted in various
kinetic models: zero order, first order, Higuchis kinetic
and power law kinetic.
C. Petrou1et al. / IJBMSP, Vol. 8, No. 1, pp. 1-16, June 2018 4
3. Results and Discussion
3.1. Extraction of psoralens
The AcOEt extract was found to be abundant in UV
absorbing fouranocoumarins. Some traces of them were
found to exist in the n-butanol extract. No furanocoumarin
compound was detected in the extract of dichloromethane
or in the etheric extract. The extraction with ethyl acetate
was found to be the most efficient and, therefore, this
solvent was used in all subsequent experiments for the
quantitative isolation of furanocoumarins from the Ficus
Sycomorus extract.
In the analytical HPLC of the ethylacetate extract,
appeared one major peak (RT=11.655 min. 27.82%) and
two minor ones (RT=15.894 min, 0.17% and RT=16.315
min. 0.29%). As it is discussed later, the main peak
represents two fouranocoumarin derivatives, while the
others are representing chlorogenic acid isomers.
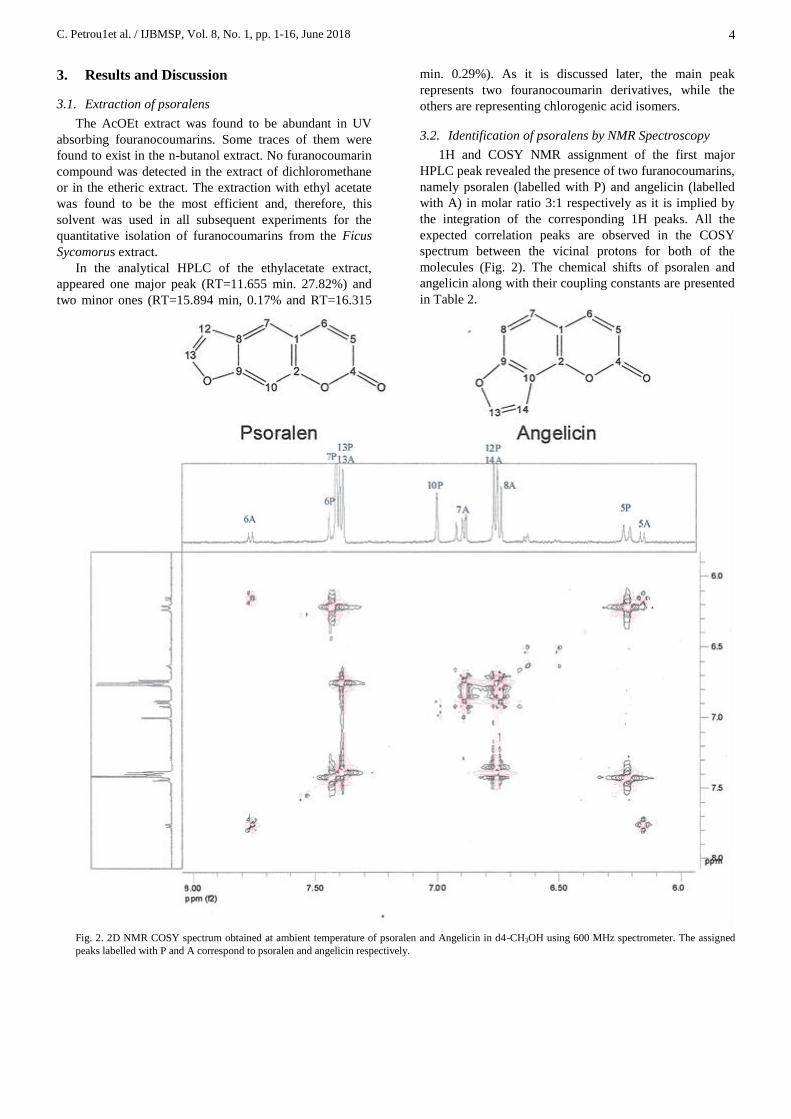
3.2. Identification of psoralens by NMR Spectroscopy
1H and COSY NMR assignment of the first major
HPLC peak revealed the presence of two furanocoumarins,
namely psoralen (labelled with P) and angelicin (labelled
with A) in molar ratio 3:1 respectively as it is implied by
the integration of the corresponding 1H peaks. All the
expected correlation peaks are observed in the COSY
spectrum between the vicinal protons for both of the
molecules (Fig. 2). The chemical shifts of psoralen and
angelicin along with their coupling constants are presented
in Table 2.
Fig. 2. 2D NMR COSY spectrum obtained at ambient temperature of psoralen and Angelicin in d4-CH3OH using 600 MHz spectrometer. The assigned
peaks labelled with P and A correspond to psoralen and angelicin respectively.
C. Petrou1et al. / IJBMSP, Vol. 8, No. 1, pp. 1-16, June 2018 5
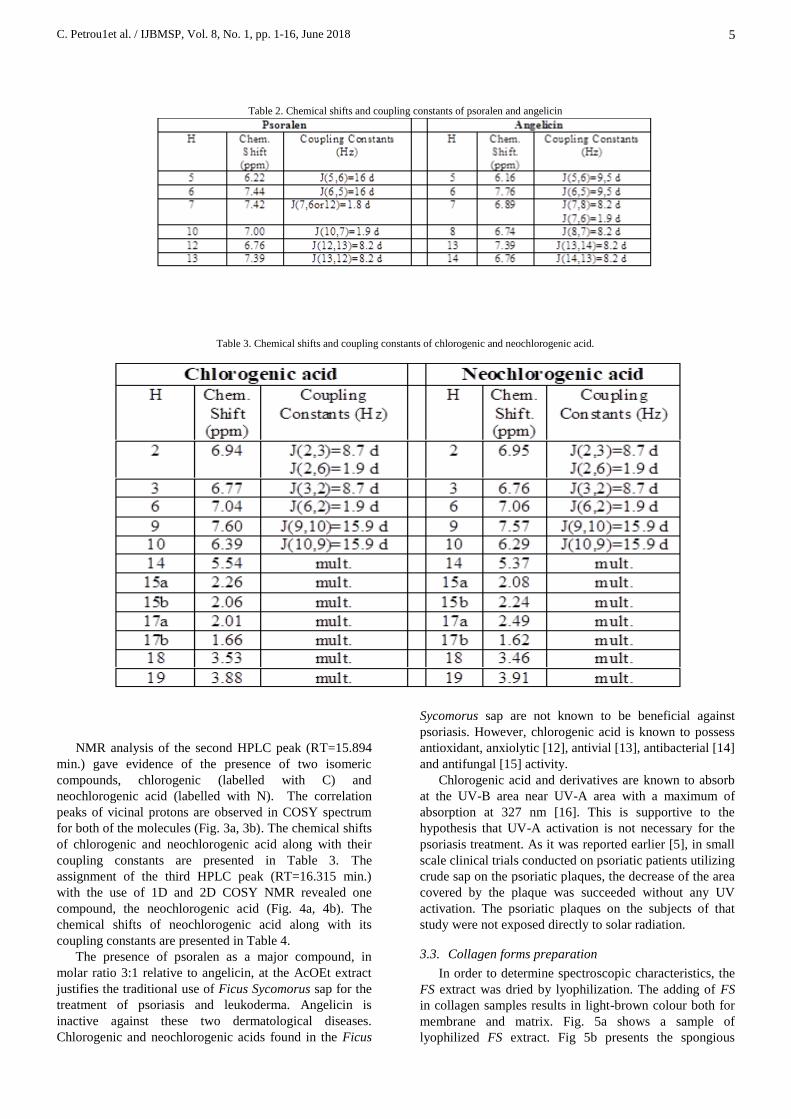
Table 2. Chemical shifts and coupling constants of psoralen and angelicin
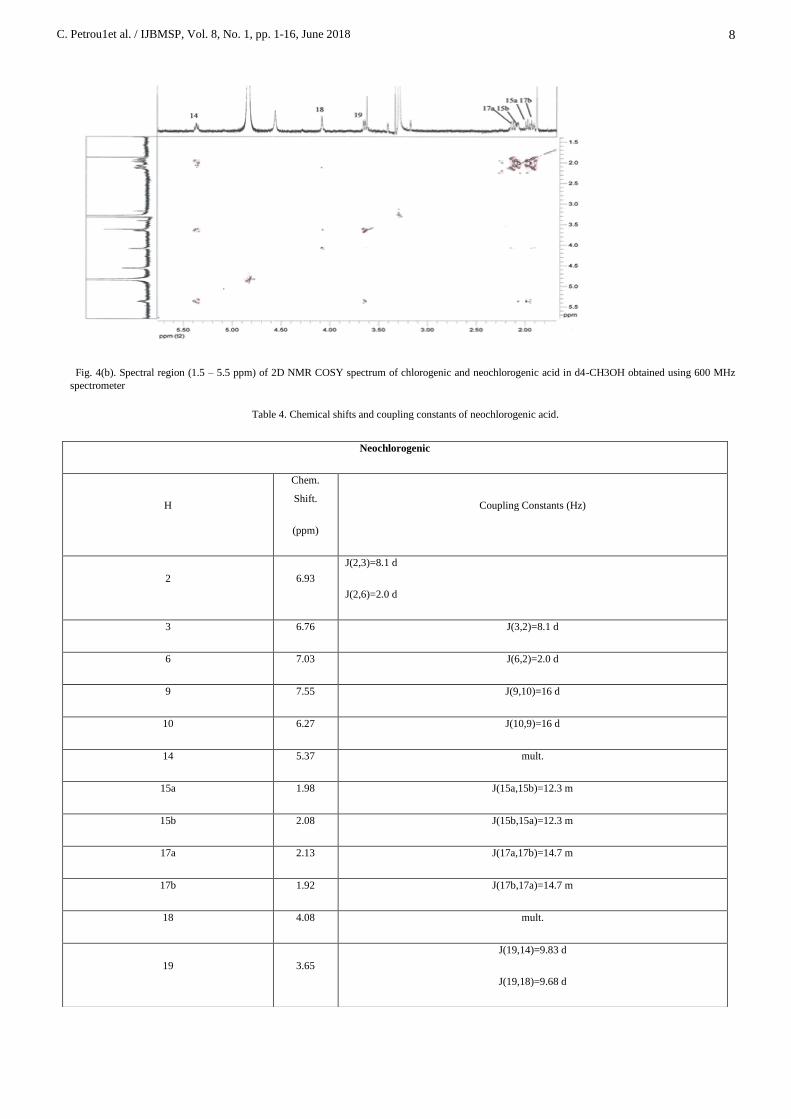
Table 3. Chemical shifts and coupling constants of chlorogenic and neochlorogenic acid.
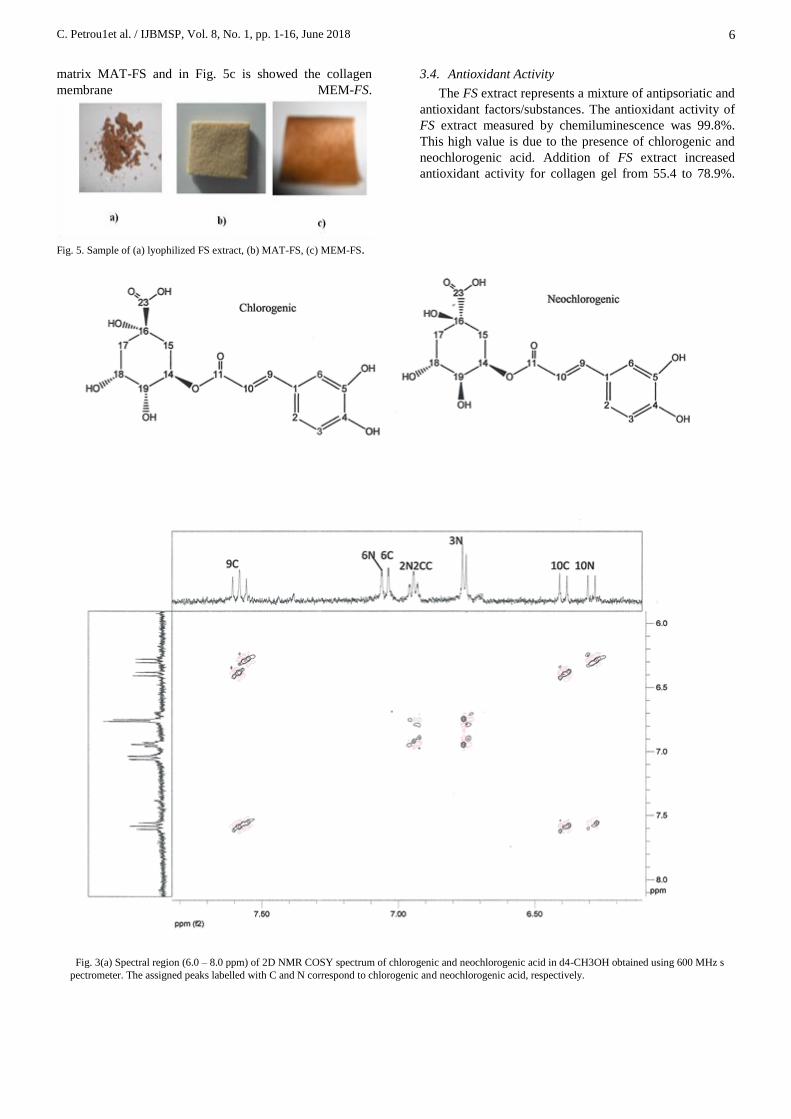
NMR analysis of the second HPLC peak (RT=15.894
min.) gave evidence of the presence of two isomeric
compounds, chlorogenic (labelled with C) and
neochlorogenic acid (labelled with N). The correlation
peaks of vicinal protons are observed in COSY spectrum
for both of the molecules (Fig. 3a, 3b). The chemical shifts
of chlorogenic and neochlorogenic acid along with their
coupling constants are presented in Table 3. The
assignment of the third HPLC peak (RT=16.315 min.)
with the use of 1D and 2D COSY NMR revealed one
compound, the neochlorogenic acid (Fig. 4a, 4b). The
chemical shifts of neochlorogenic acid along with its
coupling constants are presented in Table 4.
The presence of psoralen as a major compound, in
molar ratio 3:1 relative to angelicin, at the AcOEt extract
justifies the traditional use of Ficus Sycomorus sap for the
treatment of psoriasis and leukoderma. Angelicin is
inactive against these two dermatological diseases.
Chlorogenic and neochlorogenic acids found in the Ficus
Sycomorus sap are not known to be beneficial against
psoriasis. However, chlorogenic acid is known to possess
antioxidant, anxiolytic [12], antivial [13], antibacterial [14]
and antifungal [15] activity.
Chlorogenic acid and derivatives are known to absorb
at the UV-B area near UV-A area with a maximum of
absorption at 327 nm [16]. This is supportive to the
hypothesis that UV-A activation is not necessary for the
psoriasis treatment. As it was reported earlier [5], in small
scale clinical trials conducted on psoriatic patients utilizing
crude sap on the psoriatic plaques, the decrease of the area
covered by the plaque was succeeded without any UV
activation. The psoriatic plaques on the subjects of that
study were not exposed directly to solar radiation.
3.3. Collagen forms preparation
In order to determine spectroscopic characteristics, the
FS extract was dried by lyophilization. The adding of FS
in collagen samples results in light-brown colour both for
membrane and matrix. Fig. 5a shows a sample of
lyophilized FS extract. Fig 5b presents the spongious
C. Petrou1et al. / IJBMSP, Vol. 8, No. 1, pp. 1-16, June 2018 6
matrix MAT-FS and in Fig. 5c is showed the collagen
membrane MEM-FS.
Fig. 5. Sample of (a) lyophilized FS extract, (b) MAT-FS, (c) MEM-FS.
3.4. Antioxidant Activity
The FS extract represents a mixture of antipsoriatic and
antioxidant factors/substances. The antioxidant activity of
FS extract measured by chemiluminescence was 99.8%.
This high value is due to the presence of chlorogenic and
neochlorogenic acid. Addition of FS extract increased
antioxidant activity for collagen gel from 55.4 to 78.9%.
Fig. 3(a) Spectral region (6.0 – 8.0 ppm) of 2D NMR COSY spectrum of chlorogenic and neochlorogenic acid in d4-CH3OH obtained using 600 MHz s
pectrometer. The assigned peaks labelled with C and N correspond to chlorogenic and neochlorogenic acid, respectively.
C. Petrou1et al. / IJBMSP, Vol. 8, No. 1, pp. 1-16, June 2018 7
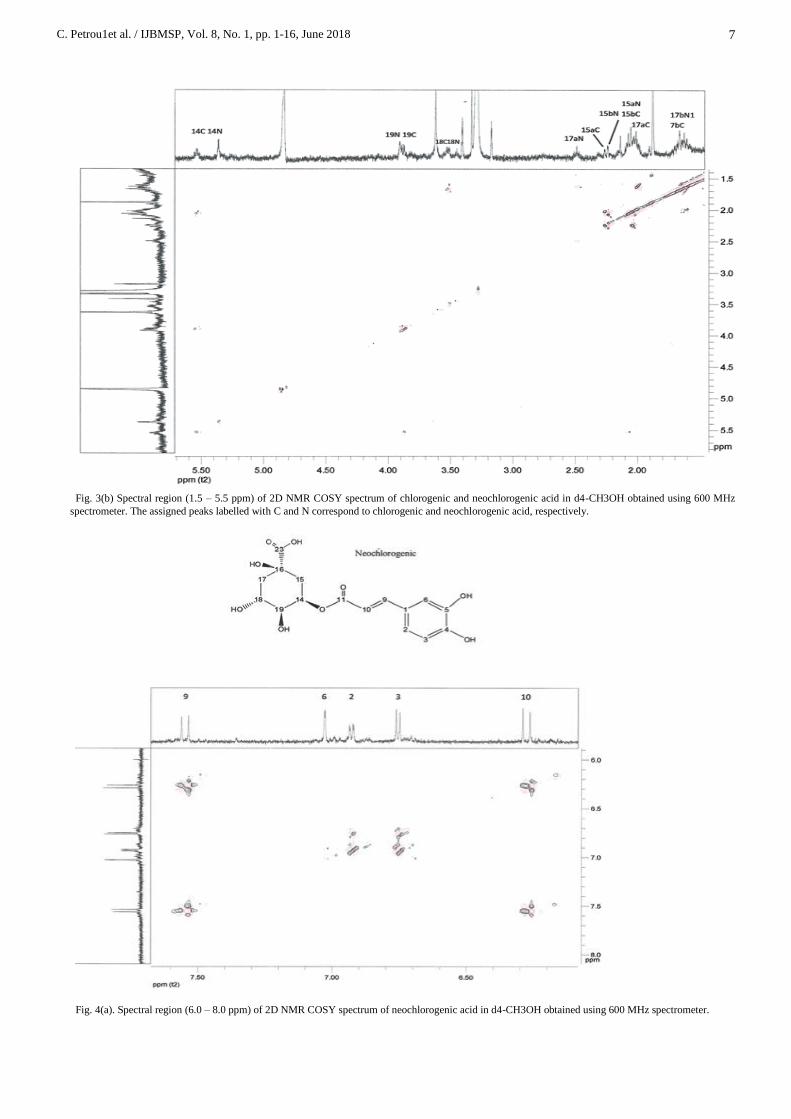
Fig. 3(b) Spectral region (1.5 – 5.5 ppm) of 2D NMR COSY spectrum of chlorogenic and neochlorogenic acid in d4-CH3OH obtained using 600 MHz
spectrometer. The assigned peaks labelled with C and N correspond to chlorogenic and neochlorogenic acid, respectively.
Fig. 4(a). Spectral region (6.0 – 8.0 ppm) of 2D NMR COSY spectrum of neochlorogenic acid in d4-CH3OH obtained using 600 MHz spectrometer.
C. Petrou1et al. / IJBMSP, Vol. 8, No. 1, pp. 1-16, June 2018 8
Fig. 4(b). Spectral region (1.5 – 5.5 ppm) of 2D NMR COSY spectrum of chlorogenic and neochlorogenic acid in d4-CH3OH obtained using 600 MHz
spectrometer
Table 4. Chemical shifts and coupling constants of neochlorogenic acid.
Neochlorogenic
H
Chem.
Shift.
(ppm)
Coupling Constants (Hz)
2 6.93
J(2,3)=8.1 d
J(2,6)=2.0 d
3 6.76 J(3,2)=8.1 d
6 7.03 J(6,2)=2.0 d
9 7.55 J(9,10)=16 d
10 6.27 J(10,9)=16 d
14 5.37 mult.
15a 1.98 J(15a,15b)=12.3 m
15b 2.08 J(15b,15a)=12.3 m
17a 2.13 J(17a,17b)=14.7 m
17b 1.92 J(17b,17a)=14.7 m
18 4.08 mult.
19 3.65
J(19,14)=9.83 d
J(19,18)=9.68 d
C. Petrou1et al. / IJBMSP, Vol. 8, No. 1, pp. 1-16, June 2018 9
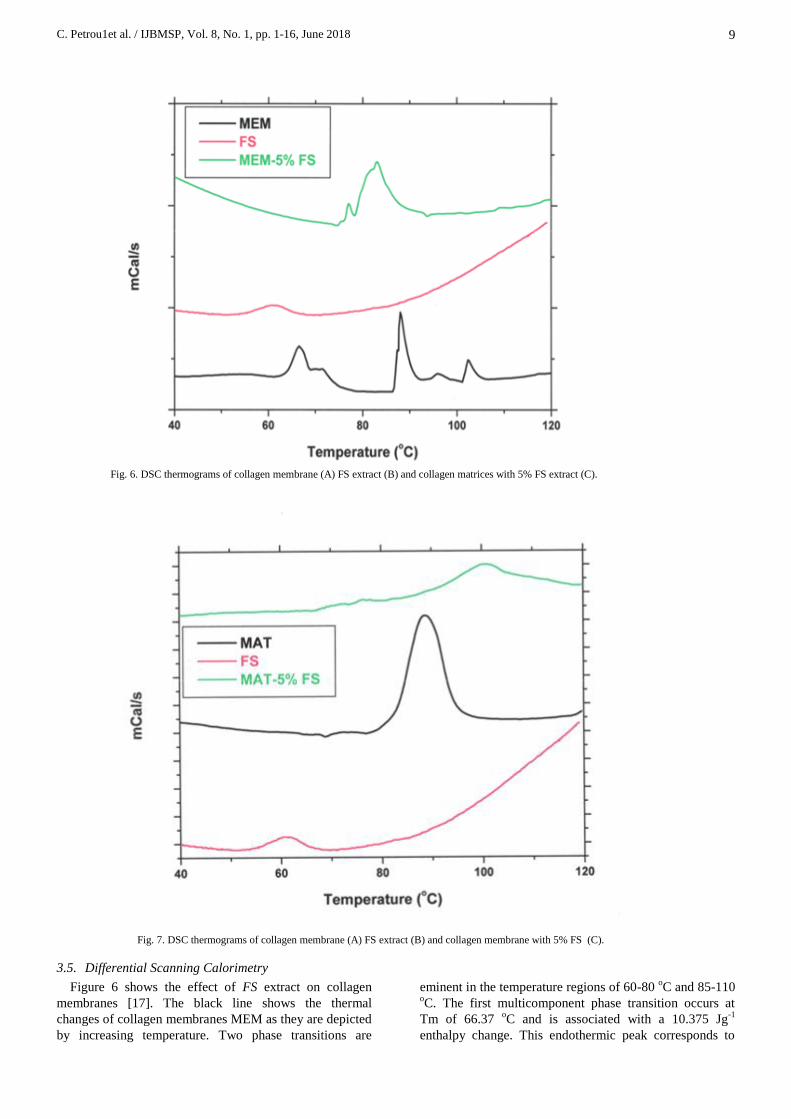
Fig. 6. DSC thermograms of collagen membrane (A) FS extract (B) and collagen matrices with 5% FS extract (C).
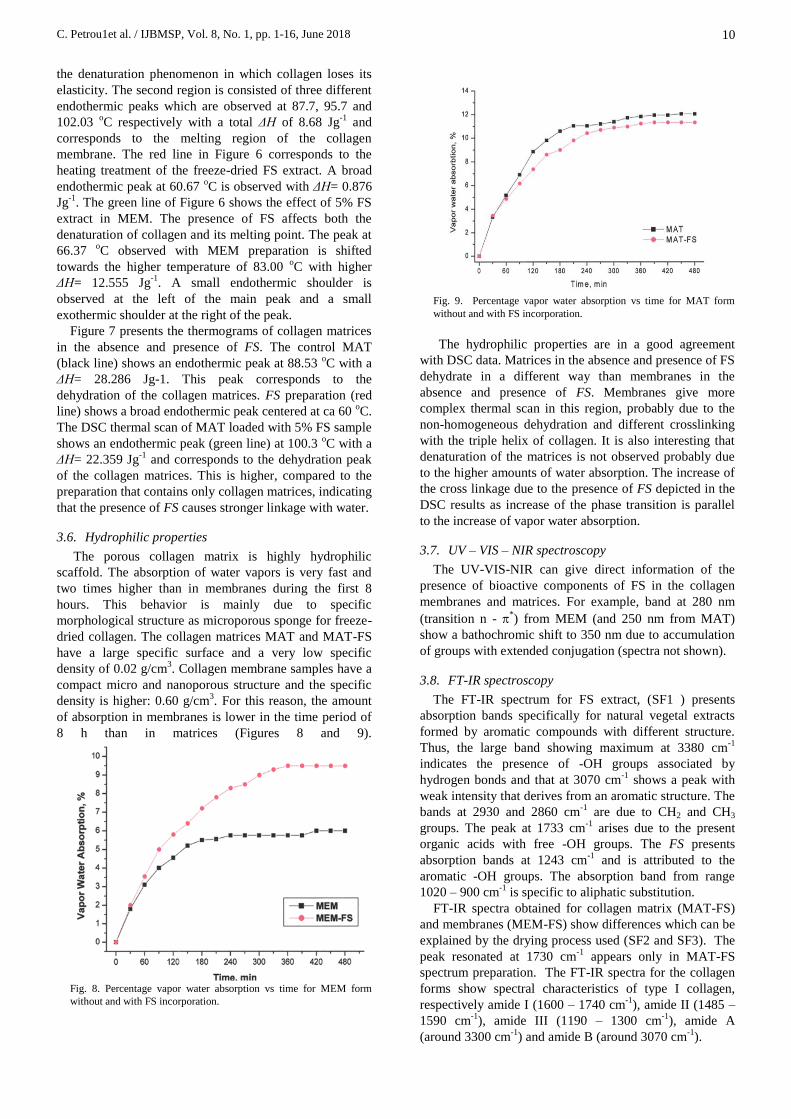
Fig. 7. DSC thermograms of collagen membrane (A) FS extract (B) and collagen membrane with 5% FS (C).
3.5. Differential Scanning Calorimetry
Figure 6 shows the effect of FS extract on collagen
membranes [17]. The black line shows the thermal
changes of collagen membranes MEM as they are depicted
by increasing temperature. Two phase transitions are
eminent in the temperature regions of 60-80 oC and 85-110
oC. The first multicomponent phase transition occurs at
Tm of 66.37 oC and is associated with a 10.375 Jg
-1
enthalpy change. This endothermic peak corresponds to
C. Petrou1et al. / IJBMSP, Vol. 8, No. 1, pp. 1-16, June 2018 10
the denaturation phenomenon in which collagen loses its
elasticity. The second region is consisted of three different
endothermic peaks which are observed at 87.7, 95.7 and
102.03 oC respectively with a total ΔΗ of 8.68 Jg
-1 and
corresponds to the melting region of the collagen
membrane. The red line in Figure 6 corresponds to the
heating treatment of the freeze-dried FS extract. A broad
endothermic peak at 60.67 oC is observed with ΔΗ= 0.876
Jg-1
. The green line of Figure 6 shows the effect of 5% FS
extract in MEM. The presence of FS affects both the
denaturation of collagen and its melting point. The peak at
66.37 oC observed with MEM preparation is shifted
towards the higher temperature of 83.00 oC with higher
ΔH= 12.555 Jg-1
. A small endothermic shoulder is
observed at the left of the main peak and a small
exothermic shoulder at the right of the peak.
Figure 7 presents the thermograms of collagen matrices
in the absence and presence of FS. The control MAT
(black line) shows an endothermic peak at 88.53 oC with a
ΔΗ= 28.286 Jg-1. This peak corresponds to the
dehydration of the collagen matrices. FS preparation (red
line) shows a broad endothermic peak centered at ca 60 oC.
The DSC thermal scan of MAT loaded with 5% FS sample
shows an endothermic peak (green line) at 100.3 oC with a
ΔΗ= 22.359 Jg-1
and corresponds to the dehydration peak
of the collagen matrices. This is higher, compared to the
preparation that contains only collagen matrices, indicating
that the presence of FS causes stronger linkage with water.
3.6. Hydrophilic properties
The porous collagen matrix is highly hydrophilic
scaffold. The absorption of water vapors is very fast and
two times higher than in membranes during the first 8
hours. This behavior is mainly due to specific
morphological structure as microporous sponge for freeze-
dried collagen. The collagen matrices MAT and MAT-FS
have a large specific surface and a very low specific
density of 0.02 g/cm3. Collagen membrane samples have a
compact micro and nanoporous structure and the specific
density is higher: 0.60 g/cm3. For this reason, the amount
of absorption in membranes is lower in the time period of
8 h than in matrices (Figures 8 and 9).
Fig. 8. Percentage vapor water absorption vs time for MEM form
without and with FS incorporation.
Fig. 9. Percentage vapor water absorption vs time for MAT form
without and with FS incorporation.
The hydrophilic properties are in a good agreement
with DSC data. Matrices in the absence and presence of FS
dehydrate in a different way than membranes in the
absence and presence of FS. Membranes give more
complex thermal scan in this region, probably due to the
non-homogeneous dehydration and different crosslinking
with the triple helix of collagen. It is also interesting that
denaturation of the matrices is not observed probably due
to the higher amounts of water absorption. The increase of
the cross linkage due to the presence of FS depicted in the
DSC results as increase of the phase transition is parallel
to the increase of vapor water absorption.
3.7. UV – VIS – NIR spectroscopy
The UV-VIS-NIR can give direct information of the
presence of bioactive components of FS in the collagen
membranes and matrices. For example, band at 280 nm
(transition n - *) from MEM (and 250 nm from MAT)
show a bathochromic shift to 350 nm due to accumulation
of groups with extended conjugation (spectra not shown).
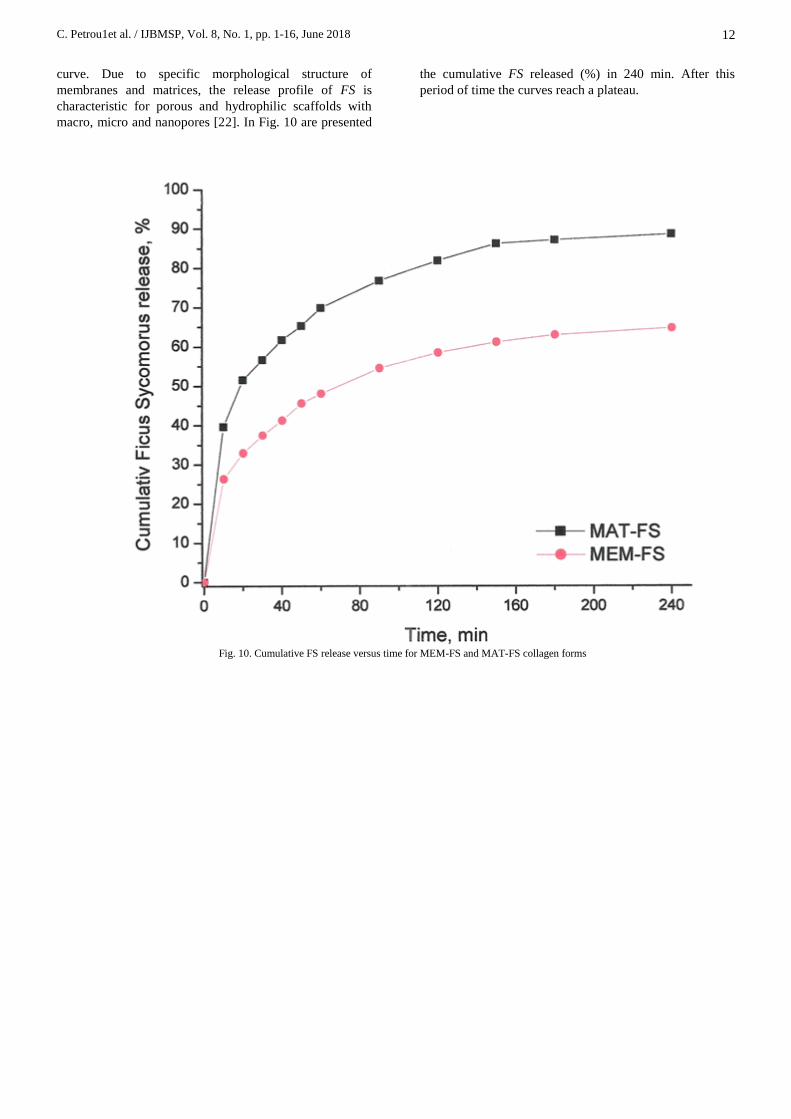
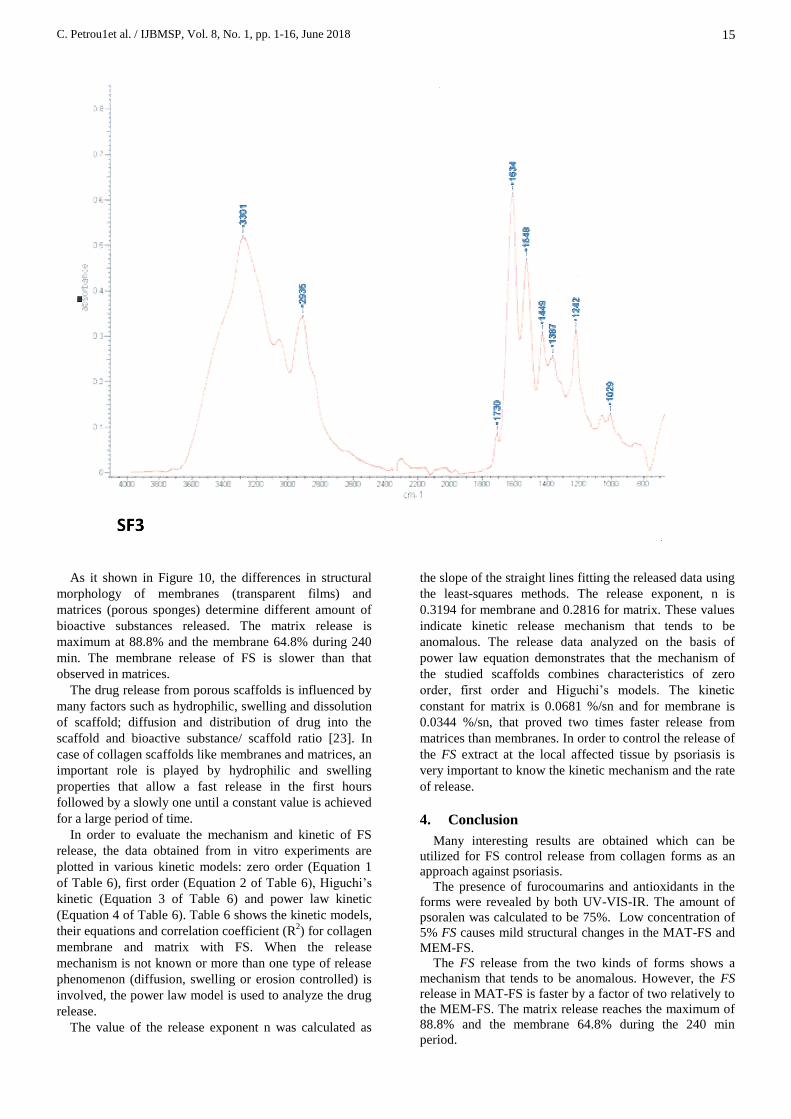
3.8. FT-IR spectroscopy
The FT-IR spectrum for FS extract, (SF1 ) presents
absorption bands specifically for natural vegetal extracts
formed by aromatic compounds with different structure.
Thus, the large band showing maximum at 3380 cm-1
indicates the presence of -OH groups associated by
hydrogen bonds and that at 3070 cm-1
shows a peak with
weak intensity that derives from an aromatic structure. The
bands at 2930 and 2860 cm-1
are due to CH2 and CH3
groups. The peak at 1733 cm-1
arises due to the present
organic acids with free -OH groups. The FS presents
absorption bands at 1243 cm-1
and is attributed to the
aromatic -OH groups. The absorption band from range
1020 – 900 cm-1
is specific to aliphatic substitution.
FT-IR spectra obtained for collagen matrix (MAT-FS)
and membranes (MEM-FS) show differences which can be
explained by the drying process used (SF2 and SF3). The
peak resonated at 1730 cm-1
appears only in MAT-FS
spectrum preparation. The FT-IR spectra for the collagen
forms show spectral characteristics of type I collagen,
respectively amide I (1600 – 1740 cm-1
), amide II (1485 –
1590 cm-1
), amide III (1190 – 1300 cm-1
), amide A
(around 3300 cm-1
) and amide B (around 3070 cm-1
).
C. Petrou1et al. / IJBMSP, Vol. 8, No. 1, pp. 1-16, June 2018 11
Amide I bands are situated around the 1631 – 1642 cm-1
value for all samples. The shift of amide I from 1631 cm-1
reported for MAT to 1634 cm-1
in MAT-FS and from 1642
cm-1
in MEM and to 1641 cm-1 in MEM-FS reveals an
orderly structural process through H2O bending at
carbonyl groups 18. Also, the phenolic -OH groups of FS
react with carbonylic groups of collagen. The effect
consists of moderate conformational changes in secondary
structure.
Other changes in spectra can be noticed in amide II
band which correspond to the -NH deformation and -CN
stretching modes 19. In MEM-FS spectra the band
corresponding to the triple helical structure (around 1555
cm-1
) is near to this value (1552 cm-1
). In the case of
MAT-FS this band has a lower value of 1548 cm-1
. The
bands around 1240, 1241 and 1242 cm-1
represent the
amide III band of N-H bending vibration with significant
mixing with the CH2 wagging vibration from the glycine
backbone and proline side chains in collagen.
Modification of triple helix integrity structure could be
quantified by the ratio between amide III and 1450 cm-1
which is given by CH3 bending vibrations. This ratio has
to be higher or equal with 1. For denaturated collagen
(gelatin) which hasn’t triple helix conformation this ratio
is 0.59 20, 21. The semiquantitative modifications which
are correlated with conformational structure of collagen
are described by the following ratios:
1) AIII/A1450 is correlated with maintaining of
integrity of triple helical structure; the value has
to be higher or equal with 1.
2) AI/AA ratio is correlated with crosslinkig degree:
the higher the ratio, the higher the cross-linking
levels.
3) (1-2) cm-1
which represents differences
between frequencies of amide I and II, gives
information about denaturation process: 100
cm-1
indicates the presence of denaturated
collagen.
Table 5 shows the relevant conformational
modifications into collagen structure. The ratio
AIII/A1450 is equal with 1 for matrices and less than one
for membranes.
Table 5: Ratios AIII/A1450, AI/AA and (1-2) cm-1 for MAT and MEM collagen forms with and without the presence of FS. These indicators
explore the effects of FS in the conformational structure of collagen forms.
Name of samples
AIII/A1450 AI/AA (1-2) cm-1
MAT 1,02 1,08 84
MAT-FS 1,03 1,21 86
MEM 0,80 0,48 91
MEM-FS 0,89 0,51 89
This decreasing is due to the obtaining process of
membrane which involves before casting into shelves a
slowly heating at 35 oC during 3-4 min necessary for
desaeration. The fact that the value of this ratio is almost
the same for both membranes demonstrate that FS extract
does not destabilize the secondary structure. Also the s
for samples which contain FS, present values close to
control samples and less than 100 cm-1
. This is indicative
that there is no collagen denaturation (Table 6).
Table 6: Kinetics of FS release in various kinetic models
Collagen scaffolds with
FS
Zero order (1)
tkm
mt
First order (2)
tkt em
m
1
Higuchi’s (3)
5.0tkm
mt
Power law (4)
nt tkm
m
R2 values
A. Membrane 0.8937 0.8936 0.9730 0.9917
Matrix 0.9089 0.9088 0.9809 0.9959
The band corresponding to amide A (around 3300 cm-1)
is more sensitive at structural changes of collagen than
amide B band (3070 cm-1
). These bands are correlated with
the NH stretching modes. The amide A of pure collagen
presents absorption in the range of 3325-3330 cm-1
. When
the amine groups from polypeptides are involved in
hydrogen bonds these are shifted towards smaller
wavelength (3300 cm-1). The shift of amide A from 3298
and 3295 cm-1
presented in control samples MAT and
MEM towards higher wavelength, to 3301 cm-1
indicates
interaction through hydrogen bonds of phenolic groups of
FS with NH groups of collagen. This fact is confirmed by
increasing of ratio AI/AA.
The absorption bands from range 900 – 1100 cm-1
presented in MEM and MEM-FS are not observed in
matrices spectra. This fact could be explained by different
types of interactions which take places between reactive
groups of collagen molecules during free drying. The
formation of this interaction is influenced by the presence
of FS extract subjected to free drying. Furthermore,
membranes MEM and MEM-FS show after the drying a
humidity of about 30%, higher compared to matrix
samples that have 15%.
3.9. In vitro kinetic and mechanism of release
The amount of FS was determined as having 75%
psoralen. The cumulative percent of FS release from
membrane and matrix is determined from the calibration
C. Petrou1et al. / IJBMSP, Vol. 8, No. 1, pp. 1-16, June 2018 12
curve. Due to specific morphological structure of
membranes and matrices, the release profile of FS is
characteristic for porous and hydrophilic scaffolds with
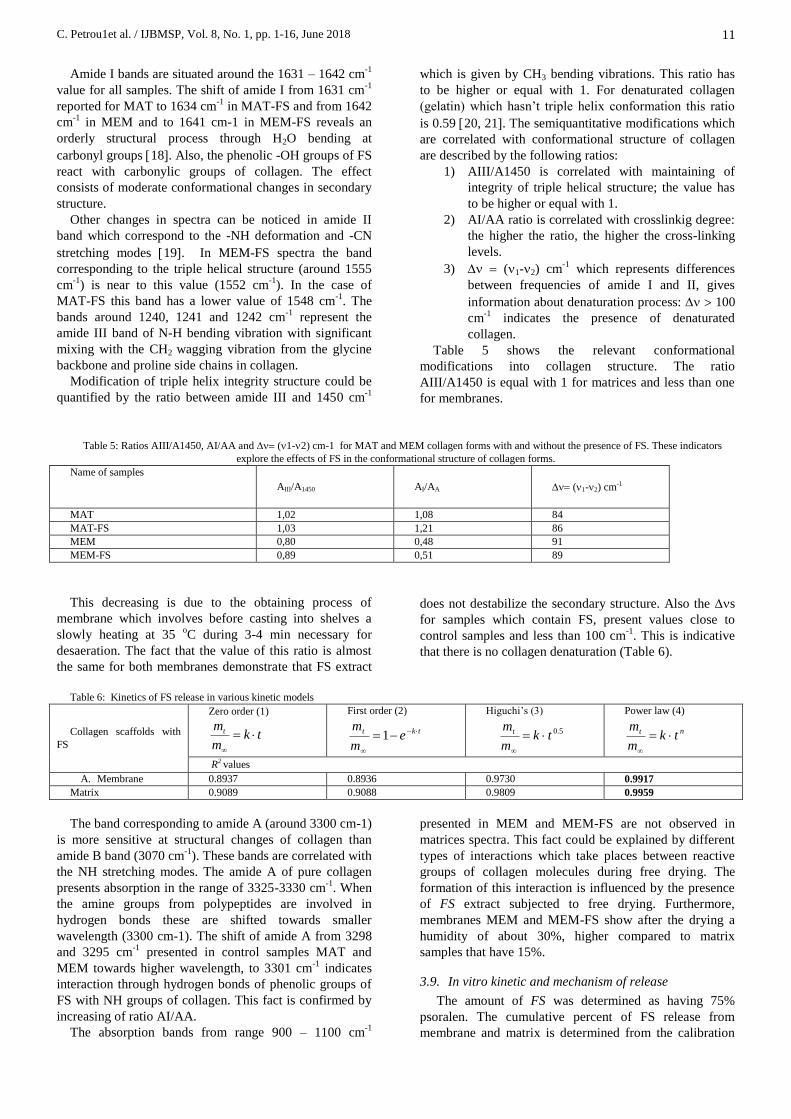
macro, micro and nanopores [22]. In Fig. 10 are presented
the cumulative FS released (%) in 240 min. After this
period of time the curves reach a plateau.
Fig. 10. Cumulative FS release versus time for MEM-FS and MAT-FS collagen forms
C. Petrou1et al. / IJBMSP, Vol. 8, No. 1, pp. 1-16, June 2018 13
C. Petrou1et al. / IJBMSP, Vol. 8, No. 1, pp. 1-16, June 2018 14
C. Petrou1et al. / IJBMSP, Vol. 8, No. 1, pp. 1-16, June 2018 15
As it shown in Figure 10, the differences in structural
morphology of membranes (transparent films) and
matrices (porous sponges) determine different amount of
bioactive substances released. The matrix release is
maximum at 88.8% and the membrane 64.8% during 240
min. The membrane release of FS is slower than that
observed in matrices.
The drug release from porous scaffolds is influenced by
many factors such as hydrophilic, swelling and dissolution
of scaffold; diffusion and distribution of drug into the
scaffold and bioactive substance/ scaffold ratio [23]. In
case of collagen scaffolds like membranes and matrices, an
important role is played by hydrophilic and swelling
properties that allow a fast release in the first hours
followed by a slowly one until a constant value is achieved
for a large period of time.
In order to evaluate the mechanism and kinetic of FS
release, the data obtained from in vitro experiments are
plotted in various kinetic models: zero order (Equation 1
of Table 6), first order (Equation 2 of Table 6), Higuchi’s
kinetic (Equation 3 of Table 6) and power law kinetic
(Equation 4 of Table 6). Table 6 shows the kinetic models,
their equations and correlation coefficient (R2) for collagen
membrane and matrix with FS. When the release
mechanism is not known or more than one type of release
phenomenon (diffusion, swelling or erosion controlled) is
involved, the power law model is used to analyze the drug
release.
The value of the release exponent n was calculated as
the slope of the straight lines fitting the released data using
the least-squares methods. The release exponent, n is
0.3194 for membrane and 0.2816 for matrix. These values
indicate kinetic release mechanism that tends to be
anomalous. The release data analyzed on the basis of
power law equation demonstrates that the mechanism of
the studied scaffolds combines characteristics of zero
order, first order and Higuchi’s models. The kinetic
constant for matrix is 0.0681 %/sn and for membrane is
0.0344 %/sn, that proved two times faster release from
matrices than membranes. In order to control the release of
the FS extract at the local affected tissue by psoriasis is
very important to know the kinetic mechanism and the rate
of release.
4. Conclusion
Many interesting results are obtained which can be
utilized for FS control release from collagen forms as an
approach against psoriasis.
The presence of furocoumarins and antioxidants in the
forms were revealed by both UV-VIS-IR. The amount of
psoralen was calculated to be 75%. Low concentration of
5% FS causes mild structural changes in the MAT-FS and
MEM-FS.
The FS release from the two kinds of forms shows a
mechanism that tends to be anomalous. However, the FS
release in MAT-FS is faster by a factor of two relatively to
the MEM-FS. The matrix release reaches the maximum of
88.8% and the membrane 64.8% during the 240 min
period.
C. Petrou1et al. / IJBMSP, Vol. 8, No. 1, pp. 1-16, June 2018 16
The above properties of MAT-FS and MEM-FS forms
and especially MAT make them candidate approaches for
further examination for possible use as patches for
antipsoriatic therapy. More work is needed in vivo to
prove or disprove this statement.
References
[1] J.A. Singh, G.A. Wells, R. Christensen, E. Tanjong Ghogomu, L.J.
Maxwell, J.K Macdonald, G. Filippini, R. Buchbinder, “Adverse effects of biologics: A network meta-analysis and Cochrane
overview”, Cochrane Database of Systematic Reviews, 2011, 2, art.
no. CD008794. [2] R.S. Babayants, V.V. Vladimirov, E.P Kulikova, G.S. Panichkina,
“Treatment of psoriasis by photochemotherapy (PUVA)”, Vestnik
Dermatologii i Venerologii., 1980, 56(10): pp.4-7. [3] A.J. Al-Kudwah, S.R. Feldman, “Management of psoriasis”,
Southern Medical Journal., 2009, 102(6): pp. 631-637.
[4] [4] S. Sanon, E. Ollivier, N. Azas, V. Mahiou, M. Gasquet, C.T. Ouattara, I. Nebie, A.S. Traore, F. Esposito, G. Balansard, P.
Timon-David, F. Fumoux, “Ethnobotanical survey and in vitro
antiplasmodial activity of plants used in traditional medicine in burkina faso”, Journal of Ethnopharmacology, 2003, 86: pp143-
147.
[5] T. Mavromoustakos, C. Petrou, E. Kokkalou, V. Roussis, E. Christofi, G. Efthimiou, C. Potamitis, S. Durdagi, S.
Mavromoustakos, “Ficus sycomorus sap: a psoralene source with
potential for the treatment of psoriasis”, Planta Medica, 2008, 74: pp. 1006.
[6] A.J. Bailey, T.J. Sims, N.C. Avery, and C.A Miles, “Chemistry of collagen cross-links: Glucose-mediated covalent cross-linking of
type-IV collagen in lens capsules”, Biochemical Journal, 2003,
296(2): pp. 489-496.
[7] A.J. Bailey, “The biological diversity of collagen: a family of
molecules” A. M. Pearson, T. R. Dutson and A. J. Bailey (Eds.), In:
Advances in Meat Research., Vol. 4, Van Norstrand Reinhold Co., New York, USA, 1987, Chapter 1, p: 1-17
[8] V. Trandafir, G. Popescu, M. G. Albu, H. Iovu, M. Georgescu,
“Bioproduse pe bază de colagen”, Editura Ars Docendi, Bucureşti., 2007, p: 99-103.
[9] W. Friess, “Collagen in drug delivery and tissue engineering”.
Advanced Drug Delivery Reviews, 2003, 55(12): pp. 1529-1530. [10] Z. Ruszczak, W. Friess, “Collagen as a carrier for on-site delivery
of antibacterial drugs” Advanced Drug Delivery Reviews, 2003,
55(12): pp. 1679-1698. [11] U.K Sandabe, P.A. Onyeyili, G.A. Chibuzo, “Phytochemical
screening and effect of aqueous extract of Ficus sycomorus L.
(Moraceae) stembark on muscular activity in laboratory animals”, J. Ethnopharm., 2006, 104: pp. 283-285.
[12] J. Bouayed, H. Rammal, A. Dicko, C. Younos, R. Soulimani,
“Chlorogenic acid, a polyphenol from Prunus domestica
(mirabelle), with coupled anxiolytic and antioxidant effects”,
Journal of the Neurological Sciences, 2007, 262: pp. 77-84. [13] S.A.A., Jassim, M.A. Naji, “Novel antiviral agents: A medicinal
plant perspective”, Journal of Applied Microbiology, 2003, 95: pp.
412-427. [14] D. Rodriguez De Sotillo, M. Hadley, C. Wolf-Hall, “Potato peel
extract a nonmutagenic antioxidant with potential antimicrobial
activity”, Journal of Food Science, 1998, 63: pp. 907-910. [15] [15] B.L. Bowles, A.J. Miller, “Caffeic acid activity against
clostridium botulinum spores”, Journal of Food Science, 1994, 59:
pp. 905-908. [16] Y. Wei, H. Zou, H. J. Yuan, “Simultaneous LC determination of
chlorogenic acid and hydrochlorthiazide in zhenju jiangya tablets”,
Chromatographia, 2006, 64: pp. 709-711. [17] E. Siapi, T. Mavromoustakos, V. Trandafir, B. Albu, P. Budrugeac,
“The use of differential scanning calorimetry to study the effects of
gentamycin on fibrous collageneous membranes”, Thermochimica Acta, 2005, 425: pp. 165-171.
[18] C. Jung, “Insight into protein structure and protein – ligand
recognition by Fourier transform infrared spectroscopy”, J. Mol. Recognit., 2000, 13: 325-351.
[19] V.A Iconomidou, M.E. Georgaka, G. D. Chryssikos, V. Gionis, P.
Megalofonou, S.J. Hamodrakas, “Dogfish egg case structural studies by ATR FT-IR and FT-raman spectroscopy”, International
Journal of Biological Macromolecules, 2007, 41: pp.102-108.
[20] V.A. Iconomidou, G.D. Chryssikos, V. Gionis, J.H. Willis, S.J. Hamodrakas, “Soft"-cuticle protein secondary structure as revealed
by FT-raman, ATR FT-IR and CD spectroscopy” Insect
Biochemistry and Molecular Biology, 2007, 31: pp. 877-885.
[21] V.A. Iconomidou, G.D. Chryssikos, V. Gionis, M.A Pavlidis, A. Paipetis, S.J Hamodrakas, S. J, “Secondary structure of chorion
proteins of the teleostean fish dentex dentex by ATR FT-IR and
FT-raman spectroscopy”, Journal of Structural Biology, 2000, 132(2): pp.112-122.
[22] M.G. Albu, M.V. Ghica, L. Popa, M. Leca, V. Trandafir, “In vitro
Kinetics Release of Doxycycline Hyclate from Collagen Hydrogels”, Rev. Roum. Chim., 2009, 54: 373-9.
[23] M. Grassi, G. Grassi, “Mathematical modelling and controlled drug
delivery: matrix systems”, Curr. Drug Deliv., 2005, 2: pp. 97-116.