Embed Size (px)
Citation preview

Isolation and Molecular Characterization of Lactic
Acid Bacteria From Cheese
By
Çisem BULUT
A Dissertation Submitted to the
Graduate School in Partial Fulfillment of
the Requirements for the Degree of
MASTER OF SCIENCE
Depertmant: Biotechnology and Bioengineering
Major: Biotechnology
İzmir Institute of Technology
Izmir, Turkey
September, 2003
ii
ACKNOWLEDGEMENTS
Firstly, I would like to thank my supervisor Assistant Prof. Ali Fazõl Yenidünya
for his endless encouragement, support and patience during this reseach. I also wish to
express my thanks to my co-advisors Prof. Dr. Şebnem Harsa and Assoc. Prof. Hatice
Güneş for their all kind of support and help.
I would also like to thank Prof. Dr. Sevda Kõlõç from Department of Dairy
Technology at Ege University for her guidance and the valuable information she
provided.
I want to add thanks to Prof. Dr. Mehmet Karapõnar and Ömre Sõkõlõ from Food
engineering Department at Ege University for their support.
I want to express my thankfulness to my friends; Burcu Okuklu, H. Sevgi Çoban,
Elif Yavuz, Güney Akbalõk, Seda Elmacõ, Çelenk Çõnar and Ayça Çakõn. Additionaly,
special thanks for Mert Sudağõdan due to sharing all kinds of experience with me. Also,
I would like to thank Gönül Yenidünya for special help and kindness.
I would like to thank managers and employers of Ministry of Agriculture in
Nevşehir and Avanos; Mustafa Titrek, Ali Çopur and the Mayor of the Avanos; M.
Seyhan Duru for their kindness and supports on collecting of cheese samples.
Finally, I offer sincere thanks to my family members for their support and love.

iii
ABSTRACT
Specially selected starter cultures are required for the industrial production of
cheese. These starter cultures are mainly composed of lactic acid bacteria (LAB). Starter
LAB have many functions in cheese production. They produce lactic acid during the
fermentation process and provide formation of the curd. Futhermore, they show
proteolytic activity and also they play a role in the production of aroma compounds and
antimicrobial substances. In order to prevent loss of LAB biodiversity and loss of
traditional cheese diversity, it is important to identify novel LAB from traditional
cheese.
The aim of this project was to isolate and identify natural LAB flora involved
in traditional �Çömlek Peyniri� fermentation. In order to achive this goal, LAB were
isolated and characterized by using phenotypic ( cell morphology, Gram staining,
physiological and biochemical tests ) and genotypic methods (PCR- Restriction
Fragment Length Polymorphism). Moreover, technological characterization was
performed by monitoring the acid production profiles of the isolates.
At the end of the study, a total of 113 coccal and 21 mesophilic lactobacilli were
obtained and maintained for future use. It was found that cocci shaped isolates included
54 lactococci and 59 enterecocci. Further identification at the species level indicated
that all of the lactococci isolates were L. lactis ssp. lactis. Thirty of the enterecocci were
E. faecium, 8 of them were E. faecalis , 3 of them were E. avium, 2 of them were E.
durans and 16 of them were other Enterococcus ssp. Lactobacilli isolates were
identified as Lb. paracasei ssp. paracasei (3 isolate), Lb. casei ( 3 isolate ) and other
Lactobacillus spp ( 15 isolate) . PCR-RFLP method which is based on the amplification
of 16S rRNA- ITS genes and restriction digestion with HaeIII and TaqI endonucleases
was found to be useful for further identification. Finally, acid production profiles of
isolates indicated that 35 of the isolates could lower the pH of UHT skim milk below
5.3 for 6 h incubation at 30 °C and these isolates were therefore the best starter
candidates for industrial applications.

iv
ÖZ
Endüstriyel peynir üretimi özel olarak seçilmiş starter kültürleri
gerektirmektedir. Bu starter kültürler başlõca laktik asit bakterilerinden (LAB)
oluşmaktadõr. Starter LAB peynir üretiminde pek çok fonksiyona sahiptir.
Fermentasyon prosesi boyunca laktik asit üretirler ve põhtõnõn oluşmasõnõn
sağlamaktadõrlar. Ayrõca, proteolitik aktivite göstermekte, aroma bileşikleri ve de
antimikrobiyal madde üretiminde rol oynamaktadõrlar. LAB bioçeşitliliğinin ve de
geleneksel peynir çeşitliliğinin kaybolmasõnõ önlemek için, geleneksel peynirlerden
yeni laktik asit bakterilerinin tanõmlanmasõ önemlidir.
Bu projenin amacõ, geleneksel �Çömlek Peyniri� fermentasyonuna dahil laktik
asit bakterilerinin izolasyonu ve tanõmlanmasõdõr. Bu amacõ gerçekleştirmek üzere,
laktik asit bakterileri izole edilmiştir ve fenotipik ( hücre morfolojisi, Gram boyama,
fizyolojik ve biyokimyasal testler) ve de genotipik (�PCR- Restriction Fragment Length
Polymorphism�) metodlar kullanõlarak karakterize edilmiştir. Ayrõca , izolatlarõn laktik
asit üretme profilleri monitor edilerek teknolojik karakterizasyon gerçekleştirilmiştir.
Çalõşmanõn sonunda, toplam 113 kok ve 21 mezofil laktobasil elde edilmiştir.
Kok şeklindeki izolatlarõn 54 adedi laktokok ve 59 adedi enterokok olarak
bulunmuştur.Tür düzeyindeki ileri tanõmlama göstermiştir ki; tüm laktokok izolatlar L.
lactis ssp. lactis�dir ve enterekoklarõn 30�u E. faecium, 8�i E. faecalis, 3� ü E. avium, 2�
si E. durans ve 16 �sõ Enterococcus ssp. olarak tanõmlanmõştõr. Laktobasil izolatlarõ Lb.
paracasei ssp paracasei (3 izolat) , Lb. casei (3 izolat) ve Lactobacillus ssp. (15 izolat)
olarak tanõmlanmõştõr. 16S rRNA-ITS genlerinin amplifikasyonuna ve Taq I ve Hae III
endonükleazlarõ ile restriksiyonuna dayalõ PCR- RFLP (�PCR- Restriction Fragment
Length Polymorphism�) metodu, ileri tanõmlama için faydalõ bulunmuştur. Son olarak
izolatlarõn asit üretme profilleri göstermiştir ki; 35 izolat, UHT yağsõz sütün pH sõnõ 30
°C de 6 saat inkubasyon sonunda 5.3 ün altõna düşürebilmiştir ve bu izolatlar
endüstriyel uygulama için en iyi starter adaylarõ olmuştur.

v
TABLE OF CONTENTS
LIST OF FIGURES.................................................................................................... viii
LIST OF TABLES........................................................................................................ ix
CHAPTER 1. INTRODUCTION..................................................................................1
CHAPTER 2. STARTER LACTIC ACID BACTERIA .............................................5
2.1. Main Groups Of Lactic Starters İn Cheese İndustry.....................................7
2.1.1. Mesophilic Starter Cultures.............................................................7
2.1.2. Thermophilic Starter Cultures.........................................................9
2.1.3. Artisanal or �Natural� Starter Cultures .........................................10
2.2. Starter Functions ..........................................................................................11
2.2.1. Acid Production ............................................................................11
2.2.2. Proteolytic Activity .......................................................................12
2.2.3. Flavor Formation...........................................................................12
2.2.4. Exopolysacchride Production........................................................13
2.2.5. Antimicrobial Property..................................................................13
2.3. Commercial Production of Dairy Starter Cultures.......................................14
2.4. Genetically Modified Lactic Acid Bacteria and Culture Improvement .......15
CHAPTER 3. IDENTIFICATION METHODS FOR DAIRY BACTERIA...........17
3.1. Phenotypic Methods.....................................................................................17
3.1.1.Morphological Methods .................................................................17
3.1.2. Physiological and Biochemical Methods ......................................17
3.2.Genotypic Methods ......................................................................................19
3.2.1. Randomly Amplified Poylmorphic DNA .....................................21
3.2.2. PCR Ribotyping ............................................................................21
3.2.3. PCR-FRLP ....................................................................................21
3.2.4. Rep-PCR .......................................................................................21
3.2.5. Pulsed Field Gel Electrophoresis ..................................................22
CHAPTER 4. MATERIALS AND METHODS.........................................................24
4.1. Materials.......................................................................................................24
4.1.1. Chemicals ......................................................................................24
4.1.2. Samples .........................................................................................24
4.1.3. Reference strains ...........................................................................26

vi
4.2. Methods........................................................................................................26
4.2.1. Isolation of Lactic Acid Bacteria ..................................................26
4.2.1.1. Culture Media and Growth Conditions ..........................26
4.2.2. Phenotypic identification ..............................................................27
4.2.2.1.Selection of the Isolates According to Their
Fermentative Properties...............................................................27
4.2.2.2. Morphological Examination...........................................28
4.2.2.2.1. Simple Staining ...............................................28
4.2.2.2.2. Colony Morphology ........................................28
4.2.2.2.3. Gram Staining.................................................28
4.2.2.3. Catalase Test...................................................................29
4.2.2.4. Long Term Preservation of the Isolates .........................29
4.2.2.5. Physiological and Biochemical Identification................30
4.2.2.5.1. Identification of Cocci .....................................30
4.2.2.5.1.1. Gas Production from Glucose...........30
4.2.2.5.1.2. Growth at Different Temperatures....30
4.2.2.5.1.3. Growth at Different NaCl
Concentrations .....................................................31
4.2.2.5.1.4. Arginine Hydrolysis and Gas
Production From Citrate ......................................31
4.2.2.5.1.5. Carbohydrate Fermentations...........31
4.2.2.5.2. Identification of Lactobacilli ...........................34
4.2.3. Genotypic Identification by PCR-RFLP .......................................34
4.2.3.1. Genomic DNA Isolation.................................................34
4.2.3.2. Amplification of 16S rDNA and ITS(Internally
Transcribed Spacer) Region by PCR Reaction ...........................35
4.2.3.3. Separation of amplified Fragments ................................36
4.2.3.4. Purification of PCR Products .........................................36
4.2.3.5. Restriction Fragment Length Polymorphism (RFLP) ...37
4.2.3.6. Purification of Digested DNA Fragments ......................37
4.2.3.7. Electrophoresis of Restriction Fragments ......................37
4.2.3.8. Interpretation of Results .................................................38
4.2.4. Technological Characterization of Isolates ...................................38
4.2.4.1. Acidifying Activity of Isolates .......................................38
vii
4.2.4.1.1. Monitoring of pH............................................38
4.2.4.1.2. Monitoring Lactic Acid Production................39
4.2.4.1.2.1. Standardization of 0.1 N NaOH
and determination of Factor Value ......................39
4.2.4.1.3. Evaluation of Results.......................................40
CHAPTER 5. RESULTS AND DISCUSSION..........................................................41
5.1. Isolation of Lactic Acid Bacteria .................................................................41
5.2. Phenotypic Identification .............................................................................42
5.2.1. Examination of Homofermentative Properties..............................42
5.2.2. Morphological Examination..........................................................42
5.2.3. Subculturing of Isolates.................................................................42
5.2.4. Gram Staining and Catalase test ...................................................42
5.2.5. Physiological and Biochemical Tests............................................44
5.2.5.1. Physiological and Biochemical Differentiation of
Cocci shaped Isolates ..................................................................44
5.2.5.2. Identification of Bacilli Shaped Isolates ........................57
5.3. Genotypic Identification ..............................................................................61
5.3.1. Amplification of 16 S rRNA and ITS region ................................61
5.3.2. Digestion of Amplified 16 S rRNA and ITS region .....................62
5.3.2.1. Hae III digestion.............................................................63
5.3.2.2. Taq I digestion...............................................................68
5.4. Acid Production ...........................................................................................69
CHAPTER 6. CONCLUSION AND FUTURE PERSPECTIVE............................71
REFERENCES..............................................................................................................72
APPENDIX A................................................................................................................78
APPENDIX B ................................................................................................................81
APPENDIX C................................................................................................................83
APPENDIX D ...............................................................................................................87
APPENDIX E ...............................................................................................................88
APPENDIX F ................................................................................................................90
APPENDIX G................................................................................................................91
APPENDIX H................................................................................................................92
APPENDIX I ...............................................................................................................102

viii
LIST OF FIGURES
Figure1.1. Flow sheet of �Çömlek peyniri� making process ....................................... 2
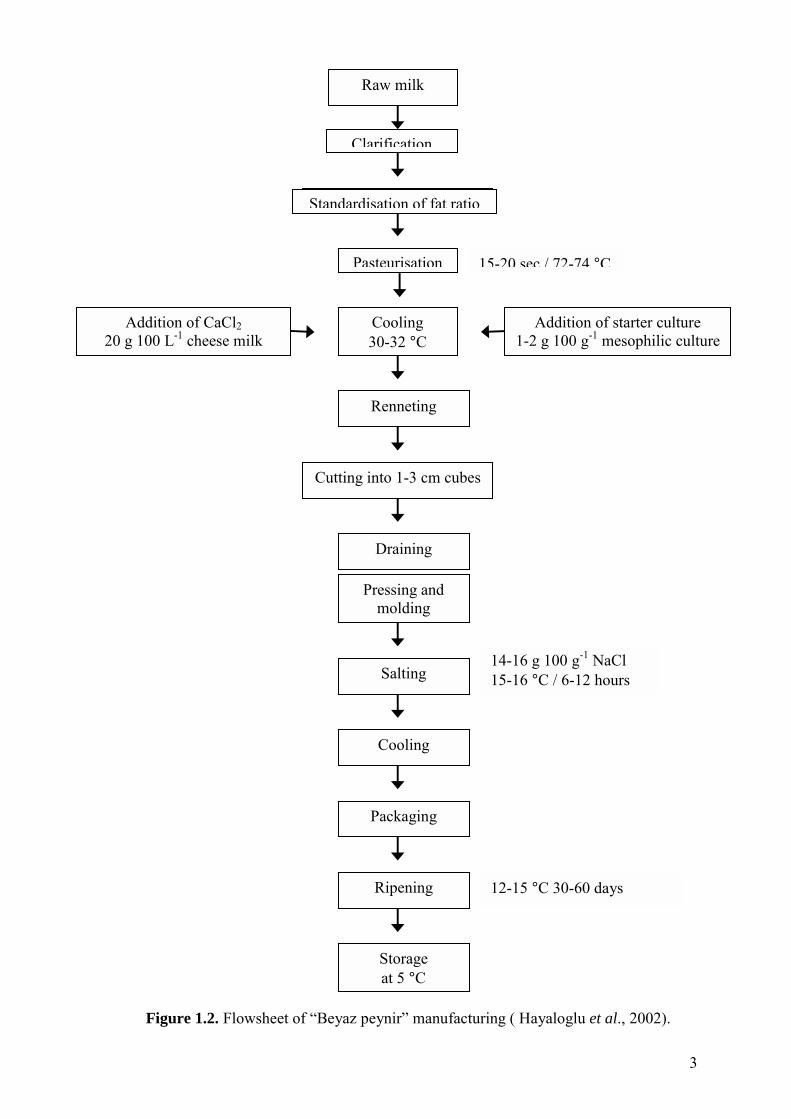
Figure 1.2. Flowsheet of �Beyaz peynir� manufacturing............................................... 3
Figure 2.1. Glucose utilization metabolic pathways of LAB......................................... 6
Figure 3.1. Polymease Chain Reaction-Restriction Fragment Length
Polymorphism............................................................................................ 23
Figure 5.1. Gram Staining and typical colony morphology of LAB............................ 43
Figure 5.2. Representative 16 S and ITS amplification products of isolates. .............. 61
Figure 5.3. Hae III digests of 16S-ITS rRNA genes of representative isolates and
reference strains ......................................................................................... 62
Figure 5.4. TaqI digests of 16S-ITS rRNA genes of representative isolates and
reference strains ......................................................................................... 64
Figure 5.5. Dendogram of Hae III digest of representative isolates and reference
strains. ........................................................................................................ 65
Figure 5.6. Dendogram of Taq I digest of representative isolates and reference
strains ........................................................................................................ 66
Figure 5.7. pH changes in UHT skim milk broths during incubation for 3 h, 6 h, 9
h ,24 h at 30 °C.. ........................................................................................ 70
Figure 5.8. Lactic acid production in UHT skim milk broths during incubation for
3 h, 6 h, 9 h, 24 h at 30 °C. ........................................................................ 70

ix
LIST OF TABLES
Table 2.1. Examples of starters used for specific type of cheeses ............................. 8 Table 2.2. Starter bacteria used in Turkish �beyaz peynir� ..................................... 11 Table 2.3. Classes of bacteriocins Produced by LAB.............................................. 14 Table 3.1. Differential characteristics of the cocci shaped lab found in starter
cultares .................................................................................................... 18
Table 3.2. Procedural steps of main genotypic methods. ........................................ 20 Table 4.1. Sample types and location ...................................................................... 25 Table4.2. Differential characteristic of cocci shaped LAB..................................... 33 Table 5.1. Logarithmic microbial count (log cfu/g) and standard deviations.......... 41 Table 5.2. Enterecoccal isolates which produced carbon dioxide from citrate ....... 46 Table 5.3. Biochemical results of cocci shaped isolates .......................................... 47 Table 5.4. Physiological and biochemical test results of cocci shaped LAB .......... 48 Table 5.5. Biochemical identification results of lactobacilli ................................... 58
Table 5.6. Physiological and biochemical test results of lactobaccili...................... 59
Table 5.7. Fragment sizes of Hae III digests of the isolates and reference strains .. 67
Table 5.8. Fragment sizes of Taq I digests of the isolates and reference strains ..... 67
Table 5.9. Acidification characteristics of the isolates ........................................... 69
Table H1.1. pH Changes in UHT skim milk during incubation at 30 °C for
Lactococcus genus. ................................................................................. 92
Table H1.2. pH Changes in UHT skim milk during incubation at 30 °C for
Enterococcus genus ................................................................................ 94
Table H1.3. pH Changes in UHT skim milk during incubation at 30 °C for
Lactobacillus genus. ............................................................................... 96
Table H2.1. Lactic acid production in UHT skim milk during incubation at 30 °C
for Lactococcus genus. ........................................................................... 97
Table H 2.2. Lactic acid production in UHT skim milk during incubation at 30 °C
for Enterococcus genus.......................................................................... 99
Table H 2.3. Lactic acid production in UHT skim milk during incubation at 30 °
C for Lactobacillus genus. .................................................................... 101
Table I.1 Reference strains subjected to physiological and biochemical tests..... 102

CHAPTER 1
INTRODUCTION
The production of cheese from milk is a very ancient process. Cheese
manufacturing started about 8 000 years ago in the �Fertile Crescent� between Tigris
and Euphrates rivers (Hayaloğlu et al., 2002).
Production of cheese is essentially achieved by bringing four ingredients together:
milk, rennet, microorganisms, and salt. The process includes the following steps: gel
formation, acid production, whey expulsion, salt addition, and finally ripening period.
The main biochemical changes that occur in cheese manufacture is the production of
lactic acid from lactose. This is achieved by different species of lactic acid bacteria
(LAB). The responsible flora that form acid development during cheese production are
starter cultures that cause decrease in the pH, formation of curd, expulsion of whey
(Beresford et al., 2001).
Since the early 1900s there has been a remarkable increase in the industrial
production of cheese. Because, hygiene is the most important criterion in the large scale
production (Mäyra-Mäkinen et al.,1998). For this reason, pasteurized milk is used.
Therefore, natural LAB flora contained in the milk is lost. Consequently, in order to
make cheese from pasteurized milk, an external LAB source is needed. This source
includes predefined strains of LAB and are called starter strains. In Turkey there has
been no starter strain developed as yet that could represent our native LAB flora. This
prompted us to collect LAB from the regions where traditional cheese making is still
dominating. Traditionally, raw milk of cow, goat and sheep are fermented by the help of
naturally occurring indigenous LAB. Beside the technological parameters like curd
handling and cooking temperature, the quality of cheese is mainly dependent on the
microbial associations within the respective region. Therefore, the LAB flora of
traditional cheese making can be taken as the basis of starter strains with unique
characteristics. In order to prevent the loss of microbial diversity and loss of wide range
of cheese variety, it is very important task to build up LAB collections.
�Çömlek Peyniri� is one type of traditional cheese that is very common in central
Anatolia. It has been produced from raw cow or sheep milk for many millennia.
Although production recipes change from one village to another, and even among

2
personal applications, generally Çömlek Peyniri making process include the following
steps below (Figure 1.1.). On the other hand, industrial production of cheese (Figure
1.2.) relies exclusively on the use of specially selected cultures which are carefully
maintained and subcultured.
Figure1.1. Flow sheet of �Çömlek peyniri� making process
clarification
Raw milk
Heating Addition of commercial rennet
Incubation 1- 2 h until cloting is formed
Pressing Whey expulsion
Size reduction; Cutting and
grinding
With stone 24h
salting
Transfer to pot as tightly
ripening 3-4 month / pot is embeded in special kind of sand (kisir) in upside position
Raw milk
Clarification
Addition of CaCl2 20 g 100 L-1 cheese milk
Figure 1.2. Flowsheet of
Standardisation of fat ratio
3
14-16 g 100 g-1 NaCl 15-16 °C / 6-12 hours
12-15 °C 30-60 days
Pressing and molding
Salting
Cooling
Packaging
Ripening
Storage at 5 °C
15-20 sec./ 72-74 °CPasteurisation
Cooling 30-32 °C
Addition of starter culture 1-2 g 100 g-1 mesophilic culture
Renneting
Cutting into 1-3 cm cubes
Draining
�Beyaz peynir� manufacturing ( Hayaloglu et al., 2002).

4
For the identification of novel starter strains, working with fresh cheese is very
important because fermentation occurs at the beginning. Strains participate in
fermentation process diminish immediately after fermentation. It is reported that at the
fermentation step, starter strain amount may reach up approximately 109 colony forming
units (cfu) per g of cheese. During ripening, however, the number of starter cells
decreases about two orders of magnitude (Beresford et al., 2001).
There have been many reports about the isolation of starter LAB from traditional
cheese (Requena et al.,1991; Parente et al.,1997; Cogan et al., 1997; Giraffa et al.,
1999; Pérez et al., 2000; Lopez Diaz et al., 2000; Coppala et al.,2000; Menéndez et al.,
2001; Proudromou et al.,2001 ;Alonso-Calleja et al., 2002; Manopulou et al., 2002;
Mannu et al.,2002; Bouton et al., 2002).
European Union has developed a project under ECLAIR Programme, AGRE-0064
for the isolation of new starter cultures from traditional cheese and fermented milk
accross Europe. This project involved 10 laboratories in 7 countries (Portugal, Spain,
Italy, Greece, France, The Netherlands and Ireland). One of the assumptions which was
made before this project began was that the LAB in these cheeses would be different
from those that have been in use as starters. A total of 4,379 strains of LAB were
isolated and characterized from 33 products. More than 90% of these isolates have been
characterized and cataloged (Cogan et al., 1997) .
Traditional LAB flora of Turkey still waits for scientific attention and because of
uncontrolled industrialization, the folkloric knowledge in cheese making could be lost
in the near future. Therefore, biodiversity of LAB must be characterized and the isolates
should be preserved for long term use. In this study it was thus aimed to isolate LAB in
Capadoccia region.

5
CHAPTER 2
STARTER LACTIC ACID BACTERIA LAB are widespread in nature, their nutritional requirements are very complex.
Hence, they predominate habitats that rich in carbohydrates, protein breakdown
products, vitamins and environments with low oxygen. This confirms the prevalence in
dairy products (Stiles and Holzapfel, 1997).
Generally, lactic acid bacteria (LAB) can be defined as Gram positive, non-spore
forming, catalase negative, devoid of cytochromes, acid tolerant, and facultative
anaerobe group that produce lactic acid as the major end-product during fermentation of
carbohydrates. According to carbohydrate metabolism, they can be divided into two
main groups:
1. Homofermentative LAB (produce mainly lactic acid).
2. Heterofermentative LAB (produce lactic acid, carbon dioxide, ethanol and/or
acetic acid).
This classification is originated from metabolic routes that organisms used and
resulting end product (Figure 2.1). While homofermentives use glycolysis (Embden-
Meyerhof Pathway), heterofermentives use the 6-phosphogluconate/phosphoketolase
Pathway (Garvie, 1984).
Although LAB are comprised of 11 genera, only 6 of them are dairy associated.
Theese are Lactococcus, Enterococcus, Streptococcus, Leuconostoc, Pediococcus, and
Lactobabillus. (Axelsson, 1998; Garvie , 1984)
Cheese microflora is further divided into two groups. Primary group includes
starter flora which refer to stater LAB and secondary group includes non starter lactic
acid bacteria (NSLAB), propionic acid bacteria (PAB), smear bacteria, moulds and
yeasts (Beresford et al., 2001). In this study, it was focused on starter LAB. Starter
strains in industrial terms can be defined as isolates which produce sufficient acid to
reduce the pH of milk to <5.3 in 6 h at 30- 37 °C (Beresford et al., 2001).

6
Heterofermentative LAB Homofermentative LAB
Glucose
Glucose�6�phosphate
6-phosphogluconate fructose-6-phosphate
Figure 2.1. Glucose utilization metabolic pathways of LAB
Xylulose-5-phosphate
Acetyl phosphate
acetate ethanol
Glyceraldehydes phosphate
P.enol pyruvate
pyruvate
Lactic acid
LDH
Dehydroxy acetone phosphate
CO2
D-ribulose-5-phosphate Fructose-1,6-diphosphate
7
2.1. Main Groups of Lactic Starters in Cheese Industry
In dairy industry, starter cultures can be divided into three groups as;
1. Mesophilic starter cultures
2. Thermophilic starter cultures
3. Artisanal starter cultures
Each of them can be divided futher: undefined cultures, in which number of
strains is unknown, and defined cultures which are composed of a known number of
strains (Axelsson, 1998). On Table 2.1. some defined starter species were shown.
2.1.1. Mesophilic Starter Cultures
Mesophilic group of LAB have an optimum growth temperature at 30 °C. They
are composed of species which belong to the two genera, Lactococcus and
Leuconostoc. Lactococcus lactis ssp lactis, Lactococcus lactis ssp. cremoris which are
acid producers and Lactococcus lactis ssp. lactis var. diacetylactis, Leuconostoc lactis
, Leuconostoc cremoris which are flavor producers. According to the nature of flavor
produced (citrate positive strains), mesophilic cultures can be divided into 4 group;
1. O type, containing only L. lactis ssp. lactis and L. lactis ssp. cremoris.
2. D type, containing citrate fermenting species as flavor producers only L. lactis ssp.
lactis var. diacetylactis.
3. B (or L) type, containing citrate fermenting species as flavor producers only
Leuconostoc.
4. BD (or LD) type, containing both flavor producers as L. lactis ssp. lactis var.
diacetylactis and Leuconostoc.

8
Table 2.1. Examples of starters used for specific type of cheeses (Marshall et
al.,1984).
CHEESE PRODUCT MICROORGANISMS ADDED
1 Parmesan, Romano Mixture of Lactobacillus bulgaricus and
Streptococcus thermophilus
2 Cheddar L. lactis ssp. lactis; L. lactis ssp. cremoris L.
lactis ssp. lactis var. diacetylactis.
3 Swiss, Emmental
Mixture of Lactobacillus bulgaricus (or
Lactobacillus lactis or Lactobacillus
helveticus) and Streptococcus thermophilus
and Propiani bacterium shermanii
4 Provolone Mixture of heat-resistant Lactobacillus
species and Streptococcus thermophilus
5 Blue, Gogonzola,
Roquefort, Stilton L. lactis ssp. lactis plus Penicillium roqueforti
6 Camembert Lactococcus spp. plus Penicillium camembert
(caseirolum)
7 Brick, Limburger
Mixture of Streptococcus thermophilus and L.
lactis ssp. cremoris; mixture of Streptococcus
thermophilus and Lactobacillus bulgaricus;
mixture of L. lactis ssp. lactis and
Streptococcus thermophilus
8 Muenster Mixture of Streptococcus thermophilus and
Lactobacillus species
9 Gouda, Edam L. lactis ssp. lactis , L. lactis ssp. cremoris
Leuconostoc
10 Mozzeralla Mixture of heat-resistant Lactobacillus
species and Streptococcus thermophilus
11 Cottage cheese, Cream
cheese
L. lactis ssp. lactis or L. lactis ssp. cremoris ;
mixture of L. lactis ssp. lactis or L. lactis ssp.
lactis and L. lactis ssp. lactis var.
diacetylactis. (or Leuconostoc species)

9
Mesophilic starter cultures are used in the manufacture of broad range of cheese
type. It was estimated that two thirds of the milk fermentation is mesophilic type. The
dairy industry is concerned with strains which ferment milk as rapidly as possible. This
appears to be a property of Lactococci. Strains of other species will lower the pH of
milk at a much slower rate (Cogan, 1996).
After fermentation of milk, the autolysis of the lactococci is occured during
following ripening times. Autolysis of starter cells is due to a muraminidase(Beresford
et al., 2002). This could be originated by NaCl concentration and associated salt in
moisture values of cheese(Beresford et al., 2002). Autolysis of cells results release of
intracellular enzymes into cheese and cause free amino acid production. So, this
initiates a number of flavor reactions. If starter bacteria reach too high a population or
survive too long, flavor defects such as bitterness could become a problem.
2.1.2. Thermophilic Starter Cultures
They are used in making cheese types where high cooking temperatures are
required (Emmental, Gryere, Grana, Comte). The thermophilic LAB belong to two
genera which are Lactobacillus and Streptococcus. Although Lactobacillus is a large
group that consists of 64 species with both homo- and heterofermentative characteristic.
Only a few of them are involved in milk fermentation. The commercial lactobacilli
starters mainly consist of Lactobacillus delbrueckii ssp bulgaricus, Lactobacillus
delbrueckii ssp lactis and Lactobacillus helveticus which are obligate fermenters.
On the other hand, Streptococcus thermophilus is only one dairy and food
associated species among 27 Streptococcus species. Until recent times, it was described
as Streptococcus salivarus ssp. thermophilus because it was observed to have a very
close relationship with Streptococcus salivarus. After a more detailed DNA
hybridization analysis, raised it to species level again (Schleifer et al., 1991).
Str. thermophilus, Lb lactis, Lb. bulgaricus do not metabolize galactose and so
lactose metabolism by Str. thermophilus results in the galactose accumulation in
medium. Therefore, it is suggested that only the galactose fermenting lactobacilli should
be used as starter together with Str. thermophilus (Mäyra-Mäkinen and Bigret ., 1998).

10
2.1.3. Artisanal or “Natural” Starter Cultures Artisanal cultures are derived from using part of a previous batch of fermented
product to inoculate a new batch. For instance, Kopanisti which is a Greek cheese
variety, is produced by mixing cheese from a previous batch with drained curd of new
batch. For some Italian and Swiss cheese varieties, whey from the previous day�s
manufacture is incubated in selective conditions such as high incubation temperature
and low pH to obtain �whey starter�. It is obvious that their composition is very
complex, relatively variable and often undefined. Several types of species may be
present. Although their variable performance contrasts with current trends in starter
technology where consistent performance is required, their replacement by defined
starter systems has sometimes results in less flavor (Axelsson,1998)
In this group, beside the classical starters, Enterococcus species are often present
in significant numbers. They have some advantages, because they produce acid rapidly,
withstand the cooking temperatures, have high tolerance to salt. The main disadvantages
are that they are fecal origin and some strains are considered to be pathogenic.
However, it was concluded that enterococci represent the dominant microflora of raw
milk traditional cheeses and should be used as starter in order to produce the typical
characteristic (Lopez-Diaz et al., 2000). Enterococcus feacalis has been used to
accelerate ripening and improve organaleptic characteristics of cheeses ( Neviani et al.,
1982; Hegazi , 1989a; Villani and Coppala,1994; Tzanetakiset et al., 1995). It has been
found that they have beneficial effects on the growth of other LAB species because of
their intense proteolytic activity (Lopez-Diaz et al., 2000).
So far, Pediococci have not been used in any dairy starters although they may be
found in ripened cheese samples. Only two species Pediococcus pentosaous and
Pediococcus acidilactici are found in dairy products. Recently, lactose positive
pediococci have been used instead of streptococcus thermophilus. Because
streptococcus thermophilus is much more susceptible to bacteriophage infections
(Garvie,1984)

11
Table 2.2. Starter bacteria used in Turkish �beyaz peynir� (Hayaloğlu et al., 2002)
Microorganisms added References
Lactococcus lactis subsp. cremoris + Lactocococcus lactis subsp. lactis +
Leuconostoc cremoris
Ucuncu (1971); Celik(1982)
Enterococcus durans 41770 + Lactobacillus delbrueckii subsp.bulgaricus CH2
Tunail (1978)
Lactococcus lactis subsp. cremoris +Lactobacillus casei + Lactobacillus plantarum Ergullu (1980)
Lactococcus lactis subsp. cremoris + Lactocococcus lactis subsp. lactis
Kaymaz (1982); Tekinsen (1983),
Kurt(1991)
Lactococcus lactis subsp. cremoris +Lactocococcus lactis subsp. lactis + Lactocococcus
lactis subsp. lactis +Lb .casei
Yildiz,Kocak,Karacabey and Gursel(1989)
Lactococcus lactis subsp. lactis +Lactocococcus lactis subsp. cremoris +
Lactobacillus sake
Akgun(1995)
Lactocococcus lactis subsp. lactis +Lb .casei and/or Lb.plantarum
Ucuncu(1999)
Lactococcus lactis subsp. lactis +Lactocococcus lactis subsp. cremoris +
Lactobacillus helveticus
Gursoy,Gursel,Senel, Deveci, and Karademir(2001)
2.2. Starter Functions
2.2.1. Acid Production
LAB use carbohydrate fermentatively and produce lactic acid. Lactic acid
production leads decrease in pH . Fermentation of sugars that cause leading to pH
decrease is important for clotting of milk. Beside, increasing acidity initiates following
desirable reactions and changes such as whey expulsion. Because there is a correlation

12
between pH and whey expulsion from curd. Additionally, acid production has beneficial
effect on formation of texture, aroma and flavor (Ross et al.,2000)
2.2.2 Proteolytic Activity
Proteolysis is an important event that occurs during cheese ripening. The lactic
acid bacteria use the polypeptides. These polypeptides are generated by milk clotting
enzymes and by bacterial cell-wall proteins. Rennet which is the milk clotting enzyme,
is responsible for casein degradation. Because of the casein degradation peptides are
produced which are transported into the cell. In the cell, peptidases continue
degradation to produce smaller peptides and amino acids. It has been known that
aminoacid composition plays an essential role in the aroma of cheese (Wouters et al.,
2002)
2.2.3. Flavor Formation
The quality of cheese and other fermented food products is dependent on the
ability of flavor and aroma production of microorganisms which include starter culture.
Flavor compounds produced by LAB can be divided into two groups;
- The compounds in fermented milk.
- The compounds present mostly in maturated cheese.
First group consists of organic acids such as lactic acid and acetic acid, which are
produced by L. lactis ssp lactis and L. lactis ssp cremoris. Second group consists of
acetaldehyde, diacetyl, acetoin, and 2-3 butylene-glycol which are produced by L.
lactis ssp. lactis biovar diacetylactis and Leuconostoc species from citrate present in
milk. It has been reported that these aroma compouns might be produced to avoid to
pyruvate accumulation in the cell. Moreover, improved knowledge of proteolysis and
peptidolysis in cheese, analysis on enzymatic systems of LAB and evaluation of
different strains, will provide better understanding between flavor development and
starter activity. A number of different LAB have been evaluated for their ability to
degrade amino acids to aroma compounds. L. lactis subsp. lactis and L. lactis supsp.
cremoris, Lactobacillius lactis, Lactobacillius helveticus, Lb. bulgaricus, Lb. casei are
capable of degrading methionine to methonethiol, dimethyledisulphide (DMDS) and
dimethyltrisulphide (DMTS)(Yvon et al., 2001)

13
2.2.4. Exopolysaccharide Formation
Many strains of LAB produce exopolysaccharides (EPS). These compounds can
be produced as capsules(Cps) which are tighyly attached to the bacterial cell wall ,or as
a loose slime (ropy polysaccharide) which is liberated into the medium (Mayra,
Makinen and Bigret, 1998). EPS could be composed of one type of sugar monomer
(homopolysaccharides) or consist of multi type of monomers (heteropolysaccharides)
and coud be substituted organic or inorganic molecules(Broadbent et al.,2001).While
several species of LAB (L. lactis ssp. lactis, Lb. delbrueckii ssp. bulgaricus, and S.
thermophilus ) produce heteropolysaccharides, homopolysaccharides are produced by a
few organisms such as Leu. mesenteroides.
Due to the viscocity enhancing and stabilizing properties, EPS producing starter
cultures are beneficial for industrial usage. They contribute texture development. It has
been reported EPS producing starter strains that enhance the functionality of low fat
cheese (Broadbent et al., 2001).
2.2.5. Antimicrobial Property
LAB have been used as natural preservatives because of their antimicrobial
capacity
a. Through fermentation products: Antimicrobial activity can be exerted through
the reduction of pH or production of organic acids (lactic acid, acetic acid), CO2,
reuterin, diacetyl, 2-pyrorelidone, 5-carboxylic acid (PCA) (Mayra, Makinen and
Bigret, 1998). Effective starter culture activity can prevent the pathogen and
contaminant growth that may occur during cheese making process.
b. Through bacteriocins: Bacteriocins can be defined as protein antibiotics of
relatively high molecular weight and mainly affecting the same or closely related
species. Bacteriocins of LAB are classified into four group (Table 2.3.). It is known
that LAB are generally regarded as safe microorganisms and so are their bacteriocins.
Thus, these bacteriocins can potentially be used to control the growth of spoilage and
pathogenic organisms in food (Cardinal et al.,1997). Bacteriocin producing lactococcal

14
strains have been used successfully as starter cultures for cheesemaking in order to
improve the safety and quality of the cheese. In recent work, 79 wild lactococci have
been studied and 32 of theese have been found to be antimicrobially active ( Wouters et
al., 2002). In 17 of these strains, the well-known antimicrobial peptide nisin has been
found, whereas the others produced diplococcin , lactococcin or a unidentifed
bacteriocin-like compound. Moreover, the use of nisin as an effective preservative in
processed cheese has been widely accepted.
Table 2.3.Classes of bacteriocins Produced by LAB.
Class Subclass Description
Class I Labntibiotics
Small( <10kDa),heat stable, non-lanthionine
containing membrane-active peptides
II a Listeria- acttive peptides
II b Two- peptide bacteriocins
Class II
II c Thiol-activated peptides
Class III Large (>30 kda) heat-labileproteins
Class IV Complex bacteriocin:protein with lipid and /or
carbohydrate
2.3. Commercial Production of Dairy Starter Cultures
Starter cultures are essential for industrial production of all kinds of cheese.
Before adding to milk, cultures have been pre-grown in milk or milk-based media.
Depending on the cheese type, the inoculation volume varies from 0.2% to 2% of
volume of milk (Cogan,1996). Each year ~12.5 x 10¹⁰ tons of milk are used in order to
produce ~12.5 x 10⁶ tons of cheese worldwide. If it is assumed that 0.5% (v/v) in ratio
inoculums used for each type of cheese, it indicates that ~6.3 x 10⁸ L starter is required.
When it is considered bulk starter cultures contain ~1 x 10⁹ cells/ml, it can be easily
understood that ~6.3 x 10²⁰ cells are required worldwide. Commercial production of
dairy starter cultures refers this mother culture.

15
1. Liquid Starter Culture. This is a traditional method which is based on the
following procedure. First the starter is cultivated as a liquid stock culture, and then
sufficient volume is obtained by subculturing. This method has advantages, if the
production area and laboratory that provide culture is close. On the other hand,
contamination risk due to the number of inoculations, phage infection could be faced.
Strains which are kept in liquid media can easily loose its starter properties also.
2. Air Dried Culture. This method is based on the principle of adsorption of liquid
cultures on a special material and drying by pulverization under the vacuum. However,
during the vacuum pulvarization most of the cells can die.
3.Freeze Dried Starter Cultures (Lyophilization). Lyophilization is a process in
which the product is first frozen so that a matrix is formed in which the solvent is
crystallized and separated from its solute. Solvent is then removed by sublimation and
desorption. Despite the advantages as easy to use, significant amounts of cell injury and
death occur.
4. Freeze-Dried Concentrated Starter Culture. This method aims of direct
inoculation of the milk. Freeze-dried concentrated cultures are being used extensively in
Europe while in US has limited usage. This is because of that this type of starters
require more time to reach log phase of growth.
5. Frozen-Concentrated Starter Cultures. Frozen concentrated starters usually
contain 1010 to 1011 cfu/g. In this method, the most critical point is rate of thawing in
order to minimize cell injury. It is important to thaw the samples rapidly as possible.
2.4. Genetically Modified Lactic Acid Bacteria and Culture Improvement
Due to the considerable economical importance of LAB, culture improvement
studies have been accelerated in recent years. Progress in gene technology has allowed
this development. Modification has been achieved by introducing new genes to improve
bacteria that better fitted to technological processes or enhanced organoleptic properties.
It is expected that better understanding of the genetics and physiology of LAB will give
rise to better strain use, selection and improvement(Ross et al.,2000)
Construction of bacteriophage resistant strains is very important. The resistance
mechanisms are often carried out by plasmids and transposons. Some high level
resistance plasmids were shown to carry more than one resistance mechanisms (Coffey
et al.,1994).

16
In some cases , the starter strains have been engineered for autolysis. These cells
will lyse at an appropriate moment during cheese making. Lysis allows the release of
many enzymes into cheese matrix that leads to degradation of peptide to amino acids.
These free amino acids are the precursors of aromatic substances (Renault, 2003).
Moreover, it is possible to modify genes or transfer genes from food LAB into
other lactic starter strains. For instance, a heterologous catabolic glutamate
dehydrogenase (GDH) gene from Peptostreptococcus asaccharolyticus has been
introduced into L. lactis to allow the production of alpha-ketoglutarate from glutamate.
This is an amino acid present at high levels in cheese. Amino acid degradation requires
alpha-keto acid as the amino group receptor. So that, availability of alpha-keto acid is
limiting factor for conversion of amino acids to aroma compounds. On the other hand
GDH-producing strains produced a higher proportion of carboxylic acids that are major
aroma compounds. Therefore, they not need alpha-ketoglutarate supplementation
(Renault, 2003).

17
CHAPTER 3
IDENTIFICATION METHODS FOR DAIRY BACTERIA
3.1. Phenotypic Methods
In order to identify LAB, phenotypic methods which include morphological
examinatinations, physiological and biochemical tests are widely used.
3.1.1. Morphological Methods
Microscopic examination is first criteria that provide information about genus
level, purity of lactic acid bacteria. There are some staining methods in order to
differentiate the cells such as simple stain, gram stain, acid fast stain, endospore stain,
capsule stain. The most important and widely used method is Gram staining. On the
basis of the reaction to Gram stain, bacteria can be divided into two large groups; Gram
positive organisms and Gram negative organisms. LAB belong the Gram positive
group. Rounded or spherical cells are called cocci, elongoted rod shaped cells are
called bacilli, ovoid cells, intermediate in shape between cocci and bacilli are called
cocobacilli, cell division in two perpendicular directions in a single plane that lead to
tetrad formation are called tetracocci (Garvie, 1984).
3.1.2. Physiological and Biochemical Tests
Orla-Jensen (1919) achieved basis of classification of LAB. Their work has had a
large impact on the systematic of LAB. It is obvious that there have been several
revisions as considerable extent for classification of LAB. However, the basis of
classification is remarkable unchanged and includes following physiological and
biochemical criteria (Stiles and Holzapfel, 1997).
1.Mode of glucose fermentation (homo or heterofermentation)
2.Growth at certain �cardinal� temperatures (e.g. 10 °C and 45 °C)
3. Range of sugar utilization
Therefore, these characters are still very important in current classification of
LAB.

18
An important character used in differentiation is mode of glucose fermentation
under standard conditions. Standard conditions refer to nonlimiting concentration of
glucose, growth factors, limited availability of oxygen .Under these conditions, LAB
can be divided into two groups.
1. Homofermentative. Glucose is converted almost quantitatively to lactic acid
2. Heterofermentative. Glucose is fermented to lactic acid, ethanol, acetic acid,
and carbon dioxide.
Another characteristic for primarily identification is growth at certain
temperatures. At this point, lactococci can not grow at 45 ºC while enterococci can grow
both at 45 °C and 10 °C. On the other hand, Steptococci do not grow at 10 ºC.
Additionally, growth in different salt concentration provide differentiation
especially cocci shaped starter lactic acid bacteria. As it is presented Table 3.1, this
character is used as useful tool in order to differentiate Lactococci, Streptococci and
Enterococci. Moreover, other characteristics which are arginine hydolysis, acetoin
formation, bile tolerance, type of hemolysis, production of exopolysaccharides, growth
factor requirements, presence of certain enzymes, growth characteristic in milk and
serelogical typing are used biochemical characterization. Relatedly, Lc. lactis subsp.
cremoris is dintiqueshed from L. Lactis ssp. lactis by inability to grow at 40 ºC, growth
in 4% salt, hydrolyse arginine, ferment ribose (Axelson, 1998).
Table 3.1. Differential characteristics of the Cocci shaped LAB found in starter
Cultures (Cogan, 1996).
Growth Isomer of lactate
10 ºC 45 ºC 6.5% NCl
Lactococcus sp. L + - -
Leuconostoc sp. D + - -
S. thermophilus L - + -
Enterecoccus sp. L + + +

19
3.2. Genotypic Methods
Identification of bacteria isolated from natural microflora involved in cheese
fermentation has been limited by the complexity of the bacterial associations (Garvie,
1984). Additionaly, bacterial population involved has smilar nutritional and
environmental requirements. At this point, the applications of molecular methods
resolve identification problems. Nucleic acid probe technology could be an alternative
for faster and more reliable differentiation. Several species-specific probes have also
been designed.Furthermore, 16S or 23S rRNA targeted oligonucleotides have been used
for the specific identification of LAB. It is important point that it is now possible
identify various LAB in fermented food without cultivation step at species level within
one working day (Scheifer, 1995). Additionally, DNA restriction fragment analysis and
ribotyping have been used to distinguish LAB. Especially, polymerase chain reaction
based methods (PCR-RFLP, REP-PCR, PCR Ribotyping, and RAPD), pulsed-field gel
electrophoresis can be used as main new molecular tools (Farber,1996 and Olive, 1999).
Comparison of procedural steps on Table 3.2 provided better understanding of their
principle.

20
Table 3.2. Procedural steps of main genotypic methods.
RAPD PFGE REP-PCR AFLP DNA Sequencing
PCR Amplification with a single
primer
Embed organisms in agarose plug
PCR Amplification with REP or
ERIC primers
R.E. Digestion PCR Sequencing Reactions
Gel Electrophoresis
Protease Digestion
Gel Electrophoresis Linker Ligation Gel
Electrophores
Gel Staining R.E. Digestion Gel Staining Selective PCR Computer aided
sequence analysis
Interpretation Electro-phoresis Interpretation
Gel E. Through an Automated DNA Sequencer
Interpretation
Interpreta-tion Gel Interpretation
In the last years, characterization of LAB from various sources is maintained by
combining of phenotypic methods (physiological and biochemical tests) with molecular
methods. Therefore, characterization of starter culture at the strain level could be
possible. This is very useful from technological aspects of dairy industry. Hebert et al.,
has been characterized natural isolates of Lactobacillus by respectively, physiological
and biochemical test , SDS- PAGE of whole cell proteins, and sequencing of variable
region (V1) of the 16S ribosamal DNA in 2000.
For another recent work, lactic acid bacteria from artisanal Italian cheese have
been characterized by combining use of PCR 16S-23S rDNA and sequencing. In this
study, also a few main phenotypic methods such as salt tolerance, growth at different
temperatures and production gas from glucose tests have been performed (Ayad, et al.,
2001).
For another work, DNA fingerprints of thermophilic lactic acid bacteria
generated by repetitive sequence based polymerase chain reaction have been applied
(Uriaza et al. 2000). They described BOX- PCR base method for characterization.

21
Ventura et al., studied Lactobacillus johnsonii by using PCR based methods and
pulsed field gel electrophoresis (PFGE). They used enterobacterial repetitive intergenic
consensus PCR (ERIC-PCR), Rep-PCR, amplified fragment length polymorphism,
PFGE. It was considered that PCR fingerprinting methods such as ERIC-PCR, Rep-
PCR and TAP-PC are rapid and easy to perform.
3.2.1. Randomly Amplified Polymorphic DNA (RAPD)
RAPD refers to randomly amplified polymophic DNA which is one of the genotypic
methods that based on the polymerase chain reaction. In the PCR, two synthetic
oligonucleotide primers are needed to initiate synthesis of new DNA strand .RAPD is
very simple and quick genotypic method (Farber, 1996). The PCR that is used for
RAPD differs from common PCR because of the some aspects,
1. The primers that used are very short.
2. Sequences are chosen at random.
3. Annealing temperature for RAPD is lower than a normal PCR.
3.2.2. PCR Ribotyping
In prokaryotes, the three genes coding for rRNA (16S, 23S and 5S rRNA) are
separated by spacer region. When it is considered that most bacterial genera contain
multiple copies of the operon for rRNA, hence the spacer regions within a single strain
may differ in length and or sequence.
3.2.3. PCR -RFLP
It is based on the principle that related sequences of nucleotides can be compared
by exposing them to the same restriction endonucleases. Electrophoresis and staining of
fragments from a given sequence yields a characteristic fingerprint, sot that different
sequences can be compared by comparing their fingerprints (Figure 3.1)
3.2.4. Rep-PCR
In this method, PCR is used to generate fingerprints by copying particular
sequences in chromosome (rather than random sequences). Rep PCR refers to repetitive

22
extragenic palindromic sequence that occurs in different strains. Rep-PCR yields DNA
molecules of various sizes. When they are separated by gel electrophoresis, these
molecules give a characteristic fingerprint.
3.2.5. Pulsed Field Gel Electrophoresis
In this method, the genomic DNA is cutted with a restriction enzyme then
fragments are separated on an agarose gel. It provides resulation at subspecies and strain
level. Firstly, live cells are embedded in agarose and then lysis is achieved. Hence,
genomic DNA is digested with infrequent cutting restriction enzymes. This method
provide alternative electrical field with predetermined intervals. Direction of electrical
field is changed at these intervals. These intervals are called pulse times. So, based on
this property higher molecular weights DNA fragments could be separated with this
method.

23
Figure 3.1. Polymease Chain Reaction-Restriction Fragment
Length Polymorphism (Farber, 1996)

24
CHAPTER 4
MATERIALS AND METHODS 4.1. Materials
4.1.1. Chemicals
The chemicals used in the study are listed in Appendix A.
4.1.2. Samples
In this study, twenty cheese samples were analysed. Although nineteen of these
were collected from seven different villages of Nevşehir, only one sample was obtained
from Dinar/Afyon. Majority of the samples were fresh cheese and the rest of them were
ripened cheese. Moreover, some samples were obtained from different steps of cheese
making process. When it is considered the type of cheese, �Çömlek Peyniri� was focus
of the study. Beside, two of traditional �beyaz peynir� was also be analysed (Table
4.1).

25
Table 4.1. Sample types and location
Sample
No Location Age of sample Source Type of milk
S1 Sulusaray 2 months pot cow
S2 Sulusaray 3 months pot cow
S3 Sulusaray 4 days Pressing step cow
S4 Sulusaray 1 day Pressing step ewe
S5 Çat 3 months pot cow
S6 Çat 3 months pot cow
S7 Çat 15 days pot cow
S8 Çat 2 days After salting cow
S9 Çat 2 months pot cow
S10 Nar 3 months pot cow
S11 Üçhisar 2 months White brined
cheese cow
S12 Üçhisar 1 day From pot pot
S13 Üçhisar 2 months White brined
cheese cow
S14 Üçhisar 2 months pot cow
S15 Ayhanlar 1 week After salting cow
S16 Göre 3 months pot ewe
S17 Çardak 1 day Before pressing ewe
S18 Çardak 2 months pot cow
S19 Çardak 1.5 months From plastic
storage material cow
S20 Dinar 3 months From nylon
storage material cow

26
4.1.3. Reference Strains
Reference strains used in the study as fallows:
1. Lactococcus lactis subsp. lactis CECT 4432 which was provided by Professor
Dr. Frederico Uruburu, Collecion Espanola de Cultivos Tipo (CECT).
2. Lactococcus lactis subsp. lactis biovar. diacetylactis CECT 4431 provided by
Professor Dr. Frederico Uruburu, Collecion Espanola de Cultivos Tipo (CECT).
3. Lactococcus lactis A 216 provided by Professor Dr. Sevda Kõlõç, Department
of Dairy Technology, Ege University.
4. Leuconostoc mesenteroides subsp. mesenteroides CECT 219T provided by
Collecion Espanola de Cultivos Tipo (CECT).
5. Lactobacillus curvatus DSM 8768 was provided by Professor Dr. Şebnem
Harsa, Biotechnology and Bioengineering Department, Izmir Instute ofTechnology.
6. Lactobacillus casei subsp. casei NRRL-B 1922 provided by Professor Dr. L. K.
Nakamura, National Centre for Agricultural Utilization Reseach.
7. Lactobacillus delbrueckii subsp. lactis NRRL-B 735 provided by Professor Dr.
L. K. Nakamura, National Centre for Agricultural Utilization Reseach.
Finally, following strainswere provided by Dr. Ömre Sõkõlõ and Prof. Dr. Mehmet
Karapõnar, Foog Engineering Department, Ege University.
8. Enterococcus faecium CECT 4102
9. Enterococcus faecalis CECT 184
10. Enterococcus gallinarum CECT 970
11. Enterococcus casselifavus NRRL- B 3502
4.2. Methods
4.2.1. Isolation of Lactic Acid Bacteria
4.2.1.1. Culture Media and Growth Conditions
Samples were analysed by the dilution pour plate method. For this purpose, 10
grams of each sample were weighed aseptically and homogenised in 90 ml of sterile
quarter-strength Ringer�s solution in a hand made stomacher. Then, sequential decimal
27
dilutions of the homogenate were obtained. One ml aliquot of the 10-4, 10-5, 10-6, and
10-7 dilutions were used for the isolation of LAB. Following culture media and
conditions (pH and incubation temperatures) were used. Every sample were plated into
these three media.
1. MRS agar (pH 6.2-6.8) ; isolation and enumeration of lactobacilli
2. M17 agar (pH 7.15) ; isolation and enumeration of streptecocci and lactococci
3. Slanetz Bartley Medium (pH 7.2) ; isolation and enumeration of enterecocci
MRS plates were incubated under microaerophilic conditions using gas generating
kit (Oxoid). All plates were incubated for 3 days at 30 ºC. After the incubation, the
plates with colony forming units (CFU) ranging from 30 and 300 were selected for
enumeration. After the colony counting , the numbers were expressed in logaritmic
scales (logCFUg-1). Standart deviations and mean values were calculated using
Microsoft excel computer programme.
4.2.2. Phenotypic Identification
4.2.2.1. Selection of the Isolates According to Their Fermentative Properties
Colonies were taken from the plates at 10-6 and 10-7 dilutions and were transferred
into 10-12% sterile skim milk broths. For this purpose, 120 g skim milk powder were
weighed and the volume adjusted to 1 L with deionized water and the pH was adjusted
to 6.7-6.8. The solution was strelized for 10 min at 113 ºC. Before use, skim milk broths
were then preincubated for 24h at 37 ºC for control of sterility. Selected individual
colonies were inoculated into the skim milk broths and incubated for 24 h at 30 ºC.
During the incubation, changes in the appearence of the skim milk were monitored
periodically. When proper coagulation was achived, the incubation was terminated.
Another 24 h incubation was allowed for those cultures which did not coagulate milk
during the first 24 h. Isolates, which were able to coagulate milk even after 48 h
incubation, were taken presumptively as homofermentative LAB. Others which show
undesirable texture defects such as serum expulsion, and gas bubbles were eliminated.
28
4.2.2.2. Morphological Examination
4.2.2.2.1. Simple Staining
Isolates which produced coagulation were examined morphologically under the
light microscope. At this point, simple staining method was used. This staining
technique was consisted of following steps;
1. Transferring a loopfull culture broth onto microscope slide.
2. Drying.
3. Fixation by exposure to flame 2-3 times for 1-2 sec.
4. Staining with methylene blue for 1-2 min.
5. Washing under the tap water.
6. Drying by blotting onto cotton towels and drying.
After simple staining, cell shape and arrangements were examined. Additionaly,
the purity was checked. Samples showing heterogenous cell morphology were
eliminated. Isolates which have homogenous cell morphology were classified as cocci
shaped and rod shaped. Cultures which were grown Slanetz Bartley medium were then
transferred into Streptococcus cultivation broth. Cultures grown in M17 medium were
transferred into M17 broths and cultures grown in MRS medium, transferred into both
M17 and MRS broths. They were thus activated by subculturing at least for 3 times.
4.2.2.2.2. Colony Morphology
Isolates were further purified by streaking repeatedly on MRS agar plates, and the
colony morphologies (color, shape and size) were examined by eye.
4.2.2.2.3. Gram Staining
The Gram status of the isolates was determined by light microscopy after the
Gram staining. LAB are known to be Gram positive and the blue-purple color indicates
the Gram positive nature of the bacteria.
Cells from fresh cultures have to be used for Gram staining. For this reason, 24 h
cultures were grown in MRS broths at 30 ºC. Cultures were then transferred aseptically
into 1.5ml eppendorf tubes. After centrifugation for 5 min at 6 000 rpm, and most of the
29
supernatant was removed. The cells were resuspended in the remaining approximately
10 µl phase and cells were then Gram stained by following procedure:
1. Transferring 10 µl cell suspension onto microscope slide.
2. Drying in open air.
3. Fixation by exposure to flame 2-3 times for 1-2 sec.
4. Primary straining with crystal violet for 1 min.
5. Washing excess stain under the tap water.
6. Applying of Gram�s iodine mordant for 1 min.
7. Washing excess mordant.
8. Applying acetone /or alcohol (95%) decolorizing agent for 6 sec.
9. Applying counter stain (safranin) for 30 sec.
10. Washing excess safranin.
11. Drying by blotting onto cotton towels.
4.2.2.3. Catalase Test
Catalase is an enzyme produced by many organisms and therefore the lack of
catalase is a significant diagnostic characteristic. The enzyme breaks down hydrogen
peroxide into water and oxygen as below and gas bubbles are observed. The formation
of gas bubbles therefore indicates the presence of catalase enzyme
2 H2O2 2 H2O + O2
LAB were known as catalase negative. Hence, in order to confirm catalase status
of the isolates, catalase test was performed. For this purpose, overnight cultures of
isolates grown on MRS agar plates at 30 ºC were used. Catalase activity was
investigated by dropping 3% hydrogen peroxide solution (one drop) onto randomly
chosen colony.
4.2.2.4. Long Term Preservation of the Isolates
Isolates showing homofermentative, Gram positive and catalase negative
characteristics were preserved in MRS broth medium which contained 20% (v/v)

30
gycerol as frozen stocks at -80°C. Glycerol stock samples were prepared by mixing 0.5
ml of overnigh cultures, and 40% glycerol.
4.2.2.5. Physiological and Biochemical Identification
4.2.2.5.1. Identification of Cocci
Each isolate was activated in 5 ml MRS broth for 24 h at 30 ºC before use.
Therefore, overnight cultures were used during all the identification procedures.
Physiological and biochemical identifications were performed according to the methods
and criteria of Sharpe and Fryer, (1969); Garvie (1984), Devriese et al.,(1995); Teuber
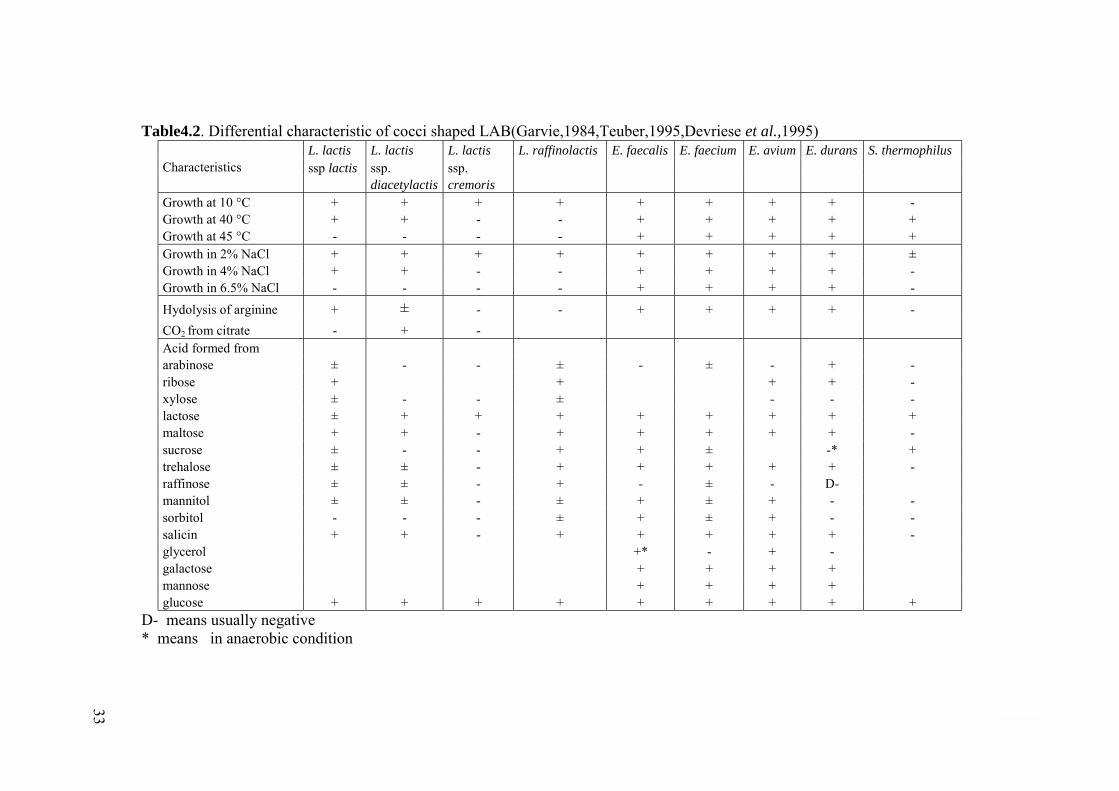
(1995). The characteristic used for the identification of cocci shaped LAB in this study
were presented (Table 4.2.). For all tests a negative control (non-inoculated media) was
also used and respective reference strains were also included in the experiments as
positive controls.
4.2.2.5.1.1. Gas Production from Glucose
In order to further define homofermentative isolates, CO2 production from glucose
test was performed. For this purpose, citrate lacking MRS broths and inverted Durham
tubes were used. Fifty µl of overnight cultures were transferred into the 8 ml test media.
After incubation for 5 days at 30 ºC, gas accumulation in Durham tubes was taken as
the evidence for CO2 production from glucose.
4.2.2.5.1.2. Growth at Different Temperatures
Fifty µl of overnight cultures were transferred into the tubes which contain 5 ml
temperature test media (Appendix C1 ). After inoculation , they were incubated for 7
days at 10 ºC, 40 ºC or 45 ºC . Cells growth at any of these temperatures was dedected
by the change in the color of the cultures, from purple to yellow.

31
4.2.2.5.1.3. Growth at Different NaCl Concentrations
Fifty µl of overnight cultures were transferred into the tubes which contain 5 ml
NaCl test media (Appendix C2). Isolates were tested for growth at 2%, 4% or 6.5%
NaCl concentrations. They were incubated for 7 days at 30ºC. The change of the color
from purple to yellow taken as the evidence for cell growth.
4.2.2.5.1.4. Arginine Hydrolysis and Gas Production From Citrate
In order to perform this test, 8 ml of Reddy broth (Appendix C4 ) and inverted
Durham tubes were used. Fifty µl of overnight cultures were inoculated into the Reddy
broth and were then incubated for 5 days at 30 ºC.
1. Arginine Hydrolysis : The cultures which utilize arginine, change the color of
the broth first to yellow due to the lactic acid production and to violet because of the
ammonia production (Cardinal et al.,1997). On the other hand, the cultures which do
not utilize arginine assume a deep-yellow color by producing lactic acid only.
2. Gas Prpduction from Citrate: The breakdown of the citrate results in production
of carbon dioxide. Gas accumulation in inverted Durham tubes indicated citrate
utilization.
4.2.2.5.1.5. Carbohydrate Fermentations
Isolates were also characterized on the basis of their sugar fermentation profiles.
All the reactions were performed by using 96-well microtitre plates. (Parante et al.,
1997 ; Urraza et al., 2000, López Díaz et al., 2000). Fifteen different sugars were used
(Appendix D1). For each test, strains were inoculated in 5 ml MRS broth (50ml/L), and
were then incubated for 24 h at 30 ºC in order to obtain overnight cultures. After this,
cultures were centrifuged for 10 min at 10 000 rpm. Pelleted cells were washed and
resuspended in MRS (without glucose) containing bromocresol purple as the pH
indicator. Forty µl of filter sterilized (0,22µm, Millipore) 10% sugar solutions were
pipetted into each well . On to the sugar solutions , 160 µl of suspended cells were
added. Thus, 2% final sugar concentration was obtained. Dublicate reactions were
prepared for each of the sugar fermentations experiment. After 24 h incubation at 30 ºC,
the results were read at 690 nm absorbance in an automated microtitre plate reader(Bio-

32
tek Instruments, Inc.). When the sugar fermentation was taken place, the color changed
from purple to yellow and turbidity was inceased. Glucose fermentation included to
positive control, and samples without sugar were used as negative control.
33
Table4.2. Differential characteristic of cocci shaped LAB(Garvie,1984,Teuber,1995,Devriese et al.,1995) L. lactis L. lactis L. lactis L. raffinolactis E. faecalis E. faecium E. avium E. durans S. thermophilus
Characteristics ssp lactis ssp. ssp. diacetylactis cremoris Growth at 10 °C + + + + + + + + - Growth at 40 °C + + - - + + + + + Growth at 45 °C - - - - + + + + + Growth in 2% NaCl + + + + + + + + ± Growth in 4% NaCl + + - - + + + + - Growth in 6.5% NaCl - - - - + + + + - Hydolysis of arginine + ± - - + + + + - CO2 from citrate - + - Acid formed from arabinose ± - - ± - ± - + - ribose + + + + - xylose ± - - ± - - - lactose ± + + + + + + + + maltose + + - + + + + + - sucrose ± - - + + ± -* + trehalose ± ± - + + + + + - raffinose ± ± - + - ± - D- mannitol ± ± - ± + ± + - - sorbitol - - - ± + ± + - - salicin + + - + + + + + - glycerol +* - + - galactose + + + + mannose + + + + glucose + + + + + + + + +
D- means usually negative * means in anaerobic condition
33

34
4.2.2.5..2. Identification of Lactobacilli
For the identification of rod shaped isolates, following tests were applied.
1. Gas poduction from glucose
2. Growth at different temperatures (15ºC, 45ºC)
3. Growth at 6.5% NaCl concentration
4. Arginine hydrolysis
5. Carbohydrate fermentation
Except for the arginine test, all the other tests were the same as those for cocci
shaped LAB. In the arginine hydrolysis, arginine MRS broth (Appendix C6) was used
instead of Reddy broth. Fifty µl overnight cultures were inoculated into 5 ml arginine
test media, and were then incubated for 5 days at 30 ºC. After the incubation, ammonia
production was detected by using Nessler reagent. For this purpose, 100 µl of culture
broth were pipetted into each well of the microtitre plates and 100 µl of Nessler reagent
were added. Immediate orange color formation was taken as the indication for ammonia
production. No color change indicated that the strain could not hydrolyse arginine.
4.2.3. Genotypic Identification by PCR-RFLP
4.2.3.1. Genomic DNA Isolation
Genomic DNA was prepared by using the following procedure (Cardinal et al.,
1997). Ten ml overnight cultures were prepared in MRS broths. Cells were harvested in
a microcentrifuge for 5 min at 6000 rpm. After this, they were suspended in 200 µl
1xTE buffer (pH8) containing 25% sucrose and 30 mg/ml lysozyme. The cell
suspensions were then incubated for 1 h at 37 ºC. After the incubation, 370 µl, 1x TE
(pH 8) containing Proteinase K (1mg/ml) and 30 µl, 10% SDS were added. The
samples were then incubated for 1 h at 37 °C. Cells were lysed by the addition of 100
µl 5M NaCl and 80 µl CTAB/NaCl solution (10% cetytrimethylammonium bromide,
0.7 M NaCl) , respectively. Lysed samples were incubated for 10 min at 65 °C.
Chloroform extraction was performed twice using one equal volume of chloroform
(chloroform/isoamyl alcohol:24/1). First, one equal volume of chloroform/isoamyl
alcohol was added and the samples were centrifuged for 5 min at 6000 rpm. The
aqueous phase was transferred into a new eppendorf tube. Chloroform extractions were

35
performed twice. The aqueous phase was transferred into a clean eppendorf tube and the
genomic DNA was precipitated by the addition of isopropanol (one equal volume).
After that, precipitated DNA was transferred into a fresh eppendorf tube which
contained 500 µl 70% ethanol, and washed. When DNA precipitate was not visible,
isopropanol containing samples were centrifuged for 10 min at 6000 rpm to pellet
genomic DNA. After washing, DNA was pelleted by centrifugation for 10 min at 6000
rpm. Ethanol was removed and the pellets were dried for 10 min at 37 °C. Dried pellets
were dissolved in 100 µl 1xTE containing 100 µg/ml RNase. After incubation for 1h
at 37°C, the sample volume was adjusted to 400 µl with 1xTE. DNA was dissolved by
alternating cold-heat shock (80 °C 10 min to -20°C 20 min as twice). DNA was further
purified by phenol/chloroform extraction. One volume of phenol was added, and mixed
well. After the centrifugation for 5 min at 6000 rpm, the aqueous phase was transferred
into a fresh eppendorf tube. Equal volume of chloroform/isoamyl alcohol was added
and mixed well. Samples were centrifuged for 5 min at 6000g. After that, DNA was
precipitated by adding 1/10 sample volume of 5 M NaCl and 2 volumes of 99%
ethanol. Pellet was washed in 500 µl 70% ethanol by centrifugation for 5 min at 6000
rpm. After that, ethanol was removed and samples were dried for 10 min at 37°C.
Finally, according to pellet size, it was dissolved in 50 µl, 100 µl or 150 µl 1x TE. Cold-
heat shock ( for 20 min at 80°C and 20 min at -20°C ) was performed in order to
dissolve the samples. Dissolved genomic DNA samples were stored at -20°C.
4.2.3.2. Amplification of 16S rDNA and ITS(Internally Transcribed Spacer)
Region by PCR Reaction
This method was based on the amplification of internally transcribed spacer region
(ITS) situated between 16S and 23S ribosomal RNA(rRNA) genes, plus 16 S ribosomal
DNA. For the amplification following primers were used;
1. Forward primer; EGE1: 5�-AGAGTTTTGATCCTGGCTCAG-3� (Mora et
al.,1998)
2. Reverse primer ; L1: 5�-CAAGGCATCCACCGT-3� (Jensen et al.,1993)
While the forward primer is complementary to the 5´- end of 16S rRNA genes,the
reverse is complementary to the 3´- end of ITS.

36
Two µl template DNA was used (500ng ). Amplification was performed in a 50 µl
total reaction volume (Appendix F1). PCR reactions were performed in a thermocycler,
PTC-0150 minicycler (MJ Research Inc., USA) using the following program;
Step1: 94 °C for 5 min
Step2: 94 °C for 1 min (denaturation) 40 cycles
Step3: 42 °C for 1 min (annealing)
Step4: 72 °C for 1 min (elongation)
Step5: 72 °C for 10 min (final extension)
4.2.3..3. Separation of amplified Fragments
After the completion of PCR reaction, amplified products were separated in a 0.8
% agarose gel. For this purpose, 0.8 g agarose was dissolved in 100 ml 1x TAE buffer
by boiling. Agarose solution was cooled to nearly 40 °C. After cooling, 15µl ethidium
bromide solution (10mg/ml) were added. The agarose gel was poured into the gel
casting stand and the combs were placed. When the gel was solidified, the combs were
removed. For loading, 10 µl of amplification products were taken below the mineral oil
2 µl of gel loading buffer (Appendix F4) were added. Starting from the second well,
samples were loaded. After the loading of samples, 500 ng of DNA molecular weight
marker (Gene Ruler, Fermentas) were loaded into the first well. Finally, electrophoresis
was performed at 40 mA. Amplification products were visualised in a gel
documentation system (Vilber-Lourmat, France). The presence of DNA fragments sized
between 1500-2000 bp indicated that targeted amplification was achieved.
4.2.3.4. Purification of PCR Products
PCR amplification products were purified by chloroform extraction. Firstly, 100
µl 1xTE buffer was added to adjust the volume of the samples to 150 µl. Two hundred
µl chloroform/isoamyl alcohol solution (Appendix E10) were then added and mixed
thoroughly. After this, thesamples were centrifuged for 5 min at 4000 rpm. The aqueous
phase was taken into a fresh eppendorf tube and chloroform extraction was repeated
once more. The aqueous phase was transferred into new eppendorf tubes containing 10
µl of 3 M sodium acetate (pH5.2) and mixed thoroughly. After that, 450 µl of 99%

37
ethanol were added and mixed. The samples were centrifuged for 15 min at 7000 rpm.
After obtaining the DNA pellet, liquid phase was removed. Pellets were washed in 500
µl 70% ethanol. After centrifugation for 5 min at 6000 rpm , ethanol was removed and
pellets were dried for 10 min at 37 °C 10 min. Finally, pellets were dissolved in 55 µl
1xTE, and stored at -20°C.
4.2.3.5. Restriction Fragment Length Polymorphism (RFLP)
Ten µl of the purified amplification products were used for each of the restriction
enzyme digestions. Digestion was performed in a 50 µl final reaction volume (Appendix
F2). Two endonucleases were used. These were Taq I and Hae III. While Taq I
digestion was performed at 65°C in a water bath , Hae III digestion was performed at 37
°C. Both digestion were performed overnight. Additionaly , in order to avoid
evaporation at 65°C, Taq I restriction reactions were overlaid with mineral oil.
4.2.3.6. Purification of Digested DNA Fragments
After the restriction, the volumes of the samples were adjusted to 100 µl with 1x
TE. Chloroform extraction was performed twice using two volume of
chloroform/isoamyl alcohol solution. After the second extraction , aqueous phase was
transferred into a new eppendorf tube containing 1/10 volume of 3 M (pH5.2) Sodium
acetate solution and mixed. Two and half volume of 99% ethanol were added and mixed
thoroughly. After centrifuging for 15 min at 7 000 rpm, liquid phase was removed, and
DNA pellets were washed in 300 µl 70% ethanol. Ethanol was removed and samples
were dried for 10 min at 37 °C. Finally , samples were dissolved in 15 µl 1xTE and 3
µl of 6x gel loading buffer were added. All samples were stored at -20°C until the
electrophoresis.
4.2.3.7. Electrophoresis of Restriction Fragments
Restricted fragments were seperated in a 2.5% agarose gel. For this purpose, 2.5
g agarose were dissolved in 100 ml 1x TAE by boiling. After cooling nearly to 45°C,
20 µl of ethidium bromide (10 mg/ml) were added .The gel was poured into the gel
casting stand and comb was placed. When the gel solidified, the combs were removed.
38
Before electrophoresis, agarose gel apparatus was washed with tap water and deionized
water respectively. The tank was filled with 1x TAE buffer . Ten µl of the samples
were loaded into each well and 500 ng of DNA molecular weight marker were loaded
into the first well. Finally, electrophoresis was started using the following conditions .
For the first 30 min, electrophoresis was performed at 60 mA, and the current was
adjusted to 80 mA and the electrophoresis was allowed to last for about 2 h.
4.2.3.8. Interpretation of Results
After the elecrtrophoresis , RFLP patterns were observed in gel documentation
system. Fragments were stored in Adobe Photo shop 7.0 and analysed by using BIO-ID
++ software(Vilber-Lourmat, France). The smilarity between strains was determined
automatically by specifying the formula of Jaccard. Strain clustring was performed by
the un-weighed pair group method with arithmetic averages, UPMGA, BIO-ID++.The
dendogram was built up by using 15 % homology coafficient.
4.2.4. Technological Characterization of Isolates
4.2.4.1. Acidifying Activity of Isolates
Acid production ability in milk is one of the most important technological
characteristic of LAB (Cogan et al.,1997, Herreros et al., 2003). In order to determine
acidifying activity, potantiometric (pH measurement) and titrimetric methods were
applied (Sarantinopoulos et al., 2001). For this purpose, isolates were activated from
frozen stocks in MRS broth for 24 h at 30°C and 0.1 ml overnight cultures were
inoculated in 10 ml of sterile UHT skim milk broths. Duplicate inoculations were
prepared. After the 3hth, 6hth ,9hth and 24 hth incubations at 30 °C, 2 ml aliquots were
taken aseptically, and used for the procedures
.
4.2.4.1.1. Monitoring of pH
pH of samles were determined according to the potentiometric method. For this
reason, pH meter with glass electrode was used (Hanna insturements). Before using, pH
39
meter was calibrated with buffer (pH7) 1 and (pH4) buffer 2. After the calibration, the
glass electrode was soaked into each of the samples and pH values were recorded.
4.2.4.1.2. Monitoring Lactic Acid Production
Onto the 2 ml of aliquots, 1-2 drops of phenolphatlein solution were added as
indicator. Samples were then titrated by using standardized (F = 0,8816) 0.1 N NaOH
solutions. When the first trace of pink color was observed ,titration was terminated.
Consumption of the 0.1 N NaOH was recorded. Each ml of 0.1 N NaOH equals to 9.008
mg of lactic acid. Finally, the results were expressed in mg/ml.
4.2.4.1.2.1. Standardization of 0.1 N NaOH and determination of factor value
Sodium hydroxide was standardized with standardized HCl. Firstly, 1N HCl was
standardized with sodium bicarbonate. For this purpose; 0.2 g, 0.3g and 0.4 g sodium
bicarbonate were weighed and dissolved in 100 ml deionized water. These solutions
were titrated by using 1-2 drops of phenyl orange indicator. When the colorless solution
was turned into pink ,titration was terminated and the volumes of HCl consumed were
recorded as 4.6 ml for m1=0.2 g, 6.6 ml for m2=0.3g and 8.6 ml for m3=0.3g. Samples
were heated to boiling 1-2 s in order to remove carbon dioxide and then were cooled. If
the color of the samples was steady, the volume of HCl used was taken as necessary
amount for titration. If the color disappeared, titration was continued. Finally, F1, F2
anf F3 factors of HCl were calculated using the following formula.
T = m x S x F x N F1HCl = 0.8647
F2HCl = 0.9335 FmeanHCl = 0.9042
F3HCl = 0.9144
In order to obtain factor values of 0.1 N NaOH, standardized 1 N HCL solution
was titrated by using 1-2 drops of phenol phenolphtalein solution as indicator. For this
reason, 50 ml and 100 ml of 1 N HCl (F=0.9042) were used. After adding the indicator,
0.1 N NaOH added onto 1 N HCl. When the color changed from colorless to pink, the
volumes of 0.1 N NaOH were recorded as 5ml ( for V1=50 ml) and 9.5 ml (for

40
V2=100ml). As a result, factor value of 0.1 N NaOH was obtained using following
equation.
FmeanHCl x N1 xV1 = N2 xV2 F1NaOH= 0.9042 FmeanNaOH = 0.8816
F2NaOH= 0.8589
4.2.4.1.3. Evaluation of Results
First, the results of isolates (pH and lactic acid mg/ml values corresponded
to 0, 3, 6, 9, 24 h) were grouped into 3 genera as Lactococci, Enterococci and
Lactobacilli. Lactic acid production versus time and pH versus time graphs were drawn
by using Microsoft Excell programme. Beside , standart deviations and mean values
were calculated for each genus by using Excell programme.

41
CHAPTER 5
RESULTS AND DISCUSSIONS
5.1. Isolation of Lactic Acid Bacteria
Twenty cheese samples, were used in the study (section 4.2.1.). LAB were first
grown on agar plates containing MRS (pH6.2-6.8), M17 (pH7.15) and Slanetz and
Bartley media for 48 h at 30 ûC and the colonies were counted (Table 5.1.).
The arithmetic means LAB counts of fresh samples on MRS, M17 and on Slanetz
and Bartley medium were found to be higher than those of ripened cheese samples.
Higher NaCl concentrations in ripened cheese disfavoured sensitive LAB and caused a
reduction in their growth levels. For different types of cheese (Valdeteja raw milk
cheese, Parmigiano Reggiano cheese, Orinotyri ewe�s milk cheese, Kefalotyri cheese,
and etc.) enumeration of LAB was achived by using media (Coppala et al.,2000;
Alonso-Calleja et al.,2001; Prodromou et al.,2001). When our results were compared
with those of authors, it was found similarities with Orinotyri ewe�s milk cheese.
Moreover, these studies indicated that mean log cfu/g counts of LAB had been
increased from milk to curd and slightly decreased during the ripening. For this reason,
isolation was achieved from mainly fresh cheese and curd in our study.
Table 5.1. Logarithmic Microbial Count (log cfu/g) and Standard Deviations
Type of media Fresh cheese samples Ripened cheese
samples
MRS agar 9,05 (±0,51) 8,027 (±0,27)
M17 agar 9,11 (±0,50) 7,97 (±0,75)
Slanetz and Bartley agar 8,82 (±0,64) 6,67(±1,082)

42
5.2. Phenotypic Identification
5.2.1. Examination of Homofermentative Properties
Initially, 661 isolates were obtained and tested for coagulation of skim milk
broths. Among these, 246 isolates showed better coagulation properties. Remaining
isolates which could not coagulate skim milk and isolates causing textural defects such
as gas bubbles were eliminated. Presumptively homofermentative LAB cultures were
thus selected at this step.
5.2.2. Morphological Examination
Isolates were analyzed under the light microscope. At this step, cell shape (like
cocci, ovoid, rod) and arrangements (like diplo form, chains form, tetrad form) were
examined after simple staining. Eighty-two of the isolates showing heterogeneous cell
shape were eliminated. Finally, 164 pure isolates which include 143 of cocci and 21 of
bacilli were obtained.
5.2.3. Subculturing of Isolates
Subculturing is necessary to activate LAB. After three consecutive subculturing
20 of isolates could not be activated and therefore they were eliminated.
5.2.4. Gram Staining and Catalase test
Cultured cells of the isolated strains were subjected to Gram staining. It was
found that all the isolated strains were Gram positive. All the strains also showed
catalase activity. Thus, from 20 cheese samples, in total 134 LAB strains were isolated.
On the figure 5.1. Gram staining of representative cocci shaped and bacilli shaped
isolates were demonstrated.

43
A. B.
C.
B.
Figure 5.1. A. Gram staining of L. lactis ssp. lactis (C22) showing cocci shaped , B. Gram staining of Lb. casei (D2) showing rod shaped, C. colony morphology of typical LAB.
B.

44
5.2.5. Physiological and Biochemical Tests
In order to identify coccus shaped isolates characteristics presented in Table 4.2.
was used. The results of physiological and biochemical tests of the cocci and bacilli
shaped LAB were given (Table5.4 and table 5.6). Furthermore, results were
summarized (Table 5.3 and 5.5). Upon evaluating the results, 44% of the strains (59
isolates) were enterecocci, 40% of the strains were lactococci and 16 % strains (21
isolates) were lactobacilli.
5.2.5.1. Physiological and Biochemical Differentiation of Cocci shaped Isolates
In order to identify of cocci shaped isolates following tests were performed.
Reference strains were subjected to similar tests.(Appeendix I1)
1. Carbon dioxide production from glucose
2. Growth at 10ûC, 40 ûC, and 45ûC and
3. Growth at 2%, 4% and at 6.5% NaCl concentration
4. Arginine hydrolysis
5. Citrate utilization
6. Carbohydrate fermentations
None of the cocci shaped isolates produced carbon dioxide from glucose and this
finding confirmed previously found homofermentative characteristics of them in milk.
According to their growth at 10ûC, 45ûC and 6.5% NaCl concentration, LAB were
clearly dominated by two genera as enterococcus and lactococcus in our samples. For
the lactococci; arginine hydrolysis, citrate utilisation and sugar utilisation characteristics
of isolates indicated that all of the 54 isolates were identified as L. lactis ssp. lactis. L.
lactis ssp. lactis is considered the most important lactococcus species in cheese (López-
Díaz et al., 2000). The abundance of L. lactis ssp lactis isolation from many cheese
types confirmed by many other studies. (Prodroou et al., 2001, Parante et al., 1997,
Menéndez et al., 2001).
Surprisingly, some L. lactis ssp. lactis isolates showed atypical properties such
as growth at 45 °C and growth in 6.5% NaCl concentration (A26, A30, A47, A48, B10,
B21, B28, C4, C15, C16, C28, C32 , C35 ). These atypic properties can be an advantage
in dairy industry. Similarly, in a recent work lactococci isolates which grow in the
presence of 6.5% NaCl and/or at 10 °C has been reported (Fortina et al., 2003). In our

45
study, it was possible to identify lactococcal isolates at subspecies level by phenotypic
methods. On the contrary, atypic characteristic of some lactococcal strains caused
difficulties to distinguish them from E. faecium because they displayed similar sugar
fermentation profiles. This difficulty however was overcome by genotypic methods.
As was seen the above the most abundant strains among the 134 isolates belonged
to Enterecoccus genus. The presence of enterococci in cheese has been questioned due
to the potential health problems; especially endocarditis and urinary tract infection.
Numbers of enterecocci in Mediterrian type cheese curds can be ranged from 104 to
106cfu/g and in the fully ripened cheese from 105 to 107cfu/g (Franz et al., 2003).
Enterecocci can grow in this restrictive environment of high salt concentration and at
low pH. Therefore, their abundance in such large numbers in our cheese samples should
not be suprising. However they have beneficial effects on flavor developments in many
type of cheese (Lopéz- diaz et al., 2000). For this reason enterecocci with desirable
technological and metabolic properties have been suggested as part of defined starter
cultures for different European cheeses (Franz et al., 2003). Besides, their bacteriocin
production abilities are also beneficial to control some food pathogens. It was suggested
that enterecocci play a role in flavor development probably due to citrate utilization
(Sarantinopoulos et al., 2001). When it is considered our enterecoccal isolates, 19 out of
59 of them could produce gas from citrate. Hence, breakdown of citrate results in the
production of carbon dioxide and also some flavor compounds like diacetyl,
acetaldehyde and acetoin. The isolates which were able to metabolize citrate were listed
(Table 5.2.).
Sugar fermentation profiles provided identification at species level for our typical
enterecoccal isolates. Arabinose, sorbitol and glycerol provided discrimination between
E. faecium and E. faecalis. Moreover, E. durans was distinguished from others due to
the mannitol, sorbitol, and trehalose negative sugar fermentation characteristics. On the
other hand, E. avium can ferment all sugars that were tested except for arabinose,
raffinose, and xylose. It was found that 30 of them was E. faecium, 8 of them E.
faecalis, 2 of them E. durans, 3 of them E. avium. On the other hand, 16 of them could
not be determined by using available phenotypic characteristics.

46
Table 5.2. Enterococcal isolates which produced carbon dioxide from citrate.
No Isolate no Species description
1 A39 N.D.
2 A43 N.D.
3 A53 N.D.
4 A56 N.D.
5 A60 N.D
6 A69 N.D.
7 B32 E. faecalis
8 B33 E. avium
9 B35 E. faecalis
10 B36 E.faecalis
11 B37 E. faecalis
12 C30 N.D.
13 C36 E. faecium
14 C38 E. faecalis
15 C39 N.D
16 C40 N.D.
17 C41 E. faecalis
18 C42 N.D.
19 C43 E. faecium

47
Table 5.3. Biochemical results of cocci shaped isolates.
Group1 L lactis ssp lactis (total=54) Group 2. E. faecium (total=30)
A1, A2, A3, A5, A6, A7, A8, A9, A10,
A11, A12, A13, A14, A16, A19, A20,
A21, A22, A23, A25, A26, A27, A28,
A29, A30, A35, A37, A40, A44, A45,
A46, A47, A48, B8, B10, B11, B15, B20,
B21,C1, C4, C10,C11, C15, C16, C18,
C19 I, C19 II, C22, C24,C28, C34, C35
A17, A18, A31, A32, A33, A34, A38,
A41, A42, A49, A50, A57,A58, A59,
A66, A67, A68, A70, A71, B17, B22,
B23, B24, B25, B26, B27 ,B28 ,B29 ,
C36 , C43
Group 3. E. faecalis (total=8) Group 4. E. avium (total=3)
B19, B30, B32,
B35, B36, B37, C38, C41
B33,B34, B46
Group 5. E.durans (total=2) Group 6. Not determined (total=16)
B16, B31
A39, A43, A53, A56, A60, A61,
A62, A63,A64,A65, A69, C30,
C31,A39,A40,C42.

48
Table 5.4. Physiological and Biochemical Test Results of Cocci Shaped LAB (cont.)
Test in Reddy
Broth
No
Isol
ate
No
Cat
alas
e
2% N
aCl
4% N
aCl
6.5
% N
aCl
10 °C
40 °C
45 °C
Col
or
Gas
Gro
wth
CO
2fro
m g
luco
se
Xyl
ose
Rib
ose
Gal
acto
se
Ara
bino
se
Tre
halo
se
Raf
finos
e
Mal
tose
Man
nito
l
Sucr
ose
Sorb
itol
Lac
tose
Gyc
erol
Salic
in
Man
nose
Glu
cose
1 A1 - + + - + + - - - + - - + - - + - + + + - + - + + +
2 A2 - + + - + + - -,+ - + - - + + - + - + + + - + - + + +
3 A3 - + + - + + - - - + - - + + - + - + + + - + - + + +
4 A5 - + + - + + - -,+ - + - - + + - + - + + - - + - + + +
5 A6 - + + - + + - -,+ - + - - + + - + - + + +/- - + - + + +
6 A7 - + + - + + - -,+ - + - - + + - + - + + +/- - + - + + +
7 A8 - + + - + + - -,+ - + - - + + - + - + + - - + - + + +
8 A9 - + + - + + - -,+ - + - - + + - + - + + - - + - + + +
9 A10 - + + - + + - -,+ - + - - + + +/- + - + + - - + - + + +
10 A11 - + + - + + - -,+ - + - - + + +/- + - + + - - + - + + +
11 A12 - + + - + + - -,+ - + - - + + - + - + + - - + - + + +
12 A13 - + + - + + - -,+ - + - - + + - + - + + - - + - + + +
13 A14 - + + - + + - -,+ - + - - + + - + - + + + - + - + + +
(cont. on next page)
48

49
Table 5.4. Physiological and Biochemical Test Results of Cocci Shaped LAB (cont.)
Test in Reddy
Broth
No
Isol
ate
No
Cat
alas
e
2% N
aCl
4% N
aCl
6.5%
NaC
l
10 °C
40 °C
45 °C
Col
or
Gas
Gro
wth
CO
2fro
m g
luco
se
Xyl
ose
Rib
ose
Gal
acto
se
Ara
bino
se
Tre
halo
se
Raf
finos
e
Mal
tose
Man
nito
l
Sucr
ose
Sorb
itol
Lac
tose
Gyc
erol
Salic
in
Man
nose
Glu
cose
14 A16 - + + - + + - -,+ - + - - + + - + - + + +/- - + +/- + + +
15 A17 - + + + + + + -,+ - + - - + + - + - + + - - + - + + +
16 A18 - + + + + + + -,+ - + - - + + +/- + - + +/- - - + - + + +
17 A19 - + + - + + - -,+ - + - - + - - + - + + + - + - + + +
18 A20 - + + - + + - -,+ - + - - + + +/- + - + + + - + - + + +
19 A21 - + + - + + - -,+ - + - - + + - + - + + - - + - + + +
20 A22 - + + - + + - -,+ - + - - + + + + - + + - - + - + + +
21 A23 - + + - + + - - - + - - + + + + - + + - - + - + + +
22 A25 - + + - + + - -,+ - + - - + + + + - + + - - + - + + +
23 A26 - + + - + + + - - + - - + + +/- + - + + - - + - + + +
24 A27 - + + - + + - - - + - - + + + + - + + - - + - + + +
25 A28 - + + - + + - - - + - - + + + + - + + - - + - + + +
26 A29 - + + - + + - - - + - - + + - + - + + - - + - + + +
(cont. on next page)
49

50
Table 5.4. Physiological and Biochemical Test Results of Cocci Shaped LAB (cont.)
Test in Reddy
Broth
No
Isol
ate
No
Cat
alas
e
2% N
aCl
4% N
aCl
6.5%
NaC
l
10 °C
40 °C
45 °C
Col
or
Gas
Gro
wth
CO
2fro
m g
luco
se
Xyl
ose
Rib
ose
Gal
acto
se
Ara
bino
se
Tre
halo
se
Raf
finos
e
Mal
tose
Man
nito
l
Sucr
ose
Sorb
itol
Lac
tose
Gyc
erol
Salic
in
Man
nose
Glu
cose
27 A30 - + + - + + + - - + - - + + + + - + - - - + - + + +
28 A31 - + + + + + + - - + - - + + + + - + + + - + - + + +
29 A32 - + + + + + + - - + - - + + + + - + + - - + - + + +
30 A33 - + + + + + + - - + - - + + + + - + + - - + - + + +
31 A34 - + + + + + + - - + - - + + + + - + + - - + - + + +
32 A35 - + + - + + - - - + - - + + - + - + + + - + - + + +
33 A37 - + + - + + - - - + - - - + - + - + + + - + - + + +
34 A38 - + + + + + + - - + - - + + - + - + +/- - - + +/- + + +
35 A39 - + + + + + + - + + - - + + - + - + + + - + + + + +
36 A40 - + + - + + - - - + - - + + - + - + +/- + - + - + + +
37 A41 - + + + + + + - - + - - + + + + - + + + - + +/- + + +
38 A42 - + + + + + + - - + - - + + + + - + - + - + +/- + + +
39 A43 - + + + + + + - + + - - + + - + - + + + - + + + + +
- (cont. on next page)
50

51
Table 5.4. Physiological and Biochemical Test Results of Cocci Shaped LAB (cont.)
Test in Reddy
Broth
No
Isol
ate
No
Cat
alas
e
2% N
aCl
4% N
aCl
6.5%
NaC
l
10 °C
40 °C
45 °C
Col
or
Gas
Gro
wth
CO
2fro
m g
luco
se
Xyl
ose
Rib
ose
Gal
acto
se
Ara
bino
se
Tre
halo
se
Raf
finos
e
Mal
tose
Man
nito
l
Sucr
ose
Sorb
itol
Lac
tose
Gyc
erol
Salic
in
Man
nose
Glu
cose
40 A44 - + + - + + - - - + - - + + - + - + + - - + - + + +
41 A45 - + + - + + - - - + - - - - - + - + +/- - - + - + + +
42 A46 - + + - + + - - - + - - + + - + - + + - - + - + + +
43 A47 - + + + + + - - - + - - + + - + - + + - - + - + + +
44 A48 - + + + + + - -,+ - + - - + + - + - + + + - + - + + +
45 A49 - + + + + + + - - + - - + + + + - + + +/- - + - + + +
46 A50 - + + + + + + - - + - - + + + + - + - + - + +,- + + +
47 A53 - + + + + + + - + + - - + + - + - + + + - + + + + +
48 A56 - + + + + + + - + + - - + + - + - + +/- - - + + + + +
49 A57 - + + + + + + - - + - - + + + + - + + - - + - + + +
50 A58 - + + + + + + - - + - - + + + + - + + +/- - + - + + +
51 A59 - + + + + + + - - + - - + + + + - + + +/- - + +/- + + +
52 A60 - + + + + + + - + + - - + + - + - + +/- +/- - + +/- + + +
(cont. on next page)
51

52
Table 5.4. Physiological and Biochemical Test Results of Cocci Shaped LAB (cont.)
Test in Reddy
Broth
No
Isol
ate
No
Cat
alas
e
2% N
aCl
4% N
aCl
6.5%
NaC
l
10 °C
40 °C
45 °C
Col
or
Gas
Gro
wth
CO
2fro
m g
luco
se
Xyl
ose
Rib
ose
Gal
acto
se
Ara
bino
se
Tre
halo
se
Raf
finos
e
Mal
tose
Man
nito
l
Sucr
ose
Sorb
itol
Lac
tose
Gyc
erol
Salic
in
Man
nose
Glu
cose
53 A61 - + + + + + + - - + - - + + - + - + - - - + +/- + + +
54 A62 - + + + + + + - - + - - + + - + - + - - - + +/- + + +
55 A63 - + + + + + + - - + - - + + - + - + - - - + +/- + + +
56 A64 - + + + + + + - - + - - + + - + - + - - - + +/- + + +
57 A65 - + + + + + + - - + - - + + - + - + - - - + +/- + + +
58 A66 - + + + + + + - - + - - + + + + - + - - - + +/- + + +
59 A67 - + + + + + + - - + - - + + + + - + - - - + +/- + + +
60 A68 - + + + + + + - - + - - + + + +/- - + - - - + +/- + + +
61 A69 - + + + + + + - + + - - + + - + - + - - - + +/- + + +
62 A70 - + + + + + + - - + - - + + + +/- - + + - - + - + + +
63 A71 - + + + + + + - - + - - + + + + - + - - - + +/- + + +
64 B8 - + + - + + - -,+ - + - - + + - + - + + - - + - + + +
65 B10 - + + - + + + -,+ - + - - + + - + - + + + - + - + + +
(cont. on next page)
52
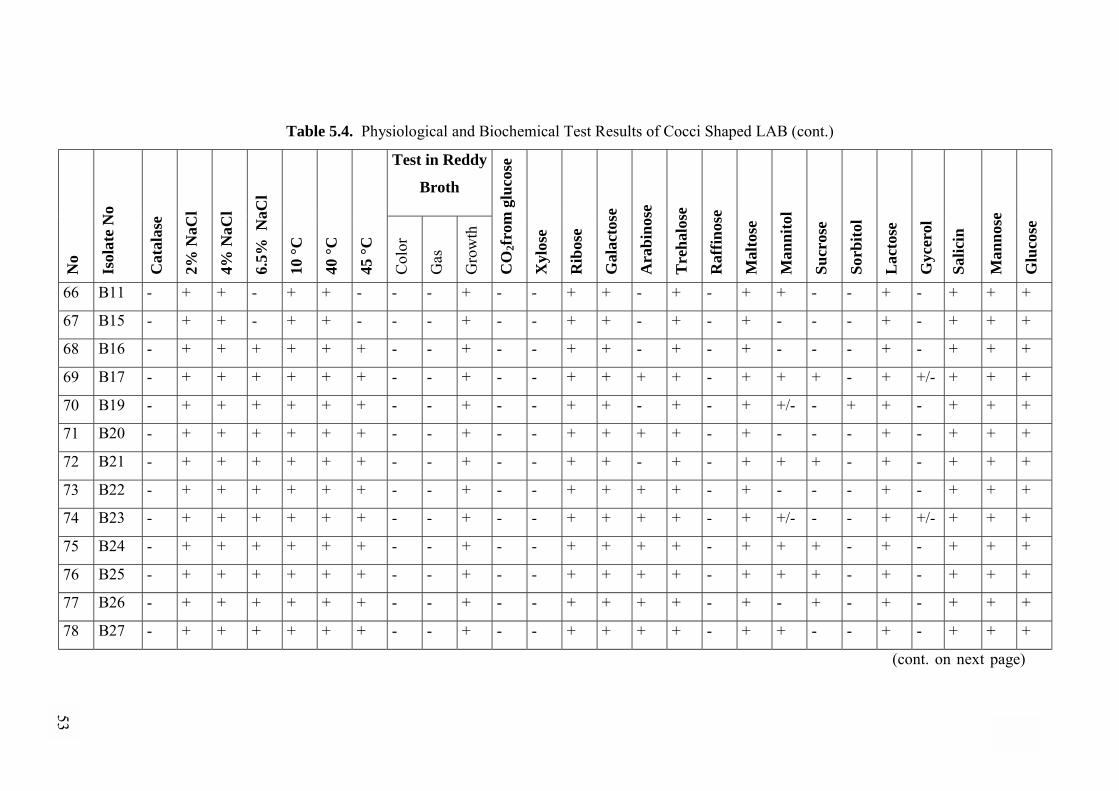
53
Table 5.4. Physiological and Biochemical Test Results of Cocci Shaped LAB (cont.)
Test in Reddy
Broth
No
Isol
ate
No
Cat
alas
e
2% N
aCl
4% N
aCl
6.5%
NaC
l
10 °C
40 °C
45 °C
Col
or
Gas
Gro
wth
CO
2fro
m g
luco
se
Xyl
ose
Rib
ose
Gal
acto
se
Ara
bino
se
Tre
halo
se
Raf
finos
e
Mal
tose
Man
nito
l
Sucr
ose
Sorb
itol
Lac
tose
Gyc
erol
Salic
in
Man
nose
Glu
cose
66 B11 - + + - + + - - - + - - + + - + - + + - - + - + + +
67 B15 - + + - + + - - - + - - + + - + - + - - - + - + + +
68 B16 - + + + + + + - - + - - + + - + - + - - - + - + + +
69 B17 - + + + + + + - - + - - + + + + - + + + - + +/- + + +
70 B19 - + + + + + + - - + - - + + - + - + +/- - + + - + + +
71 B20 - + + + + + + - - + - - + + + + - + - - - + - + + +
72 B21 - + + + + + + - - + - - + + - + - + + + - + - + + +
73 B22 - + + + + + + - - + - - + + + + - + - - - + - + + +
74 B23 - + + + + + + - - + - - + + + + - + +/- - - + +/- + + +
75 B24 - + + + + + + - - + - - + + + + - + + + - + - + + +
76 B25 - + + + + + + - - + - - + + + + - + + + - + - + + +
77 B26 - + + + + + + - - + - - + + + + - + - + - + - + + +
78 B27 - + + + + + + - - + - - + + + + - + + - - + - + + +
(cont. on next page)
53
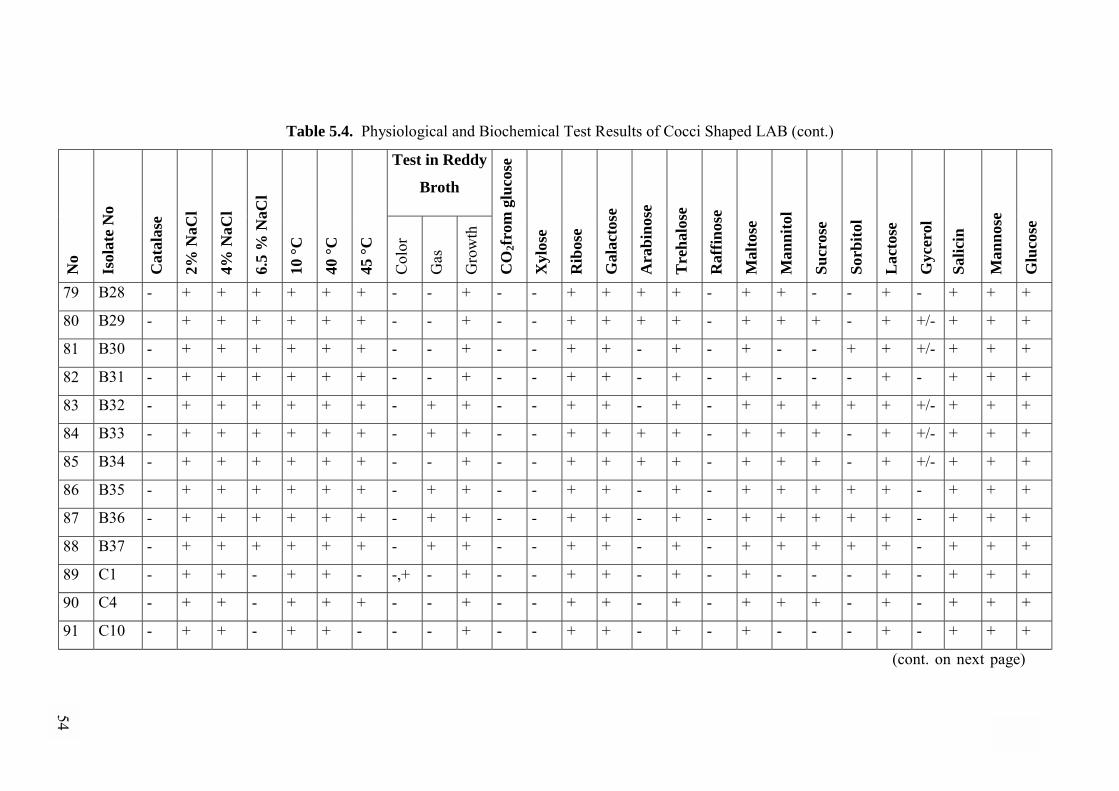
54
Table 5.4. Physiological and Biochemical Test Results of Cocci Shaped LAB (cont.)
Test in Reddy
Broth
No
Isol
ate
No
Cat
alas
e
2% N
aCl
4% N
aCl
6.5
% N
aCl
10 °C
40 °C
45 °C
Col
or
Gas
Gro
wth
CO
2fro
m g
luco
se
Xyl
ose
Rib
ose
Gal
acto
se
Ara
bino
se
Tre
halo
se
Raf
finos
e
Mal
tose
Man
nito
l
Sucr
ose
Sorb
itol
Lac
tose
Gyc
erol
Salic
in
Man
nose
Glu
cose
79 B28 - + + + + + + - - + - - + + + + - + + - - + - + + +
80 B29 - + + + + + + - - + - - + + + + - + + + - + +/- + + +
81 B30 - + + + + + + - - + - - + + - + - + - - + + +/- + + +
82 B31 - + + + + + + - - + - - + + - + - + - - - + - + + +
83 B32 - + + + + + + - + + - - + + - + - + + + + + +/- + + +
84 B33 - + + + + + + - + + - - + + + + - + + + - + +/- + + +
85 B34 - + + + + + + - - + - - + + + + - + + + - + +/- + + +
86 B35 - + + + + + + - + + - - + + - + - + + + + + - + + +
87 B36 - + + + + + + - + + - - + + - + - + + + + + - + + +
88 B37 - + + + + + + - + + - - + + - + - + + + + + - + + +
89 C1 - + + - + + - -,+ - + - - + + - + - + - - - + - + + +
90 C4 - + + - + + + - - + - - + + - + - + + + - + - + + +
91 C10 - + + - + + - - - + - - + + - + - + - - - + - + + +
(cont. on next page)
54

55
Table 5.4. Physiological and Biochemical Test Results of Cocci Shaped LAB (cont.)
Test in Reddy
Broth
No
Isol
ate
No
Cat
alas
e
2% N
aCl
4% N
aCl
6.5%
NaC
l
10 °C
40 °C
45 °C
Col
or
Gas
Gro
wth
CO
2fro
m g
luco
se
Xyl
ose
Rib
ose
Gal
acto
se
Ara
bino
se
Tre
halo
se
Raf
finos
e
Mal
tose
Man
nito
l
Sucr
ose
Sorb
itol
Lac
tose
Gyc
erol
Salic
in
Man
nose
Glu
cose
92 C11 - + + - + + + - - + - - + + - + - + - - - + - + + +
93 C15 - + + - + + + - - + - - + + - + - + - - - + - + + +
94 C16 - + + + + + + - - + - - + + - + - + - - + + - + + +
95 C18 - + + - + + - - - + - - + + + + - + + - - + - + + +
96 C19I - + + - + + - -,+ - + - - + + - + - + - - - + - + + +
97 C19II - + + - + + - -,+ - + - - + + + + - + + + - + - + + +
98 C22 - + + - + + - - - + - - + + - + - + + - - + - + + +
99 C24 - + + - + + - - - + - - + + - + +/- + + + - + - + + +
100 C28 - + + - + + + - - + - - + + + + + + + + - + - + + +
101 C30 - + + + + + + - - + - - + + + + + + + + - + + + + +
102 C31 - + + + + + + - - + - - + + + + - + - + - + + + + +
103 C32 - + + - + + + - - + - - + + + + - + + + - + - + + +
104 C34 - + + - + + - - - + - - + + - + - + + + - + - + + +
(cont. on next page)
55

56
Table 5.4. Physiological and Biochemical Test Results of Cocci Shaped LAB (cont.)
Test in Reddy
Broth
No
Isol
ate
No
Cat
alas
e
2% N
aCl
4% N
aCl
6.5%
NaC
l
10 °C
40 °C
45 °C
Col
or
Gas
Gro
wth
CO
2fro
m g
luco
se
Xyl
ose
Rib
ose
Gal
acto
se
Ara
bino
se
Tre
halo
se
Raf
finos
e
Mal
tose
Man
nito
l
Sucr
ose
Sorb
itol
Lac
tose
Gyc
erol
Salic
in
Man
nose
Glu
cose
105 C35 - + + - + + + - - + - - + + + + - + + + + + - + + +
106 C36 - + + + + + + - - + - - + + + + + + + + - + - + + +
107 C38 - + + + + + + - - + - - + + - + - + + + - + + + + +
108 C39 - + + + + + + - - + - - + + + + - + +/- + - + + + + +
109 C40 - + + + + + + - - + - - + + + + - + + + - + + + + +
110 C41 - + + + + + + - - + - - + + - + - + + + + + + + + +
111 C42 - + + + + + + - - + - - + + - + - + + +/- - + + + + +
112 C43 - + + + + + + - - + - - + + + + - + + + + + - + + +
113 C46 - + + + + + + -,+ - + - - + + + + - + + + + + + + + +
56

57
5.2.5.2. Identification of Bacilli Shaped Isolates
When it was considered Lactobacillus isolates, following tests were performed.
Moreover, reference strains were used to corroborate the phenotypic methods.
1. Carbon dioxide from glucose
2. Growth at 15 ûC and 45ûC.
3. Growth at 6.5% NaCl concentration
4. Arginine Hydrolysis
5. Carbohydrate Fermentations
The number of the Lactobacilli isolates is 21. Phenotypic tests indicated that all of
them were mesophilic type. Interestingly, only 3 of them shown heterofermentative
properties (C17I, C17II, C27) which was not confirmed previously homofermentative
behaviour in skim milk.
Moreover physiological tests indicated that all of them were mesophilic type.
Because all lactobacilli isolates could grow at 15 ûC. The physiological and biochemical
test results were presented (Table 5.6.) and summarized (Table 5.5.).

58
Table 5.5. Biochemical Identification Results of Lactobacilli.
No Isolate code Identification
1 C3 Lactobacillus spp.
2 C5 Lb. paracasei ssp. paracasei
3 C7 Lactobacillus spp.
4 C8 Lb. paracasei ssp. paracasei
5 C9 Lactobacillus spp.
6 C12 Lb. paracasei ssp. paracasei
7 C17 I Lactobacillus spp.
8 C17II Lactobacillus spp.
9 C27 Lb. casei
10 C29 Lactobacillus spp
11 C37 Lactobacillus spp
12 C47 Lactobacillus spp
13 D1 Lactobacillus spp
14 D2 Lb. casei
15 D3 Lactobacillus spp
16 D4 Lb. casei
17 D5 Lactobacillus spp
18 D6 Lactobacillus spp
19 D7 Lactobacillus spp
20 D8 Lactobacillus spp
21 D9 Lactobacillus spp

59
Table 5.6. Physiological and Biochemical Test Results of Lactobaccilli
No
Isol
ate
No
Cat
alas
e
6.5%
NaC
l
15 °C
45 °C
NH
3 fro
m a
rgin
ine
CO
2fro
m g
luco
se
Xyl
ose
Rib
ose
Gal
acto
se
Ara
bino
se
Tre
halo
se
Raf
finos
e
Mal
tose
Man
nito
l
Sucr
ose
Sorb
itol
Lac
tose
Gyc
erol
Salic
in
Man
nose
Glu
cose
1 C3 - + - - - - + + - + - + - - - + - + + +
2 C5 - + - - - - + + - + - + + + - + - + + +
3 C7 - + - - - - + + + + - + - - - + - + + +
4 C8 - + - - - - + + - + - + + + - + - + + +
5 C9 - + - - - - + + + + - + - - +/- + - + + +
6 C12 - + - - - - + + - + - + + + - + - - + +
7 C17 I - + - + + + + + - + + + - + - + - + + +
8 C17II - + - + + - + + - + - + - - - + - - + +
9 C27 - + - - + - + + - + - + + + + + - + + +
10 C29 - + - - - + + + + + + + + + - + + + + +
11 C37 - + + - - + + + + + - + - +/- - + - + + +
12 C47 - + + + - + + + + + - + + - - + - + + +
13 D1 - + + - - - - + + - - - + + - +/- + - + + +
(cont. on next page)
59

60
Table 5.6. Physiological and Biochemical Test Results of Lactobaccilli
No
Isol
ate
No
Cat
alas
e
6.5%
NaC
l
15 °C
45 °C
NH
3 fro
m a
rgin
ine
CO
2fro
m g
luco
se
Xyl
ose
Rib
ose
Gal
acto
se
Ara
bino
se
Tre
halo
se
Raf
finos
e
Mal
tose
Man
nito
l
Sucr
ose
Sorb
itol
Lac
tose
Gyc
erol
Salic
in
Man
nose
Glu
cose
14 D2 - + + + - - - + + - + - + + + + + + + + +
15 D3 - + + - - - - + + - + - + + + - + + + + +
16 D4 - + + - - - - + + - + - + + + - + + + + +
17 D5 - + + - - - + + + + + - + + + + + + + + +
18 D6 - + + - - - - + + - + - + + + + + - + + +
19 D7 - + + - - - - + + - + - + + + + + + + + +
20 D8 - + + - - - - + + - - - + - +/- - + - - + +
21 D9 - + + - - - - + + - + - + + + - + - + + +
60

5.3. Genotypic Identification
5.3.1. Amplification of 16 S rRNA and ITS region
In order to identify lactic acid bacteria by PCR-RFLP technique, 16 S rRNA and
ITS regions were amplified. The length of amplification products varied from 1500 to 2
000 bp (Figure 5.2).
1 2 3 4 5 6 7 8 9 10 11 12 13 14 15 16 17 18 19 20 21 22 23 24 25 26
2000bp
61
i. PCR- RFLP Profiles
Figure 5.2. Represantative 16 S and ITS amplification products of isolates.
Lanes 1. 1kb DNA ladder Gene RulerTM 2. A1, 3. A2, 4. A3, 5. A5, 6. A7, 7. A17, 8. A18,
9. A19, 10. A20, 11. A21, 12. A35, 13. A37, 14. A38, 15. A39, 16. A40, 17. A41, 18. A42,
19. B10, 20. B15, 21. B16, 22. B17, 23. B19, 24. B20, 25. B21, 26. C1 .
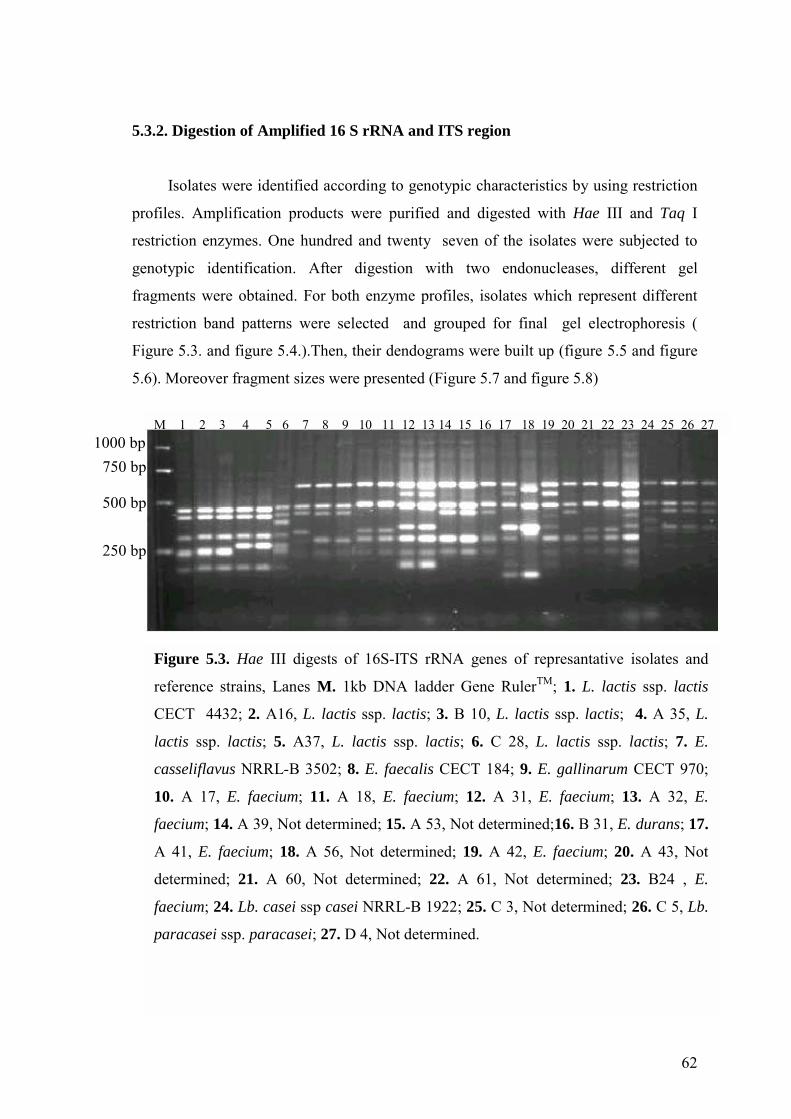
5.3.2. Digestion of Amplified 16 S rRNA and ITS region
Isolates were identified according to genotypic characteristics by using restriction
profiles. Amplification products were purified and digested with Hae III and Taq I
restriction enzymes. One hundred and twenty seven of the isolates were subjected to
genotypic identification. After digestion with two endonucleases, different gel
fragments were obtained. For both enzyme profiles, isolates which represent different
restriction band patterns were selected and grouped for final gel electrophoresis (
Figure 5.3. and figure 5.4.).Then, their dendograms were built up (figure 5.5 and figure
5.6). Moreover fragment sizes were presented (Figure 5.7 and figure 5.8)
M 1 2 3 4 5 6 7 8 9 10 11 12 13 14 15 16 17 18 19 20 21 22 23 24 25 26 27 1000 bp 750 bp
500 bp
250 bp
Figure 5.3. Hae III digests of 16S-ITS rRNA genes of represantative isolates and
reference strains, Lanes M. 1kb DNA ladder Gene RulerTM; 1. L. lactis ssp. lactis
CECT 4432; 2. A16, L. lactis ssp. lactis; 3. B 10, L. lactis ssp. lactis; 4. A 35, L.
lactis ssp. lactis; 5. A37, L. lactis ssp. lactis; 6. C 28, L. lactis ssp. lactis; 7. E.
casseliflavus NRRL-B 3502; 8. E. faecalis CECT 184; 9. E. gallinarum CECT 970;
10. A 17, E. faecium; 11. A 18, E. faecium; 12. A 31, E. faecium; 13. A 32, E.
faecium; 14. A 39, Not determined; 15. A 53, Not determined;16. B 31, E. durans; 17.
A 41, E. faecium; 18. A 56, Not determined; 19. A 42, E. faecium; 20. A 43, Not
determined; 21. A 60, Not determined; 22. A 61, Not determined; 23. B24 , E.
faecium; 24. Lb. casei ssp casei NRRL-B 1922; 25. C 3, Not determined; 26. C 5, Lb.
paracasei ssp. paracasei; 27. D 4, Not determined.
62

63
5.3.2.1. Hae III digestion
In total 27 representative isolates and reference strains were used for evaluation
of Hae III digestion profiles. Thirteen genotypic groups were obtained (Figure 5.5).
When lactococcal isolates were examined by comparing with all other isolates ,they
were clustured together. They could be easily differentiated from other enterecocci and
lactobacilli isolates.
Although these all lactococcal isolates were previously identified as L. lactis
ssp. lactis according to phenotyic methods , 3 different genotypic groups were obtained.
First group which comprises of A16 and B10 represented 49 of the L. lactis ssp. lactis
isolates. It was found that this group yielded similar restriction enzyme profile with
reference strains of L. lactis ssp. lactis (100% homology).
Second group which comprises of A 35 and A 37 represented 4 of the L. lactis
ssp. lactis. It was found that this group yielded restriction profile slightly different from
reference strain of L. lactis ssp. lactis (80% homology ).
Interestingly, only one isolate which was represanted as C 28 gaved distinct
digestion profile.
Finally, it could be concluded that PCR-RFLP method by using Hae III enzyme
indicated good correlation with phenotyic methods for L. lactis ssp. lactis. Moreover,
further differentiation was achived by using this genotypic method.
For enterococci , isolates (A39, A53, A43) which could not be identified by
using phenotyic methods gaved similar band patterns with E. faecalis. But. It was the
handicap that Hae III digestion could not differentiate reference strains of E. faecalis
from E. gallinarum.When sugar fermentation of these isolates were examined, it was
seen that these were more closely to E. faecalis. The typical characteristic of the E .
gallinarum is positive xylose and raffinose fermentation. On the other hand, E. faecalis
species could not ferment these sugars.
Also it was found that isolates of A17, A18, A 60, A61 were clustured in the
same group. Two of them (A17, A18) could be previously biochemicaly identified as E.
facecium and therefore similarity at genotypic base (100% homology) provided
identification. Other isolates (A 60 and A 61) which could not identified by using
phenotypic methods , might be identified as E. faecium also.
One enterococci isolate (B 31) which was previously identified as E. durans
gaved distinct digestion profiles.

Other E. faecium isolates (A31, A32, A42, B24, and A41) were clustred into 4
group . It might be considered that undefined isolate of A56 might be identified as E.
faecium also.
For lactobacilli, evaluation was more difficult due to the unsufficient type of the
reference strains. Lactobacilli isolates were clustured in one genotypic group which
yielded different restriction profile from reference strain of Lb. casei ssp casei NRRR-B
1922.
M 1 2 3 4 5 6 7 8 9 10 11 12 13 14 15 16 17 18 19 20 2122 2324 25 26 1000 bp 750 bp 500 bp
250 bp
Figure 5.4. TaqI digests of 16S-ITS rRNA genes of representative isolates and
reference strains, Lanes M. 1kb DNA ladder Gene RulerTM; 1. L. lactis ssp. lactis
CECT 4432; 2. A16, L. lactis ssp. lactis; 3. B 10, L. lactis ssp. lactis; 4. A 35, L.
lactis ssp. lactis; 5. A37, L. lactis ssp. lactis; 6. C 28, L. lactis ssp. lactis; 7. E.
faecalis CECT 184; 8. E. gallinarum CECT 970; 9. A 17, E. faecium; 10. A 18, E.
faecium; 11. A 31, E. faecium; 12. A 32, E. faecium; 13. A 39, Not determined; 14.
A 53, Not determined;15. B 31, E. durans; 16. A 41, E. faecium; 17. A 56, Not
determined; 18. A 42, E. faecium; 19. A 43, Not determined; 20. A 60, Not
determined; 21. A 61, Not determined; 22. B24, E. faecium; 23. Lb. casei ssp casei
NRRL-B 1922; 24. C 3, Not determined; 25. C 5, Lb. paracasei ssp. paracasei; 26.
D 4, Lb. casei
64

65
Figure 5.5. Dendogram of Hae III digest of representative isolates and reference strains. N.D. means not determined.

66
Figure 5.6. Dendogram of Taq I digest of representative isolates and reference strains. N.D. means not determined.

67
Table 5.7. Fragment sizes of Hae III digests of the isolates and reference strains
M 1 2 3 4 5 6 7 8 9 10 11 12 13 14 15 16 17 18 19 20 21 22 23 24 25 26 27
Table 5.8. Fragment sizes of Taq I digests of the isolates and reference strains
M 1 2 3 4 5 6 7 8 9 10 11 12 13 14 15 16 17 18 19 20 21 22 23 24 25 26
67

68
5.3.2.2. Taq I digestion
In total 26 representative isolates and reference strains were examined. Fifteen
different genotypic groups were obtained (Figure 5.6).
For L. lactis ssp. lactis isolates, Taq I digestion indicated good correlation with
Hae III digestion. Isolates of A16 and B10 yielded similar restriction profile with
reference strain (100% homology). Other L. lactis ssp. lactis isolates of A35 and A37
showed slightly different profiles typical isolates.
Interestingly , L. lactis ssp. lactis isolates of C 28 gaved quitely different profile
and grouped with enterococci.
It was observed that Taq I could discriminate reference strains of E. gallinarum
and E. faecalis.
Only two of enterococcal isolates were clustured with in the same group for both
of the enzyme digestion.These isolates were A31 and A32 and both were biochemically
identified as E. faecium.
It was concluded that PCR- RFLP method was beneficial especially for L. lactis
ssp. lactis isolates. It might be provided better evaluation for enterococcal and
lactobacilli isolates, if much more reference strains were included in this study.

69
5.4. Acid Production
Acid production properties of LAB are main technological characteristics for
dairy industry (Berresford et al.,2001). For this aim, pH and lactic acid production were
monitored for 130 isolates. Results were given on appendix. After results were grouped
according to the genera, graphs were obtained (Figure 5.7 and figure 5.8). Interestingly,
it was observed that isolates which belonged to each genus yielded similar acidifiying
profile.
It was obvious that 35 of isolates could manage to lower pH below 5.3 for 6h
incubation at 30 °C. It was clear that 34 of them was L. lactis ssp. lactis and only one of
them was E. faecium (A31). Solely this isolate of enterococci cause to pH almost 5.3
in6 h incubation. On the other hand other 34 of the L. lactis ssp lactis species showed
the highest acidifying capacity. Moreover , when these isolates were compared with
others, it was obtained the most amount of lactic acid production in 6 h incubation.
Rapid acid production abilities indicated that they were the most suitable starter
candidates for dairy applications.
From lactic acid production view, it was also suggested that strains of L. lactis
ssp. lactis whose acidifying capacity gave an acidity >2.5 mg/ml of lactic acid after 6 h
incubation can be used as starter culture in cheese manufacture (Herreros et al., 2003).
At this mean 39 of our L. lactis ssp. lactis isolates could be considered for cheese
manufacturing.
Table 5.9. Acidification characteristics of of isolates Group 0h 3h 6h 9h 24h
pH 6,6 (0)
6,113 (±0,207)
5,271 (±0,580)
4,826 (±0,673)
4,397 (±0,480)
Lactocococcus n=54
L.A. (mg/ml)
1,587 (0)
2,388 (±0,355)
4,371 (±1,379)
5,787 (±1,832)
5,950 (±0,906)
pH 6,6 (0)
6,354 (±0,075)
5,779 (±0,199)
5,347 (±0,222)
4,671 (±0,242)
Enterecoccus n=58
L.A. (mg/ml)
1,587 (0)
2,092 (±0,202)
2,952 (±0,307)
4,053 (±0,698)
5,950 (±0906)
pH 6,6 (0)
6,283 (±0,097)
5,973 (±0,245)
5,768 (±0,334)
5,046 (±0,639)
Lactobacillus n=18
L.A. (mg/ml)
1,587 (0)
2,434 (±0,192)
2,808 (±0,459)
3,321 (±0,686)
6,247 (±2,539)
L.A. Titration value of lactic acid production Mean±standard deviation

pH vs time
4,0
4,5
5,0
5,5
6,0
6,5
7,0
0 3 6 9 12 15 18 21 24
time / h
pH
0
2
4
6
8
10
0
lact
ic a
cid(
mg/
ml)
Figure 5.7. pH changes in UHT skim milk broths during incubation for 3 h, 6 h, 9 h ,24 h at 30 °C. Red color-lactococci, blue color-enterococci, and black color-lactobacilli
lactic acid vs time
3 6 9 12 15 18 21 24time(h)
Figure 5.8. Lactic acid production in UHT skim milk broths during incubation for 3 h, 6 h, 9 h ,24 h at 30 °C. Red color-lactococci, blue color-enterococci, and black color-lactobacilli
70

71
CHAPTER 6
CONCLUSION AND FUTURE PERSPECTIVE
Isolation of starter LAB was the focus of this study. In order to achive this aim ,
phenotypic methods (morphology, phsiologicaland biochemical tests ) and genotypic
methods (16S-ITS PCR - RFLP) were performed.The following goals were achived:
1. All isolates were identified as LAB
2. One hundred and thithy one of the 134 isolates were identified as
homofermentative LAB.
3. Genotypic methods were beneficial for futher identification because isolates
which could not be determined according to the phenotypic methods were
identified by genetic mean.
4. Technological characterization of isolates was performed according to the acid
activity tests. The results of these tests indicated that 35 isolates have
significant importance as starters for industrial cheese production. Because
these isolates could lower the pH of UHT skim mik below 5.3 after 6 h
incubation at 30 °C, and candidates as good staters for dairy industry.
Starter cultures which were isolated from different sources have important
contributions in quality and in other characteristics of industrially produced cheese.
Isolation of LAB with challenging technological properties have a gerat importance in
industry and science. In the future, it will be beneficial to determine the following
characteristics of the isolated strains.
1. Bacteriophage resistance.
2. Proteolytic activity.
3. Lipolytic activity.
4. Production of aroma and flavor compounds.
5. Antimicrobial properties.
6. Dietetic properties (L- Lactic acid produced, probiptic properties ).
Finally, the isolated strains might also be tried for new fermented food
formulations.

72
REFERENCES
1. Alonso-Calleja, C., Carballo, J., Capita, R.,Bernardo, A., and Garcia-Lopéz M.L.
�Changes in the Mirroflora of Valdeteja Raw Goat�s Milk Cheese throughout
Manufacturing and Ripening�, Lebensm-Wiss-Technol. 35, (2002), 222-232.
2. Andrighetto.C.,Borney, F.,Baemaz, A.,Stefanon, B., and Lombardi A. �Genetic
diversity of Streptococcus thermophilus strains isolated from Italian traditional
cheeses�, International Dairy Journal, 12 (2002),141-144.
3. Axelsson,L. �Lactic acid Bacteria: Classification and Physiology� in Lactic acid
Bacteria, Microbiology and Functional Aspects, edited by S. Salminen and A. Von
Wright (Marcel Dekker Inc,New York, 1998), pp.1-73.
4. Ayad, H.E.E., Verheul , A., Wouters, J:T:M:, and Smith, G. � Population dynamics of
lactococci from industrial, artisanal and non- dairy origins in defined strain starters for
Gouda- type cheese�, International Dairy Journal, 11, (2001), 51-61.
5. Beresford, T.P., Fitzsimons, N.A., Brennan, N.L., and Cogan, T.M. �Recent advances
in cheese microbiology�, International Dairy Journal, 11, (2001), 259-274.
6. Bouton, Y.,Guyot,P.,Beuvier, E., Taillliez, P., and Grappin, R. �Use of PCR- based
methods and PFGE for typing and monitoring homofermentative lactobacilli during
Comté cheese Ripening �, International Journal of Food Microbiology, 76 ,(2002), 27-
38.
7. Cardinal, M.J.,Meghrous, J.,Lacroix, C., and Simard, R.E. �Isolation of Lactococcis
lactis strain producing inhibitory activity against Listeria”, Food
Biotechnology,11(2),(1997),129-146.
8.Centeno, J. A., Menendez, S., Hermida, M, and Rodriguez-Otero, J.L.�Effects of the
addition of Enteococcus Faecalis in Cebreiro cheese manufacture�, International
Journal of Food Microbiology, 48,(1999), 97-111.

73
9. Coffey, A.G., Daly, C., andFitzgrald, G. �The impact of biotechnology on dairy
industry�, Biotechnology Advances,12, (1994), 625-633.
10. Cogan., T. M.., Barbosa, M., Beuvier, e., Branchi-Salvodari, B., Cocconcelli, P.
S.,Fernandes,I., Gomez, J., Gomez, R., Kalantzopoulos, G., Ledda, A., Medina, M.,
Rea, M:C:, and Rodriguez, E. �Characterization of the lactic acid bacteria in artisanal
dairy products�, International of Dairy Reseach, 64, (1997), 409-421.
11. Cogan, T. M., �History and Taxanomy of Starter Cultures�, in Dairy Starter
Cultures, edited by T. M. Cogan and J.-P. Accolas (Wiley �VCH Inc.,New York, 1996),
pp. 1-25.
12. Coppala, R., Nanni, M.,Iorizzo, M., Sorrentino, A., Sorrentino, E., Chiavari,C., and
Grazia L. �Microbiolgical characteristics of Parmigiano Reggiano cheese during the
cheesemaking and the first months of ripening�, Lait 80, (2000), 479-490.
13. Devriese, L.A., and Pot, B. �The genus Enterococcus�,in The Lactic acid Bacteria,
The Genera of Lactic acid Bacteria, Volume2,edited by B. J. B. Wood and
w.H.Holzapfel (Blackie academic &Professionals, Glasgow, c1995) pp.235-279.
14. Farber, J.M., �An Introduction to the Hows and Whys of Molecular Typing�,
Journal of Food Protection, 59, (1996), 1091-1101.
15. Franz, C., Stiles, M., Scheleifer, H., and Holzapfel, W. �Enterecocci in foods-a
conundrum for food safety�. International Journal of Food Microbiology, (2003)
16. Garvie E.I., �Taxonomy and Identification of Bacteria Important in Cheese and
Fermented Dairy Products�, in Advances in The Microbiology and Biochemistry of
Cheese and Fermented Milk, edited by F. L. Davies and B. A. Law (Elsevier Applied
sciencePublishersLTD.England,1984) pp.35-67.
74
17. Giraffa,G., and Neviani, E. �Different Lactobacillus helveticus strain populations
dominate during Grana Padano cheese making�, Food Microbiology, 16, (1999), 205-
210.
18. Hammes, W.P.G. and Vogel, R.F. �The genus Lactobacillus� in The Lactic acid
Bacteria. The genera of Lactic Acid Bacteria, Volume 2 , edited by B. J.B. Wood and
W.H. Holzapfel (Blackie academic &Professionals, Glasgow,1995), pp.19-55.
19. Hardie, J. M. And Whiley, R. A. �The genus Streptococcus� in The Lactic acid
Bacteria. The genera of Lactic Acid Bacteria, Volume 2, edited by B. J.B. Wood and
W.H. Holzapfel (Blackie academic &Professionals, Glasgow,1995), pp.55-125.
20. Hayologlu, A.A., Guven,M., and Fox, P.F. �Microbiological,biochemical and
technological properties of Turkish White Cheese �Beyaz Peynir�, International Dairy
Journal, 12,(2002), 635-648.
21. Hébert, E.M., Raya, R:R:; Tailliez, P., and Giroi G.S. �Characterization of natural
isolates of Lactobacillus strains to be used as starter cultures in dairy fermentation�,
International Journal of Food Microbiology, 59,(2000),19-27.
22. Herresos, M.A., Fresno, J.M.,Priteto, M.J., and Tornadijo, M.E. �Technological
characterization of lactic acid bacteria ( a Spanish goat�s milk cheese)�, International
Dairy Journal, 13, (2003), 469-479.
23. Lopez-Diaz, T.M., Alonso, C.,Roman, C., Garcia-Lopez, M.L., and Moreno, B.
�Lactic acid bacteria isolated from a hand-made blue cheese�, Food Microbiology,
17,(2000), 23-32.
24. Manolopoulou, E.,Sarantinopoulos, P., Zoudou, E., Aktypis, A., Moschopoulou,
E.,Kandarakis, I., and Anifantakis, E. �Evaution of microbial populations during
traditional Feta cheese manufacture and ripening�, International Journal of Food
Microbiology, 2553, (2002).

75
25. Mannu, L., Comunian, R., and Scintu M.F. �Mesophilic lactobacilli in Fiore Sardo
cheese: PCR-identification and evolution during cheese ripening�, International Dairy
Journal, 10, (2000), 383-389.
26. Mannu, L., Riu, G., Communian, R., Fozzi C.M. and Scintttu, F.M. � A
preliminary study of lactic acid bacteria in whey starter culture and industrial Pecorino
Sardo ewes� milk cheese : PCR identification and evolution during ripening �,
International Dairy Journal, (2002),17-26.
27. Marshall,M.E. and Law, B. � The Physiology and Growth of Dairy Lactic- acid
bacteria� in Advances in The Microbiology and Biochemistry of Cheese and Fermented
Milk, edited by F. L. Davies and B.A.Law (ElsevierApplied science Publishers LTD.
England, 1984) pp.35-67
28. Mäyra-Mäkinen, A. and Bigret, M. �Industrial Use and Production of Lactic Acid
Bacteria�, in Lactic acid Bacteria, Microbiology and Functional aspects, edited by S.
Salminen and A. Von Wright (Marcel Dekker Inc, New York, 1998), pp. 73-103.
29. Menéndez, S., Godinez, R., Centeno,J.A. and Rodriguez-Otero, J.L.
�Microbiological , chemical and biochemical characteristics of �Tetilla� raw cows-milk
cheese�, Food Microbiology, 18, (2001), 151-158.
30. Moshetti, G., Blaiotta, G., Villani, F., and Coppala, S. �Nisin-producing organisms
during traditional �Fior di latte� cheese-making monitored by multiplex-PCR and PFGE
analyses�, International Journal of Food Microbiology, 63, (2001), 109-116.
31. Olasupo, N.A., Schillinger, U., and Holzapfel, W.H. �Studies some technological
properties of predominant lactic acid bacteria isolated from nigerian fermented foods�,
Food Biotechnology,15(3), (2001),167-167
32. Parente, E., Rota, M.A., Riccciardi, A., and clementi, F. �Characterisation of
Natural Starter Cultures Used in the Mnufacture of Pasta Filata Cheese in Basilicata
(Southern Italy )�, International Dairy Journal,7,(1997), 775-783.

76
33. Pérez, G., Cardell, E., and Zárate, V. �Protein fingerprinting as a complelementary
analysis to classical phenotyping for the identification of lactic acid bacteria from
Tenefire cheese�, Lait 80, (2000), 589-600.
34. Prodromou, L., Thasitou, P., Haritonidou, E., Tzanetakis, N., and Litopoulou-
Tzanetaki, E. �Microbiology of � Orinotyri�, a ewe�s milk cheese from the Greek
mountains�, Food Microbiology, 18,(2001), 319-328.
35. Requena, T.,Peloez, C., and Desmazeaud, M.J. �Characterization of lactococci and
lactobacilli isolated from semi-hard goat�s cheese�, Journal of Dairy Reseach,
58,(1991),137-145.
36. Renault, P. �Genetically midified lactic acid bacteria: applications to food or health
and risk assesment� , Biochimie,(2003).
37. Ross, R.P.,Stanton, C.,Hill, C., Fitzgerald, G.F.,and Coffey, A. �Novel Cultures for
cheese improvement�, Trends in Foood Science and Technology, 11, (2000), 96-104.
Stiles ,M.,and Holzapfel,W. �Lactic acid bacteria of foods and their current taxonomy�
International Journal of Food Microbiology, 36, (1997), 1-29.
38. Rodriguez, E., Arques, J.,Gaya, P., Nunez ,M., and Medina, M. � Control of Listeria
monocytogenes and monitoring of bacteriocin producing lactic acid bacteria by colony
hybridization in semi-hard raw milk cheese.� Journal of Dairy Reseach, 68,(2001),131-
137.
39. Sarantinopoulos, P., Kalantzopoulous, G., and Tsakalõdou, E. �Citrate metabolism
by Enterococcus faecalis FAIR-E229�Applied and Environmental Microbiology,
(2001), 5482-5487
40. Schleifer, K.H. and Ludwig, W. �Phylogenetic relationship of lactic acid bacteria�in
The Lactic acid Bacteria, The Genera of Lactic acid Bacteria, Volume 2, edited by B. J.
B. Wood and W. H. Holzapfel (Blackie Academic & Professionals, Glasgow, 1995),
pp.55-125.
77
41. Uriaza, P., Gomez �Zavaglõa, A., Lozano, M.,Romanowski, V., and Graciella, A.
�DNA fingerprinting of thermophilic lactic acid bacteria using repetitive sequence-
based polymerase chain reaction�, Journal of Dairy Reseach, 67, 381-392
42. Sharpe M. E. And Fryer T. F. �Identification of Lactic acid Bacteria�, in
Identification Methods for Microbiologist, Part A, edited by B. M. Gibbs and F. A.
Skinner (Academic Press , Landon, 1966), pp.65-81.
43. Wouters, J.T.M., Ayad, E.H.E., Hugenholtz, J., and Smit, G. �Microbes from raw
milk for fermented dairyproducts�, International Dairy Journal ,12,(2002), 91-109.
44. Yvon, M., and Rijnen, L. �Cheese flavor formation by amino acid catabolism�,
International Dairy Journal, 11,(2001), 185-201.
45. Ventura,M. and Zink, R. �Specific identification and moleculer typing analysis of
Lactobacillus johnsonii by using PCR- based methods and pulsed- field gel
electrophoresis.� FEMS Microbiology Letters, 217, (2002)141-154.

78
APPENDICES
APPENDIX A CHEMICALS USED
Table A.1. Chemicals Used In Microbiolgical Experiments
NO CHEMICAL CODE
1 Agar Merck 1.01613
2 Bacteriological pepton Oxoid LP037
3 Lab-Lemco Meat Extract Oxoid LP029
4 D-Glucose AppliChem A3666
5 Yeast Extract Merck A 1.03753
6 Skim milk Põnar and Ova
7 Maltose Merck Art 5911
8 Sucrose Difco 0176-17
9 D (-) Salicin Fluka 84150
10 Arginine monohydrocholoride Merck Art 1543
11 Lactose Sigma L3750
12 D-Mannitol DIFCO 0171-13
13 D- Mannose DIFCO 0175-13
14 Raffinose Merck 7419
15 D (+) -Xylose Merck 8689
16 D (-) - Ribose Flula 83860
17 D (+) - Galactose Aldrich 11259-3
18 L (+) - Arabinose Aldrich A9190-6
19 D (+) - Trehalose Sigma T 9531
20 Glycerol AppliChem A2926
21 NaCl Merck 6400.100
22 Triammonium citrate Sigma A1332
23 Sodium citrate AnalaR 10242
24 Bromcresol purple Merck 3025
25 Sodium acetate Sigma S2889

79
NO CHEMICAL CODE
26 K2HPO4 Sigma P8281
27 Glycocoll Riedel-De Haёn 652296
28 Bromtymol blue Riedel-De Haёn 35088
29 Sodium phosphate di basic Merck 926870
30 MgSO4.7H2O Merck 1.05886
31 MnSO4.4H2O Merck 1.02786
32 Ascorbic acid Merck 5.00074
33 Phenol red BDH 20091
34 Crysal violet Sigma C3886
35 Potassium loidide Sigma C6757
36 Safranine Merck 1.15948

80
Table A.1. Chemicals Used in PCR-RFLP
NO CHEMICAL CODE
1 Taq DNA polymerase PromegaM1835
2 Primers: Ege 1 and L1 Promega
3 dNTP set MBI, Fermentas, R0181
4 Standart agarose
(low electroendoosmosis)
AppliChem A3666
5 Taq I Promega R6151
6 Hae III Promega R6171
7 Chloroform AppliChem A3633
8 Sodium acetate Sigma S 2889
9 Isoamyl alcohol AppliChem A2610
10 Mineral Oil Sigma M5904
11 Bromophenol blue Merck 1.08122
12 Glycerol AppliChem A2926
13 1kb DNA ladder Gene RulerTM Fermentas SM0311
14 Phenol AnalaR 10242
15 Rnase Merck 3025
16 Lysozyme Sigma S2889
17 K2HPO4 Sigma P8281
18 Proteinase K Riedel-De Haёn 652296
19 Ethidum bromide Riedel-De Haёn 35088
20 Ethanol Merck 926870

81
APPENDIX B RECIPIES FOR CULTURE MEDIA
B.1 MRS BROTH AND MRS AGAR
MRS BROTH g/l
Pepton 10,0
Lab-Lemco meat extract 10,0
Yeast extract 5,0
D (-) Glucose 20,0
Tween 80 1 ml
K2HPO4 2,0
Sodium acetate 5,0
Triammonium citrate 2,0
MgSO4.7H2O 0,2
MnSO4.4H2O 0,05
Deionized water 1000 ml
All ingredients were dissolved in deionized water and pH was adjusted to 6,2 �
6,6. Medium was sterilized by autoclaving at 121°C for 15 minutes.
MRS AGAR g/l
Pepton 10,0
Lab-Lemco meat extract 10,0
Yeast extract 5,0
D (-) Glucose 20,0
Tween 80 1 ml
K2HPO4 2,0
Sodium acetate 5,0
Triammonium citrate 2,0
MgSO4.7H2O 0,2
MnSO4.4H2O 0,05
Agar 15,0
Deionized water 1000 ml

82
All ingredients were dissolved in deionized water and pH was adjusted to 6,2 �
6,6. Medium was sterilized by autoclaving at 121°C for 15 minutes.
B.2 M17 BROTH AND M17 AGAR
M17 BROTH g/l
Polypepton 5,0
Phyton pepton 5,0
Yeast extract 2,5
Meat extract 2,5
Lactose 5,0
Ascorbic acid 0,5
ß-disodium glycerolphospate 19,0
MgSO4(0,1M).7H2O 1 ml
Deionized water 1000 ml
All ingredients were dissolved in deionized water in a water bath for 20min. pH
was adjusted to 7,15 ±0,1. Medium was autoclaved at 121°C for 15 minutes.
M17 AGAR g/l
Polypepton 5,0
Phyton pepton 5,0
Yeast extract 2,5
Meat extract 2,5
Lactose 5,0
Ascorbic acid 0,5
ß-disodium glycerolphospate 19,0
MgSO4(0,1M).7H2O 1 ml
Agar 12,0
Deionized water 1000 ml
All ingredients except lactose were dissolved in 900ml deionized water by holding
in a water bath for 20min. pH was adjusted to 7,15 ±0,1. Medium was autoclaved at
121°C for 15 minutes.
Lactose was dissolved in 100ml deionized water, autoclaved at 121°C for 15
minutes. After sterilization lactose solution was added to medium.

83
APPENDIX C MEDIA FOR IDENTIFICATION
C.1. MEDIA FOR TESTING THE GROWTH AT DIFFERENT
TEMPERATURES
g/l
Pepton 10,0
Lab-Lemco meat extract 10,0
Yeast extract 5,0
D (-) Glucose 20,0
Tween 80 1 ml
K2HPO4 2,0
Sodium acetate 5,0
Triammonium citrate 2,0
MgSO4.7H2O 0,2
MnSO4.4H2O 0,05
Bromecresol purple 0,04
Deionized water 1000 ml
All ingredients were dissolved in deionized water and pH was adjusted to 6,2 �
6,6. Medium was sterilized by autoclaving at 121°C for 15 minutes.

84
C.2. MEDIA FOR TESTING THE GROWTH AT DIFFERENT NACL
CONCENTRATIONS
g/l
Pepton 10,0
Lab-Lemco meat extract 10,0
Yeast extract 5,0
D (-) Glucose 20,0
Tween 80 1 ml
K2HPO4 2,0
Sodium acetate 5,0
Triammonium citrate 2,0
MgSO4.7H2O 0,2
MnSO4.4H2O 0,05
Bromecresol purple 0,04
NaCl 20, 40,65 for each concentration of
2%, 4% and 6,5% NaCl
Deionized water 1000 ml
All ingredients were dissolved in deionized water and pH was adjusted to 6,2 � 6,6.
Medium was sterilized by autoclaving at 121°C for 15 minutes.
C.3 MEDIA FOR GAS FROM GLUCOSE
g/l
Pepton 10,0
Lab-Lemco meat extract 10,0
Yeast extract 5,0
D (-) Glucose 20,0
Tween 80 1 ml
K2HPO4 2,0
Sodium acetate 5,0
MgSO4.7H2O 0,2
MnSO4.4H2O 0,05
Deionized water 1000 ml
85
All ingredients were dissolved in deionized water and pH was adjusted to 6,2 � 6,6..It
was distrubuted into tubes containing inverted Durham tubes. Medium was sterilized by
autoclaving at 121°C for 15 minutes.
C.4 REDDY BROTH
g/l
Peptone 5,0
Yeast extract 5,0
K2HPO4 1,0
Arginine hyrochloride 5,0
Sodium citrate 20,0
Bromcresol purple 0,002
Deionized water 1000 ml
All ingredients were dissolved in deionized water and pH was adjusted to 6,2. It was
distrubuted into tubes containing inverted Durham tubes. Medium was sterilized by
autoclaving at 121°C for 15 minutes.
C.5 MODIFIED MRS FOR CHO FERMENTATIONS
g/l
Peptone 10,0
Lab-Lemco meat extract 10,0
Yeast extract 5,0
Tween 80 1 ml
K2HPO4 2,0
Sodium acetate 5,0
Triammonium citrate 2,0
MgSO4.7H2O 0,2
MnSO4.4H2O 0,05
Bromecresol purple 0,04
Deionized water 1000 ml
All ingredients were dissolved in deionized water and pH was adjusted to 6,2 �
6,6. Medium was sterilized by autoclaving at 121°C for 15 minutes.

86
C.6 ARGININE MRS
g/l
Peptone 10,0
Yeast extract 5,0
Tween 80 1 ml
K2HPO4 2,0
Sodium acetate 5,0
Sodium citrate 2,0
MgSO4.7H2O 0,2
MnSO4.4H2O 0,05
Arginine 1.5 g
Deionized water 1000 ml
All ingredients were dissolved in deionized water and pH was adjusted to 6,2 �
6,6. Medium was sterilized by autoclaving at 121°C for 15 minutes.

87
APPENDIX D CARBOHYDRATES
D 1. Sugars which were used for carbohydrate fermentations
1. L(+)-arabinose,
2. D(+) galactose,
3. Lactose,
4. Maltose,
5. D-mannitol,
6. Raffinose,
7. Sucrose,
8. D(-)salicin,
9. Sorbitol,
10. D(+) trehalose,
11. D(+)xylose,
12. Glycerol,
13. D(+)mannose,
14. D(-)ribose,

88
APPENDIX E BUFFERS AND STOCK SOLUTIONS
E.1. 1 M Tris-HCl pH 7.2
121.1 g Tris base was dissolved in 800 ml of deionized water. PH was adjusted
to 7.2 with concentrated HCl. Volume was brought to 1000 ml with deionized water.
E.2. 1 M Tris-HCl pH 8.0
121.1 g Tris base was dissolved in 800 ml of deionized water. PH was adjusted
to 8.0 with concentrated HCl. Volume was brought to 1000 ml with deionized water.
E.3. 0.5 M EDTA pH 8.0
186.12 g EDTA was dissolved in 800 ml of deionized water and pH is adjusted
to 8.0 with 10 N NaOH. Volume was brought to 1000 ml with deionized water.
E.3. 50 X TAE
242 g Tris base was dissolved in deionized water. After this, 57.1 ml glacial
acetic acid and 100 ml 0.5 M EDTA (pH 5.8) were added. Volume was brought to
1000 ml with deionized water.
E.5. 3 M NaCl
175.32 g NaCl was dissolved in deionized water and the volume was adjusted to
1000 ml.
E.6. 5 M NaCl
292.2 g NaCl was dissolved in deionized water and the volume was adjusted to
1000 ml.
E.7. 1 X TAE
20 ml of 50 X TAE buffer was taken and the volume was adjusted to 1000 ml
with deionized water.
E.8. ETHIDIUM BROMIDE STOCK SOLUTION (10 mg/ml )
0.5 g ethidium bromide was dissolved in 50 ml deionized water.

89
E.9. SODIUM ACETATE ( 3 M, pH 5.2)
408.1 g sodium acetate (3 H2O) was dissolved in 800 ml deionized water and pH
was adjusted to 5.2 by glacial acetic acid. Volume was brought to 1000 ml with
deionized water.
E.10. CHLOROFORM- ISOAMYL ALCOHOL SOLUTION
480 ml of chloroform was mixed with 2 ml of isoamyl alcohol.
E.11. PHENOL
First, phenol was melted. An equal volume of 0.5 M Tris HCl pH 8.0 was
added and mixture was stirred for 15 min. After turning off the strirrer , separated two
phases were obtained. Upper aqueous phase was removed and then an equal volume of
0.1 M Tris HCl pH 8.0 was added. After strirring for 15 min. Upper phase was
removed. Extraction was repeated until the pH of phenolic phase is > 7.8. After the
phenol was equilibrated and the final upper phase was removed, 0.1 M Tris HCl pH 8.0
containing 0.2 % β- mercaptoethanol. The phenol solution was distributed into 50 ml
falcon tubes and covered with aluminium papers to avoid light. It was stored in this
form at � 20 °C. Before using, 40 mg hydoxyquinoline was added for 40 ml phenol
solution (0.1 %) then yellow color was appeared. Yellow color provides a convenient
way to identify the phenol phase.
E.12. 1 XTE BUFFER
10 mM Tris pH 8.0
1 mM EDTA
E. 13. BOVIN SERUM ALBUMIN (BSA) 10 X
10 mg /ml , 150 µl BSA was diluted with 1.5 ml TE buffer. It was divided into
aliquots and stored at-20°

90
APPENDIX F PCR RECIPIES
F.1. PCR MIXTURE
Mg free Taq DNA polymerase buffer 5 µl
Mg Cl2 (25 mM) 3 µl
Sterile deionized water 32 µl
Oligo forward 10 picomole/µl 1 µl
Oligo reverse 10 picomole/µl 1 µl
d NTP (2 mM each ) 10 X 5 µl
F.2. RESTRICTION ENZYME MIXTURE
Restriction enzyme buffer 2 µl
Sterile deionized water 11 µl
Bovine serum albumin (10 X ) 2 µl
DNA 5 µl
Restriction enzyme (10 u/ µl) 0.2 µl (2 U)
F.3. TAQ DNA POLYMERASE ENZYME DILUTION
Mg free Taq DNA polymerase buffer 0.3 µl
Sterile deionized water 2.4 µl
Taq DNA polymerase 0.3 µl (1.5 U)
F.4. 6 x GEL LOADING BUFFER
10 X TBE 2 ml
Glycerol 6 ml
Deionized water 12 ml
Bromophenol blue was added with toothpick to obtain sufficient color.
F.5. d NTP (10 X)
10 µl of each 100 mM dATP, dCTP, dGTP and dTTP were taken. They were
mixed in 0.2 ml PCR tubes and 460 µl sterile deionized water was added and
mixed.Hence, 2 mM concentration was obtained for each of them.

91
APPENDIX G OLIGONUCLEOTIDES AND RESTRICTION ENZYMES
G.1. PRIMER OF EGE 1
EGE 1: 5�-AGAGTTTGATGATCCTGGCTCAG-3�
590 µg primer EGE 1 was dissolved in 295 µl of sterile deionized water to
obtain 2 µg/ml stock solutions. Five µl of stock solution was mixed with 95 µl sterile
deionized water. Hence, 100 µl, 10 picomole/µl working solution was obtained. Both
working and stock solutions were stored at -20°.
G.2. PRIMER OF L1
L1: 52-CAAGGCATCCACCGT-3�
350 µg primer EGE 1 was dissolved in 175 µl of sterile deionized water to
obtain 2 µg/ml stock solutions. Four µl of stock solution was mixed with 96
µl sterile deionized water. Hence, 100 µl, 10 picomole/µl working solution was
obtained. Both working and stock solutions were stored at -20°.
G.3. Taq I
5�-T GC A-3�
5�-T GC T -3�
G.4. Hae III
5�-GG CC-3�
5�-CC GG-3�

92
APPENDIX H
ACID ACTIVITY TEST RESULT H1. pH MEASUREMENT RESULTS Table H1.1. pH Changes in UHT skim milk during incubation at 30 °C for Lactococcus genus.
The genus Lactococcus
No
Isolate No 0h 3h 6h 9h 24h
1 A1 6,600 6,325 6,280 6,075 4,785 2 A2 6,600 6,000 4,815 4,360 4,190 3 A3 6,600 6,026 5,250 4,480 4,190 4 A5 6,600 5,985 4,790 4,345 4,185 5 A6 6,600 6,030 5,045 4,630 4,330 6 A7 6,600 6,320 6,350 6,250 5,310 7 A8 6,600 5,905 5,025 4,360 4,185 8 A9 6,600 5,975 4,775 4,370 4,205 9 A10 6,600 5,915 5,060 4,370 4,180 10 A11 6,600 6,035 4,675 4,365 4,185 11 A12 6,600 5,890 4,575 4,345 4,170 12 A13 6,600 6,265 5,295 4,690 4,240 13 A14 6,600 5,745 4,565 4,330 4,140 14 A16 6,600 6,330 6,310 6,240 5,685 15 A19 6,600 6,350 6,215 6,000 4,765 16 A20 6,600 5,780 4,595 4,315 4,150 17 A21 6,600 5,855 4,580 4,330 4,160 18 A22 6,600 5,820 4,555 4,330 4,160 19 A23 6,600 6,030 4,650 4,355 4,115 20 A25 6,600 6,025 4,730 4,350 4,145 21 A26 6,600 6,080 4,575 4,325 4,110 22 A27 6,600 5,980 5,010 4,560 4,285 23 A28 6,600 6,120 4,865 4,335 4,135 24 A29 6,600 6,335 6,305 6,220 5,555 25 A30 6,600 6,040 4,915 4,420 4,205 26 A35 6,600 6,285 5,640 5,360 4,775 27 A37 6,600 6,170 5,660 5,365 4,795 28 A40 6,600 6,385 6,355 6,170 5,040 29 A44 6,600 6,085 4,680 4,345 4,150 30 A45 6,600 6,155 4,925 4,435 4,190 31 A46 6,600 6,155 5,375 4,955 4,785 32 A47 6,600 6,040 4,865 4,400 4,205 33 A48 6,600 6,150 5,295 4,900 4,455 34 B8 6,600 6,350 6,160 5,605 4,290 35 B10 6,600 6,275 5,140 4,685 4,215

93
The genus Lactococcus
No
Isolate No 0h 3h 6h 9h 24h
36 B11 6,600 6,370 6,345 6,235 5,860 37 B15 6,600 6,085 5,140 4,420 4,135 38 B20 6,600 6,405 5,905 5,410 4,755 39 B21 6,600 6,375 5,645 5,245 4,550 40 C1 6,600 5,790 4,910 4,395 4,170 41 C4 6,600 5,895 5,470 5,005 4,490 36 B11 6,600 6,370 6,345 6,235 5,860 42 C10 6,600 5,900 4,920 4,400 4,170 43 C11 6,600 5,815 4,990 4,390 4,175 44 C15 6,600 5,780 5,005 4,395 4,145 45 C16 6,600 6,330 5,460 4,570 4,180 46 C18 6,600 5,860 4,855 4,395 4,175 47 C19I 6,600 6,085 5,070 4,505 4,215 48 C19II 6,600 6,310 5,215 4,510 4,200 49 C22 6,600 6,385 5,120 4,400 4,135 50 C24 6,600 6,290 4,975 4,365 4,115 51 C28 6,600 6,465 5,955 5,740 4,630 52 C32 6,600 6,335 5,675 4,465 4,110 53 C34 6,600 6,435 6,370 6,315 4,435 54 C35 6,600 5,960 5,705 4,465 4,105

94
Table H1.2. pH Changes in UHT skim milk during incubation at 30 °C for Enterecococcus genus
The genus Enterococcus
No
Isolate No 0 h 3 h 6 h 9 h 24 h
1 A17 6,600 6,325 5,530 5,070 4,420 2 A18 6,600 6,335 5,520 5,040 4,440 3 A31 6,600 6,295 5,330 4,550 4,175 4 A32 6,600 6,365 5,710 4,865 4,240 5 A33 6,600 6,345 5,585 5,270 4,470 6 A34 6,600 6,385 5,705 5,210 4,505 7 A38 6,600 6,415 5,970 5,325 4,505 8 A39 6,600 6,285 5,720 5,370 4,745 9 A41 6,600 6,425 5,845 5,520 4,755 10 A42 6,600 6,320 5,910 5,595 4,990 11 A43 6,600 6,300 5,735 5,425 4,820 12 A49 6,600 6,215 5,675 5,515 4,920 13 A50 6,600 6,230 5,905 5,530 4,990 14 A53 6,600 6,225 5,640 5,225 4,575 15 A56 6,600 6,380 6,085 5,680 5,060 16 A57 6,600 6,225 5,900 5,675 5,140 17 A58 6,600 6,270 5,820 5,600 5,560 18 A59 6,600 6,395 5,670 5,340 4,755 19 A60 6,600 6,320 5,580 5,175 4,545 20 A61 6,600 6,360 5,620 5,155 4,475 21 A62 6,600 6,395 5,650 5,185 4,490 22 A63 6,600 6,360 5,810 5,250 4,525 23 A64 6,600 6,370 5,700 5,245 4,545 24 A65 6,600 6,335 5,655 5,260 4,645 25 A66 6,600 6,435 5,755 5,365 4,720 26 A67 6,600 6,420 5,805 5,410 4,700 27 A68 6,600 6,390 5,680 5,360 4,690 28 A69 6,600 6,170 5,605 5,335 4,705 29 A70 6,600 6,400 5,795 5,465 4,875 30 A71 6,600 6,380 5,730 5,440 4,810 31 B16 6,600 6,370 5,565 5,370 4,805 32 B17 6,600 6,365 5,825 5,345 4,960 33 B19 6,600 6,340 5,640 5,280 4,675 34 B22 6,600 6,375 5,835 5,385 4,575 35 B23 6,600 6,500 5,465 5,360 4,725 36 B24 6,600 6,395 5,605 5,340 4,870 37 B25 6,600 6,410 5,800 5,340 4,700 38 B26 6,600 6,445 6,015 5,605 4,970 39 B27 6,600 6,500 6,205 5,790 5,135 40 B29 6,600 6,420 5,660 5,245 4,485 41 B30 6,600 6,415 5,660 5,175 4,405

95
The genus Enterococcus
No Isolate No
0 h 3 h 6 h 9 h 24 h
42 B31 6,600 6,380 5,725 5,215 4,460 43 B32 6,600 6,375 5,615 5,295 4,630 44 B33 6,600 6,455 5,805 5,450 4,710 45 B34 6,600 6,370 5,810 5,210 4,615 46 B35 6,600 6,265 5,785 5,165 4,385 47 B36 6,600 6,280 5,570 4,980 4,380 48 B37 6,600 6,265 5,765 5,125 4,435 49 C30 6,600 6,470 6,275 5,295 4,460 50 C31 6,600 6,380 6,065 5,500 4,735 51 C36 6,600 6,300 5,710 5,390 4,495 52 C38 6,600 6,310 6,105 5,440 4,465 53 C39 6,600 6,360 5,985 5,505 4,760 54 C40 6,600 6,395 6,120 5,555 4,600 55 C41 6,600 6,305 6,000 5,465 4,485 56 C42 6,600 6,365 5,890 5,470 4,665 57 C43 6,600 6,165 5,715 5,395 4,735 58 C46 6,600 6,465 6,325 5,995 4,830

96
Table H1.3. pH Changes in UHT skim milk during incubation at 30 °C for Lactobacillus genus.
The genus Lactobacillus
No
Isolate No 0 h 3 h 6 h 9 h 24 h
1 C3 6,600 6,250 6,105 5,990 5,665 2 C5 6,600 6,245 6,215 6,020 5,590 3 C7 6,600 6,350 6,155 5,975 5,545 4 C8 6,600 6,275 6,145 6,125 5,530 5 C9 6,600 6,245 5,990 5,850 5,415 6 C12 6,600 6,375 6,220 6,200 5,735 7 C27 6,600 6,070 5,505 5,490 4,460 8 C29 6,600 6,210 5,970 5,855 5,450 9 C37 6,600 6,215 5,730 5,305 4,255 10 C47 6,600 6,280 5,770 5,355 4,345 11 D1 6,600 6,405 6,035 5,725 4,645 12 D2 6,600 6,370 5,855 5,460 4,295 13 D3 6,600 6,180 5,730 5,275 4,355 14 D5 6,600 6,235 5,695 5,235 4,310 15 D6 6,600 6,370 6,270 6,195 5,985 16 D7 6,600 6,190 5,640 5,795 4,530 17 D8 6,600 6,405 6,285 6,145 5,835 18 D9 6,600 6,425 6,195 5,830 4,875

97
H2. LACTIC ACID PRODUCTION RESULTS Table H2.1. Lactic acid production in UHT skim milk during incubation at 30 °C for Lactococcus genus.
The genus Lactococcus
No
Isolate No
0 h (mg/ml)
3 h (mg/ml)
6 h (mg/ml)
9 h mg/ml)
24 h (mg/ml)
1 A1 1,587 1,887 2,081 2,477 5,951 2 A2 1,587 2,477 5,554 7,238 7,941 3 A3 1,587 1,887 4,064 6,647 8,331 4 A5 1,587 2,971 5,651 6,647 8,031 5 A6 1,587 2,380 4,461 6,145 7,538 6 A7 1,587 1,781 1,984 2,380 4,364 7 A8 1,587 2,477 4,858 6,938 8,128 8 A9 1,587 2,477 5,554 6,938 8,234 9 A10 1,587 2,380 4,761 6,541 8,128 10 A11 1,587 2,283 5,351 6,841 7,670 11 A12 1,587 2,874 6,444 7,141 7,538 12 A13 1,587 2,178 3,967 5,854 7,141 13 A14 1,587 3,077 6,251 7,538 7,732 14 A16 1,587 2,081 1,984 2,283 3,086 15 A19 1,587 2,081 1,984 2,680 5,748 16 A20 1,587 2,971 6,145 6,938 7,538 17 A21 1,587 2,777 6,251 6,444 7,441 18 A22 1,587 2,777 6,251 5,854 7,538 19 A23 1,587 2,380 5,748 6,444 7,238 20 A25 1,587 2,380 5,351 6,647 7,238 21 A26 1,587 2,380 5,951 6,841 6,938 22 A27 1,587 2,477 4,664 5,951 6,647 23 A28 1,587 2,178 5,157 6,251 7,335 24 A29 1,587 1,984 1,984 2,178 3,077 25 A30 1,587 2,380 4,664 5,951 6,541 26 A35 1,587 2,178 3,077 3,870 4,761 27 A37 1,587 2,178 2,971 3,967 5,157 28 A40 1,587 1,887 1,984 2,283 4,664 29 A44 1,587 2,380 5,748 6,541 6,744 30 A45 1,587 2,178 4,664 6,348 6,938 31 A46 1,587 2,178 3,570 5,060 6,647 32 A47 1,587 1,887 5,157 6,744 6,444 33 A48 1,587 2,178 5,060 5,060 5,748 34 B8 1,587 1,984 2,380 3,368 7,441 35 B10 1,587 2,178 4,364 5,951 7,141 36 B11 1,587 1,984 2,178 2,380 2,777 37 B15 1,587 2,380 4,461 6,841 7,538 38 B20 1,587 1,984 2,680 3,570 5,316 39 B21 1,587 1,984 3,174 4,161 6,145 40 C1 1,587 2,874 5,554 7,934 8,631

98
The genus of Lactococcus
No
Isolate No
0 h
(mg/ml) 3 h
mg/ml) 6 h
(mg/ml) 9 h
(mg/ml) 24 h
(mg/ml) 41 C4 1,587 2,680 3,967 5,554 7,141 42 C10 1,587 2,874 5,457 7,732 8,922 43 C11 1,587 3,077 5,157 7,538 8,728 44 C15 1,587 2,971 5,060 7,934 8,825 45 C16 1,587 2,283 3,667 7,141 8,428 46 C18 1,587 2,874 5,651 7,538 8,631 47 C19I 1,587 2,777 5,060 7,335 7,837 48 C19II 1,587 2,477 4,664 7,335 8,331 49 C22 1,587 2,380 5,254 7,635 8,631 50 C24 1,587 2,477 5,651 7,538 8,631 51 C28 1,587 2,178 3,077 3,474 6,841 52 C32 1,587 2,283 3,474 7,740 8,728 53 C34 1,587 2,283 2,380 2,574 7,335 54 C35 1,587 2,971 3,368 7,538 8,428

99
Table H 2.2. Lactic acid production in UHT skim milk during incubation at 30 °C for Enterecoccus genus.
The genus Enterococcus
No
Isolate No
0 h (mg/ml)
3 h (mg/ml)
6 h (mg/ml)
9 h (mg/ml)
24 h (mg/ml)
1 A17 1,587 1,984 3,368 4,655 6,251 2 A18 1,587 1,984 3,368 4,558 6,251 3 A31 1,587 1,984 3,667 6,251 6,938 4 A32 1,587 1,984 2,971 5,254 6,744 5 A33 1,587 1,984 2,971 3,474 3,570 6 A34 1,587 1,984 2,971 4,558 5,157 7 A38 1,587 1,984 2,574 4,364 6,251 8 A39 1,587 2,178 2,777 3,967 5,351 9 A41 1,587 1,984 2,574 3,271 4,955 10 A42 1,587 1,887 2,574 3,271 4,858 11 A43 1,587 2,081 2,874 3,870 5,157 12 A49 1,587 2,081 2,971 3,474 5,254 13 A50 1,587 2,081 2,574 3,368 4,858 14 A53 1,587 2,081 2,777 3,271 6,348 15 A56 1,587 1,887 2,283 2,971 4,858 16 A57 1,587 2,081 2,574 3,077 5,351 17 A58 1,587 2,081 2,574 2,698 4,858 18 A59 1,587 1,984 2,971 3,570 5,457 19 A60 1,587 1,984 3,174 4,161 5,951 20 A61 1,587 1,984 3,174 4,267 5,951 21 A62 1,587 1,984 2,971 4,064 5,854 22 A63 1,587 1,984 2,874 4,161 5,951 23 A64 1,587 1,984 2,971 4,161 5,951 24 A65 1,587 1,887 2,874 3,870 5,748 25 A66 1,587 1,781 2,777 3,764 5,457 26 A67 1,587 1,781 2,680 3,570 5,457 27 A68 1,587 1,684 2,874 3,870 5,457 28 A69 1,587 2,275 3,174 4,064 5,951 29 A70 1,587 1,984 2,971 3,667 5,457 30 A71 1,587 1,984 2,971 3,764 5,254 31 B16 1,587 1,984 3,271 3,667 5,951 32 B17 1,587 1,984 2,777 3,870 5,060 33 B19 1,587 1,984 3,077 4,064 5,457 34 B22 1,587 2,178 3,077 4,267 6,647 35 B23 1,587 1,887 3,077 3,967 5,554 36 B24 1,587 2,081 3,077 4,064 5,060 37 B25 1,587 2,081 2,971 4,161 5,854 38 B26 1,587 1,984 2,680 3,271 5,060 39 B27 1,587 1,984 2,477 3,174 4,558 40 B29 1,587 2,081 3,271 4,364 6,348 41 B30 1,587 1,984 3,174 4,461 6,647

100
The genus Enterococus
No Isolate No
0h
(mg/ml) 3h
(mg/ml) 6h
(mg/ml) 9h
(mg/ml) 24h
(mg/ml)
42 B31 1,587 2,081 3,174 4,461 6,841 43 B32 1,587 2,081 3,368 4,364 5,854 44 B33 1,587 2,081 2,971 4,161 5,748 45 B34 1,587 2,178 2,971 4,858 6,841 46 B35 1,587 2,380 3,077 4,955 7,837 47 B36 1,587 2,380 3,474 5,554 7,732 48 B37 1,587 2,380 3,077 4,955 7,732 49 C30 1,587 2,178 2,477 4,664 7,441 50 C31 1,587 2,283 2,777 3,967 6,251 51 C36 1,587 2,477 3,870 4,267 8,331 52 C38 1,587 2,477 2,777 4,064 7,335 53 C39 1,587 2,283 2,874 3,667 6,251 54 C40 1,587 2,283 2,777 3,667 6,841 55 C41 1,587 2,574 2,874 3,870 6,841 56 C42 1,587 2,380 3,077 3,967 6,251 57 C43 1,587 2,777 3,368 6,048 6,145 58 C46 1,587 2,283 2,380 2,971 5,748

101
Table H 2.3. Lactic acid production in UHT skim milk during incubation at 30 °C for Lactobacillus genus.
The genus Lactobacillus
No
Isolate No
0 h (mg/ml)
3 h (mg/ml)
6 h (mg/ml)
9 h (mg/ml)
24 h (mg/ml)
1 C3 1,587 2,574 2,777 2,971 3,570 2 C5 1,587 2,680 2,477 2,874 3,570 3 C7 1,587 2,283 2,574 2,777 3,870 4 C8 1,587 2,380 2,574 2,574 3,870 5 C9 1,587 2,380 2,874 3,174 4,558 6 C12 1,587 2,380 2,477 2,680 4,064 7 C27 1,587 2,971 4,258 4,461 9,821 8 C29 1,587 2,574 2,680 3,271 4,955 9 C37 1,587 2,380 3,174 4,161 9,424 10 C47 1,587 2,380 3,174 3,967 9,323 11 D1 1,587 2,178 2,574 3,271 7,335 12 D2 1,587 2,283 2,874 3,667 8,825 13 D3 1,587 2,574 2,971 4,267 9,028 14 D5 1,587 2,477 2,680 4,461 9,028 15 D6 1,587 2,380 2,380 2,477 3,271 16 D7 1,587 2,477 3,271 3,271 8,128 17 D8 1,587 2,283 2,380 2,380 3,667 18 D9 1,587 2,178 2,380 3,077 6,145

131
APPENDIX I
Table I.1 Reference strains subjected to physiological and biochemical tests Test in Reddy
Broth
Species name
2% N
aCl
4% N
aCl
6.5
% N
aCl
10 °C
40 °C
45 °C
Col
or
Gas
Gro
wth
CO
2fro
m g
luco
se
Xyl
ose
Rib
ose
Gal
acto
se
Ara
bino
se
Treh
alos
e
Raf
finos
e
Mal
tose
Man
nito
l
Sucr
ose
Sorb
itol
Lact
ose
Gyc
erol
Salic
in
Man
nose
Glu
cose
L.lactis ssp. lactis CECT
4432
+ + - + + - - - + - - + + - + - + + + - + - + + +
L lactis ssp. lactis
A 216
+ + - + + - - - + - - + + - + - + + + - + - + + +
L.lactis ssp.diacetylactis
CECT 4432
+ + - + + - - + + - - + + - + + + + + - + - + + +
E. facecium CECT 4102 + + + + + + - - + - - + + + + - + + - - + - + + +
E. faecalis CECT 184 + + + + + + - - + - - + + - + - + + +/- + + + + + +
E. gallinarum CECT 4102 + + - + + + + - + - + + + + + + + + +/- + + - + + +
Species Name 6.5%
NaC
l
15 °C
45 °C
Arg
inin
e
CO
2 glu
cose
Xyl
ose
Rib
ose
Gal
acto
se
Ara
bino
se
Treh
alos
e
Raf
finos
e
Mal
tose
Man
nito
l
Sucr
ose
Sorb
itol
Lact
ose
Gyc
erol
Salic
in
Man
nose
Glu
cose
Lactobacillus curvatus DSM 8768
+ - - - + + - + - + - - - + - + + +
Lactobacillus casei subsp. casei NRRL-B 1922
+ - - - - + + - + - + + + + + - + + +
102


![B T 6ÕQÕI S ORULAR øQJLOL]FHodsgm.meb.gov.tr/kurslar/pdf/beceri/testler/1920/ing/5_ing_1.pdfMEB 2019 - 2020 lme, Deerlendirme ve Sınav Hizmetleri Genel Mdrl Read Michelle’s speech](https://img.pdfslide.us/doc/110x75/5e6c47ec1821171520427994/b-t-6qi-s-orular-qjlol-meb-2019-2020-lme-deerlendirme-ve-snav-hizmetleri.jpg)