Embed Size (px)
Citation preview
Food Sci. Technol, Campinas, 41(3): 643-652, July-Sep 2021 643/652 643
Food Science and Technology
OI: D https://doi.org/10.1590/fst.24620
ISSN 0101-2061 (Print)ISSN 1678-457X (Online)
1 IntroductionMoringa oleifera L. belongs to the family Moringaceae is
extensively cultivated in Africa, Asia, Philippines, North Africa and South Asia (Coppin, 2008). It is significant due to its high health impacting proteins, amino acids and phytochemicals (Vergara-Jimenez et al., 2017). Consumers attention towards plant proteins have proved this as primary source of protein in the diet (Mune et al., 2016). Consumers are becoming more health conscious and tending towards natural products because of no side effects that’s why they are being used as functional food constituent. The results of different studies revealed that moringa supplementation can provide protein having essential amino acids, carbohydrates, vitamins and minerals like potassium, iron, calcium and phosphorus. Certain ailments also can be mitigated by using moringa based products (Sengev et al., 2013).
Moringa is also called as miracle tree as it can treat and recover about three hundred diseases (Nwakalor et al., 2014).
Niaziminin (thiocarbamate) is bioactive compound in moringa which has chemo preventive and anti-carcinogenic properties, moreover it can also associate with thyroid hormone treatments. Moringa possess various activities like antihypertensive by having a stabilizing effect on blood pressure, anti-inflammatory by showing positive effect on glandular swelling, antidiabetic as it lowers the blood glucose level, anti-microbial in inhibiting E. coli growth i.e. (Vergara-Jimenez et al., 2017).
The isolation of protein from different parts of moringa such as from seeds, leaves and flowers has introduced recently. The differences between isolate and the concentrates of a protein is that in isolate the percentage of protein is 85-90% but in the concentrate the percentage is up to 60%. The protein isolate is preferred and contains all the essential amino acids. Among essential amino acids leucine has the highest amount i.e. 6.65% of the total protein. Phenylalanine, valine, lysine and
Isolation and characterization of moringa oleifera l. Flower protein and utilization in functional food bars
Muhammad Sameem JAVED1* , Adnan AMJAD1, Mohibullah SHAH2, Faiz-ul- Hassan SHAH3, Hasan SARDAR4, Muhammad Rizwan TARIQ5, Ammar Ahmad KHAN3,
Muhammad Wasim SAJID6, Umair ALI7, Muhammad AMIR1, Farva NASIR1
a
Received 19 May, 2020 Accepted 17 Sept., 20201Institute of Food Science and Nutrition, Bahauddin Zakariya University, Multan, Punjab-Pakistan2Department of Biochemistry, Bahauddin Zakariya University Multan-Pakistan3University Institute of Diet and Nutritional Sciences, The University of Lahore, Punjab Pakistan4Department of Horticulture, Bahauddin Zakariya University Multan-Pakistan5Institute of Agricultural Sciences, University of the Punjab, Lahore- Pakistan6Department of Bioscience, COMSATS University Islamabad, Sahiwal Campus7National Institute of Food Science and Technology, University of Agriculture Faisalabad, Punjab-Pakistan*Corresponding author: [email protected]
AbstractMoringa the miracle tree is rich source of protein and its protein content are comparable with meat protein. In the current study protein was isolated from moringa flowers and utilized in preparation of bars. Physicochemical analysis like texture, color, caloric value, water activity, pH and sensory characteristics were determined to evaluate the nutritional and quality attributes of bars. Different concentration of isolated protein was used in the preparedness. Among all treatments T4 (15% protein isolate) and T3 (10% protein isolate) were best as they had the highest caloric value i.e. 498.33 and 480.37 kcal and high protein percentage 42.55 and 35.29%. T4 and T3 also were good in all textural parameters i.e. hardness 4.68 and 4.85 kg, firmness 3.88 and 3.67 kg, toughness 3.78 and 3.63 kg and work of shear 16.84 and 16.80 kg/mm. The obtained results indicated that the incorporation of moringa protein isolate in bars not only increase their aesthetic value but also increase their nutritional profile. High quality protein isolated from moringa is cheaper and easily grown with little care to provide ample supply of moringa protein to peoples which were in concern of money for provision of proteinaceous food to their families to combat malnutrition.
Keywords: protein isolate; energy bars; malnutrition; texture; sensory characteristics
Practical application: In the current study isolation of protein from moringa flower was done and its applications in bars was carried out to prepare energy rich bars. Moringa flower protein can be used in confectionary and snack industry to prepare candies, bars and different bakery items that will not only create variety in the market but also provide highly nutritious food that will help to expand its use in human food.
Food Sci. Technol, Campinas, 41(3): 643-652, July-Sep 2021644 644/652
Physicochemical Analysis of Moringa Protein Fortified Food Bars
isoleucine are also found in higher amounts than threonine, tryptophan and methionine (Aja et al., 2014)
Protein bars have an important role in our life as these are fast and nourishing baked goods. When the hunger pangs hit between meals, or you have just finished a strenuous workout, bars provide satiety and quality protein, that can combat malnutrition and keep motivated to stay on track to accomplish the weight loss goals. The functionality of moringa protein isolate is in competition with the soy protein isolate. Different methods of protein isolation have been used to isolate protein from moringa and utilize it in functional foods and pharmaceutical products as a protein supplement. Value addition of moringa protein isolate in different products as in protein-energy bars, high energy cookies, soups and beverages can be used to relinquish protein energy malnutrition (Jain et al., 2019). The objective of this work was the extraction of proteins from the moringa flower for preparation and nutritional evaluation of food bars.
2 Materials and methods
2.1 Procurement of Material
Moringa flowers were procured from Multan, Pakistan. Flowers were manually cleaned to remove all types of dirt particles then the flowers were set for drying (sun, shade and hot air oven at 106 °C). Dried flowers were milled (Perton Miller 0.5 μm) to obtain fine powder of moringa flowers. The obtained powder was packed in sealed polyethylene bags at ambient temperature for further analyses. The obtained powder among three different drying methods with highest protein content was subjected for isolation of protein.
2.2 Isolation of protein
Protein isolation was carried out by following the method of Houde et al. (2018) and Wang et al. (1999). Sample was defatted and incorporated in distilled water at ratio of 1:15, after mixing it thoroughly, 2 normal solution of NaOH was introduced in it by drops till pH of the sample become 10. Orbital shaker at speed of 400 rpm was used for mixing for 15 minutes. The obtained sample was put in centrifugation machine after putting them in centrifugation tubes at 6000 rpm speed at 4 °C for half hour. The layers formed after centrifugation were separated from each other i.e. supernatant and residual and kept in different beakers. In the same way obtained 3 supernatants from the residual by repeating the above procedure and mix them all. pH of the obtained supernatants was decreased to 4.5 by addition of 2 normal solution of HCl. The finalized supernatants were centrifuged, and residual remained was isolate of moringa protein. The light pink colored isolate was then stored at -80 °C after adjusting its pH at 7.
2.3 Treatment plan
Functional food bars were developed by using different ratios of moringa isolate keeping all other ingredients (Sugar, white flour, oil and baking powder) according to standard recipe. Treatment plan is given in the Table 1.
2.4 Physicochemical analysis of Moringa Bars
Proximate analyses
Proximate analysis (moisture, protein, fat, fiber and ash) of moringa bars were conducted by following the method of AOAC (2016).
Color Measurement:
The color of Moringa protein bars were determined by following the method of Al-Juhaimi et al. (2016) during storage. Minolta Chroma meter was used to determine the color of bars. Colors were expressed in CIE color space (1976) L-a-b, L* stands for lightening, a* stands for Red and Green and b* stands for Yellow.
Texture Analysis
The texture analysis of bars was carried out by the method of Al-Juhaimi et al. (2016). Parameters like hardness (kg), firmness (kg), toughness (kg) and work of shear (kg/mm) were evaluated using a texture analyzer, having a cylindrical probe 8mm in diameter, 36mm in length with speed of 0.5mm/sec, ratio of compression 5% and loading cell of 500N by using texture analyzer (Mod. TA-XT2, stable microsystems, surrey, UK). All tests were carried out at room temperature (20 °C) Using a velocity of 100mm/min. Mean values were determined and compared with that of the literature.
Caloric Value
The caloric values of moringa bars were examined after every seven days by using the Bomb calorimeter following (Heitschmidt, 2015).
Water activity
Water activity of the protein bars were determined at different days interval i.e. 0, 7, 14, 21 and 28 by using a water activity meter (Model Aw-Win, Rotronic, equipped with a Karl-Fast Prob) following the method of Mathlouthi, (2001).
pH
The pH of the bars was determined by following the method of Nadeem et al. (2012). Powdered 5 g sample was taken in flask and 30 mL distilled water was added in it. The sample was mixed thoroughly on orbital shaker at 200 rpm for 10 minutes. Then the pH of the sample was determined by dipping pH meter electrode in the sample.
Sensory Evaluation
Sensory parameters and organoleptic characteristics of bars were evaluated by following the Meilgaard et al. (2007)
Table 1. Treatment plan for the Moringa flower protein bars.
Treatments T0 T1 T2 T3 T4
Moringa flower powder -- 10% -- -- --
Moringa protein Isolate -- 5% 10% 15%
Javed et al.
Food Sci. Technol, Campinas, 41(3): 643-652, July-Sep 2021 645/652 645
using 9-point hedonic scale. Sensory panel of the institute was guided to evaluate, flavor, color, mouth feel, texture and overall acceptability.
Statistical analysis
Data was analyzed statistically to check the significance. Two factor factorial design under completely randomized designed was applied to determine the effect of different treatments and storage days (Steel et al., 1997).
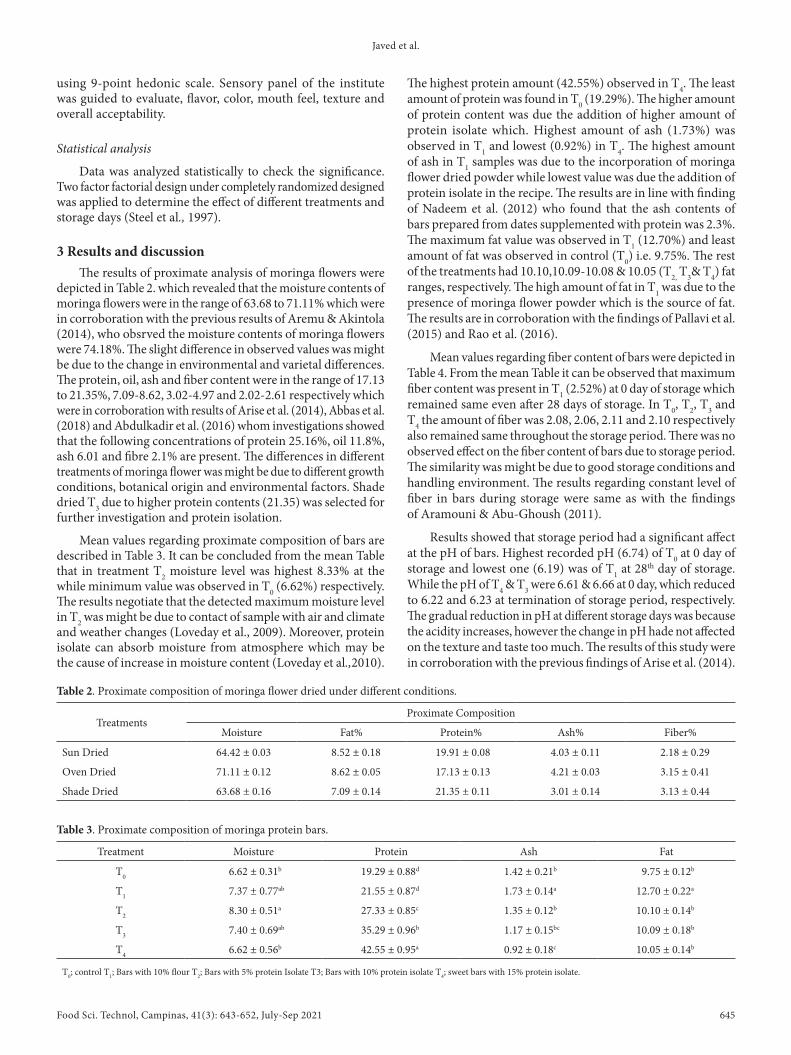
3 Results and discussionThe results of proximate analysis of moringa flowers were
depicted in Table 2. which revealed that the moisture contents of moringa flowers were in the range of 63.68 to 71.11% which were in corroboration with the previous results of Aremu & Akintola (2014), who obsrved the moisture contents of moringa flowers were 74.18%. The slight difference in observed values was might be due to the change in environmental and varietal differences. The protein, oil, ash and fiber content were in the range of 17.13 to 21.35%, 7.09-8.62, 3.02-4.97 and 2.02-2.61 respectively which were in corroboration with results of Arise et al. (2014), Abbas et al. (2018) and Abdulkadir et al. (2016) whom investigations showed that the following concentrations of protein 25.16%, oil 11.8%, ash 6.01 and fibre 2.1% are present. The differences in different treatments of moringa flower was might be due to different growth conditions, botanical origin and environmental factors. Shade dried T3 due to higher protein contents (21.35) was selected for further investigation and protein isolation.
Mean values regarding proximate composition of bars are described in Table 3. It can be concluded from the mean Table that in treatment T2 moisture level was highest 8.33% at the while minimum value was observed in T0 (6.62%) respectively. The results negotiate that the detected maximum moisture level in T2 was might be due to contact of sample with air and climate and weather changes (Loveday et al., 2009). Moreover, protein isolate can absorb moisture from atmosphere which may be the cause of increase in moisture content (Loveday et al.,2010).
The highest protein amount (42.55%) observed in T4. The least amount of protein was found in T0 (19.29%). The higher amount of protein content was due the addition of higher amount of protein isolate which. Highest amount of ash (1.73%) was observed in T1 and lowest (0.92%) in T4. The highest amount of ash in T1 samples was due to the incorporation of moringa flower dried powder while lowest value was due the addition of protein isolate in the recipe. The results are in line with finding of Nadeem et al. (2012) who found that the ash contents of bars prepared from dates supplemented with protein was 2.3%. The maximum fat value was observed in T1 (12.70%) and least amount of fat was observed in control (T0) i.e. 9.75%. The rest of the treatments had 10.10,10.09-10.08 & 10.05 (T2, T3& T4) fat ranges, respectively. The high amount of fat in T1 was due to the presence of moringa flower powder which is the source of fat. The results are in corroboration with the findings of Pallavi et al. (2015) and Rao et al. (2016).
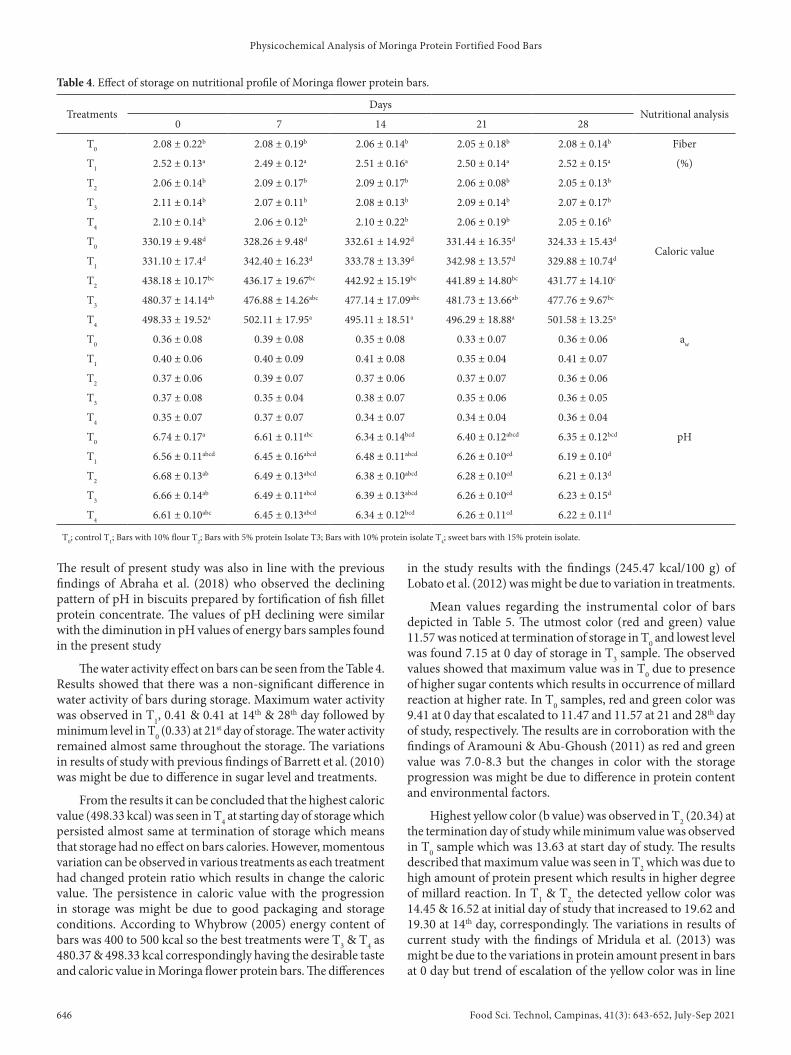
Mean values regarding fiber content of bars were depicted in Table 4. From the mean Table it can be observed that maximum fiber content was present in T1 (2.52%) at 0 day of storage which remained same even after 28 days of storage. In T0, T2, T3 and T4 the amount of fiber was 2.08, 2.06, 2.11 and 2.10 respectively also remained same throughout the storage period. There was no observed effect on the fiber content of bars due to storage period. The similarity was might be due to good storage conditions and handling environment. The results regarding constant level of fiber in bars during storage were same as with the findings of Aramouni & Abu‐Ghoush (2011).
Results showed that storage period had a significant affect at the pH of bars. Highest recorded pH (6.74) of T0 at 0 day of storage and lowest one (6.19) was of T1 at 28th day of storage. While the pH of T4 & T3 were 6.61 & 6.66 at 0 day, which reduced to 6.22 and 6.23 at termination of storage period, respectively. The gradual reduction in pH at different storage days was because the acidity increases, however the change in pH hade not affected on the texture and taste too much. The results of this study were in corroboration with the previous findings of Arise et al. (2014).
Table 2. Proximate composition of moringa flower dried under different conditions.
TreatmentsProximate Composition
Moisture Fat% Protein% Ash% Fiber%
Sun Dried 64.42 ± 0.03 8.52 ± 0.18 19.91 ± 0.08 4.03 ± 0.11 2.18 ± 0.29
Oven Dried 71.11 ± 0.12 8.62 ± 0.05 17.13 ± 0.13 4.21 ± 0.03 3.15 ± 0.41
Shade Dried 63.68 ± 0.16 7.09 ± 0.14 21.35 ± 0.11 3.01 ± 0.14 3.13 ± 0.44
Table 3. Proximate composition of moringa protein bars.
Treatment Moisture Protein Ash Fat
T0 6.62 ± 0.31b 19.29 ± 0.88d 1.42 ± 0.21b 9.75 ± 0.12b
T1 7.37 ± 0.77ab 21.55 ± 0.87d 1.73 ± 0.14a 12.70 ± 0.22a
T2 8.30 ± 0.51a 27.33 ± 0.85c 1.35 ± 0.12b 10.10 ± 0.14b
T3 7.40 ± 0.69ab 35.29 ± 0.96b 1.17 ± 0.15bc 10.09 ± 0.18b
T4 6.62 ± 0.56b 42.55 ± 0.95a 0.92 ± 0.18c 10.05 ± 0.14b
T0; control T1; Bars with 10% flour T2; Bars with 5% protein Isolate T3; Bars with 10% protein isolate T4; sweet bars with 15% protein isolate.
Food Sci. Technol, Campinas, 41(3): 643-652, July-Sep 2021646 646/652
Physicochemical Analysis of Moringa Protein Fortified Food Bars
The result of present study was also in line with the previous findings of Abraha et al. (2018) who observed the declining pattern of pH in biscuits prepared by fortification of fish fillet protein concentrate. The values of pH declining were similar with the diminution in pH values of energy bars samples found in the present study
The water activity effect on bars can be seen from the Table 4. Results showed that there was a non-significant difference in water activity of bars during storage. Maximum water activity was observed in T1, 0.41 & 0.41 at 14th & 28th day followed by minimum level in T0 (0.33) at 21st day of storage. The water activity remained almost same throughout the storage. The variations in results of study with previous findings of Barrett et al. (2010) was might be due to difference in sugar level and treatments.
From the results it can be concluded that the highest caloric value (498.33 kcal) was seen in T4 at starting day of storage which persisted almost same at termination of storage which means that storage had no effect on bars calories. However, momentous variation can be observed in various treatments as each treatment had changed protein ratio which results in change the caloric value. The persistence in caloric value with the progression in storage was might be due to good packaging and storage conditions. According to Whybrow (2005) energy content of bars was 400 to 500 kcal so the best treatments were T3 & T4 as 480.37 & 498.33 kcal correspondingly having the desirable taste and caloric value in Moringa flower protein bars. The differences
in the study results with the findings (245.47 kcal/100 g) of Lobato et al. (2012) was might be due to variation in treatments.
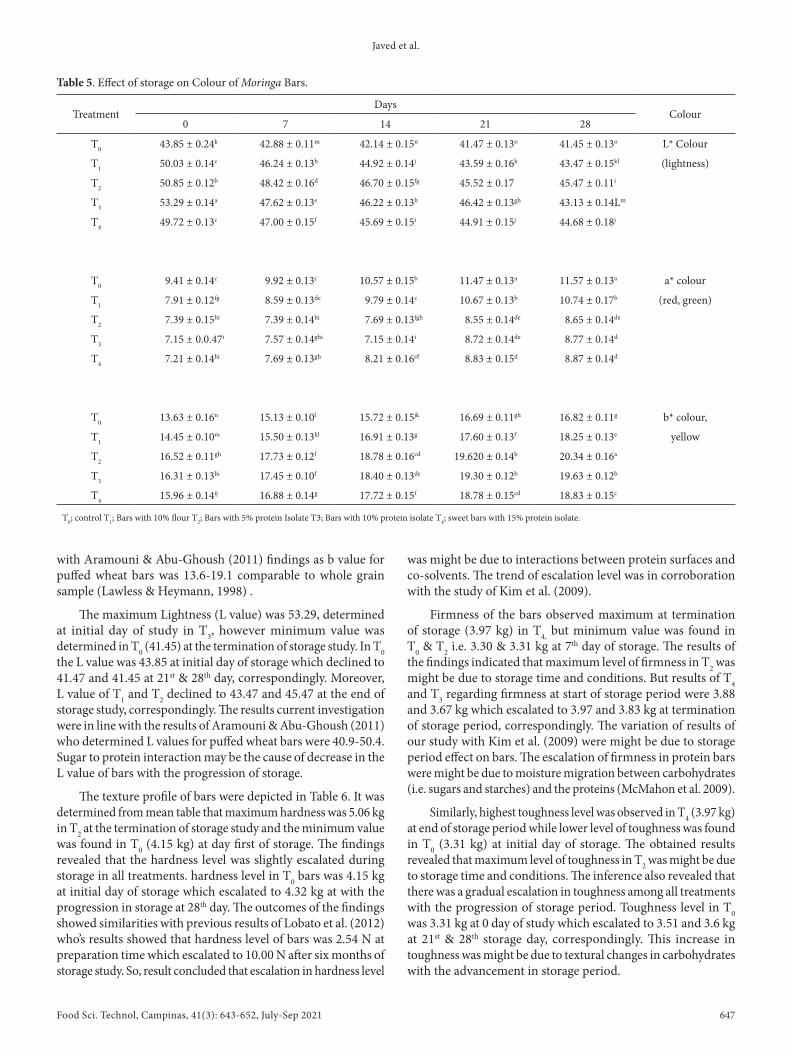
Mean values regarding the instrumental color of bars depicted in Table 5. The utmost color (red and green) value 11.57 was noticed at termination of storage in T0 and lowest level was found 7.15 at 0 day of storage in T3 sample. The observed values showed that maximum value was in T0 due to presence of higher sugar contents which results in occurrence of millard reaction at higher rate. In T0 samples, red and green color was 9.41 at 0 day that escalated to 11.47 and 11.57 at 21 and 28th day of study, respectively. The results are in corroboration with the findings of Aramouni & Abu‐Ghoush (2011) as red and green value was 7.0-8.3 but the changes in color with the storage progression was might be due to difference in protein content and environmental factors.
Highest yellow color (b value) was observed in T2 (20.34) at the termination day of study while minimum value was observed in T0 sample which was 13.63 at start day of study. The results described that maximum value was seen in T2 which was due to high amount of protein present which results in higher degree of millard reaction. In T1 & T2, the detected yellow color was 14.45 & 16.52 at initial day of study that increased to 19.62 and 19.30 at 14th day, correspondingly. The variations in results of current study with the findings of Mridula et al. (2013) was might be due to the variations in protein amount present in bars at 0 day but trend of escalation of the yellow color was in line
Table 4. Effect of storage on nutritional profile of Moringa flower protein bars.
TreatmentsDays
Nutritional analysis0 7 14 21 28
T0 2.08 ± 0.22b 2.08 ± 0.19b 2.06 ± 0.14b 2.05 ± 0.18b 2.08 ± 0.14b Fiber
T1 2.52 ± 0.13a 2.49 ± 0.12a 2.51 ± 0.16a 2.50 ± 0.14a 2.52 ± 0.15a (%)
T2 2.06 ± 0.14b 2.09 ± 0.17b 2.09 ± 0.17b 2.06 ± 0.08b 2.05 ± 0.13b
T3 2.11 ± 0.14b 2.07 ± 0.11b 2.08 ± 0.13b 2.09 ± 0.14b 2.07 ± 0.17b
T4 2.10 ± 0.14b 2.06 ± 0.12b 2.10 ± 0.22b 2.06 ± 0.19b 2.05 ± 0.16b
T0 330.19 ± 9.48d 328.26 ± 9.48d 332.61 ± 14.92d 331.44 ± 16.35d 324.33 ± 15.43d
Caloric valueT1 331.10 ± 17.4d 342.40 ± 16.23d 333.78 ± 13.39d 342.98 ± 13.57d 329.88 ± 10.74d
T2 438.18 ± 10.17bc 436.17 ± 19.67bc 442.92 ± 15.19bc 441.89 ± 14.80bc 431.77 ± 14.10c
T3 480.37 ± 14.14ab 476.88 ± 14.26abc 477.14 ± 17.09abc 481.73 ± 13.66ab 477.76 ± 9.67bc
T4 498.33 ± 19.52a 502.11 ± 17.95a 495.11 ± 18.51a 496.29 ± 18.88a 501.58 ± 13.25a
T0 0.36 ± 0.08 0.39 ± 0.08 0.35 ± 0.08 0.33 ± 0.07 0.36 ± 0.06 aw
T1 0.40 ± 0.06 0.40 ± 0.09 0.41 ± 0.08 0.35 ± 0.04 0.41 ± 0.07
T2 0.37 ± 0.06 0.39 ± 0.07 0.37 ± 0.06 0.37 ± 0.07 0.36 ± 0.06
T3 0.37 ± 0.08 0.35 ± 0.04 0.38 ± 0.07 0.35 ± 0.06 0.36 ± 0.05
T4 0.35 ± 0.07 0.37 ± 0.07 0.34 ± 0.07 0.34 ± 0.04 0.36 ± 0.04
T0 6.74 ± 0.17a 6.61 ± 0.11abc 6.34 ± 0.14bcd 6.40 ± 0.12abcd 6.35 ± 0.12bcd pH
T1 6.56 ± 0.11abcd 6.45 ± 0.16abcd 6.48 ± 0.11abcd 6.26 ± 0.10cd 6.19 ± 0.10d
T2 6.68 ± 0.13ab 6.49 ± 0.13abcd 6.38 ± 0.10abcd 6.28 ± 0.10cd 6.21 ± 0.13d
T3 6.66 ± 0.14ab 6.49 ± 0.11abcd 6.39 ± 0.13abcd 6.26 ± 0.10cd 6.23 ± 0.15d
T4 6.61 ± 0.10abc 6.45 ± 0.13abcd 6.34 ± 0.12bcd 6.26 ± 0.11cd 6.22 ± 0.11d
T0; control T1; Bars with 10% flour T2; Bars with 5% protein Isolate T3; Bars with 10% protein isolate T4; sweet bars with 15% protein isolate.
Javed et al.
Food Sci. Technol, Campinas, 41(3): 643-652, July-Sep 2021 647/652 647
with Aramouni & Abu‐Ghoush (2011) findings as b value for puffed wheat bars was 13.6-19.1 comparable to whole grain sample (Lawless & Heymann, 1998) .
The maximum Lightness (L value) was 53.29, determined at initial day of study in T3, however minimum value was determined in T0 (41.45) at the termination of storage study. In T0 the L value was 43.85 at initial day of storage which declined to 41.47 and 41.45 at 21st & 28th day, correspondingly. Moreover, L value of T1 and T2 declined to 43.47 and 45.47 at the end of storage study, correspondingly. The results current investigation were in line with the results of Aramouni & Abu‐Ghoush (2011) who determined L values for puffed wheat bars were 40.9-50.4. Sugar to protein interaction may be the cause of decrease in the L value of bars with the progression of storage.
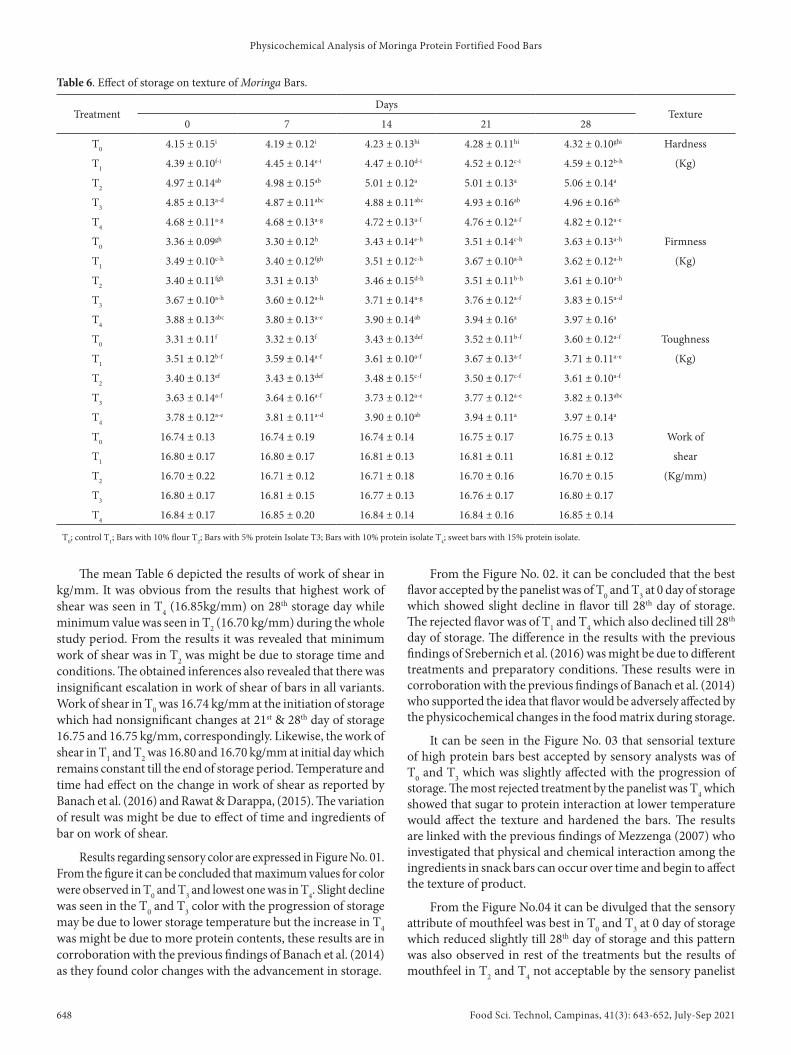
The texture profile of bars were depicted in Table 6. It was determined from mean table that maximum hardness was 5.06 kg in T2 at the termination of storage study and the minimum value was found in T0 (4.15 kg) at day first of storage. The findings revealed that the hardness level was slightly escalated during storage in all treatments. hardness level in T0 bars was 4.15 kg at initial day of storage which escalated to 4.32 kg at with the progression in storage at 28th day. The outcomes of the findings showed similarities with previous results of Lobato et al. (2012) who’s results showed that hardness level of bars was 2.54 N at preparation time which escalated to 10.00 N after six months of storage study. So, result concluded that escalation in hardness level
was might be due to interactions between protein surfaces and co-solvents. The trend of escalation level was in corroboration with the study of Kim et al. (2009).
Firmness of the bars observed maximum at termination of storage (3.97 kg) in T4, but minimum value was found in T0 & T2 i.e. 3.30 & 3.31 kg at 7th day of storage. The results of the findings indicated that maximum level of firmness in T2 was might be due to storage time and conditions. But results of T4 and T3 regarding firmness at start of storage period were 3.88 and 3.67 kg which escalated to 3.97 and 3.83 kg at termination of storage period, correspondingly. The variation of results of our study with Kim et al. (2009) were might be due to storage period effect on bars. The escalation of firmness in protein bars were might be due to moisture migration between carbohydrates (i.e. sugars and starches) and the proteins (McMahon et al. 2009).
Similarly, highest toughness level was observed in T4 (3.97 kg) at end of storage period while lower level of toughness was found in T0 (3.31 kg) at initial day of storage. The obtained results revealed that maximum level of toughness in T2 was might be due to storage time and conditions. The inference also revealed that there was a gradual escalation in toughness among all treatments with the progression of storage period. Toughness level in T0 was 3.31 kg at 0 day of study which escalated to 3.51 and 3.6 kg at 21st & 28th storage day, correspondingly. This increase in toughness was might be due to textural changes in carbohydrates with the advancement in storage period.
Table 5. Effect of storage on Colour of Moringa Bars.
TreatmentDays
Colour0 7 14 21 28
T0 43.85 ± 0.24k 42.88 ± 0.11m 42.14 ± 0.15n 41.47 ± 0.13o 41.45 ± 0.13o L* Colour
T1 50.03 ± 0.14c 46.24 ± 0.13h 44.92 ± 0.14j 43.59 ± 0.16k 43.47 ± 0.15kl (lightness)
T2 50.85 ± 0.12b 48.42 ± 0.16d 46.70 ± 0.15fg 45.52 ± 0.17 45.47 ± 0.11i
T3 53.29 ± 0.14a 47.62 ± 0.13e 46.22 ± 0.13h 46.42 ± 0.13gh 43.13 ± 0.14Lm
T4 49.72 ± 0.13c 47.00 ± 0.15f 45.69 ± 0.15i 44.91 ± 0.15j 44.68 ± 0.18j
T0 9.41 ± 0.14c 9.92 ± 0.13c 10.57 ± 0.15b 11.47 ± 0.13a 11.57 ± 0.13a a* colour
T1 7.91 ± 0.12fg 8.59 ± 0.13de 9.79 ± 0.14c 10.67 ± 0.13b 10.74 ± 0.17b (red, green)
T2 7.39 ± 0.15hi 7.39 ± 0.14hi 7.69 ± 0.13fgh 8.55 ± 0.14de 8.65 ± 0.14de
T3 7.15 ± 0.0.47i 7.57 ± 0.14ghi 7.15 ± 0.14i 8.72 ± 0.14de 8.77 ± 0.14d
T4 7.21 ± 0.14hi 7.69 ± 0.13gh 8.21 ± 0.16ef 8.83 ± 0.15d 8.87 ± 0.14d
T0 13.63 ± 0.16n 15.13 ± 0.10l 15.72 ± 0.15jk 16.69 ± 0.11gh 16.82 ± 0.11g b* colour,
T1 14.45 ± 0.10m 15.50 ± 0.13kl 16.91 ± 0.13g 17.60 ± 0.13f 18.25 ± 0.13e yellow
T2 16.52 ± 0.11gh 17.73 ± 0.12f 18.78 ± 0.16cd 19.620 ± 0.14b 20.34 ± 0.16a
T3 16.31 ± 0.13hi 17.45 ± 0.10f 18.40 ± 0.13de 19.30 ± 0.12b 19.63 ± 0.12b
T4 15.96 ± 0.14ij 16.88 ± 0.14g 17.72 ± 0.15f 18.78 ± 0.15cd 18.83 ± 0.15c
T0; control T1; Bars with 10% flour T2; Bars with 5% protein Isolate T3; Bars with 10% protein isolate T4; sweet bars with 15% protein isolate.
Food Sci. Technol, Campinas, 41(3): 643-652, July-Sep 2021648 648/652
Physicochemical Analysis of Moringa Protein Fortified Food Bars
The mean Table 6 depicted the results of work of shear in kg/mm. It was obvious from the results that highest work of shear was seen in T4 (16.85kg/mm) on 28th storage day while minimum value was seen in T2 (16.70 kg/mm) during the whole study period. From the results it was revealed that minimum work of shear was in T2 was might be due to storage time and conditions. The obtained inferences also revealed that there was insignificant escalation in work of shear of bars in all variants. Work of shear in T0 was 16.74 kg/mm at the initiation of storage which had nonsignificant changes at 21st & 28th day of storage 16.75 and 16.75 kg/mm, correspondingly. Likewise, the work of shear in T1 and T2 was 16.80 and 16.70 kg/mm at initial day which remains constant till the end of storage period. Temperature and time had effect on the change in work of shear as reported by Banach et al. (2016) and Rawat & Darappa, (2015). The variation of result was might be due to effect of time and ingredients of bar on work of shear.
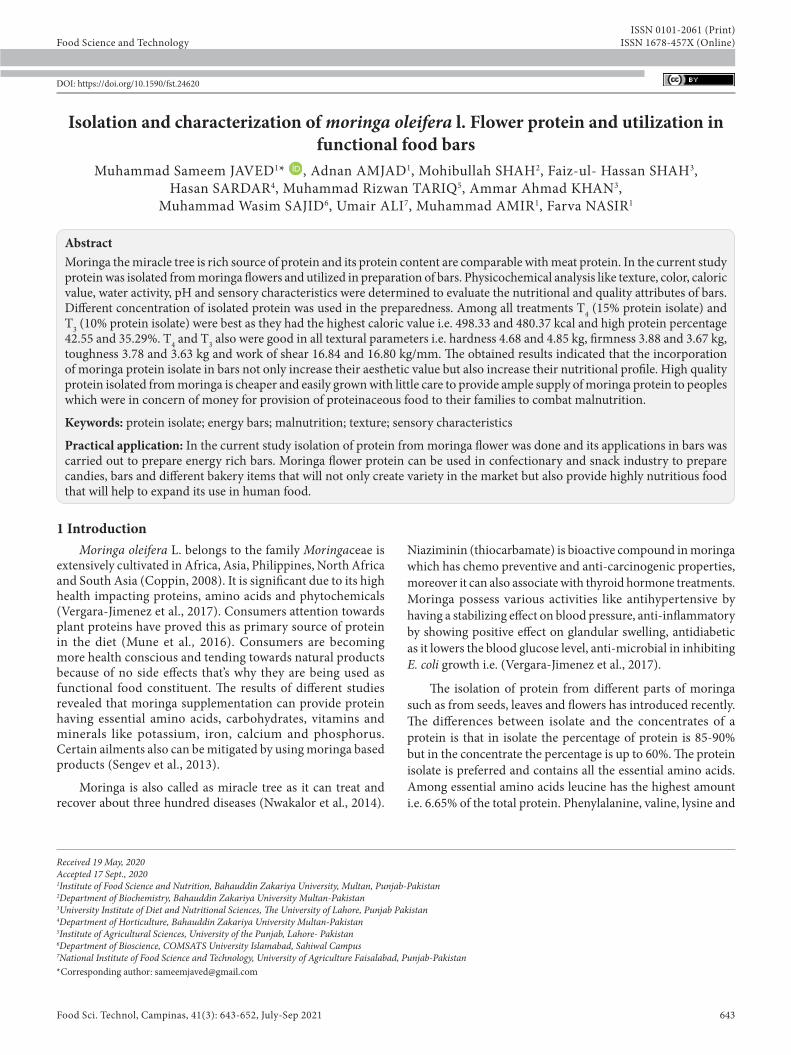
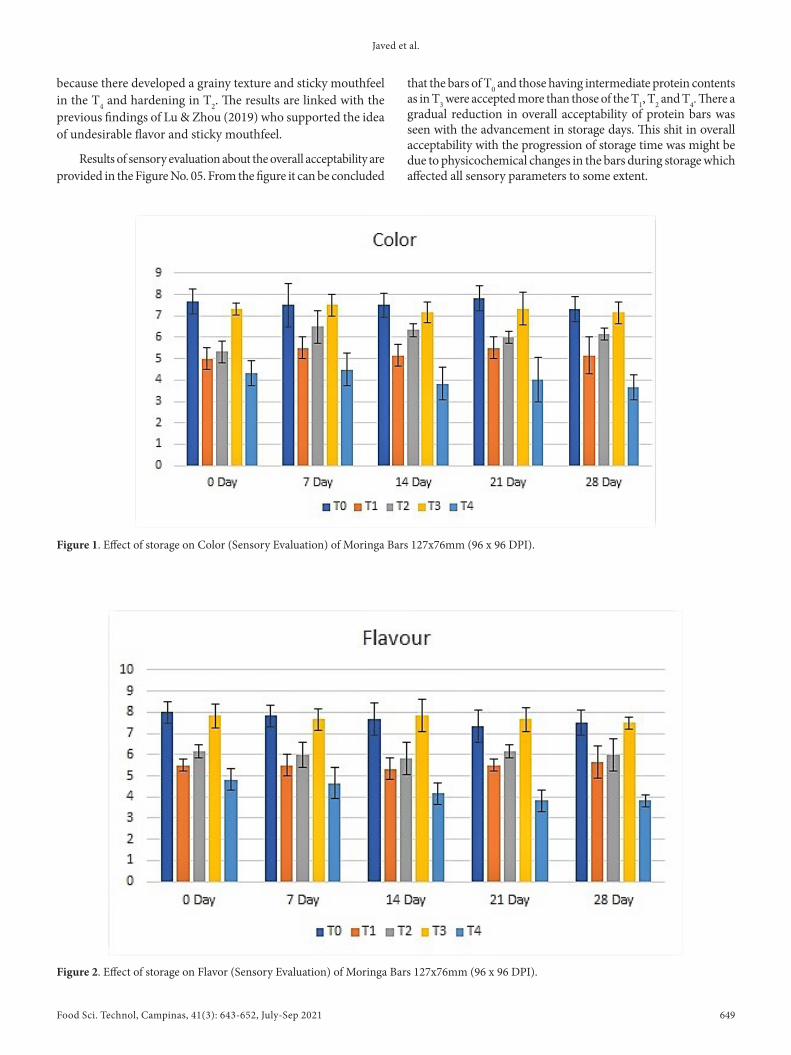
Results regarding sensory color are expressed in Figure No. 01. From the figure it can be concluded that maximum values for color were observed in T0 and T3 and lowest one was in T4. Slight decline was seen in the T0 and T3 color with the progression of storage may be due to lower storage temperature but the increase in T4 was might be due to more protein contents, these results are in corroboration with the previous findings of Banach et al. (2014) as they found color changes with the advancement in storage.
From the Figure No. 02. it can be concluded that the best flavor accepted by the panelist was of T0 and T3 at 0 day of storage which showed slight decline in flavor till 28th day of storage. The rejected flavor was of T1 and T4 which also declined till 28th day of storage. The difference in the results with the previous findings of Srebernich et al. (2016) was might be due to different treatments and preparatory conditions. These results were in corroboration with the previous findings of Banach et al. (2014) who supported the idea that flavor would be adversely affected by the physicochemical changes in the food matrix during storage.
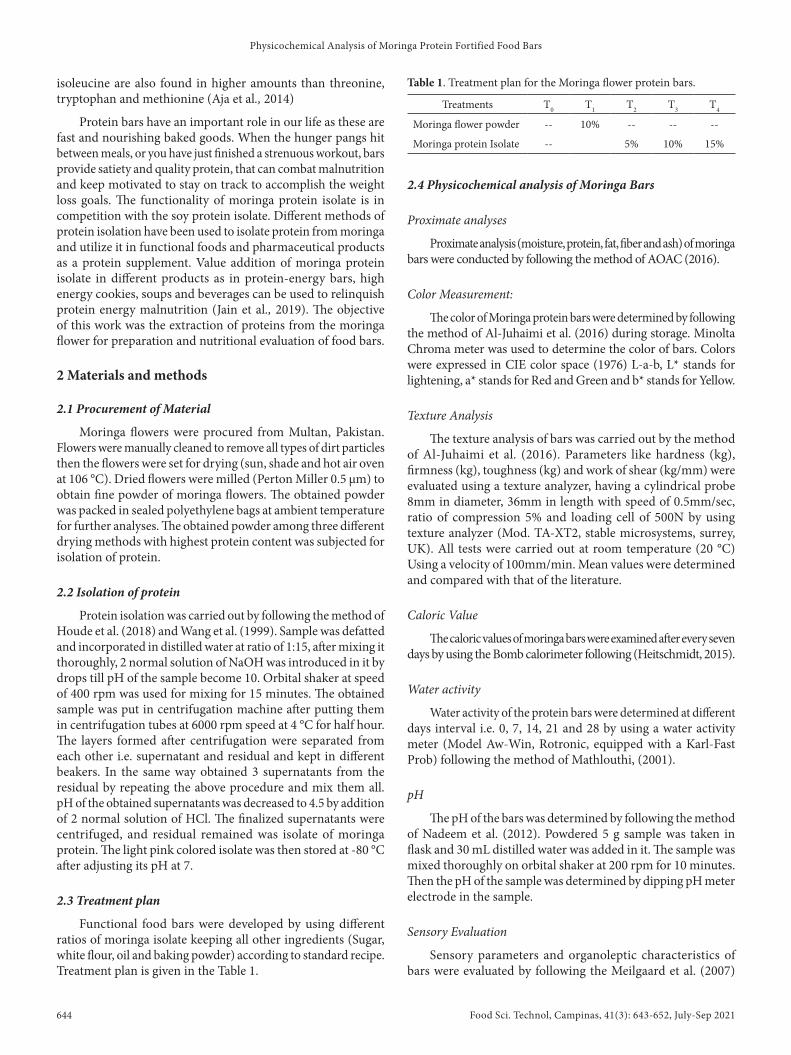
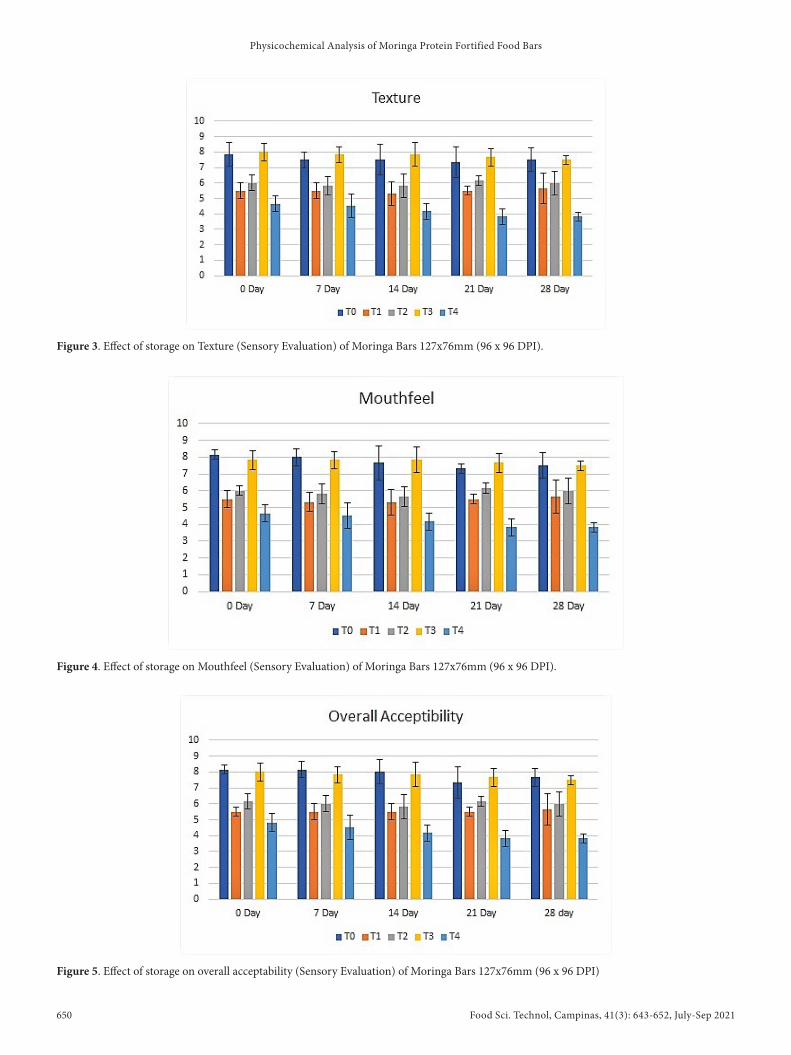
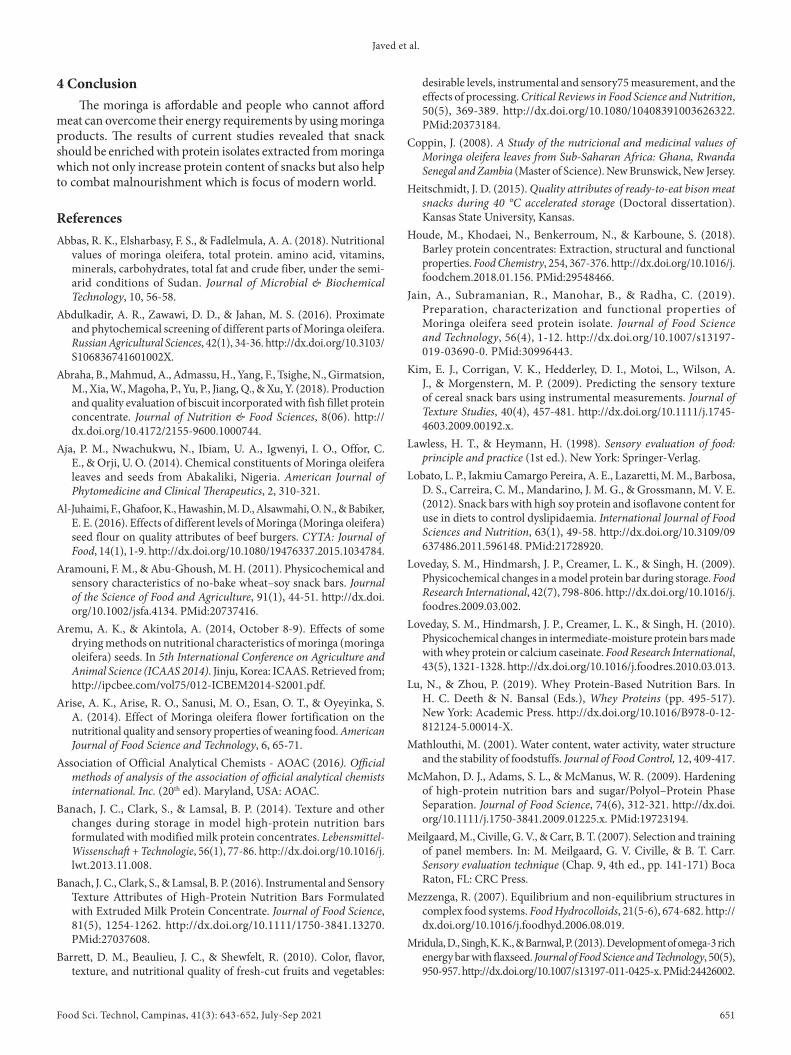
It can be seen in the Figure No. 03 that sensorial texture of high protein bars best accepted by sensory analysts was of T0 and T3 which was slightly affected with the progression of storage. The most rejected treatment by the panelist was T4 which showed that sugar to protein interaction at lower temperature would affect the texture and hardened the bars. The results are linked with the previous findings of Mezzenga (2007) who investigated that physical and chemical interaction among the ingredients in snack bars can occur over time and begin to affect the texture of product.
From the Figure No.04 it can be divulged that the sensory attribute of mouthfeel was best in T0 and T3 at 0 day of storage which reduced slightly till 28th day of storage and this pattern was also observed in rest of the treatments but the results of mouthfeel in T2 and T4 not acceptable by the sensory panelist
Table 6. Effect of storage on texture of Moringa Bars.
TreatmentDays
Texture0 7 14 21 28
T0 4.15 ± 0.15i 4.19 ± 0.12i 4.23 ± 0.13hi 4.28 ± 0.11hi 4.32 ± 0.10ghi Hardness
T1 4.39 ± 0.10f-i 4.45 ± 0.14e-i 4.47 ± 0.10d-i 4.52 ± 0.12c-i 4.59 ± 0.12b-h (Kg)
T2 4.97 ± 0.14ab 4.98 ± 0.15ab 5.01 ± 0.12a 5.01 ± 0.13a 5.06 ± 0.14a
T3 4.85 ± 0.13a-d 4.87 ± 0.11abc 4.88 ± 0.11abc 4.93 ± 0.16ab 4.96 ± 0.16ab
T4 4.68 ± 0.11a-g 4.68 ± 0.13a-g 4.72 ± 0.13a-f 4.76 ± 0.12a-f 4.82 ± 0.12a-e
T0 3.36 ± 0.09gh 3.30 ± 0.12h 3.43 ± 0.14e-h 3.51 ± 0.14c-h 3.63 ± 0.13a-h Firmness
T1 3.49 ± 0.10c-h 3.40 ± 0.12fgh 3.51 ± 0.12c-h 3.67 ± 0.10a-h 3.62 ± 0.12a-h (Kg)
T2 3.40 ± 0.11fgh 3.31 ± 0.13h 3.46 ± 0.15d-h 3.51 ± 0.11b-h 3.61 ± 0.10a-h
T3 3.67 ± 0.10a-h 3.60 ± 0.12a-h 3.71 ± 0.14a-g 3.76 ± 0.12a-f 3.83 ± 0.15a-d
T4 3.88 ± 0.13abc 3.80 ± 0.13a-e 3.90 ± 0.14ab 3.94 ± 0.16a 3.97 ± 0.16a
T0 3.31 ± 0.11f 3.32 ± 0.13f 3.43 ± 0.13def 3.52 ± 0.11b-f 3.60 ± 0.12a-f Toughness
T1 3.51 ± 0.12b-f 3.59 ± 0.14a-f 3.61 ± 0.10a-f 3.67 ± 0.13a-f 3.71 ± 0.11a-e (Kg)
T2 3.40 ± 0.13ef 3.43 ± 0.13def 3.48 ± 0.15c-f 3.50 ± 0.17c-f 3.61 ± 0.10a-f
T3 3.63 ± 0.14a-f 3.64 ± 0.16a-f 3.73 ± 0.12a-e 3.77 ± 0.12a-e 3.82 ± 0.13abc
T4 3.78 ± 0.12a-e 3.81 ± 0.11a-d 3.90 ± 0.10ab 3.94 ± 0.11a 3.97 ± 0.14a
T0 16.74 ± 0.13 16.74 ± 0.19 16.74 ± 0.14 16.75 ± 0.17 16.75 ± 0.13 Work of
T1 16.80 ± 0.17 16.80 ± 0.17 16.81 ± 0.13 16.81 ± 0.11 16.81 ± 0.12 shear
T2 16.70 ± 0.22 16.71 ± 0.12 16.71 ± 0.18 16.70 ± 0.16 16.70 ± 0.15 (Kg/mm)
T3 16.80 ± 0.17 16.81 ± 0.15 16.77 ± 0.13 16.76 ± 0.17 16.80 ± 0.17
T4 16.84 ± 0.17 16.85 ± 0.20 16.84 ± 0.14 16.84 ± 0.16 16.85 ± 0.14
T0; control T1; Bars with 10% flour T2; Bars with 5% protein Isolate T3; Bars with 10% protein isolate T4; sweet bars with 15% protein isolate.
Javed et al.
Food Sci. Technol, Campinas, 41(3): 643-652, July-Sep 2021 649/652 649
Figure 1. Effect of storage on Color (Sensory Evaluation) of Moringa Bars 127x76mm (96 x 96 DPI).
Figure 2. Effect of storage on Flavor (Sensory Evaluation) of Moringa Bars 127x76mm (96 x 96 DPI).
because there developed a grainy texture and sticky mouthfeel in the T4 and hardening in T2. The results are linked with the previous findings of Lu & Zhou (2019) who supported the idea of undesirable flavor and sticky mouthfeel.
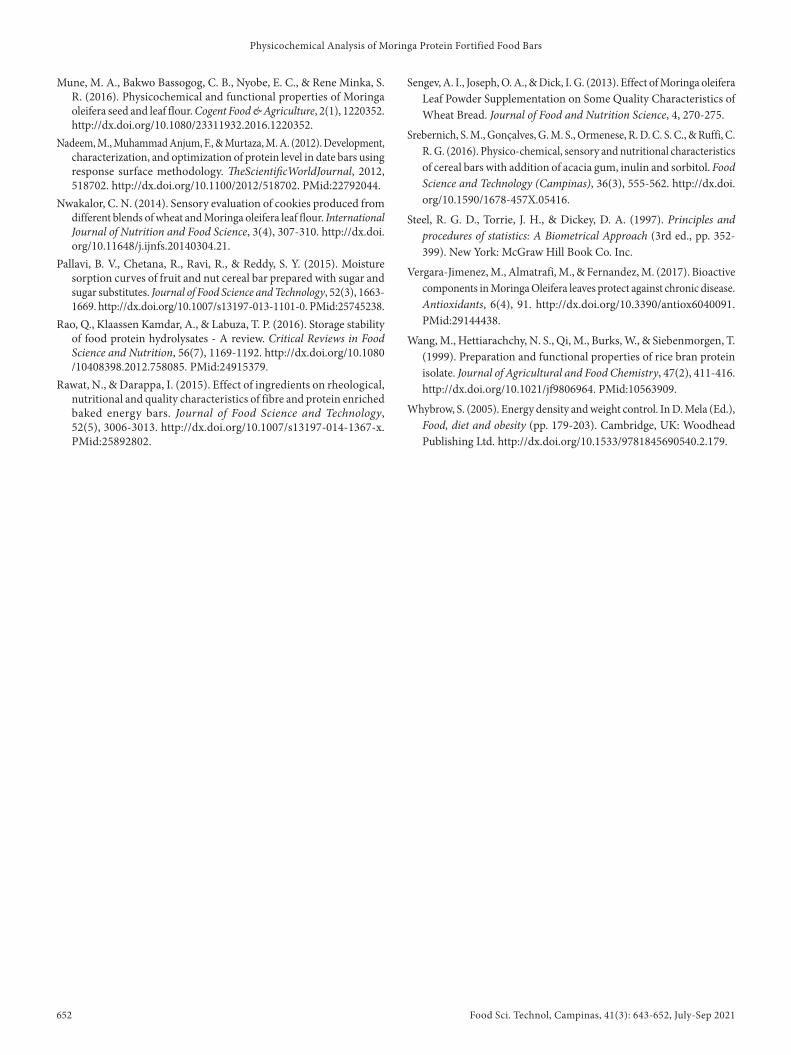
Results of sensory evaluation about the overall acceptability are provided in the Figure No. 05. From the figure it can be concluded
that the bars of T0 and those having intermediate protein contents as in T3 were accepted more than those of the T1, T2 and T4. There a gradual reduction in overall acceptability of protein bars was seen with the advancement in storage days. This shit in overall acceptability with the progression of storage time was might be due to physicochemical changes in the bars during storage which affected all sensory parameters to some extent.
Food Sci. Technol, Campinas, 41(3): 643-652, July-Sep 2021650 650/652
Physicochemical Analysis of Moringa Protein Fortified Food Bars
Figure 3. Effect of storage on Texture (Sensory Evaluation) of Moringa Bars 127x76mm (96 x 96 DPI).
Figure 4. Effect of storage on Mouthfeel (Sensory Evaluation) of Moringa Bars 127x76mm (96 x 96 DPI).
Figure 5. Effect of storage on overall acceptability (Sensory Evaluation) of Moringa Bars 127x76mm (96 x 96 DPI)
Javed et al.
Food Sci. Technol, Campinas, 41(3): 643-652, July-Sep 2021 651/652 651
4 ConclusionThe moringa is affordable and people who cannot afford
meat can overcome their energy requirements by using moringa products. The results of current studies revealed that snack should be enriched with protein isolates extracted from moringa which not only increase protein content of snacks but also help to combat malnourishment which is focus of modern world.
ReferencesAbbas, R. K., Elsharbasy, F. S., & Fadlelmula, A. A. (2018). Nutritional
values of moringa oleifera, total protein. amino acid, vitamins, minerals, carbohydrates, total fat and crude fiber, under the semi-arid conditions of Sudan. Journal of Microbial & Biochemical Technology, 10, 56-58.
Abdulkadir, A. R., Zawawi, D. D., & Jahan, M. S. (2016). Proximate and phytochemical screening of different parts of Moringa oleifera. Russian Agricultural Sciences, 42(1), 34-36. http://dx.doi.org/10.3103/S106836741601002X.
Abraha, B., Mahmud, A., Admassu, H., Yang, F., Tsighe, N., Girmatsion, M., Xia, W., Magoha, P., Yu, P., Jiang, Q., & Xu, Y. (2018). Production and quality evaluation of biscuit incorporated with fish fillet protein concentrate. Journal of Nutrition & Food Sciences, 8(06). http://dx.doi.org/10.4172/2155-9600.1000744.
Aja, P. M., Nwachukwu, N., Ibiam, U. A., Igwenyi, I. O., Offor, C. E., & Orji, U. O. (2014). Chemical constituents of Moringa oleifera leaves and seeds from Abakaliki, Nigeria. American Journal of Phytomedicine and Clinical Therapeutics, 2, 310-321.
Al-Juhaimi, F., Ghafoor, K., Hawashin, M. D., Alsawmahi, O. N., & Babiker, E. E. (2016). Effects of different levels of Moringa (Moringa oleifera) seed flour on quality attributes of beef burgers. CYTA: Journal of Food, 14(1), 1-9. http://dx.doi.org/10.1080/19476337.2015.1034784.
Aramouni, F. M., & Abu‐Ghoush, M. H. (2011). Physicochemical and sensory characteristics of no‐bake wheat–soy snack bars. Journal of the Science of Food and Agriculture, 91(1), 44-51. http://dx.doi.org/10.1002/jsfa.4134. PMid:20737416.
Aremu, A. K., & Akintola, A. (2014, October 8-9). Effects of some drying methods on nutritional characteristics of moringa (moringa oleifera) seeds. In 5th International Conference on Agriculture and Animal Science (ICAAS 2014). Jinju, Korea: ICAAS. Retrieved from; http://ipcbee.com/vol75/012-ICBEM2014-S2001.pdf.
Arise, A. K., Arise, R. O., Sanusi, M. O., Esan, O. T., & Oyeyinka, S. A. (2014). Effect of Moringa oleifera flower fortification on the nutritional quality and sensory properties of weaning food. American Journal of Food Science and Technology, 6, 65-71.
Association of Official Analytical Chemists - AOAC (2016). Official methods of analysis of the association of official analytical chemists international. Inc. (20th ed). Maryland, USA: AOAC.
Banach, J. C., Clark, S., & Lamsal, B. P. (2014). Texture and other changes during storage in model high-protein nutrition bars formulated with modified milk protein concentrates. Lebensmittel-Wissenschaft + Technologie, 56(1), 77-86. http://dx.doi.org/10.1016/j.lwt.2013.11.008.
Banach, J. C., Clark, S., & Lamsal, B. P. (2016). Instrumental and Sensory Texture Attributes of High‐Protein Nutrition Bars Formulated with Extruded Milk Protein Concentrate. Journal of Food Science, 81(5), 1254-1262. http://dx.doi.org/10.1111/1750-3841.13270. PMid:27037608.
Barrett, D. M., Beaulieu, J. C., & Shewfelt, R. (2010). Color, flavor, texture, and nutritional quality of fresh-cut fruits and vegetables:
desirable levels, instrumental and sensory75 measurement, and the effects of processing. Critical Reviews in Food Science and Nutrition, 50(5), 369-389. http://dx.doi.org/10.1080/10408391003626322. PMid:20373184.
Coppin, J. (2008). A Study of the nutricional and medicinal values of Moringa oleifera leaves from Sub-Saharan Africa: Ghana, Rwanda Senegal and Zambia (Master of Science). New Brunswick, New Jersey.
Heitschmidt, J. D. (2015). Quality attributes of ready-to-eat bison meat snacks during 40 °C accelerated storage (Doctoral dissertation). Kansas State University, Kansas.
Houde, M., Khodaei, N., Benkerroum, N., & Karboune, S. (2018). Barley protein concentrates: Extraction, structural and functional properties. Food Chemistry, 254, 367-376. http://dx.doi.org/10.1016/j.foodchem.2018.01.156. PMid:29548466.
Jain, A., Subramanian, R., Manohar, B., & Radha, C. (2019). Preparation, characterization and functional properties of Moringa oleifera seed protein isolate. Journal of Food Science and Technology, 56(4), 1-12. http://dx.doi.org/10.1007/s13197-019-03690-0. PMid:30996443.
Kim, E. J., Corrigan, V. K., Hedderley, D. I., Motoi, L., Wilson, A. J., & Morgenstern, M. P. (2009). Predicting the sensory texture of cereal snack bars using instrumental measurements. Journal of Texture Studies, 40(4), 457-481. http://dx.doi.org/10.1111/j.1745-4603.2009.00192.x.
Lawless, H. T., & Heymann, H. (1998). Sensory evaluation of food: principle and practice (1st ed.). New York: Springer-Verlag.
Lobato, L. P., Iakmiu Camargo Pereira, A. E., Lazaretti, M. M., Barbosa, D. S., Carreira, C. M., Mandarino, J. M. G., & Grossmann, M. V. E. (2012). Snack bars with high soy protein and isoflavone content for use in diets to control dyslipidaemia. International Journal of Food Sciences and Nutrition, 63(1), 49-58. http://dx.doi.org/10.3109/09637486.2011.596148. PMid:21728920.
Loveday, S. M., Hindmarsh, J. P., Creamer, L. K., & Singh, H. (2009). Physicochemical changes in a model protein bar during storage. Food Research International, 42(7), 798-806. http://dx.doi.org/10.1016/j.foodres.2009.03.002.
Loveday, S. M., Hindmarsh, J. P., Creamer, L. K., & Singh, H. (2010). Physicochemical changes in intermediate-moisture protein bars made with whey protein or calcium caseinate. Food Research International, 43(5), 1321-1328. http://dx.doi.org/10.1016/j.foodres.2010.03.013.
Lu, N., & Zhou, P. (2019). Whey Protein-Based Nutrition Bars. In H. C. Deeth & N. Bansal (Eds.), Whey Proteins (pp. 495-517). New York: Academic Press. http://dx.doi.org/10.1016/B978-0-12-812124-5.00014-X.
Mathlouthi, M. (2001). Water content, water activity, water structure and the stability of foodstuffs. Journal of Food Control, 12, 409-417.
McMahon, D. J., Adams, S. L., & McManus, W. R. (2009). Hardening of high‐protein nutrition bars and sugar/Polyol–Protein Phase Separation. Journal of Food Science, 74(6), 312-321. http://dx.doi.org/10.1111/j.1750-3841.2009.01225.x. PMid:19723194.
Meilgaard, M., Civille, G. V., & Carr, B. T. (2007). Selection and training of panel members. In: M. Meilgaard, G. V. Civille, & B. T. Carr. Sensory evaluation technique (Chap. 9, 4th ed., pp. 141-171) Boca Raton, FL: CRC Press.
Mezzenga, R. (2007). Equilibrium and non-equilibrium structures in complex food systems. Food Hydrocolloids, 21(5-6), 674-682. http://dx.doi.org/10.1016/j.foodhyd.2006.08.019.
Mridula, D., Singh, K. K., & Barnwal, P. (2013). Development of omega-3 rich energy bar with flaxseed. Journal of Food Science and Technology, 50(5), 950-957. http://dx.doi.org/10.1007/s13197-011-0425-x. PMid:24426002.
Food Sci. Technol, Campinas, 41(3): 643-652, July-Sep 2021652 652/652
Physicochemical Analysis of Moringa Protein Fortified Food Bars
Sengev, A. I., Joseph, O. A., & Dick, I. G. (2013). Effect of Moringa oleifera Leaf Powder Supplementation on Some Quality Characteristics of Wheat Bread. Journal of Food and Nutrition Science, 4, 270-275.
Srebernich, S. M., Gonçalves, G. M. S., Ormenese, R. D. C. S. C., & Ruffi, C. R. G. (2016). Physico-chemical, sensory and nutritional characteristics of cereal bars with addition of acacia gum, inulin and sorbitol. Food Science and Technology (Campinas), 36(3), 555-562. http://dx.doi.org/10.1590/1678-457X.05416.
Steel, R. G. D., Torrie, J. H., & Dickey, D. A. (1997). Principles and procedures of statistics: A Biometrical Approach (3rd ed., pp. 352-399). New York: McGraw Hill Book Co. Inc.
Vergara-Jimenez, M., Almatrafi, M., & Fernandez, M. (2017). Bioactive components in Moringa Oleifera leaves protect against chronic disease. Antioxidants, 6(4), 91. http://dx.doi.org/10.3390/antiox6040091. PMid:29144438.
Wang, M., Hettiarachchy, N. S., Qi, M., Burks, W., & Siebenmorgen, T. (1999). Preparation and functional properties of rice bran protein isolate. Journal of Agricultural and Food Chemistry, 47(2), 411-416. http://dx.doi.org/10.1021/jf9806964. PMid:10563909.
Whybrow, S. (2005). Energy density and weight control. In D. Mela (Ed.), Food, diet and obesity (pp. 179-203). Cambridge, UK: Woodhead Publishing Ltd. http://dx.doi.org/10.1533/9781845690540.2.179.
Mune, M. A., Bakwo Bassogog, C. B., Nyobe, E. C., & Rene Minka, S. R. (2016). Physicochemical and functional properties of Moringa oleifera seed and leaf flour. Cogent Food & Agriculture, 2(1), 1220352. http://dx.doi.org/10.1080/23311932.2016.1220352.
Nadeem, M., Muhammad Anjum, F., & Murtaza, M. A. (2012). Development, characterization, and optimization of protein level in date bars using response surface methodology. TheScientificWorldJournal, 2012, 518702. http://dx.doi.org/10.1100/2012/518702. PMid:22792044.
Nwakalor, C. N. (2014). Sensory evaluation of cookies produced from different blends of wheat and Moringa oleifera leaf flour. International Journal of Nutrition and Food Science, 3(4), 307-310. http://dx.doi.org/10.11648/j.ijnfs.20140304.21.
Pallavi, B. V., Chetana, R., Ravi, R., & Reddy, S. Y. (2015). Moisture sorption curves of fruit and nut cereal bar prepared with sugar and sugar substitutes. Journal of Food Science and Technology, 52(3), 1663-1669. http://dx.doi.org/10.1007/s13197-013-1101-0. PMid:25745238.
Rao, Q., Klaassen Kamdar, A., & Labuza, T. P. (2016). Storage stability of food protein hydrolysates - A review. Critical Reviews in Food Science and Nutrition, 56(7), 1169-1192. http://dx.doi.org/10.1080/10408398.2012.758085. PMid:24915379.
Rawat, N., & Darappa, I. (2015). Effect of ingredients on rheological, nutritional and quality characteristics of fibre and protein enriched baked energy bars. Journal of Food Science and Technology, 52(5), 3006-3013. http://dx.doi.org/10.1007/s13197-014-1367-x. PMid:25892802.