Embed Size (px)
Citation preview

Circ Jdoi: 10.1253/circj.CJ-17-0023
with a bundle branch block ECG pattern (QRS duration ≥110 ms).4 Moreover, LPs are strongly affected by atrial arrhythmias, which constitutes approximately 20% of all ARVC patients.5,6 Therefore, the currently available non-invasive predictors of arrhythmic events have some limita-tions.
Recently, the use of invasive electroanatomic mapping during sinus rhythm has allowed delineation of the patho-logical substrate for lethal arrhythmias and localization of the VT ablation target site in patients with ARVC, without actually inducing VT. Santangeli et al demonstrated that the presence of fragmented electrograms in isolated areas within scars predicts arrhythmic events in ARVC patients.7
A rrhythmogenic right ventricular cardiomyopathy (ARVC) is a progressive, often inherited myocar-dial disease characterized by fibrofatty replacement
of myocytes and clinical presentation of lethal arrhyth-mias.1,2 Delayed activation within the abnormal myocar-dium as a substrate of ventricular tachycardia (VT) in ARVC could clinically manifest as epsilon waves on ECG or late potential (LP) depicted on signal-averaged ECG (SAECG). Protonotarios et al established the association of epsilon waves with VT.3 However, the sensitivity of epsilon waves is low, because it may be masked within the prolonged S-wave or complete right bundle branch block (CRBBB). Similarly, SAECG cannot be used in patients
Received January 16, 2017; revised manuscript received May 16, 2017; accepted July 20, 2017; released online August 30, 2017 Time for primary review: 32 days
Department of Cardiovascular Medicine (Y.K., Y.Y.I., Y.O., T. Nagayama, T. Nakashima, S. Kawakami, S.N., T. Noda, T.A., W.S., S. Kamakura, S.Y., K.K.), Department of Cardiovascular Dynamics (H.T., M.S.), National Cerebral and Cardiovascular Center, Suita; Department of Cardiovascular Medicine, Tohoku University Graduate School of Medicine, Sendai (Y.K., H.S.); and Department of Cardiovascular Medicine, Nippon Medical School, Tokyo (W.S.), Japan
Mailing address: Kengo Kusano, MD, PhD, Department of Cardiovascular Medicine, National Cerebral and Cardiovascular Center, 5-7-1 Fujishiro-dai, Suita 565-8565, Japan. E-mail: [email protected]
ISSN-1346-9843 All rights are reserved to the Japanese Circulation Society. For permissions, please e-mail: [email protected]
Isolated Late Activation Detected by Magnetocardiography Predicts Future Lethal Ventricular Arrhythmic Events in
Patients With Arrhythmogenic Right Ventricular Cardiomyopathy
Yoshitaka Kimura, MD; Hiroshi Takaki, MD, PhD; Yuko Y. Inoue, MD, PhD; Yasutaka Oguchi, MD; Tomomi Nagayama, MD, PhD; Takahiro Nakashima, MD; Shoji Kawakami, MD;
Satoshi Nagase, MD, PhD; Takashi Noda, MD, PhD; Takeshi Aiba, MD, PhD; Wataru Shimizu, MD, PhD; Shiro Kamakura, MD, PhD; Masaru Sugimachi, MD, PhD; Satoshi Yasuda, MD, PhD; Hiroaki Shimokawa, MD, PhD; Kengo Kusano, MD, PhD
Background: Risk stratification of ventricular arrhythmias is vital to the optimal management in patients with arrhythmogenic right ventricular cardiomyopathy (ARVC). We hypothesized that 64-channel magnetocardiography (MCG) would be useful to detect iso-lated late activation (ILA) by overcoming the limitations of conventional noninvasive predictors of ventricular tachyarrhythmias, including epsilon waves, late potential (LP), and right ventricular ejection fraction (RVEF), in ARVC patients.
Methods and Results: We evaluated ILA on MCG, defined as discrete activations re-emerging after the decay of main RV activa-tion (%magnitude >5%), and conventional noninvasive predictors of ventricular tachyarrhythmias (epsilon waves, LP, and RVEF) in 40 patients with ARVC. ILA was noted in 24 (60%) patients. Most ILAs were found in RV lateral or inferior areas (17/24, 71%). We defined “delayed ILA” as ILA in which the conduction delay exceeded its median (50 ms). During a median follow-up of 42.5 months, major arrhythmic events (MAEs: 1 sudden cardiac death, 3 sustained ventricular tachycardias, and 4 appropriate implantable car-dioverter defibrillator discharges) occurred more frequently in patients with delayed ILA (6/12) than in those without (2/28; log-rank: P=0.004). Cox regression analysis identified delayed ILA as the only independent predictor of MAEs (hazard ratio 7.63, 95% confi-dence interval 1.72–52.6, P=0.007), and other noninvasive parameters were not significant predictors.
Conclusions: MCG is useful to identify ARVC patients at high risk of future lethal ventricular arrhythmias.
Key Words: Epsilon waves; Late potential; Risk stratification; Sudden cardiac death; Ventricular tachycardia
ORIGINAL ARTICLEArrhythmia/Electrophysiology
Advance Publication by-J-STAGE

KIMURA Y et al.
MethodsStudy PopulationThe study population consisted of 60 patients with ARVC since 2007 when we started MCG recording; 20 patients who had already underwent pacemaker or implantable cardioverter defibrillator (ICD) implantation before MCG recording were excluded. The remaining 40 consecutive patients with ARVC (28 had already been diagnosed with ARVC before enrollment and 12 were newly diagnosed and enrolled in or after 2007) who underwent MCG record-ing between 2007 and 2013 were enrolled in the study. All patients were probands and met the 2010 revised task force criteria for diagnosis of ARVC:4 32 (80%) were classified as “definite” and 8 patients (20%) as “borderline.” The study
Furthermore, Nogami et al found that elimination of these isolated delayed electrograms by catheter ablation pre-vented VT recurrence in ARVC patients.8 Thus, detailed substrate mapping, by either invasive or noninvasive meth-ods, may allow accurate prediction of lethal arrhythmias.
Magnetocardiography (MCG) is a unique noninvasive electromagnetic mapping technique with high spatial reso-lution.9–11 We recently demonstrated that MCG detects left intraventricular disorganized conduction in patients with nonischemic dilated cardiomyopathy and a narrow QRS, which predicted major adverse cardiac events.12 In this study, we hypothesized that MCG mapping could nonin-vasively visualize a scar-related isolated late activated potential (ILA), and that the presence of ILA could strat-ify the risk of future arrhythmic events in ARVC patients.
Figure 1. Magnetocardiographic (MCG) study. (A) Predefined anterior and inferior thoracic areas covered by 64 SQUID sensors for MCG recording. Reproducible spatial alignment is achieved by setting a specified sensor on the xiphisternum (red circle). (B) Normal component of the magnetic flux vector is sampled at 1 kHz for ≥30 s at each of the 64 sensors. (C) MCG signals are signal-averaged using simultaneously recorded ECG R-waves as a trigger. The 64 one-cardiac-cycle waveforms are superimposed. A 2D current arrow map, approximating the in-plane current amplitude and direction at each sensor, is constructed at an arbitrary time point. (D) Current arrow maps show initial right downward currents reflecting septal excitation (QRS +17 ms), left downward main currents reflecting left ventricular excitation (+30–40 ms), and finally right upward currents in the right ventricular outflow area (+50–70 ms). SQUID, superconducting quantum interference device.
Advance Publication by-J-STAGE

MCG Analysis in ARVC
and V2 or beyond in the absence of CRBBB, and TWI in leads V1–4 in the presence of CRBBB were considered abnormal. SAECG (Spiderview, Ela Medical Inc., Arvada, CO, USA) was evaluated in all patients. LPs were defined as SAECG findings that fulfilled 1 of the following 3 criteria: total filtered QRS duration (TQRSD) ≥114 ms, duration of terminal low amplitude <40 μV QRS (LAS40); ≥38 ms, root-mean-square voltage of terminal 40 ms QRS (RMS40); ≤20 μV in patients showing narrow QRS complex (<110 ms) on a standard ECG.4 Left ventricular (LV) function was assessed by transthoracic echocardiography (TTE) in all patients. Right ventricular ejection fraction (RVEF) was determined by contrast-enhanced cardiac magnetic reso-nance in 26 patients and by radionuclide scanning in the remaining 14 patients.
was approved by the Institutional Review Board of the National Cerebral and Cardiovascular Center, with waiv-ers of individual consent (M23-050, M24-050-2).
ECG, SAECG, and EchocardiographyECG was recorded at rest (sensitivity 10 mm/mV, paper speed 25 mm/s, filter setting 0.15–40 Hz) with standard lead placement. ECG was enlarged twice and digital calipers were used for all measurements (Adobe Photoshop CS4). Epsilon waves were defined as reproducible low-amplitude signals after the end of the QRS complex up to the onset of the T-wave. The phenomenon of QRS fragmentation was defined as deflections at the beginning of the QRS com-plex, on top of the R-wave, or in the nadir of the S-wave, similar to the definition in coronary artery disease, in either 1 right precordial lead or in more than 1 lead including all standard ECG leads.13 T-wave inversion (TWI) in leads V1
Figure 2. Algorithm for detecting isolated late activation (ILA) and current arrow maps in patients with/without ILA. (A) Algorithm for detecting ILA. Maximum RV current was detected at time ‘a’ with an amplitude of X. If current reappeared after it decreased to nadir (time ‘b’), increment of current at time ‘c’ (peak of reappearance) with respect to time ‘b’ (nadir) was calculated. When this increment was >5% of X, then time ‘c’ is defined as an ILA (ILA1). This procedure was repeated (ILA2 at time of peak ‘e’ after time of nadir ‘d’) until all possible instances of ILA were detected. (B) Current arrow maps. Current arrow maps of case 1 show right downward currents reflecting the main RV activation (QRS onset +100 ms). After the decay of the main RV current, the re-emer-gence of new, transiently increased currents (145 ms) is observed (i.e., ILA). Thereafter, leftward repolarization currents appear in a different region (200 ms). Current arrow maps of case 2 show right upward currents reflecting the main RV activation (QRS onset +100 ms). After the decay of the RV depolarization currents, leftward repolarization currents appear in a different region (200 ms). There were no re-emergent currents between the main RV depolarization and repolarization. (C) Standard 12-lead ECG recordings of leads V1, V2, and V3. Both case 1 and case 2 show depolarization potentials as visible notches (black arrows) within and after the QRS complex. In case 1, sustained VT occurred 16 months later. EF, ejection fraction; RV, right ventricular; VT, ventricular tachycardia.
Advance Publication by-J-STAGE

KIMURA Y et al.
Invasive Electrophysiological Study (EPS)An invasive EPS using 3D electroanatomic catheter map-ping of the RV was performed in 33 of the 40 (83%) patients. The sites demonstrating the most prominent scar-related electrograms (delayed potentials and fractionated elec-trograms) were grouped into 4 regions: RV outflow tract (RVOT), lateral wall, inferior wall, and septal wall. Of these 33 patients, endocardial catheter ablation was per-formed in 23 (16 before, 2 before and after, and 5 after MCG recording) who did not respond to ≥1 antiarrhyth-mic drugs. The procedure was terminated when no mono-morphic VT was inducible, when only hemodynamically tolerable VT remained inducible, or when only VT hemo-dynamically intolerable but faster than any spontaneous VTs remained inducible.
MCG Recording and AnalysisMCG measurement and analysis has been reported in pre-vious studies.12,14 Briefly, MCG study was performed using a 64-channel MCG (MC-6400; Hitachi High-Technologies Corp., Tokyo, Japan) installed in a magnetically shielded room. MCG was recorded from the anterior chest wall with the subject supine and from the posterior chest wall with the subject prone. With the patient supine, a laser marker was positioned at the xiphoid process to reproduc-ibly match the position of the patient’s heart with that of the sensor (Figure 1A–C). A Dewar housing enclosing super-conducting quantum interference device (SQUID) sensors was placed near the body surface for magnetic field regis-tration.
With sensors aligned in an 8×8 matrix with 25 mm spac-ing, the normal components of the magnetic flux vector were measured. A total of 64 MCG and 3 ECG signals
Table 1. Baseline Clinical Characteristics of Patients With Arrhythmogenic Right Ventricular Cardiomyopathy
n 40
Age at enrollment (years) 52±15
Sex (male) 31 (78)
Prior sVT 32 (80)
ECG
AF 6 (15)
QRS duration (ms) 106±22 CRBBB 9 (23)
Epsilon waves 8 (20)
Fragmented QRS 15 (38)
Negative T-wave in precordial leads 26 (65)
SAECG (n=25)†
Late potential positive 23 (92)
TQRSD (ms) 141±44 LAS40 (ms) 71±39
RMS40 (μV) 12±17
TTE
LVEF (%) 48±14
MRI/radionuclide scanning
RVEF (%) 28±9 History of catheter ablation 18 (45)
Data are mean ± standard deviation (SD) or number of patients (%). †Cases of QRS duration ≥110 ms were excluded. AF, atrial fibrilla-tion; CRBBB, complete right bundle branch block; ECG, electrocar-diogram; EF, ejection fraction; LAS40, duration of the terminal low (<40 μV) amplitude signals; LV, left ventricle; MRI, magnetic reso-nance imaging; RMS40, root-mean-square voltage of the last 40 ms; RV, right ventricle; SAECG, signal-averaged electrocardio-gram; sVT, sustained ventricular tachycardia; TQRSD, total filtered QRS duration; TTE, transthoracic echocardiography.
Figure 3. Representative case of isolated late activation on MCG current arrow maps in the terminal phase of the QRS complex. (A) Standard 12-lead ECG shows prolonged terminal activation delay in the precordial leads. (B) Corresponding isolated delayed potentials (QRS +160 ms) are identified in the basal inferolateral region of the RV using a 3D electroanatomical mapping system (CARTO). (C) On the MCG current arrow maps, after the main RV depolarization (110 ms), there is re-emergence of new, transiently increased currents (160 ms) at just the same time as an isolated delayed potential (B) in the RV area is clearly observed. Thereafter, repolarization currents appear at 200 ms after the QRS onset. MCG, magnetocardiography; RV, right ventricle.
Advance Publication by-J-STAGE
MCG Analysis in ARVC
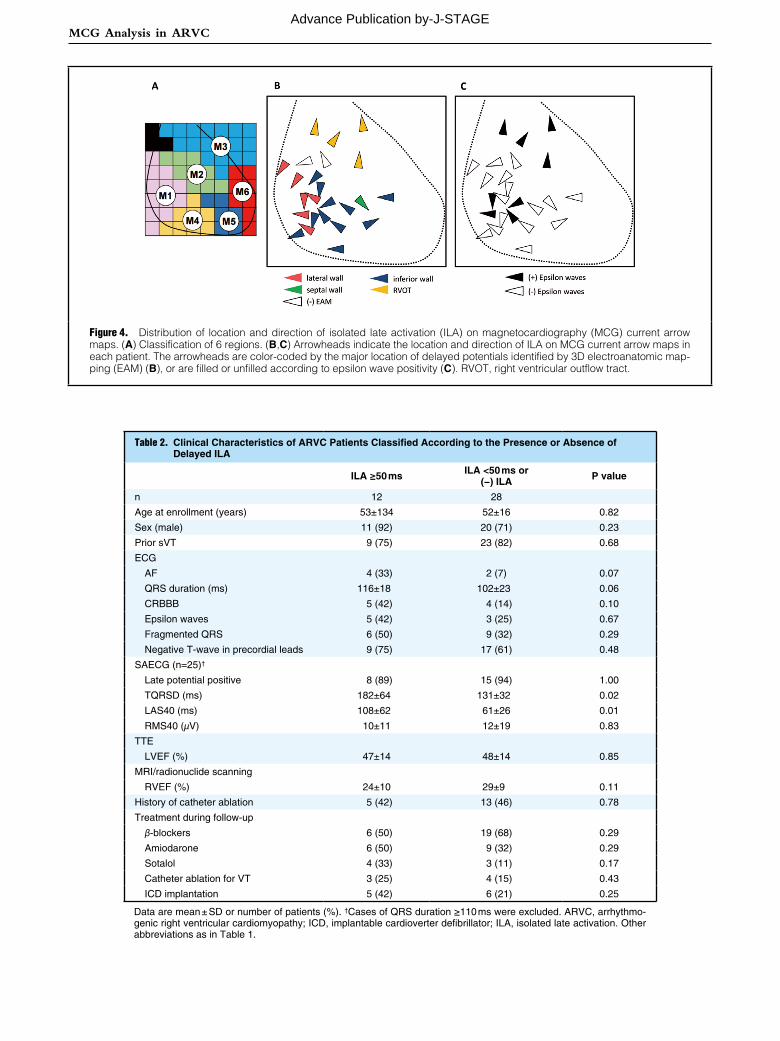
Figure 4. Distribution of location and direction of isolated late activation (ILA) on magnetocardiography (MCG) current arrow maps. (A) Classification of 6 regions. (B,C) Arrowheads indicate the location and direction of ILA on MCG current arrow maps in each patient. The arrowheads are color-coded by the major location of delayed potentials identified by 3D electroanatomic map-ping (EAM) (B), or are filled or unfilled according to epsilon wave positivity (C). RVOT, right ventricular outflow tract.
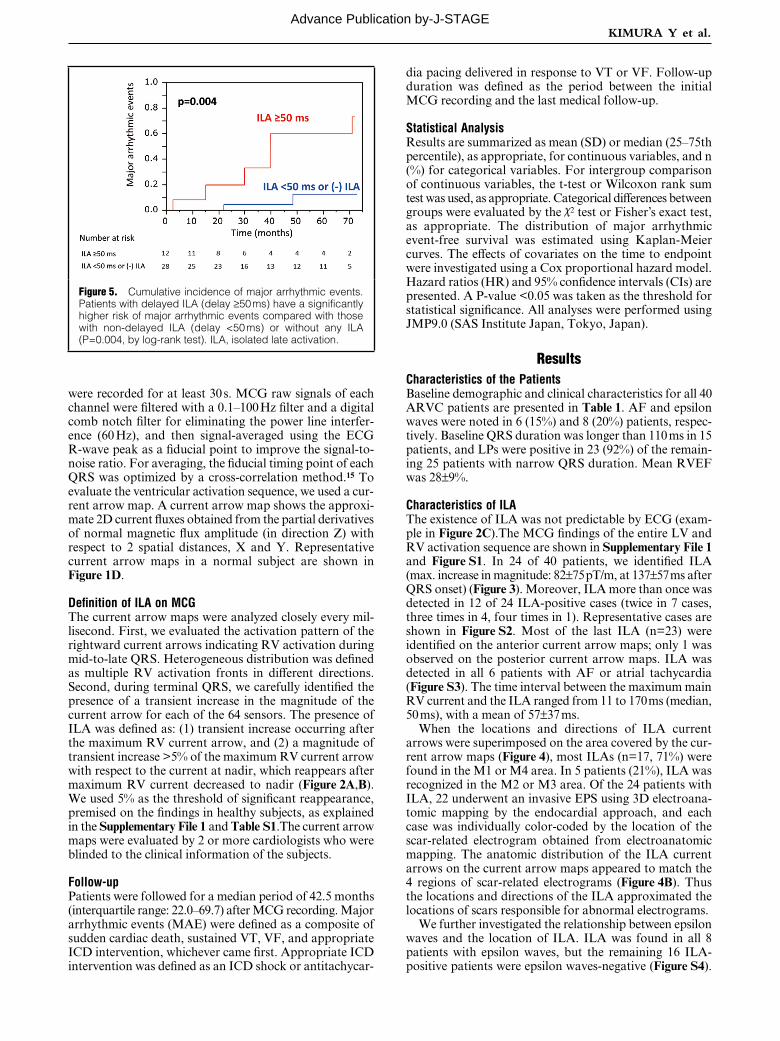
Table 2. Clinical Characteristics of ARVC Patients Classified According to the Presence or Absence of Delayed ILA
ILA ≥50 ms ILA <50 ms or (−) ILA P value
n 12 28
Age at enrollment (years) 53±134 52±16 0.82
Sex (male) 11 (92) 20 (71) 0.23
Prior sVT 9 (75) 23 (82) 0.68
ECG
AF 4 (33) 2 (7) 0.07
QRS duration (ms) 116±18 102±23 0.06
CRBBB 5 (42) 4 (14) 0.10
Epsilon waves 5 (42) 3 (25) 0.67
Fragmented QRS 6 (50) 9 (32) 0.29
Negative T-wave in precordial leads 9 (75) 17 (61) 0.48
SAECG (n=25)†
Late potential positive 8 (89) 15 (94) 1.00
TQRSD (ms) 182±64 131±32 0.02
LAS40 (ms) 108±62 61±26 0.01
RMS40 (μV) 10±11 12±19 0.83
TTE
LVEF (%) 47±14 48±14 0.85
MRI/radionuclide scanning
RVEF (%) 24±10 29±9 0.11
History of catheter ablation 5 (42) 13 (46) 0.78
Treatment during follow-up
β-blockers 6 (50) 19 (68) 0.29
Amiodarone 6 (50) 9 (32) 0.29
Sotalol 4 (33) 3 (11) 0.17
Catheter ablation for VT 3 (25) 4 (15) 0.43
ICD implantation 5 (42) 6 (21) 0.25
Data are mean ± SD or number of patients (%). †Cases of QRS duration ≥110 ms were excluded. ARVC, arrhythmo-genic right ventricular cardiomyopathy; ICD, implantable cardioverter defibrillator; ILA, isolated late activation. Other abbreviations as in Table 1.
Advance Publication by-J-STAGE
KIMURA Y et al.
dia pacing delivered in response to VT or VF. Follow-up duration was defined as the period between the initial MCG recording and the last medical follow-up.
Statistical AnalysisResults are summarized as mean (SD) or median (25–75th percentile), as appropriate, for continuous variables, and n (%) for categorical variables. For intergroup comparison of continuous variables, the t-test or Wilcoxon rank sum test was used, as appropriate. Categorical differences between groups were evaluated by the χ2 test or Fisher’s exact test, as appropriate. The distribution of major arrhythmic event-free survival was estimated using Kaplan-Meier curves. The effects of covariates on the time to endpoint were investigated using a Cox proportional hazard model. Hazard ratios (HR) and 95% confidence intervals (CIs) are presented. A P-value <0.05 was taken as the threshold for statistical significance. All analyses were performed using JMP9.0 (SAS Institute Japan, Tokyo, Japan).
ResultsCharacteristics of the PatientsBaseline demographic and clinical characteristics for all 40 ARVC patients are presented in Table 1. AF and epsilon waves were noted in 6 (15%) and 8 (20%) patients, respec-tively. Baseline QRS duration was longer than 110 ms in 15 patients, and LPs were positive in 23 (92%) of the remain-ing 25 patients with narrow QRS duration. Mean RVEF was 28±9%.
Characteristics of ILAThe existence of ILA was not predictable by ECG (exam-ple in Figure 2C).The MCG findings of the entire LV and RV activation sequence are shown in Supplementary File 1 and Figure S1. In 24 of 40 patients, we identified ILA (max. increase in magnitude: 82±75 pT/m, at 137±57 ms after QRS onset) (Figure 3). Moreover, ILA more than once was detected in 12 of 24 ILA-positive cases (twice in 7 cases, three times in 4, four times in 1). Representative cases are shown in Figure S2. Most of the last ILA (n=23) were identified on the anterior current arrow maps; only 1 was observed on the posterior current arrow maps. ILA was detected in all 6 patients with AF or atrial tachycardia (Figure S3). The time interval between the maximum main RV current and the ILA ranged from 11 to 170 ms (median, 50 ms), with a mean of 57±37 ms.
When the locations and directions of ILA current arrows were superimposed on the area covered by the cur-rent arrow maps (Figure 4), most ILAs (n=17, 71%) were found in the M1 or M4 area. In 5 patients (21%), ILA was recognized in the M2 or M3 area. Of the 24 patients with ILA, 22 underwent an invasive EPS using 3D electroana-tomic mapping by the endocardial approach, and each case was individually color-coded by the location of the scar-related electrogram obtained from electroanatomic mapping. The anatomic distribution of the ILA current arrows on the current arrow maps appeared to match the 4 regions of scar-related electrograms (Figure 4B). Thus the locations and directions of the ILA approximated the locations of scars responsible for abnormal electrograms.
We further investigated the relationship between epsilon waves and the location of ILA. ILA was found in all 8 patients with epsilon waves, but the remaining 16 ILA-positive patients were epsilon waves-negative (Figure S4).
were recorded for at least 30 s. MCG raw signals of each channel were filtered with a 0.1–100 Hz filter and a digital comb notch filter for eliminating the power line interfer-ence (60 Hz), and then signal-averaged using the ECG R-wave peak as a fiducial point to improve the signal-to-noise ratio. For averaging, the fiducial timing point of each QRS was optimized by a cross-correlation method.15 To evaluate the ventricular activation sequence, we used a cur-rent arrow map. A current arrow map shows the approxi-mate 2D current fluxes obtained from the partial derivatives of normal magnetic flux amplitude (in direction Z) with respect to 2 spatial distances, X and Y. Representative current arrow maps in a normal subject are shown in Figure 1D.
Definition of ILA on MCGThe current arrow maps were analyzed closely every mil-lisecond. First, we evaluated the activation pattern of the rightward current arrows indicating RV activation during mid-to-late QRS. Heterogeneous distribution was defined as multiple RV activation fronts in different directions. Second, during terminal QRS, we carefully identified the presence of a transient increase in the magnitude of the current arrow for each of the 64 sensors. The presence of ILA was defined as: (1) transient increase occurring after the maximum RV current arrow, and (2) a magnitude of transient increase >5% of the maximum RV current arrow with respect to the current at nadir, which reappears after maximum RV current decreased to nadir (Figure 2A,B). We used 5% as the threshold of significant reappearance, premised on the findings in healthy subjects, as explained in the Supplementary File 1 and Table S1.The current arrow maps were evaluated by 2 or more cardiologists who were blinded to the clinical information of the subjects.
Follow-upPatients were followed for a median period of 42.5 months (interquartile range: 22.0–69.7) after MCG recording. Major arrhythmic events (MAE) were defined as a composite of sudden cardiac death, sustained VT, VF, and appropriate ICD intervention, whichever came first. Appropriate ICD intervention was defined as an ICD shock or antitachycar-
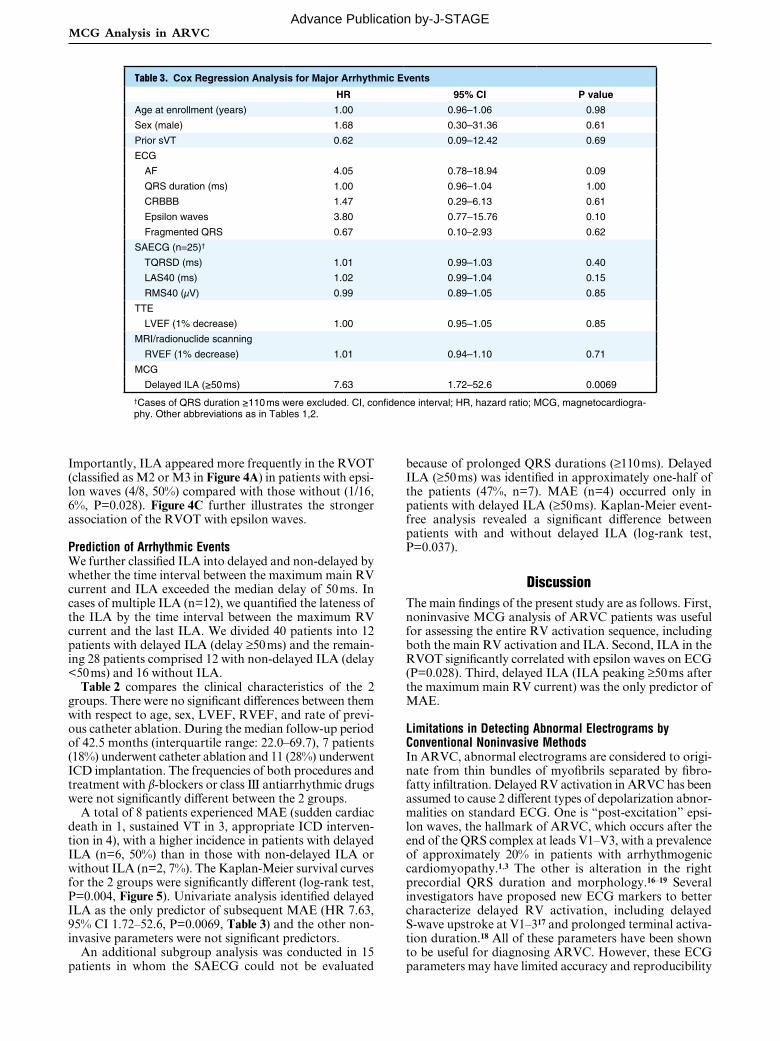
Figure 5. Cumulative incidence of major arrhythmic events. Patients with delayed ILA (delay ≥50 ms) have a significantly higher risk of major arrhythmic events compared with those with non-delayed ILA (delay <50 ms) or without any ILA (P=0.004, by log-rank test). ILA, isolated late activation.
Advance Publication by-J-STAGE
MCG Analysis in ARVC
because of prolonged QRS durations (≥110 ms). Delayed ILA (≥50 ms) was identified in approximately one-half of the patients (47%, n=7). MAE (n=4) occurred only in patients with delayed ILA (≥50 ms). Kaplan-Meier event-free analysis revealed a significant difference between patients with and without delayed ILA (log-rank test, P=0.037).
DiscussionThe main findings of the present study are as follows. First, noninvasive MCG analysis of ARVC patients was useful for assessing the entire RV activation sequence, including both the main RV activation and ILA. Second, ILA in the RVOT significantly correlated with epsilon waves on ECG (P=0.028). Third, delayed ILA (ILA peaking ≥50 ms after the maximum main RV current) was the only predictor of MAE.
Limitations in Detecting Abnormal Electrograms by Conventional Noninvasive MethodsIn ARVC, abnormal electrograms are considered to origi-nate from thin bundles of myofibrils separated by fibro-fatty infiltration. Delayed RV activation in ARVC has been assumed to cause 2 different types of depolarization abnor-malities on standard ECG. One is “post-excitation” epsi-lon waves, the hallmark of ARVC, which occurs after the end of the QRS complex at leads V1–V3, with a prevalence of approximately 20% in patients with arrhythmogenic cardiomyopathy.1,3 The other is alteration in the right precordial QRS duration and morphology.16–19 Several investigators have proposed new ECG markers to better characterize delayed RV activation, including delayed S-wave upstroke at V1–317 and prolonged terminal activa-tion duration.18 All of these parameters have been shown to be useful for diagnosing ARVC. However, these ECG parameters may have limited accuracy and reproducibility
Importantly, ILA appeared more frequently in the RVOT (classified as M2 or M3 in Figure 4A) in patients with epsi-lon waves (4/8, 50%) compared with those without (1/16, 6%, P=0.028). Figure 4C further illustrates the stronger association of the RVOT with epsilon waves.
Prediction of Arrhythmic EventsWe further classified ILA into delayed and non-delayed by whether the time interval between the maximum main RV current and ILA exceeded the median delay of 50 ms. In cases of multiple ILA (n=12), we quantified the lateness of the ILA by the time interval between the maximum RV current and the last ILA. We divided 40 patients into 12 patients with delayed ILA (delay ≥50 ms) and the remain-ing 28 patients comprised 12 with non-delayed ILA (delay <50 ms) and 16 without ILA.
Table 2 compares the clinical characteristics of the 2 groups. There were no significant differences between them with respect to age, sex, LVEF, RVEF, and rate of previ-ous catheter ablation. During the median follow-up period of 42.5 months (interquartile range: 22.0–69.7), 7 patients (18%) underwent catheter ablation and 11 (28%) underwent ICD implantation. The frequencies of both procedures and treatment with β-blockers or class III antiarrhythmic drugs were not significantly different between the 2 groups.
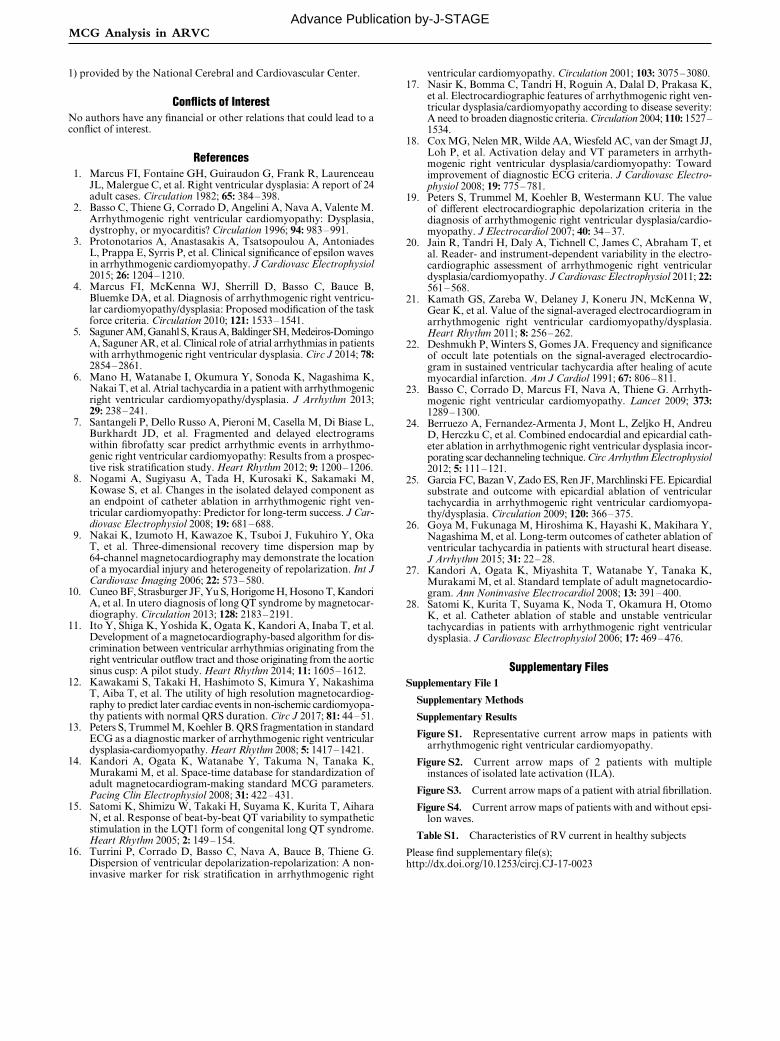
A total of 8 patients experienced MAE (sudden cardiac death in 1, sustained VT in 3, appropriate ICD interven-tion in 4), with a higher incidence in patients with delayed ILA (n=6, 50%) than in those with non-delayed ILA or without ILA (n=2, 7%). The Kaplan-Meier survival curves for the 2 groups were significantly different (log-rank test, P=0.004, Figure 5). Univariate analysis identified delayed ILA as the only predictor of subsequent MAE (HR 7.63, 95% CI 1.72–52.6, P=0.0069, Table 3) and the other non-invasive parameters were not significant predictors.
An additional subgroup analysis was conducted in 15 patients in whom the SAECG could not be evaluated
Table 3. Cox Regression Analysis for Major Arrhythmic Events
HR 95% CI P value
Age at enrollment (years) 1.00 0.96–1.06 0.98
Sex (male) 1.68 0.30–31.36 0.61
Prior sVT 0.62 0.09–12.42 0.69
ECG
AF 4.05 0.78–18.94 0.09
QRS duration (ms) 1.00 0.96–1.04 1.00
CRBBB 1.47 0.29–6.13 0.61
Epsilon waves 3.80 0.77–15.76 0.10
Fragmented QRS 0.67 0.10–2.93 0.62
SAECG (n=25)†
TQRSD (ms) 1.01 0.99–1.03 0.40
LAS40 (ms) 1.02 0.99–1.04 0.15
RMS40 (μV) 0.99 0.89–1.05 0.85
TTE
LVEF (1% decrease) 1.00 0.95–1.05 0.85
MRI/radionuclide scanning
RVEF (1% decrease) 1.01 0.94–1.10 0.71
MCG
Delayed ILA (≥50 ms) 7.63 1.72–52.6 0.0069
†Cases of QRS duration ≥110 ms were excluded. CI, confidence interval; HR, hazard ratio; MCG, magnetocardiogra-phy. Other abbreviations as in Tables 1,2.
Advance Publication by-J-STAGE

KIMURA Y et al.
lished the association of epsilon waves with RVOT involve-ment and with VT. They reported that epsilon waves were associated with increased RVOT diameter and with wall motion abnormalities of the RVOT. Despite these signifi-cant results, their study also showed that epsilon waves may not well reflect arrhythmic substrates in the inferior or lateral RV regions around the tricuspid valve annulus, where VT occurs most frequently in ARVC.28 In our study, epsilon waves on ECG were undetectable in most patients with lateral to inferior ILA on MCG. This finding con-firms the insensitivity of standard ECG to detect depolar-ization abnormalities in the lateral to inferior region of RV, which is relatively far from the precordial leads. These results are consistent with the report by Protonotarios et al.3
It should be emphasized that MCG may detect the arrhythmogenic substrate even better than invasive elec-troanatomic mapping, because MCG detects abnormally delayed activation irrespective of its transmural location. Identifying the location of ILA would provide significant information for planning the ablation strategy.
Study LimitationsThere are several to note. First, this was a retrospective study with a relatively small number of patients, and it was performed in a single tertiary referral center. This may have introduced potential limitations in patient selection, device programming, and arrhythmic risk stratification. There were no systematic criteria for catheter ablation or ICD implantation. Detection rates for ICD shocks were not uniformly programmed. However, the potential effect of this bias may have been lessened, because the number of the patients who underwent catheter ablation or ICD implantation during the follow-up was small and there was no significant difference between patients with delayed ILA and those without. Second, we excluded patients with implantable electronic devices, such as cardiac pacemak-ers, ICD, and cardiac resynchronization therapy. Devices or implants with ferromagnetic materials strongly deform the magnetic fields and impede MCG recording. Third, subject-specific reconstruction using imaging techniques such as MRI would be necessary for more precise localiza-tion. Fourth, this study included a small number of patients without prior VT. However, we believe that this method-ological distinctiveness of MCG will be of great interest to electrophysiologists. These important limitations must be taken into consideration when interpreting our results.
ConclusionsMultichannel MCG, because of its unique feature of high spatial resolution, offers the opportunity to visualize pos-sible underlying arrhythmogenic substrates. This study demonstrated that MCG can localize abnormally delayed activation in patients with ARVC. Moreover, delayed iso-lated late RV activation visualized by MCG predicts future lethal arrhythmias.
AcknowledgmentsWe gratefully thank Akihiko Kandori, Kuniomi Ogata, Advanced Research Laboratory, Hitachi Ltd. for the development of MCG, and Shuji Hashimoto, Yoshiki Yanagi, Emi Yamashita, National Cerebral and Cardiovascular Center, for the MCG recording.
Funding SourcesThis study was supported by Intramural Funds (22-1-2, 22-1-5, 25-2-
for risk stratification. The utility of depolarization abnor-malities detected on 12-lead ECG in diagnosing ARVC is strongly reader- and recording technique-dependent.20 Moreover, CRBBB impedes the evaluation of the terminal activation duration on standard ECG.
LPs are known to be prevalent, approximately 40–70%,21 but their usefulness as risk stratification is unestablished in cases of ARVC, unlike cases of old myocardial infarction (OMI). More prevalent LPs and a higher degree of abnor-malities (in TQRSD, RAS40, and LMS40) in ARVC, com-pared with OMI, indicate that not all LPs may be the predictor of future lethal arrhythmic events. Nogami et al have stressed the clinical importance of type II and/or type III LPs in ARVC, but have not depended on automatically calculated quantitative parameters of the LPs.8 The type of LP was firstly described by Deshmukh et al.22 Type II and/or type III LPs are related to the isolated delayed component in the invasive EPS and indicate a “critical isthmus” within degenerated myocardium and connected “islands of sur-viving myocardium”.8 However, we consider it is sometimes difficult to accurately discriminate and evaluate type II and/or type III LPs on SAECG. For example, as in the cases shown in Figure S2, type II and/or type III LPs might be masked by delayed whole RV activation.
Invasive Electroanatomical Mapping to Detect the Pathological SubstrateRecently, invasive electroanatomic mapping techniques have been used to clarify the pathological substrates for lethal arrhythmias and localize the VT ablation target site during sinus rhythm (without inducing VT) in ARVC patients.7,8 Ventricular mapping that detects the substrate of arrhythmias provides important information on patients at increased risk of arrhythmic events.
Electroanatomic mapping has some drawbacks. In addi-tion to its invasive nature and high cost, conventional endo-cardial mapping may miss early scars in ARVC, because the degenerative process begins in the epicardium and spreads towards the endocardium.2,23 This notion is sup-ported by the fact that combined endocardial and epicar-dial catheter ablation decreases the recurrence rate of VT in ARVC patients.24–26
Advantages of Noninvasive Risk Stratification by MCGThe major advantage of MCG over ECG is that magnetic fluxes are neither distorted nor attenuated by the interpos-ing extracardiac tissues. Moreover, MCG measurement is contact-free, quick, and reproducible. One examination is usually completed within 15 min.
In our previous MCG study of normal subjects,27 ante-rior current arrow maps showed that leftward current arrows on the left side during early-to-mid QRS (indicat-ing LV activation) diminished 60 ms after QRS onset, fol-lowed by the appearance of rightward current arrows on the right side during late QRS (reflecting RV activation, Figure 1D). Because MCG has high spatial resolution, we were able to identify isolated local activation separately from delayed whole RV activation. Therefore, ILA was noted in patients without epsilon waves on 12-lead ECG (Figure S4A) and in those without type II and/or III LPs on SAECG (Figure S2). This also made it possible to evaluate ILA even in patients with CRBBB.
The results of our study were compatible with the cur-rent perception of regional variation in depolarization abnormalities in ARVC. Protonotarios et al3 recently estab-
Advance Publication by-J-STAGE
MCG Analysis in ARVC
ventricular cardiomyopathy. Circulation 2001; 103: 3075 – 3080.17. Nasir K, Bomma C, Tandri H, Roguin A, Dalal D, Prakasa K,
et al. Electrocardiographic features of arrhythmogenic right ven-tricular dysplasia/cardiomyopathy according to disease severity: A need to broaden diagnostic criteria. Circulation 2004; 110: 1527 – 1534.
18. Cox MG, Nelen MR, Wilde AA, Wiesfeld AC, van der Smagt JJ, Loh P, et al. Activation delay and VT parameters in arrhyth-mogenic right ventricular dysplasia/cardiomyopathy: Toward improvement of diagnostic ECG criteria. J Cardiovasc Electro-physiol 2008; 19: 775 – 781.
19. Peters S, Trummel M, Koehler B, Westermann KU. The value of different electrocardiographic depolarization criteria in the diagnosis of arrhythmogenic right ventricular dysplasia/cardio-myopathy. J Electrocardiol 2007; 40: 34 – 37.
20. Jain R, Tandri H, Daly A, Tichnell C, James C, Abraham T, et al. Reader- and instrument-dependent variability in the electro-cardiographic assessment of arrhythmogenic right ventricular dysplasia/cardiomyopathy. J Cardiovasc Electrophysiol 2011; 22: 561 – 568.
21. Kamath GS, Zareba W, Delaney J, Koneru JN, McKenna W, Gear K, et al. Value of the signal-averaged electrocardiogram in arrhythmogenic right ventricular cardiomyopathy/dysplasia. Heart Rhythm 2011; 8: 256 – 262.
22. Deshmukh P, Winters S, Gomes JA. Frequency and significance of occult late potentials on the signal-averaged electrocardio-gram in sustained ventricular tachycardia after healing of acute myocardial infarction. Am J Cardiol 1991; 67: 806 – 811.
23. Basso C, Corrado D, Marcus FI, Nava A, Thiene G. Arrhyth-mogenic right ventricular cardiomyopathy. Lancet 2009; 373: 1289 – 1300.
24. Berruezo A, Fernandez-Armenta J, Mont L, Zeljko H, Andreu D, Herczku C, et al. Combined endocardial and epicardial cath-eter ablation in arrhythmogenic right ventricular dysplasia incor-porating scar dechanneling technique. Circ Arrhythm Electrophysiol 2012; 5: 111 – 121.
25. Garcia FC, Bazan V, Zado ES, Ren JF, Marchlinski FE. Epicardial substrate and outcome with epicardial ablation of ventricular tachycardia in arrhythmogenic right ventricular cardiomyopa-thy/dysplasia. Circulation 2009; 120: 366 – 375.
26. Goya M, Fukunaga M, Hiroshima K, Hayashi K, Makihara Y, Nagashima M, et al. Long-term outcomes of catheter ablation of ventricular tachycardia in patients with structural heart disease. J Arrhythm 2015; 31: 22 – 28.
27. Kandori A, Ogata K, Miyashita T, Watanabe Y, Tanaka K, Murakami M, et al. Standard template of adult magnetocardio-gram. Ann Noninvasive Electrocardiol 2008; 13: 391 – 400.
28. Satomi K, Kurita T, Suyama K, Noda T, Okamura H, Otomo K, et al. Catheter ablation of stable and unstable ventricular tachycardias in patients with arrhythmogenic right ventricular dysplasia. J Cardiovasc Electrophysiol 2006; 17: 469 – 476.
Supplementary FilesSupplementary File 1
Supplementary MethodsSupplementary ResultsFigure S1. Representative current arrow maps in patients with
arrhythmogenic right ventricular cardiomyopathy.Figure S2. Current arrow maps of 2 patients with multiple
instances of isolated late activation (ILA).Figure S3. Current arrow maps of a patient with atrial fibrillation.Figure S4. Current arrow maps of patients with and without epsi-
lon waves.Table S1. Characteristics of RV current in healthy subjects
Please find supplementary file(s);http://dx.doi.org/10.1253/circj.CJ-17-0023
1) provided by the National Cerebral and Cardiovascular Center.
Conflicts of InterestNo authors have any financial or other relations that could lead to a conflict of interest.
References 1. Marcus FI, Fontaine GH, Guiraudon G, Frank R, Laurenceau
JL, Malergue C, et al. Right ventricular dysplasia: A report of 24 adult cases. Circulation 1982; 65: 384 – 398.
2. Basso C, Thiene G, Corrado D, Angelini A, Nava A, Valente M. Arrhythmogenic right ventricular cardiomyopathy: Dysplasia, dystrophy, or myocarditis? Circulation 1996; 94: 983 – 991.
3. Protonotarios A, Anastasakis A, Tsatsopoulou A, Antoniades L, Prappa E, Syrris P, et al. Clinical significance of epsilon waves in arrhythmogenic cardiomyopathy. J Cardiovasc Electrophysiol 2015; 26: 1204 – 1210.
4. Marcus FI, McKenna WJ, Sherrill D, Basso C, Bauce B, Bluemke DA, et al. Diagnosis of arrhythmogenic right ventricu-lar cardiomyopathy/dysplasia: Proposed modification of the task force criteria. Circulation 2010; 121: 1533 – 1541.
5. Saguner AM, Ganahl S, Kraus A, Baldinger SH, Medeiros-Domingo A, Saguner AR, et al. Clinical role of atrial arrhythmias in patients with arrhythmogenic right ventricular dysplasia. Circ J 2014; 78: 2854 – 2861.
6. Mano H, Watanabe I, Okumura Y, Sonoda K, Nagashima K, Nakai T, et al. Atrial tachycardia in a patient with arrhythmogenic right ventricular cardiomyopathy/dysplasia. J Arrhythm 2013; 29: 238 – 241.
7. Santangeli P, Dello Russo A, Pieroni M, Casella M, Di Biase L, Burkhardt JD, et al. Fragmented and delayed electrograms within fibrofatty scar predict arrhythmic events in arrhythmo-genic right ventricular cardiomyopathy: Results from a prospec-tive risk stratification study. Heart Rhythm 2012; 9: 1200 – 1206.
8. Nogami A, Sugiyasu A, Tada H, Kurosaki K, Sakamaki M, Kowase S, et al. Changes in the isolated delayed component as an endpoint of catheter ablation in arrhythmogenic right ven-tricular cardiomyopathy: Predictor for long-term success. J Car-diovasc Electrophysiol 2008; 19: 681 – 688.
9. Nakai K, Izumoto H, Kawazoe K, Tsuboi J, Fukuhiro Y, Oka T, et al. Three-dimensional recovery time dispersion map by 64-channel magnetocardiography may demonstrate the location of a myocardial injury and heterogeneity of repolarization. Int J Cardiovasc Imaging 2006; 22: 573 – 580.
10. Cuneo BF, Strasburger JF, Yu S, Horigome H, Hosono T, Kandori A, et al. In utero diagnosis of long QT syndrome by magnetocar-diography. Circulation 2013; 128: 2183 – 2191.
11. Ito Y, Shiga K, Yoshida K, Ogata K, Kandori A, Inaba T, et al. Development of a magnetocardiography-based algorithm for dis-crimination between ventricular arrhythmias originating from the right ventricular outflow tract and those originating from the aortic sinus cusp: A pilot study. Heart Rhythm 2014; 11: 1605 – 1612.
12. Kawakami S, Takaki H, Hashimoto S, Kimura Y, Nakashima T, Aiba T, et al. The utility of high resolution magnetocardiog-raphy to predict later cardiac events in non-ischemic cardiomyopa-thy patients with normal QRS duration. Circ J 2017; 81: 44 – 51.
13. Peters S, Trummel M, Koehler B. QRS fragmentation in standard ECG as a diagnostic marker of arrhythmogenic right ventricular dysplasia-cardiomyopathy. Heart Rhythm 2008; 5: 1417 – 1421.
14. Kandori A, Ogata K, Watanabe Y, Takuma N, Tanaka K, Murakami M, et al. Space-time database for standardization of adult magnetocardiogram-making standard MCG parameters. Pacing Clin Electrophysiol 2008; 31: 422 – 431.
15. Satomi K, Shimizu W, Takaki H, Suyama K, Kurita T, Aihara N, et al. Response of beat-by-beat QT variability to sympathetic stimulation in the LQT1 form of congenital long QT syndrome. Heart Rhythm 2005; 2: 149 – 154.
16. Turrini P, Corrado D, Basso C, Nava A, Bauce B, Thiene G. Dispersion of ventricular depolarization-repolarization: A non-invasive marker for risk stratification in arrhythmogenic right
Advance Publication by-J-STAGE