Embed Size (px)
Citation preview

ISO 9000 IMPLEMENTATION AND PERFORMANCE IMPROVEMENT
IN VIETNAMESE MANUFACTURING COMPANIES
Phan Chi Anh1, Nguyen Hue Minh
1, Luong Vu Mai Hoa
1, and Yoshiki Matsui
2
1 University of Economics and Business, Vietnam National University, Hanoi
144 Xuan Thuy, Cau Giay, Hanoi, Vietnam
Office phone: +84 4 3754 7506; Email: [email protected]
2 Yokohama National University
79-4 Tokiwadai, Hodogaya-ku, 2408501, Japan
Office phone: +81-45-339-3734; Email: [email protected]
INTRODUCTION
Standardization of product and production is irreversible trend of global economy. The ISO
9000 implementation has been accepted worldwide as a useful first step towards Total
Quality Management (TQM) and since it’s establish in 1987 until now, the number of
organizational that has been certified is growing continuously.
In recent years, Vietnam’s economy has been taking ongoing efforts to integrate into the
international economy ISO 9000 series were introduced in Vietnam during 1990s and has
been widely implemented in manufacturing sector and service sector. The number of
Vietnamese companies which obtained ISO 9000 certification had increased 431 folds from
13 certificated companies in 1997 to 7333 certificated companies in 2009 [27]. While the
majority of managers and researchers agree that ISO 9000 implementation is necessary for
quality management process, the impacts of ISO 9000 implementation on companies’
performance in Vietnam are still the questions for academicians and quality management
practitioners and need to be investigated.
To address this need, this study aims at examining the situation of ISO 9000 implementation
in Vietnamese manufacturing companies and its relationship with quality performance and
customer satisfaction in companies. Based on the data collected from 108 companies though
a questionnaire survey in 2012, the authors investigate the changes in quality management
practices and different performance dimensions before and after ISO 9000 implementation.
The results of statistical results indicate that ISO 9000 implementation significantly improve
various quality management practices and quality performance. This study contributes to
quality management literature by highlight the significant contribution of ISO 9000 to
performance of companies. In addition, the results of this study portray the quality
management practices in Vietnamese companies. The next sections will summary the latest
ISO 9000 literature and analytical framework of this study. Then the data collection and
analysis will be explained. The last three sections show the main findings, implications,
discussions, limitations, and conclusions.

LITERATURE REVIEW
In this section, we summaries the main framework of ISO 9000 from the perspective of
quality management principles and summarized the latest literature on ISO 9000 studies. The
empirical findings on contribution of ISO 9000 to business performance are summarized.
Benefits of ISO 9000
Since ISO 9000 has been first published in 1987 and became one of the most popular adopted
quality management system in the world, the debate about ISO 9000’s impacts on the
organizational performances is still unclear.
Sampaio et al (2009) indicated in their exhaustive literature review research that there are
external and internal benefits of ISO 9000 certification (most common benefit are
summarized in Table 1 as following:
Table 1: Most commonly stated ISO 9001 certification benefits reported in the literature
[18]
External benefits Internal benefits
Access to new markets
Corporate image improvement
Market share improvement
ISO 9000 certification as marketing tool
Customer relationship improvements
Customer satisfaction
Customer communication improvement
Productivity improvements
Product defect rate decreases
Quality awareness improvements
Definition of the personnel responsibilities
and obligations
Delivery time improvements
Internal organization improvements
Nonconformities decrease
Customers’ complains decrease
Internal communication improvements
Product quality improvement
Competitive advantage improvement
Personnel motivation
On the one hand, these above benefits have been proved as the result of ISO 9000
implementation by several researches [2] [3] [4] [5] [8] [9] [10] [11] [17] [20] [23] [26].
On the other hand, there are arguments that no proof of direct causation or not enough
evidence to support such benefits of ISO 9000 [6] [7] [12] [13] [18] [22] [25].
ISO 9000’s eight quality management principles
The ISO 9000 standards are based on eight quality management principles which are derived
from the collective experience and knowledge of the international experts. They are listed in
Table 2 as following:

Table 2: ISO 9000’s eight quality management principles
No. Principle Content Key Benefits
1 Customer focus Organizations depend on their
customers and therefore should
understand current and future
customer needs, should meet
customer requirements and
strive to exceed customer
expectations.
Increased revenue and market share
obtained through flexible and fast
responses to market opportunities
Increased effectiveness in the use of the
organization’s resources to enhance
customer satisfaction
Improved customer loyalty leading to
repeat business.
2 Leadership Leaders establish unity of
purpose and direction of the
organization. They should
create and maintain the internal
environment in which people
can become fully involved in
achieving the organization's
objectives.
People will understand and be
motivated towards the organization’s
goals and objectives
Activities are evaluated, aligned and
implemented in a unified way
Miscommunication between levels of
an organization will be minimized.
3 Involvement of
people
People at all levels are the
essence of an organization and
their full involvement enables
their abilities to be used for the
organization's benefit.
Motivated, committed and involved
people within the organization
Innovation and creativity in furthering
the organization’s objectives
People being accountable for their own
performance
People eager to participate in and
contribute to continual improvement.
4 Process approach A desired result is achieved
more efficiently when activities
and related resources are
managed as a process.
Lower costs and shorter cycle times
through effective use of resources
Improved, consistent and predictable
results
Focused and prioritized improvement
opportunities.
5 System approach Identifying, understanding and
managing interrelated
processes as a system
contributes to the
organization's effectiveness
and efficiency in achieving its
objectives.
Integration and alignment of the
processes that will best achieve the
desired results
Ability to focus effort on the key
processes
Providing confidence to interested
parties as to the consistency,
effectiveness and efficiency of the
organization.

No. Principle Content Key Benefits
6 Continual
improvement
Continual improvement of the
organization's overall
performance should be a
permanent objective of the
organization.
Performance advantage through
improved organizational capabilities
Alignment of improvement activities
at all levels to an organization’s
strategic intent
Flexibility to react quickly to
opportunities.
7 Factual approach to
decision making
Effective decisions are based
on the analysis of data and
information.
Informed decisions
An increased ability to demonstrate the
effectiveness of past decisions through
reference to factual records
Increased ability to review, challenge
and change opinions and decisions.
8 Mutually beneficial
supplier
relationships
An organization and its
suppliers are interdependent
and a mutually beneficial
relationship enhances the
ability of both to create value.
Increased ability to create value for
both parties
Flexibility and speed of joint responses
to changing market or customer needs
and expectations
Optimization of costs and resources.
Eight quality management principles can be used by company’s managers to guide the
implementation of ISO 9000 system in company toward improved performance. Each
principle alone and together to ensure the benefits of ISO 9000 on company’s performance.
Performance measurement
The performance measure in production could be listed as follows [1]:
Quality-based measure: product conformance, features, reliability, perceived quality,
serviceability, technical durability
Time-based measure: manufacturing lead time, deliver lead time, due-date
performance, frequency of delivery
Cost- based measure: production cost, service cost, value added, selling price
Flexibility based measure: new product introduction, deliverability, volume, resource
mix
In the Kaplan and Norton model of the Balanced Scorecard four perspectives are used to
measure the company’s performance [14]:
Financial perspective: Reflects the financial return to the owners (How do we look to
our shareholders?)

Customer perspective: Reflects how customers view our business (How do our
customers see us?)
Business-process perspective: Reflects what we must be good at (What must we excel
at?)
The innovation and learning perspective: Reflects how we are to do continue and
develop (How can we continue to improve and create value?)
Combine between the benefits of ISO 9000 in previous literature and the measurement of
business’s performance, the factors are chosen in this research to analyze performance of
company include: Nonconformities (Defects), Delivery time and customer satisfaction.
The impacts of ISO 9000 implementation on quality performance and customer
satisfaction
Many studies highlighted the expectations of improved quality management practices, quality
performance improvement, and increased customer satisfaction from ISO 9000
implementation.
Romano [19] presented a longitudinal analysis by comparing the growth in different
measures of performance six months before and after certification on a sample of 100 Italian
companies. The performance measures were internal and external quality, quality costs and
timing (cycle, manufacturing, punctuality in delivery etc.). The conclusions are that
registered companies improve their internal quality and the reliability of the production
process.
Buttle’s survey [4] of 1,220 certified UK companies, which included 415 service sector firms,
found that improving operations and marketing gains were claimed by most of the firms
following ISO 9000 quality certification. Particularly, profit improvement is the most
important benefit sought from certifications; ranked second and third most important are
process improvements and marketing benefit (including gaining new customers, keeping
existing customers, increasing market share, increasing growth in sales and improving
customer satisfaction).
Leticia Santos and Carmen Escanciano [15] conducted an empirical study on the benefits of
implementation of ISO 9000. The authors carried out survey on a sample of certificated
companies in Spain. The empirical evidence indicated that the benefits attained by companies
including benefits related to the human element and managerial procedures, the improvement
in competitive position in the market, internal efficiency, and external benefits associated
with increase in customer satisfaction are results of ISO certification.
Low Sui Pheng and Darren Wee [16] investigated the impact of ISO 9000 on building
defects. The study was conducted in the organization and operations of main building
contractor in Singapore. By focusing onto fundamental aspect of construction quality, the
research result showed how ISO 9000 certification can affect the amount of defects
occurring. It provided the relationship between each of ISO 9001 requirements, the causes of
defects and the broad strategies needed to prevent the causes from occurring.

ANALYTICAL FRAMEWORK
The main objectives of this study are to investigate the relationship between ISO 9000
implementation and quality performance and customer satisfaction. The authors focus on four
aspects of ISO 9000 implementation: training, supplier control, process control,
documentation. The analytical framework is presented in Figure 1.
Figure 1: Analytical framework
Based on ISO9000 literature, four hypotheses are established as follows.
Hypothesis 1: There is a significant change in quality management practices between
before and after the ISO 9000 implementation in companies
Hypothesis 2: There is a significant change in quality performance between before
and after the ISO 9000 implementation in companies
Hypothesis 3: ISO 9000 implementation positively impact on quality performance of
companies
Hypothesis 4: ISO 9000 implementation positively impact on customer satisfaction of
companies
DATA MEASUREMENT AND COLLECTION
Questionnaire was designed in Vietnamese, and divided into three main parts:
Part I: This part is designed to collect information about companies as well as
constraints and motivations for them to implement ISO 9000.
Part II: This part includes items asking participants about quality management
practices of their companies in two periods – before and after their companies
implement ISO 9000. Question items are about Employee training, Supplier control,
Training
Supplier control
Process control
Documentation level
ISO 9000 Implementation
Customer satisfaction
Quality performance
On time delivery
Customer returns
Final Defects
Incoming Defects

Process control and Documentation level. This part use quantitative measurement for
all question items as following:
Employee training: The percentage of employees being trained about quality
management
Supplier control: The percentage of suppliers being examined, evaluated and
re-evaluated before selected
Process control: The percentage of processes which is controlled through
statistic techniques and data analysis
Documentation level: The percentage of processes which is documented
Part III: This part comprises items asking participants about quality performance and
customer satisfaction of their companies in two periods – before and after ISO 9000
implementation. Question items are about incoming defect rate, final defect rate,
after-sale defect (or customer return) rate, on time delivery, and customer satisfaction.
This part use quantitative measurement for all question items as following:
Incoming defect: The average percentage of incoming defects per year
Final defect: The average percentage of final defects per year
After-sale defect: The average percentage of defects after sale (customer
returns) per year
On time delivery: The average percentage of transactions/contracts completed
on time per year
Customer satisfaction: The percentage of customer satisfy with companies’
products
The questionnaire has been delivered to 350 manufacturing companies in Vietnam and there
were 120 feedbacks with the response rate at 34.3%. Among them, 108 valid responses have
been used to analyze in this study.
DATA ANALYSIS
Data description
Table 3: Demographics of companies
Region %
North Vietnam 20.4
Central Vietnam 3.7
South Vietnam 2.8
North and Central Vietnam 20.4
All 3 regions in Vietnam 24.1
N/A 28.7
Number of staff %
Less than 10 0
11 – 200 48.15
201 – 300 13.89
More than 300 30.55
N/A 7.41
Certification Period %
Less than 2 years 22.2
2 – 5 years 47.2
5 – 10 years 26.9
More than 10 years 0.9
N/A 2.8
The collected data includes the companies operating in different geographical position of
Vietnam. Companies operating in all North, Central and South Vietnam present a major

proportion with 24.1%. The number of companies solely operating in North Vietnam or in
North and Central Vietnam are also large proportion of equally 20.4%. The percentage of
companies solely operating in just Central Vietnam or just South Vietnam is smaller with
3.7% and 2.8%, respectively.
Besides, companies are mostly small and medium enterprises with more than 50% of
companies have 11-300 employees. The number of large companies with more than 300 staff
also presents a large proportion of over 30%.
Moreover, approximately 50% of companies were ISO 9000 certificated in period from 2-5
years. The remaining companies have been certificated in period of less than 2 years or from
5-10 years.
Table 4: Difficulties for Vietnamese companies in implementing ISO 9000
Difficulties %
Management commitment 22.2
Lack of resources 75
Lack of knowledge about ISO 9000 requirements 46.3
Lack of training on quality and ISO 9000 42.6
Internal resistance 75
Document and workload are beyond control 51.9
Among six typical difficulties which companies have suffered when implementing ISO
9000. Internal resistance and Lack of resources (such as human resource, financial resource)
are two difficulties challenging 75% of respondents. In addition, 51.9% faces problems with a
huge volume of document and workload when they implement ISO 9000. Lacking of training
on quality and knowledge about ISO 9000 requirements are also quite popular with more than
40% of companies have to cope with. Management commitment seems to be relatively high,
so these difficulties is the least popular one for companies.
Table 5: Motivations for ISO 9000 impelementation
Motivations %
External motivation 36.1
Internal motivation 45.4
Both external and internal motivation 15.7
N/A 2.8
When be asked about the motivation for ISO 9000 implementation, a major proportion with
45.4% of companies have internal motivation which primarily aims to improve the internal
processes and product quality, enhance employees’ knowledge and skills as well as the
efficiency of whole organization. Meanwhile, 36.1% of companies align with external
motivation which towards the improvement in companies’ image and customer satisfaction as
well as the opportunities for new business and market expansion. Besides, a smaller
percentage with 15.7% decided to implement ISO 9000 with both two above motivation.
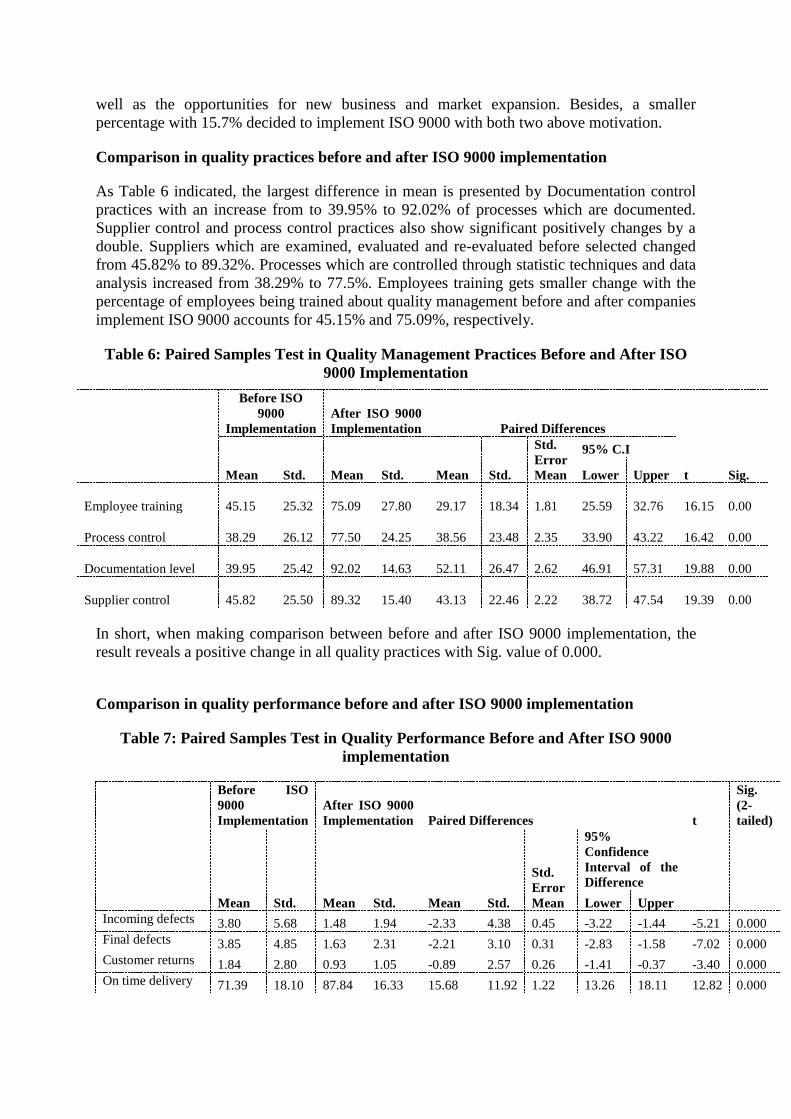
Comparison in quality practices before and after ISO 9000 implementation
As Table 6 indicated, the largest difference in mean is presented by Documentation control
practices with an increase from to 39.95% to 92.02% of processes which are documented.
Supplier control and process control practices also show significant positively changes by a
double. Suppliers which are examined, evaluated and re-evaluated before selected changed
from 45.82% to 89.32%. Processes which are controlled through statistic techniques and data
analysis increased from 38.29% to 77.5%. Employees training gets smaller change with the
percentage of employees being trained about quality management before and after companies
implement ISO 9000 accounts for 45.15% and 75.09%, respectively.
Table 6: Paired Samples Test in Quality Management Practices Before and After ISO
9000 Implementation
Before ISO
9000
Implementation
After ISO 9000
Implementation Paired Differences
t Sig. Mean Std. Mean Std. Mean Std.
Std.
Error
Mean
95% C.I
Lower Upper
Employee training 45.15 25.32 75.09 27.80
29.17
18.34
1.81
25.59
32.76
16.15 0.00
Process control 38.29 26.12 77.50 24.25
38.56
23.48
2.35
33.90
43.22
16.42 0.00
Documentation level 39.95 25.42 92.02 14.63
52.11
26.47
2.62
46.91
57.31
19.88 0.00
Supplier control 45.82 25.50 89.32 15.40
43.13
22.46
2.22
38.72
47.54
19.39 0.00
In short, when making comparison between before and after ISO 9000 implementation, the
result reveals a positive change in all quality practices with Sig. value of 0.000.
Comparison in quality performance before and after ISO 9000 implementation
Table 7: Paired Samples Test in Quality Performance Before and After ISO 9000
implementation
Before ISO
9000
Implementation
After ISO 9000
Implementation Paired Differences t
Sig.
(2-
tailed)
Mean Std. Mean Std. Mean Std.
Std.
Error
Mean
95%
Confidence
Interval of the
Difference
Lower Upper
Incoming defects 3.80 5.68 1.48 1.94 -2.33 4.38 0.45 -3.22 -1.44 -5.21 0.000
Final defects 3.85 4.85 1.63 2.31 -2.21 3.10 0.31 -2.83 -1.58 -7.02 0.000
Customer returns 1.84 2.80 0.93 1.05 -0.89 2.57 0.26 -1.41 -0.37 -3.40 0.000
On time delivery 71.39 18.10 87.84 16.33 15.68 11.92 1.22 13.26 18.11 12.82 0.000

Table 7 clearly shows a decrease in defect rates from both incoming materials, final products,
and, after-sale products. Incoming defects and final defects, after the companies implement
ISO 9000, decrease by more than half from approximately 3.8% to 1.5%. After-sale defects
(customer returns) present smaller values in both two period of before and after ISO 9000
implementation, but also indicate a significant improvement with defect rate reduces from
1.84% to 0.93%. It is interesting that standard deviation values of these defect rates are quite
high. This can be explained by the demographics of respondents; they are companies working
in different field so that they have very different requirements about defect rates.
On time delivery which represents for the percentage of contracts/transactions complete on
time get a rather good result as before the companies implement ISO 9000 with 71.39%. This
percentage increases by one third to 87.84% after ISO 9000 implementation.
In short, when making comparison between before and after ISO 9000 implementation, the
result reveals a positive change in all quality performance items with Sig. value of 0.000.
Impacts of ISO 9000 implementation on quality performance and customer satisfaction
Regression analysis is applied to evaluate the impacts of ISO 9000 implementation on each
four quality performance items including Incoming defects, Final defects, After-sale defects
(Or Customer returns), and On time Delivery. Respondents are companies operating in
different fields, so changes in ISO 9000 implementation, quality performance and customer
satisfaction are much different. Therefore, regression analysis is just conducted with current
data to find out the current situation of ISO 9000 implementation and quality performance as
well as customer satisfaction.
Impacts of ISO 9000 implementation on Incoming defects
Regression analysis is conducted with 4 independent variable namely (1) Employee training,
(2) Supplier control, (3) Process control, (4) Documentation level and dependent variable
namely Incoming defects.
Table 8: Regression Analysis on Relationship Between ISO 9000 Implementation and
Incoming Defects)
R R Square
Adjusted R
Square Sig.
0.459 0.21 0.174 .000
Unstandardized
Coefficients
Standardized
Coefficients Sig.
Collinearity
Statistics
B Std. Error Beta
Tolerance VIF
(Constant) 10.442 3.396 0.003
Employee training (ET) -0.017 0.019 -0.088 0.365 0.967 1.034
Supplier control (SC) -0.112 0.035 -0.315 0.002 0.931 1.074
Process control (PC) 0.083 0.023 0.363 0.001 0.869 1.151
Documentation level (DL) -0.046 0.022 -0.210 0.041 0.883 1.132

Sig. value of .000 means that these 4 independent variables reliably predict the dependent
variable. Adjusted R-square value is 0.174 which means that 17.4% of the variance in
Incoming Defects can be explained by 4 variables of ISO implementation.
The result table shows that Employee training, Supplier control and Documentation level
have negative relationship with Incoming defects. That means higher percentage of trained
employees, higher percentage of suppliers being examined before selected and higher
percentage of documented processes will lead to lower incoming defect rate. Process control
reveals a positive relationship with incoming defect rate. This can be explain that with higher
percentage of processes controlled through statistic techniques and data analysis, higher
percentage of incoming defects will be found.
In addition, supplier control, process control and documentation level present a high impact
on incoming defects and have a statistically significant relationship with incoming defect rate
(Sig. < 0.05). Employee training, however, has the smallest coefficient value of -0.088 and
Sig. value of 0.365 (> 0.05). Thus, employee training does not indicate strong impact on
incoming defects and does not show a statistically significant relationship with incoming
defect rate as 3 remaining ISO 9000 implementation items.
With coefficients presented in Table above, regression function is as following:
Incoming defects = 10.442 + (-0.088) ET + (-0.315) SC + 0.363 PC + (-0.21) DL
From the regression function, it can be seen that Process control has greatest influence on
incoming defects with the highest coefficient value of 0.363. Besides, Supplier control also
presents a strong impact on incoming defects with coefficient value of -0.315. Documentation
level has a smaller coefficient value of -0.21.
Impacts of ISO 9000 implementation on Final defects
Regression analysis is conducted with 4 independent variable namely (1) Employee training,
(2) Supplier control, (3) Process control, (4) Documentation level and dependent variable
namely Final defects.
Table 9: Regression analysis (ISO implementation and Final Defects)
R R Square
Adjusted R
Square Sig.
0.477 0.227 0.194 .000
Unstandardized Coefficients
Standardized
Coefficients Sig. Collinearity Statistics
B Std. Error Beta
Tolerance VIF
(Constant) 5.338 1.242 0.000
Employee training (ET) -0.020 0.007 -0.245 0.010 0.950 1.052
Supplier control (SC) -0.048 0.013 -0.346 0.000 0.904 1.106
Process control (PC) 0.032 0.009 0.35 0.001 0.843 1.187
Documentation level (DL) -0.012 0.008 -0.142 0.134 0.932 1.073

Sig. value of .000 means that these 4 independent variables reliably predict the dependent
variable. Adjusted R-square value is 0.194 which means that 19.4% of the variance in Final
Defects can be explained by 4 variables of ISO 9000 implementation.
Similar to result with incoming defect as above, Employee training, Supplier control and
Documentation level indicates a negative relationship with Final defect rate while Process
control reveals a positive relationship. Differently, Employee training, Supplier control and
Process control present strong impacts on final defect rate with a statistically significant
relationship (Sig. < 0.05) whereas Documentation level does not.
With coefficients presented in Table above, regression function is as following:
Final Defects = 5.338 + (-0.245) ET + (-0.346) SC + 0.35 PC + (-0.142) DL
It can be seen that Process control and Supplier control stress a strong impact on final defect
with coefficient values of 0.35 and -0.346, respectively. Employee training also has relatively
great influence on final defects with coefficient value of -0.245.
Impacts of ISO 9000 implementation on After-sale defects (customer returns)
Regression analysis is conducted with 4 independent variable namely (1) Employee training,
(2) Supplier control, (3) Process control, (4) Documentation level and dependent variable
namely After-sale defects.
Table 10: Regression Analysis on Relationship Between (ISO Implementation and
After-sale Defects)
R R Square
Adjusted R
Square Sig.
.520 0.270 0.240 .000
Unstandardized Coefficients
Standardized
Coefficients Sig.
Collinearity Statistics
B Std. Error Beta
Tolerance VIF
(Constant) 4.294 0.692 0.000
Employee training (ET) -0.01 0.003 -0.252 0.006 0.954 1.049
Supplier control (SC) -0.013 0.006 -0.198 0.038 0.848 1.179
Process control (PC) -0.01 0.005 -0.226 0.034 0.682 1.466
Documentation level (DL) -0.007 0.008 -0.102 0.347 0.651 1.535
Sig. value of .000 means that these 4 independent variables reliably predict the dependent
variable. Adjusted R-square value is 0.240 which means that these 4 ISO 9000 variables can
explain 24% of the variance in After-sale defects.
Result table shows that 4 ISO 9000 items have negative relationship with After-sale defect.
Employee training, Supplier control and Process control have a statistically significant
relationship with Sig. value smaller than 0.05. Employee training has strongest impact on
after-sale defect rate with coefficient of -0.252. Documentation level indicates impact on
after-sale defect rate with coefficient of -0.102 but does not show a statistically significant
relationship with Sig. value of 0.347 (greater than 0.05).

With coefficients presented in Table above, regression function is as following:
After-sale defects = 4.294 + (-0.252) ET + (-0.198) SC + (-0.226) PC + (-0.102) DL
Impacts of ISO 9000 implementation on On- time delivery
Regression analysis is conducted with 4 independent variable namely (1) Employee training,
(2) Supplier control, (3) Process control, (4) Documentation level and dependent variable
namely On time delivery.
Table 11: Regression Analysis on Relationship Between ISO Implementation and On
time delivery)
R R Square
Adjusted R
Square Sig.
.416 0.173 0.135 .002
Unstandardized
Coefficients
Standardized
Coefficients Sig. Collinearity Statistics
B Std. Error Beta
Tolerance VIF
(Constant) 50.382 11.8 0
Employee training (ET) 0.167 0.059 0.282 0.006 0.965 1.036
Supplier control (SC) 0.027 0.114 0.025 0.816 0.825 1.212
Process control (PC) 0.17 0.069 0.255 0.015 0.891 1.122
Documentation level (DL) 0.011 0.116 0.01 0.925 0.82 1.22
Sig. value of .002 means that these 4 independent variables reliably predict the dependent
variable. Adjusted R-square value is 0.135 which means that these 4 ISO 9000 variables can
explain 13.5% of the variance in On time delivery.
The result table shows that all 4 ISO 9000 items have positive relationship with On time
delivery. Employee training and Process control have a statistically significant relationship
with Sig. value smaller than 0.05 and stress strongest impact on On time delivery with
coefficient of 0.282 and 0.255, respectively. The two remaining ISO 9000 items including
Supplier control and Documentation level have smaller impact on On time delivery and do
not show a statistically significant relationship with Sig. value greater than 0.05.
With coefficients presented in Table above, regression function is as following:
On time delivery = 50.382 + 0.282 ET + 0.025 SC + 0.255 PC + 0.01 DL
Impacts of ISO 9000 implementation on Customer satisfaction
Regression analysis is conducted with 4 independent variable namely (1) Employee training,
(2) Supplier control, (3) Process control, (4) Documentation level and dependent variable
namely Customer satisfaction.
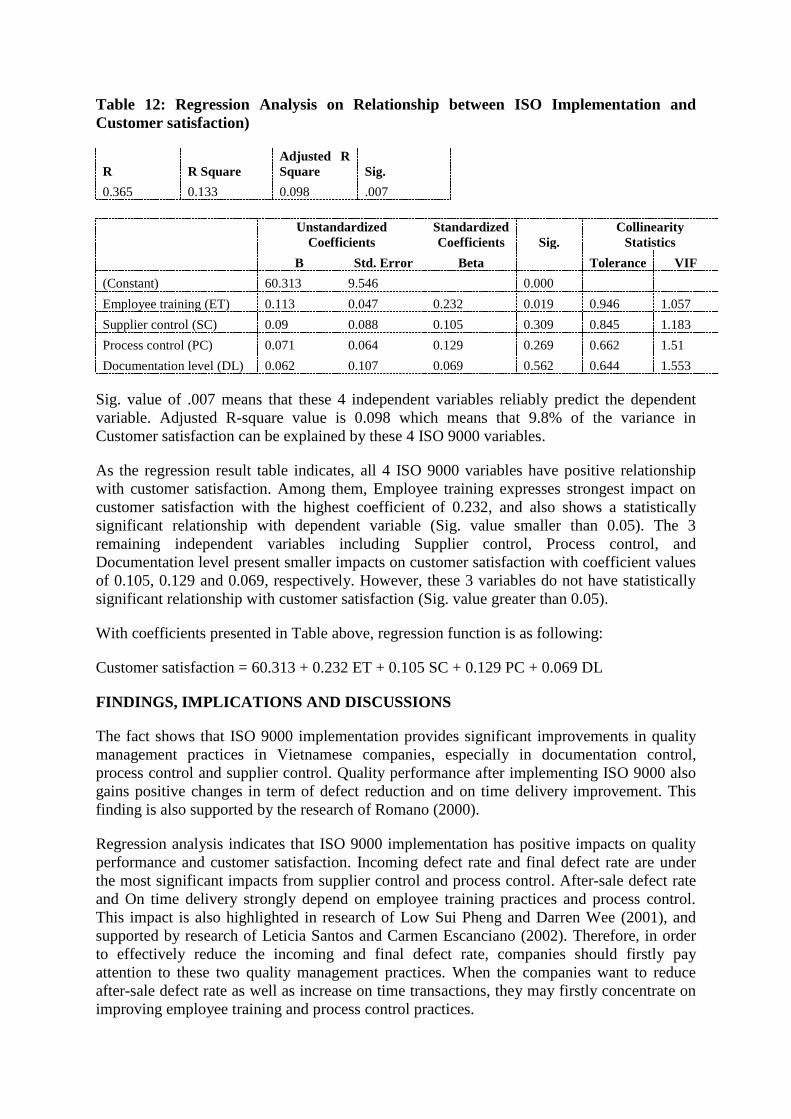
Table 12: Regression Analysis on Relationship between ISO Implementation and
Customer satisfaction)
R R Square
Adjusted R
Square Sig.
0.365 0.133 0.098 .007
Unstandardized
Coefficients
Standardized
Coefficients Sig.
Collinearity
Statistics
B Std. Error Beta
Tolerance VIF
(Constant) 60.313 9.546 0.000
Employee training (ET) 0.113 0.047 0.232 0.019 0.946 1.057
Supplier control (SC) 0.09 0.088 0.105 0.309 0.845 1.183
Process control (PC) 0.071 0.064 0.129 0.269 0.662 1.51
Documentation level (DL) 0.062 0.107 0.069 0.562 0.644 1.553
Sig. value of .007 means that these 4 independent variables reliably predict the dependent
variable. Adjusted R-square value is 0.098 which means that 9.8% of the variance in
Customer satisfaction can be explained by these 4 ISO 9000 variables.
As the regression result table indicates, all 4 ISO 9000 variables have positive relationship
with customer satisfaction. Among them, Employee training expresses strongest impact on
customer satisfaction with the highest coefficient of 0.232, and also shows a statistically
significant relationship with dependent variable (Sig. value smaller than 0.05). The 3
remaining independent variables including Supplier control, Process control, and
Documentation level present smaller impacts on customer satisfaction with coefficient values
of 0.105, 0.129 and 0.069, respectively. However, these 3 variables do not have statistically
significant relationship with customer satisfaction (Sig. value greater than 0.05).
With coefficients presented in Table above, regression function is as following:
Customer satisfaction = 60.313 + 0.232 ET + 0.105 SC + 0.129 PC + 0.069 DL
FINDINGS, IMPLICATIONS AND DISCUSSIONS
The fact shows that ISO 9000 implementation provides significant improvements in quality
management practices in Vietnamese companies, especially in documentation control,
process control and supplier control. Quality performance after implementing ISO 9000 also
gains positive changes in term of defect reduction and on time delivery improvement. This
finding is also supported by the research of Romano (2000).
Regression analysis indicates that ISO 9000 implementation has positive impacts on quality
performance and customer satisfaction. Incoming defect rate and final defect rate are under
the most significant impacts from supplier control and process control. After-sale defect rate
and On time delivery strongly depend on employee training practices and process control.
This impact is also highlighted in research of Low Sui Pheng and Darren Wee (2001), and
supported by research of Leticia Santos and Carmen Escanciano (2002). Therefore, in order
to effectively reduce the incoming and final defect rate, companies should firstly pay
attention to these two quality management practices. When the companies want to reduce
after-sale defect rate as well as increase on time transactions, they may firstly concentrate on
improving employee training and process control practices.

Customer satisfaction normally depends on many different factors. In this study, 4 items of
ISO 9000 implementation can reliably explain 9.8% the variation in customer satisfaction in
which employee training presents the strongest impact. To improve customer satisfaction,
companies should continuously pay attention to all quality management practices in order to
improve all quality dimensions. This significant relationship between ISO 9000
implementation and customer satisfaction is also highlighted in research results from studies
of Buttle’s (1996), Leticia Santos and Carmen Escanciano (2002).
LIMITATIONS
One limitation of this study is that the number of valid responses is still limited with 108
companies which are uneven in term of operating field and geography. Moreover, the time to
carry out survey, collect data and analyze data was limited. Therefore, it is difficult for results
from these 108 companies to represent for ISO 9000 implementation situation in Vietnamese
companies. In further research, observation results may be improved and better represent for
Vietnamese companies if survey data is collected from larger sample with equal number of
companies in different fields.
CONCLUSIONS
This study examines the change in quality management practices as well as the change in
quality performance of Vietnamese companies before and after companies’ implementation
ISO 9000 standards. Then, the study provides evaluations about the impacts of quality
management practices after companies implement ISO 9000 on quality performance and
customer satisfaction. The result reveals clearly significant roles of ISO 9000 in companies’
quality improvement. It is expected that this empirical result will create value added for
managers and practitioners in exploiting the effectiveness of ISO 9000 implementation.
REFERENCES
[1] Alaa, M.G. and James, S.N. The changing basis of performance measurement.
International Journal of Operations & Production Management, 1996, Vol. 16, No. 8, pp. 63-
80.
[2] Anderson, M. & Sohal, A.S. A study of the relationship between quality management
practices and performance in small businesses. International Journal of Quality and
Reliability Management, 1999, 16 No 9, 859-877.
[3] Benner, M.J. & Veloso, F.M. ISO 9000 practices and financial performance: A
technology coherence perspective. Journal of Operations Management, 2008, 26, 611-629.
[4] Buttle, F, ISO 9000: marketing motivations and benefits. International Journal of Quality
& Reliability Management, 1997, Vol. 14, No. 9, pp. 936-47.
[5] Brown, A., Van der Wiele, T. and Loughton, K. Smaller enterprises’ experiences with
ISO 9000. International Journal of Quality & Reliability Management, 1998, Vol. 15 No. 3,
273-85.
[6] Chin, K.S., Sun, H., Xu, Y. & Hua, H. A comparative study of quality management
practices in Hong Kong and Shanghai manufacturing industries. International Journal of
Management, 2002, 19 No 4, 576-81.
[7] Conca, F., Llopis, F. and Tarí, J. Development of a measure to assess quality management
in certified firms. European Journal of Operational Research, 2004, Vol. 156 No. 3, pp. 683-
97.

[8] Corbett, C.J., Montes-sancho, M.J.& Kirsch, D.A. The financial impact of ISO 9000
certification in the United States: An empirical analysis. Management Science, 2005, 51 No
7, 1046-1059.
[9] Douglas, A., Coleman, S. and Oddy, R. The case for ISO 9000. The TQM Magazine,
2003, Vol. 15 No. 5, pp. 316-24.
[10] Escanciano, C., Fernández, E. and Vasquez, C. ISO 9000 certification và quality
management in Spain: results of a national survey. The TQM Magazine, 2001a, Vol. 13 No.
3, pp. 192-200.
[11] Gotzamani, K. and Tsiotras, G. The true motives behind ISO 9000 certification: their
effect on the overall certification benefits và long term contribution towards TQM.
International Journal of Quality & Reliability Management, 2002, Vol. 19 No. 2, pp. 151-69.
[12] Heras, I., Casadesus, M. & Dick, G. ISO 9000 registration’s impact on sales and
profitability: a longitudinal analysis of performance before and after accreditation.
International Journal of Quality & Reliability Management, 2002, 19, 774-791.
[13] Ismail, M.Y. & Hashmi, M.S.J. The state of quality management in the Irish
manufacturing industry. Total Quality Management, 1999, 10 No 6,853-862.
[14] Kaplan, R.S. and Norton, D.P. The balanced scorecard – measures that drive
performance Harvard Business Review, 1996, Vol. 70, No. 8, pp. 63-80.
[15] Leticia Santos, Carmen Escanciano, "Benefits of the ISO 9000:1994 system: Some
considerations to reinforce competitive advantage", International Journal of Quality &
Reliability Management, 2002, Vol. 19 Iss: 3, pp.321 – 344.
[16] Low Sui Pheng, Darren Wee, "Improving maintenance and reducing building defects
through ISO 9000", Journal of Quality in Maintenance Engineering, 2001, Vol. 7 Iss: 1, pp.6
- 24
[17] Magd, H. and Curry, A. An empirical analysis of management attitudes towards ISO
9001:2000 in Egypt. The TQM Magazine, 2003a, Vol. 15 No. 6, pp. 381-90.
[18] Quazi, H., Hong, C. and Meng, C. Impact of ISO 9000 certification on quality
management practices: a comparative study. Total Quality Management, 2002, Vol. 13 No.
1, pp. 53-67.
[19] Romano, P. “ISO 9000: what is its impact on performance?”, Quality Management
Journal, 2000, Vol. 7 No. 3, pp. 38-56.
[20] Ragothaman, S. and Korte, L. The ISO 9000 international quality registration: an
empirical analysis of implications for business firms. International Journal of Applied Quality
Management, 1999, Vol. 2 No. 1, pp. 59-73.
[21] Sampaio, P., Saraiva, P. and Guimarães Rodrigues, A. ISO 9001 certification research:
questions, answers and approaches. International Journal of Quality & Reliability
Management, 2009, Vol. 26 No. 1, pp. 38-58.
[22] Simmons, B.L. & White, M.A. The relationship between ISO 9000 and business
performance: does registration really matter? Journal of Managerial Issues, 1999, 9 No3,
330- 343.
[24] Sun, H. Total quality management. ISO 9000 certification and performance
improvement. International Journal of Quality & Reliability Management, 2000, Vol. 17 No.
2, pp. 168-79.
[25] Terziovski, M., Samson, D. & Dow, D. The business value of quality management
systems certification: Evidence from Australia and New Zealand. Journal of Operations
Management, 1997, 15, 1-18.
[26] Terziovski, M., Power, D. and Sohal, A. The longitudinal effects of the ISO 9000
certification process on business performance. European Journal of Operational Research,
2003, Vol. 146 No. 3, pp. 580-95.
[27] The ISO Survey of Management System Standard Certifications 1993-2011.