Embed Size (px)
Citation preview

1
In January 2016, NIACE and the Centre for Economic and Social Inclusion merged to form the Learning and Work Institute
Learning and Work Institute Patron: HRH The Princess Royal | Chief Executive: Stephen Evans A company limited by guarantee, registered in England and Wales Registration No. 2603322 Registered Charity No. 1002775 Registered office: 21 De Montfort Street, Leicester, LE1 7GE
Islington Labour Market Study March 2018 Duncan Melville Paul Bivand Lovedeep Vaid
2
CONTENTS
Contents ..................................................................................................................................... 2
Executive Summary .................................................................................................................... 4
key findings ............................................................................................................................ 4
1. Introduction ....................................................................................................................... 6
2. The current situation, with trends over time .................................................................... 6
Self-employment and temporary employment ................................................................. 8
Islington is a net importer of labour .................................................................................. 9
Sector profile of workers ..................................................................................................... 16
Occupational profile of residents ........................................................................................ 18
Business numbers by local unit size ..................................................................................... 23
Business numbers by sector ................................................................................................ 24
Manufacturing ................................................................................................................. 24
Construction ..................................................................................................................... 26
Wholesale Trades ............................................................................................................. 28
Retail Trades .................................................................................................................... 29
Transport, Storage and Communications ........................................................................ 31
Accommodation & food services ..................................................................................... 32
Information and Communication services....................................................................... 34
Finance and insurance ..................................................................................................... 35
Professional, scientific & technical services .................................................................... 37
Business administration & support services .................................................................... 38
Public Administration ....................................................................................................... 40
Education ......................................................................................................................... 41
Health and Social Work .................................................................................................... 43
Arts, entertainment, recreation & other services ........................................................... 44
Indicative salary levels by occupation ................................................................................. 46
Occupational changes within sectors .................................................................................. 47
Employer Skills survey 2015 ................................................................................................. 52
3. Characteristics of Islington workers and residents .......................................................... 58
Labour market status ........................................................................................................... 58
Qualifications ....................................................................................................................... 58
Age and gender .................................................................................................................... 61
Workplace ........................................................................................................................ 61
3
Residents .......................................................................................................................... 63
Employment rates for women ......................................................................................... 65
Male employment rates................................................................................................... 66
Ethnicity, country of birth and nationality ........................................................................... 67
Ethnicity and gender ........................................................................................................ 67
Ethnicity and country of birth .......................................................................................... 68
Ethnicity and nationality .................................................................................................. 70
4. Entry Level demand ......................................................................................................... 76
Job starts in London by occupation group ........................................................................... 77
Job starts in London by qualification level and occupation group ...................................... 80
Discussion......................................................................................................................... 83
5. 19+ learning provision and achievements ....................................................................... 84
Learning provision over time ............................................................................................... 85
Learning provision by type of provider ................................................................................ 86
Learning achievements by level and type of provider ......................................................... 87
City and Islington College ................................................................................................. 87
Private Sector Public Funded providers ........................................................................... 88
Specialist colleges ............................................................................................................ 89
Learning achievements by subject and type of provider .................................................... 90
City and Islington College ................................................................................................. 90
Private Sector Public Funded ........................................................................................... 91
Other Public Funded ........................................................................................................ 92
Specialist Colleges ............................................................................................................ 93
6. Employment and skill projections.................................................................................... 93
Occupation forecasts ....................................................................................................... 94
Sector forecasts ............................................................................................................... 97
Qualification forecasts ................................................................................................... 100
Working age population projections ............................................................................. 102
7. Risks and Opportunities to the Outlook for Islington .................................................... 103
Supply of Business Space ............................................................................................... 103
Transport Infrastructure ................................................................................................ 105
Living Costs / Housing Costs .......................................................................................... 106
Brexit related risks ......................................................................................................... 119
Protectionism ................................................................................................................. 128
4
EXECUTIVE SUMMARY
KEY FINDINGS
• Islington is a fast growing area in employment terms: between 2011 and 2016 the
number of jobs located in the borough rose by 24% compared to 17% for the
Central London area and 15% for London as a whole.
• The employment rate of Islington residents has also risen strongly since 2012 in
line with the trends for Central London and London as a whole.
• Islington experiences a very high level of commuting exchange: nine in ten of its
workers live outside the borough and eight in ten of its employed residents work
outside the borough. This situation is typical in Central London boroughs.
• The largest sector in Islington is Professional, scientific and technical services
which employed 56,000 workers in 2016 and accounted for nearly a quarter of
jobs located in the borough. Other significant sectors are Information and
Communication and Business administration and support services. Together
these three broad sectors accounted for half of the jobs in Islington in 2016.
• Around 70% of Islington’s employed residents work in managerial, professional or
associate professional occupations.
• The proportion of Islington residents holding qualifications at Level 4 or above
(e.g. HNDs, Foundation degrees and above) has increased from 38% in 2004 to
56% in 2016. Over the same period the proportion with low level qualifications
below Level 2 (e.g. GCSEs), including those with no qualifications, has fallen.
• Around half of Islington’s residents of working age are white and UK born / UK
nationals. The other half are roughly equally divided between white people born
outside of the UK / non-UK nationals, BAME individuals born in the UK / UK
nationals and BAME individuals people born outside of the UK / non-UK
nationals. The percentage of BAME individuals of working age in employment
regardless of their nationality or place of birth is significantly lower than for white
people again regardless of their nationality or place of birth.
• Data from the 2011 Census allows us to look at labour market outcomes in
Islington by ethnicity in more details even though this information is now
somewhat dated. It indicates that white people had the most favourable labour
market outcomes of all ethnic groups. Amongst BAME groups, those of Indian
ethnicity generally had the most favourable outcomes. The ethnic groups with the
poorest labour market outcomes in 2011 were: Pakistanis, Bangladeshis, Black
Africans, those of Other Black Ethnicity, Arabs and people of Any Other Ethnicity
not covered by the ethnic groups specified.
• Amongst middle and lower level occupations the occupations with the highest
levels of job starts in London were Sales assistants and cashiers, and Other
5
elementary service occupations (which includes kitchen and catering assistants,
waiters and waitresses, and bar staff). Other middle and lower level occupations
with relatively substantial numbers of job starts were: childcare and related
occupations, and caring personal service occupations.
• Highly qualified individuals with qualifications at Level 4 and above dominate
recruitment in London even to elementary occupations which are classified as
elementary because they do not need formal qualifications for their performance.
The levels of recruitment to jobs for people with qualifications below Level 2,
including those with no qualifications is very low in London outside of elementary
occupations.
• The patterns of projected job opportunities in Islington and Central London more
widely between 2016 and 2024 taking account of both expansion and
replacement demand are very similar. Given the very large degree of commuting
exchange, the pattern for Central London is more relevant for Islington residents,
although they will face competition from the residents of other London boroughs
and in commuters to London in this wider labour market. The job opportunities
that are expected to arise will very largely be in managerial and professional
occupations to a lesser extent in associate professional occupations. Given this
expected pattern of occupational change it is not surprising that the requirement
for workers by qualification is almost entirely at Level 4 and above.
• Brexit is a downside risk for the employment outlook of Islington and London
more generally.
• EEA (EU plus Norway, Iceland and Liechtenstein) migrants in London are
disproportionately employed in skilled trades and elementary occupations and in
terms of sectors are disproportionately employed in construction and in
accommodation and food services. If greater restrictions are placed on the entry
to the UK of EEA nationals after Brexit then will this create opportunities for
existing UK resident workers, including those in Islington? The likely answer is no
or only to a very modest extent. Research on migration has shown little evidence
of migrants displacing UK born workers from employment. Any effects that have
been found have been temporary and dissipate once the labour market has
adjusted. While there is much focus on the labour supply impact of migrants in
political debate, migrants also create additional demand for labour via their
spending as consumers within the UK in the same way as UK born workers do.
So, the impact of migration on the employment prospects of workers already
resident in the UK depends on the balance of these the labour demand and
labour supply effects. As research has not suggested that increasing numbers of
migrants have adversely affected the employment prospects of existing UK
workers it is unlikely that fewer migrants will enhance their employment
prospects. The one exception could be construction if demand is increased in the
sector by formation an increase in housebuilding to address the under supply of
housing in London and the UK more widely.
6
1. INTRODUCTION
The overall purpose of this study is to set out the features of the labour market in
Islington, central / inner London and London as a whole. The outputs of this study
will form the evidence base for Islington’s Employment and Skills Strategy. In
addition to this report the outputs from this study include a PowerPoint slide
presentation highlighting the study’s main findings and a comprehensive
spreadsheet with all the data used in this study.
This report includes:
• A consideration of the current labour market situation and recent trends in Islington, central London and comparator areas
• An analysis of the characteristics of Islington’s residents and workers by qualification level, age, gender and ethnicity
• An assessment of job starts by occupation and qualification level
• The patterns of adult education provision in Islington and areas accessible to Islington residents
• Projections of employment and skills levels
• Assessments of some risks which could have adverse impacts on employment growth in Islington
2. THE CURRENT SITUATION, WITH
TRENDS OVER TIME
Over the period 2011-2016, Figure 1 shows that total employment in Islington
expanded by 24%, substantially higher than the average growth rates for the Central
London1 area (17%), and for London (15%) as a whole.
1 Note: Central London includes Camden, City of London, Hackney, Haringey, Kensington and Chelsea, Lambeth, Lewisham, Southwark, Tower Hamlets, Wandsworth, and Westminster as well as Islington

7
Figure 1: Employment growth in Islington and comparator areas, 2011-16
Source: ONS, Business Register and Employment Survey
The employment rate (the proportion of working age residents who are employed)
has risen substantially over the last five years. In the year to June 2011, 67.4% of
Islington working age residents were in paid work. In the year to September 2017,
this had risen to 75.1%, an improvement of 7.7 percentage points. This rise was
greater than that for England (4. percentage points) and similar (but higher) than that
for London (6.4 percentage points) and Central London (7.5 percentage points).
However, the substantial rise in the employment rate in Islington in the latest figure
(as well as earlier lower changes than for Central London and London) will be
affected by survey variations.

8
Figure 2: Employment rate changes in Islington and comparator areas
Self-employment and temporary employment
Four fifths (81%) of employed Islington residents are employees. This includes those
who are temporary employees. Virtually all of the remainder are self-employed –
18.0% of employment. The 1% gap is made up of government employment and
training programmes and unpaid family workers. About 6% of employment is in ‘non-
permanent employment that is not self-employment. This includes people who are
employment agency temporary workers, holiday or term-time workers and casual
workers. Since the recession both self-employment and temporary employment have
grown marginally as a proportion of total employment.
Generally, in Central London, and so far as we can tell from the Borough level
figures, Islington shares this pattern, there has been substantial growth in
employment that has been broadly shared between permanent employee status,
temporary employee status and self-employment. Self-employment has grown as a
share of total employment since 2004 by just under 2 percentage points. While the
temporary employment share grew with the recession by around 0.5% of total
employment and then slipped back. The latest figure is, however, quite high at 6.8%
of total employment in Central London (in the year to September 2017).
Looking at self-employment and at non-permanent work in the Central London area
by occupation gives an indication of the types of jobs involved. There is a caveat to
that in the sense that people who consider themselves to be running a business may
respond to surveys in a way that categorises themselves as managerial staff,
9
regardless of what business they are in. We are using Central London in this case
because the figures for Islington are based on extremely small samples and are not
sufficiently robust.
42% of Central London skilled trades workers are self-employed. Given the
prevalence of self-employment in construction trades, this is not a surprise. 43% of
Central London process, plant & machine operatives are self-employed. This
includes taxi drivers, hire car drivers and a number of groups within that (such as
Uber, Addison Lee) whose employment status has been challenged and where
employers may be using self-employment as a way of avoiding some of their
obligations such as the requirement to pay minimum wage rates, and holiday and
sickness pay. 19% of associate professional workers are self-employed. This
includes a lot of jobs where the term ‘freelance’ is frequently used.15% of Managers
and Directors are self-employed. The next largest group in Central London is 14% of
elementary occupations being self-employed. This includes cycle couriers and a
range of other occupations, where again there are concerns about the genuineness
of some self-employment. 13% of professional workers are self-employed.
In terms of the profile of the self-employed, 26% of Central London self-employed
workers are associate professionals (freelance as discussed above, but may include
graphic design workers etc. who may expand businesses), and 24% are
professionals. 16% of central London self-employed are in skilled trades, while 14%
are managers – where the caveat about business owners applies.
Looking at temporary workers, the largest group in Central London is caring, leisure
and other service occupations (12% of workers in that group), where it is known that
working through agencies is common. The next largest group is elementary
occupations where 10% of jobs are temporary in some way.
In terms of the profile of temporary workers, the largest group is professional workers
accounting for 28% of all temporary workers, followed by associate professionals
who are 18% of temporary workers. The professional group will include supply
teachers, agency nurses, locum doctors and similar in other professions.
Administrative and clerical workers constitute 15% of temporary workers, followed by
12% being care workers and also elementary workers.
Islington is a net importer of labour
Islington is a net importer of labour from a wide catchment area across London and
the South East. At a basic level, this reflects the fact that the borough provides a
greater number of workplace jobs than it does resident working-age employees.
Taken together, it means that the borough has a jobs density2 of 1.46, the fourth
2 The numbers of jobs per resident of working age (16-59/64). A job density of 1.0 would mean that there is one job per resident of working age.
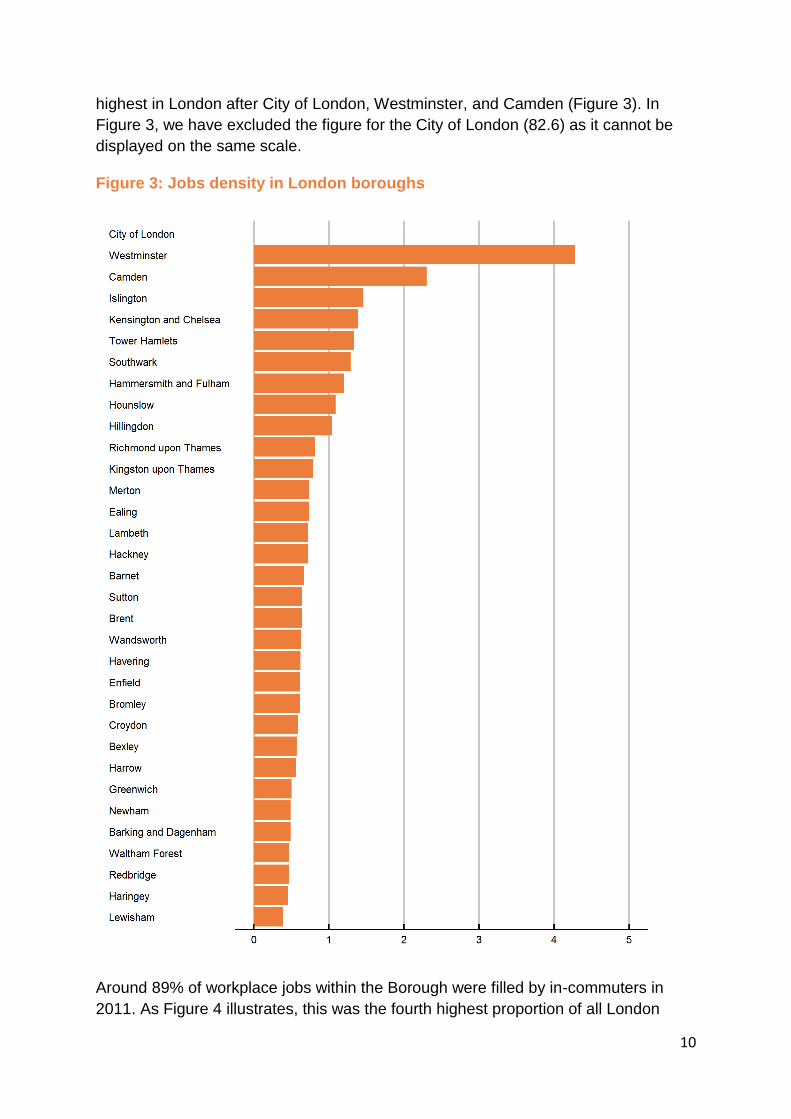
10
highest in London after City of London, Westminster, and Camden (Figure 3). In
Figure 3, we have excluded the figure for the City of London (82.6) as it cannot be
displayed on the same scale.
Figure 3: Jobs density in London boroughs
Around 89% of workplace jobs within the Borough were filled by in-commuters in
2011. As Figure 4 illustrates, this was the fourth highest proportion of all London

11
boroughs, and higher than the London average of 67%. It was however broadly
comparable to other city fringe boroughs such as Camden.
Figure 4: Proportion of Workplace Jobs filled by In-commuters
The largest sources of in-commuters to Islington include Hackney (8% of
commuters), Haringey (7%), Barnet (4%), Camden (4%), Enfield (4%) and Lambeth
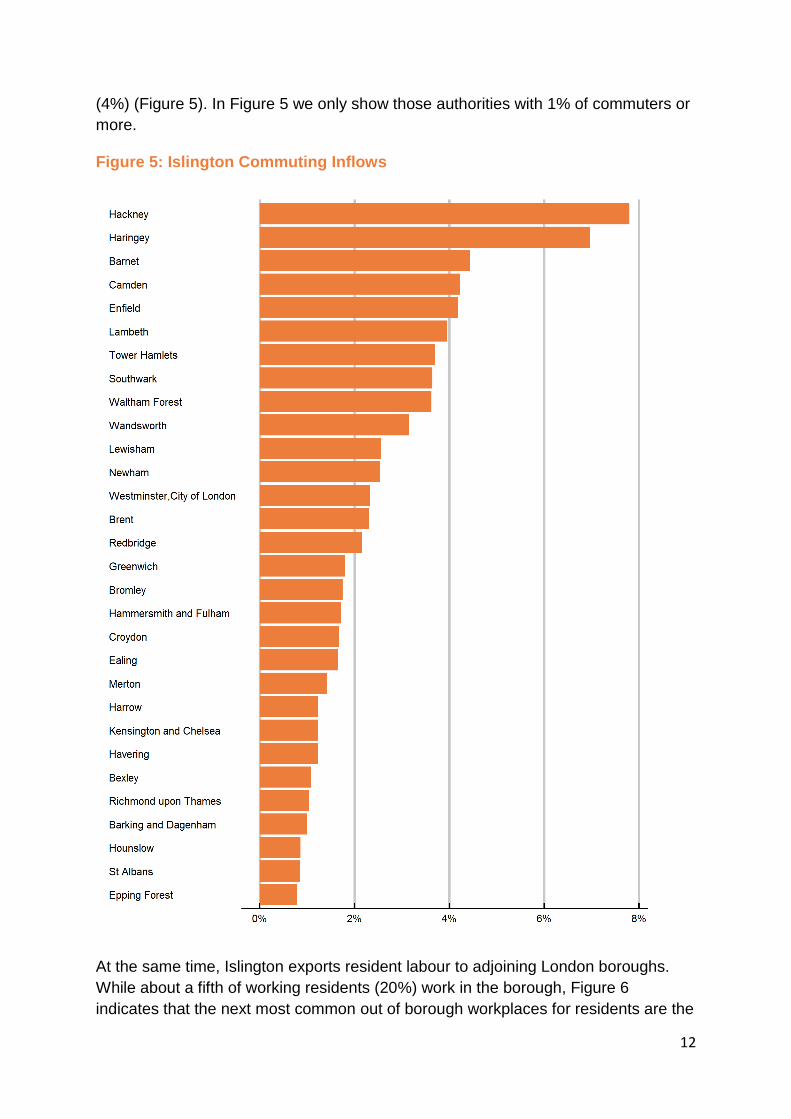
12
(4%) (Figure 5). In Figure 5 we only show those authorities with 1% of commuters or
more.
Figure 5: Islington Commuting Inflows
At the same time, Islington exports resident labour to adjoining London boroughs.
While about a fifth of working residents (20%) work in the borough, Figure 6
indicates that the next most common out of borough workplaces for residents are the
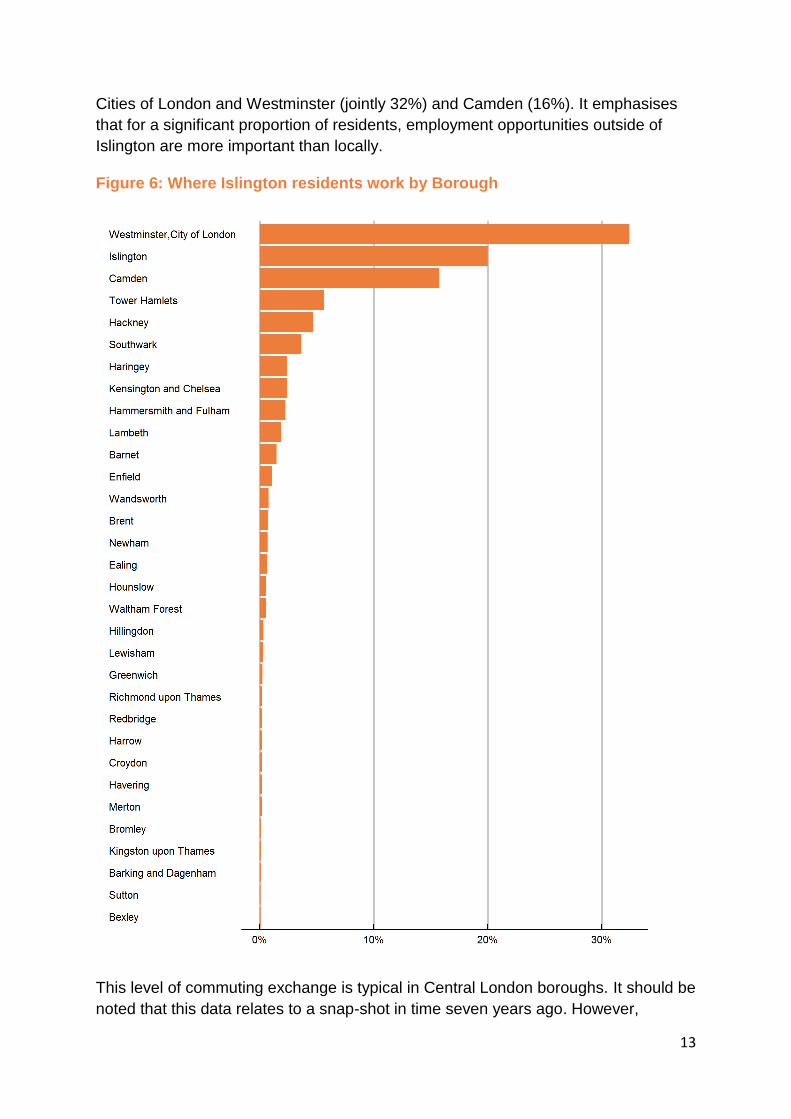
13
Cities of London and Westminster (jointly 32%) and Camden (16%). It emphasises
that for a significant proportion of residents, employment opportunities outside of
Islington are more important than locally.
Figure 6: Where Islington residents work by Borough
This level of commuting exchange is typical in Central London boroughs. It should be
noted that this data relates to a snap-shot in time seven years ago. However,
14
patterns of commuting in previous censuses were broadly similar. Therefore, an
assumption that similar patterns are still relevant would not be unrealistic. The
significant point of this analysis is that the skill and employment needs of residents is
separate from the skill and employment needs of Islington businesses. Islington
residents will seek and get employment across central London and beyond, and
Islington employers will recruit from a wider catchment area than the Borough.
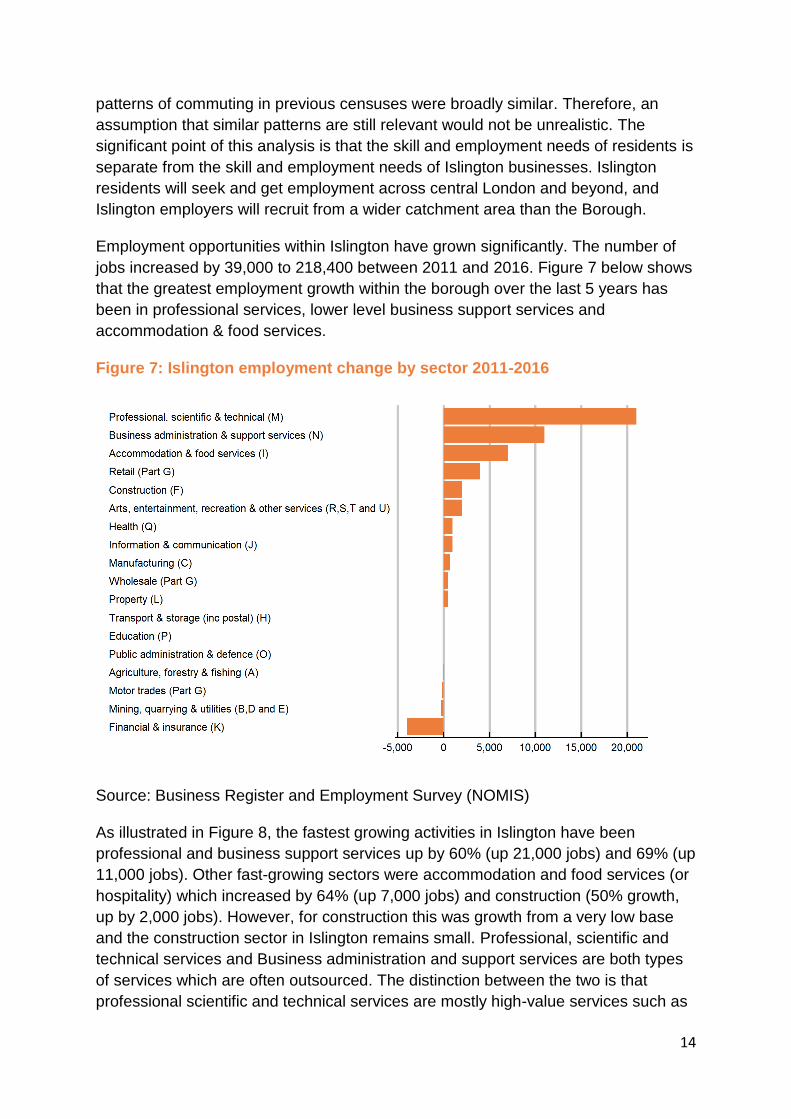
Employment opportunities within Islington have grown significantly. The number of
jobs increased by 39,000 to 218,400 between 2011 and 2016. Figure 7 below shows
that the greatest employment growth within the borough over the last 5 years has
been in professional services, lower level business support services and
accommodation & food services.
Figure 7: Islington employment change by sector 2011-2016
Source: Business Register and Employment Survey (NOMIS)
As illustrated in Figure 8, the fastest growing activities in Islington have been
professional and business support services up by 60% (up 21,000 jobs) and 69% (up
11,000 jobs). Other fast-growing sectors were accommodation and food services (or
hospitality) which increased by 64% (up 7,000 jobs) and construction (50% growth,
up by 2,000 jobs). However, for construction this was growth from a very low base
and the construction sector in Islington remains small. Professional, scientific and
technical services and Business administration and support services are both types
of services which are often outsourced. The distinction between the two is that
professional scientific and technical services are mostly high-value services such as
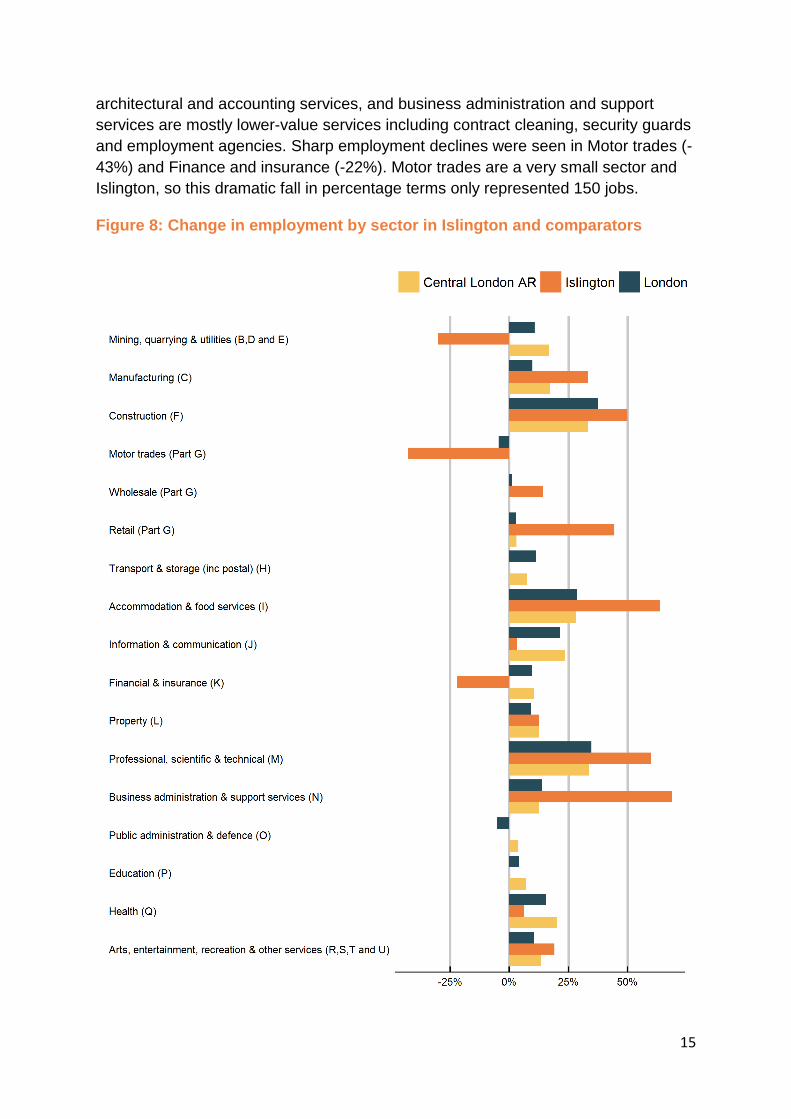
15
architectural and accounting services, and business administration and support
services are mostly lower-value services including contract cleaning, security guards
and employment agencies. Sharp employment declines were seen in Motor trades (-
43%) and Finance and insurance (-22%). Motor trades are a very small sector and
Islington, so this dramatic fall in percentage terms only represented 150 jobs.
Figure 8: Change in employment by sector in Islington and comparators
16
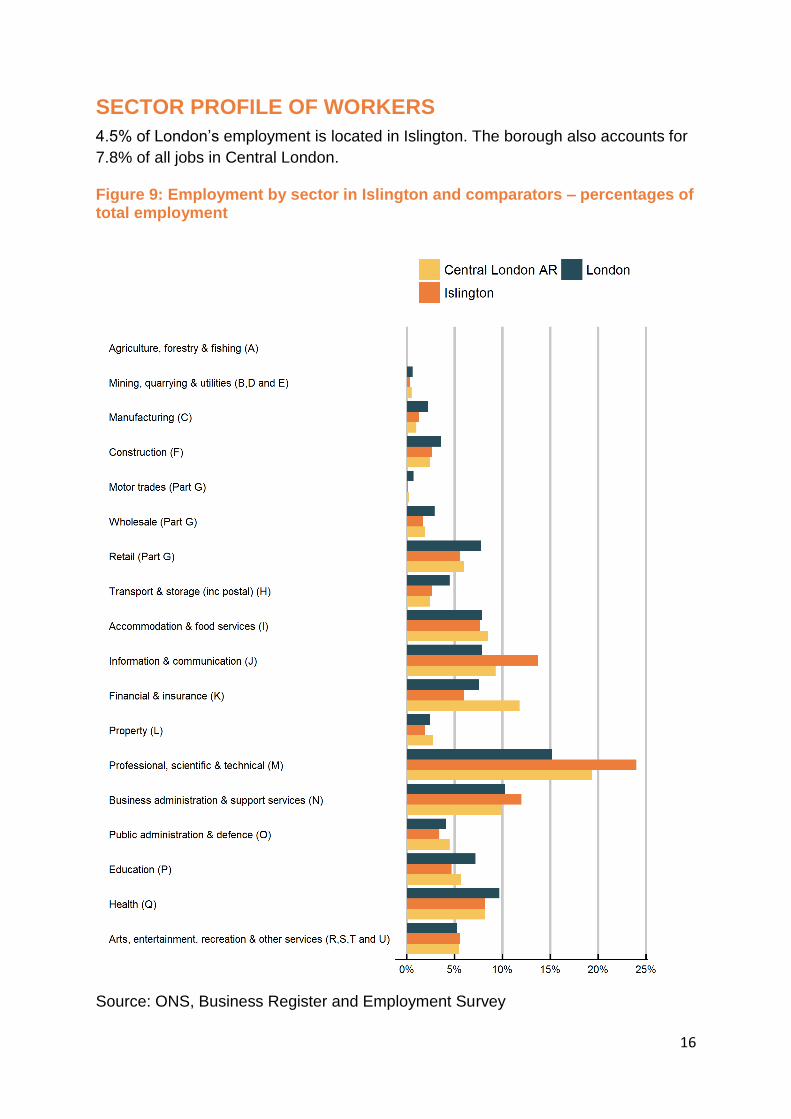
SECTOR PROFILE OF WORKERS
4.5% of London’s employment is located in Islington. The borough also accounts for
7.8% of all jobs in Central London.
Figure 9: Employment by sector in Islington and comparators – percentages of total employment
Source: ONS, Business Register and Employment Survey
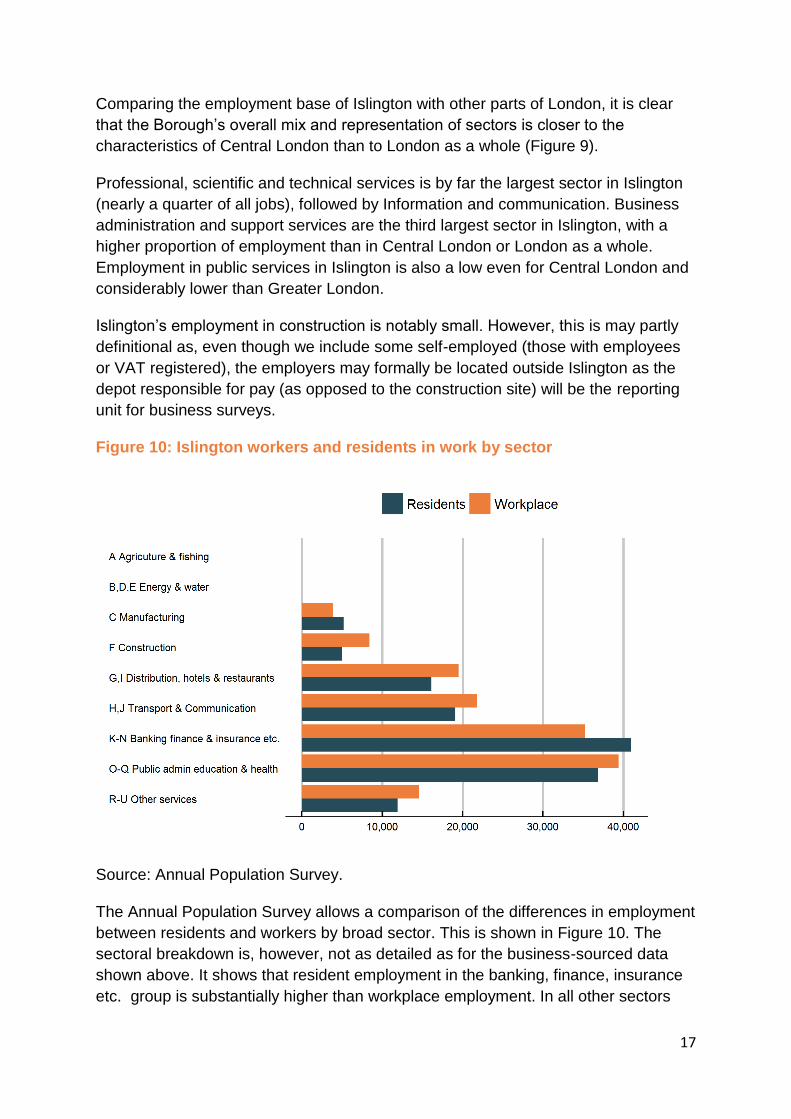
17
Comparing the employment base of Islington with other parts of London, it is clear
that the Borough’s overall mix and representation of sectors is closer to the
characteristics of Central London than to London as a whole (Figure 9).
Professional, scientific and technical services is by far the largest sector in Islington
(nearly a quarter of all jobs), followed by Information and communication. Business
administration and support services are the third largest sector in Islington, with a
higher proportion of employment than in Central London or London as a whole.
Employment in public services in Islington is also a low even for Central London and
considerably lower than Greater London.
Islington’s employment in construction is notably small. However, this is may partly
definitional as, even though we include some self-employed (those with employees
or VAT registered), the employers may formally be located outside Islington as the
depot responsible for pay (as opposed to the construction site) will be the reporting
unit for business surveys.
Figure 10: Islington workers and residents in work by sector
Source: Annual Population Survey.
The Annual Population Survey allows a comparison of the differences in employment
between residents and workers by broad sector. This is shown in Figure 10. The
sectoral breakdown is, however, not as detailed as for the business-sourced data
shown above. It shows that resident employment in the banking, finance, insurance
etc. group is substantially higher than workplace employment. In all other sectors
18
(except manufacturing) the reverse applies. The banking, finance etc. group includes
finance and insurance; property; professional, scientific and technical services and
business administration and support services. In the case of manufacturing in
particular it should be emphasised that a sectoral classification covers the business
as a whole – so the headquarters of a company whose main business is
manufacturing will be included in manufacturing even though no manufacturing takes
place on site. The same applies to mining which has a significant central London
headquarters profile.
OCCUPATIONAL PROFILE OF RESIDENTS
Figure 11 shows the occupational profile of Islington residents for both the latest
(2017) information and for 2012. These are presented as percentages of total
employment.
More than 70% of working residents (70.5%) are employed (as either employees or
self-employed) as managers, professionals or associate professionals. This
proportion has remained relatively static since 2012. The largest changes since 2012
are a growth of nearly 9,000 each in Corporate Managers and Directors, followed by
4,700 in Science, research, engineering and technology professionals. As well as
science based and engineering professionals, this group includes information
technology professionals, and professional social scientists such as economists and
social researchers. These were followed by a rise of 3,200 in health professionals
(including nurses) and of 3,100 in caring personal services occupations - an 82%
rise since 2012.
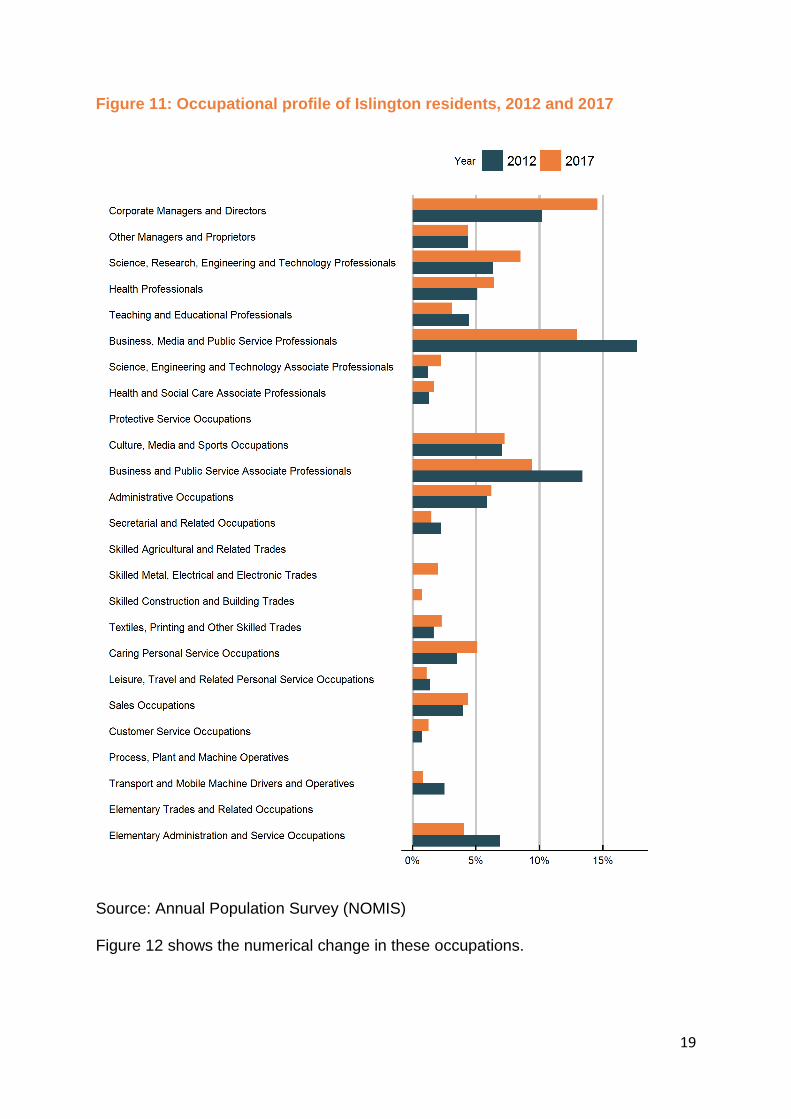
19
Figure 11: Occupational profile of Islington residents, 2012 and 2017
Source: Annual Population Survey (NOMIS)
Figure 12 shows the numerical change in these occupations.

20
Figure 12: Changes in the numbers of Islington residents employed by occupation
Source: Annual Population Survey (NOMIS)
21
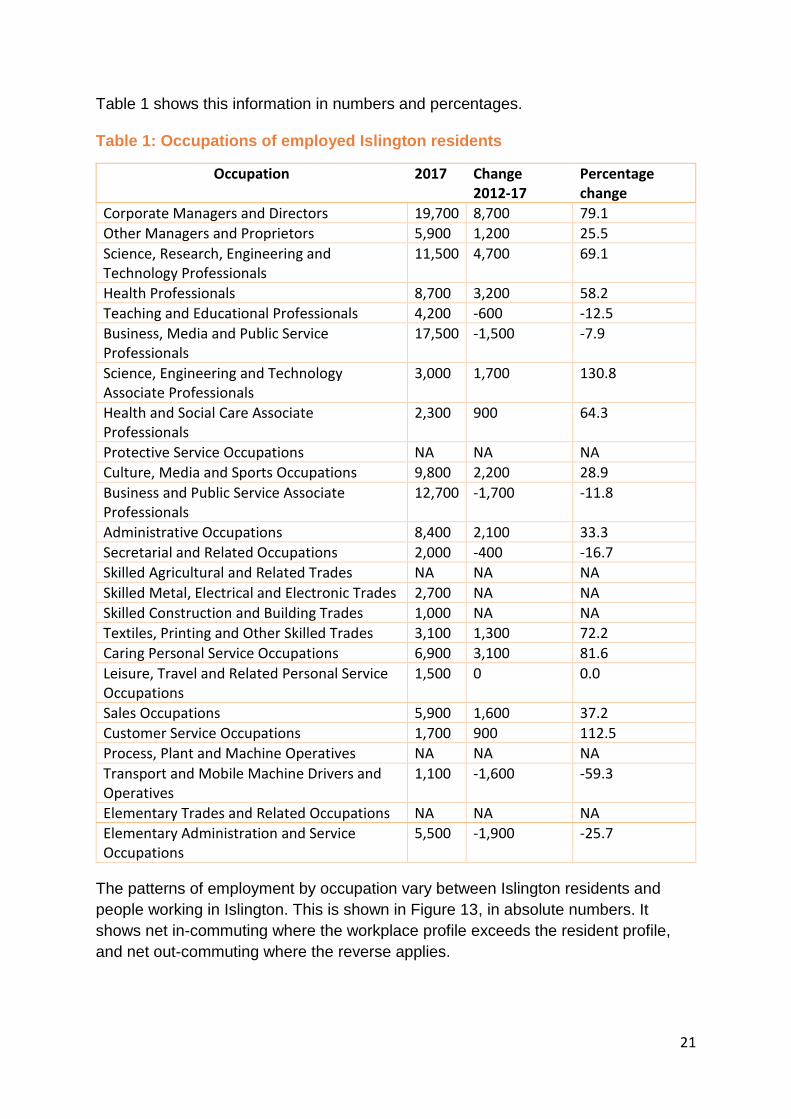
Table 1 shows this information in numbers and percentages.
Table 1: Occupations of employed Islington residents
Occupation 2017 Change 2012-17
Percentage change
Corporate Managers and Directors 19,700 8,700 79.1
Other Managers and Proprietors 5,900 1,200 25.5
Science, Research, Engineering and Technology Professionals
11,500 4,700 69.1
Health Professionals 8,700 3,200 58.2
Teaching and Educational Professionals 4,200 -600 -12.5
Business, Media and Public Service Professionals
17,500 -1,500 -7.9
Science, Engineering and Technology Associate Professionals
3,000 1,700 130.8
Health and Social Care Associate Professionals
2,300 900 64.3
Protective Service Occupations NA NA NA
Culture, Media and Sports Occupations 9,800 2,200 28.9
Business and Public Service Associate Professionals
12,700 -1,700 -11.8
Administrative Occupations 8,400 2,100 33.3
Secretarial and Related Occupations 2,000 -400 -16.7
Skilled Agricultural and Related Trades NA NA NA
Skilled Metal, Electrical and Electronic Trades 2,700 NA NA
Skilled Construction and Building Trades 1,000 NA NA
Textiles, Printing and Other Skilled Trades 3,100 1,300 72.2
Caring Personal Service Occupations 6,900 3,100 81.6
Leisure, Travel and Related Personal Service Occupations
1,500 0 0.0
Sales Occupations 5,900 1,600 37.2
Customer Service Occupations 1,700 900 112.5
Process, Plant and Machine Operatives NA NA NA
Transport and Mobile Machine Drivers and Operatives
1,100 -1,600 -59.3
Elementary Trades and Related Occupations NA NA NA
Elementary Administration and Service Occupations
5,500 -1,900 -25.7
The patterns of employment by occupation vary between Islington residents and
people working in Islington. This is shown in Figure 13, in absolute numbers. It
shows net in-commuting where the workplace profile exceeds the resident profile,
and net out-commuting where the reverse applies.
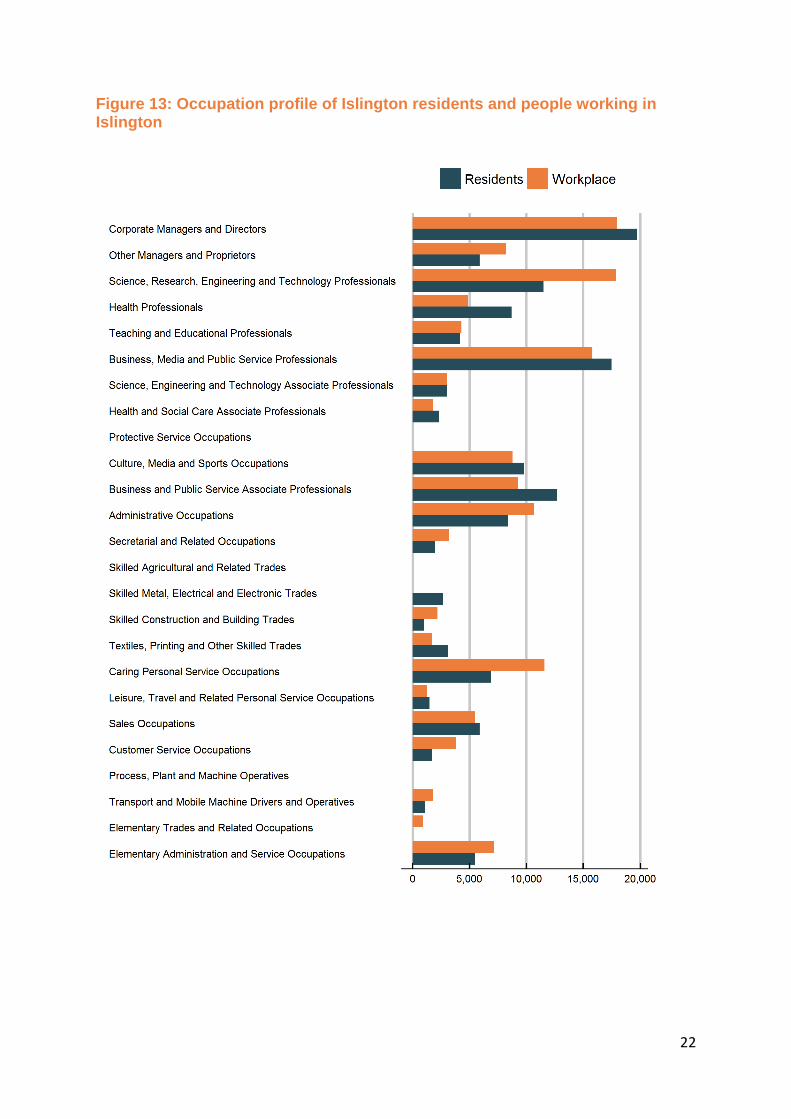
22
Figure 13: Occupation profile of Islington residents and people working in Islington
23
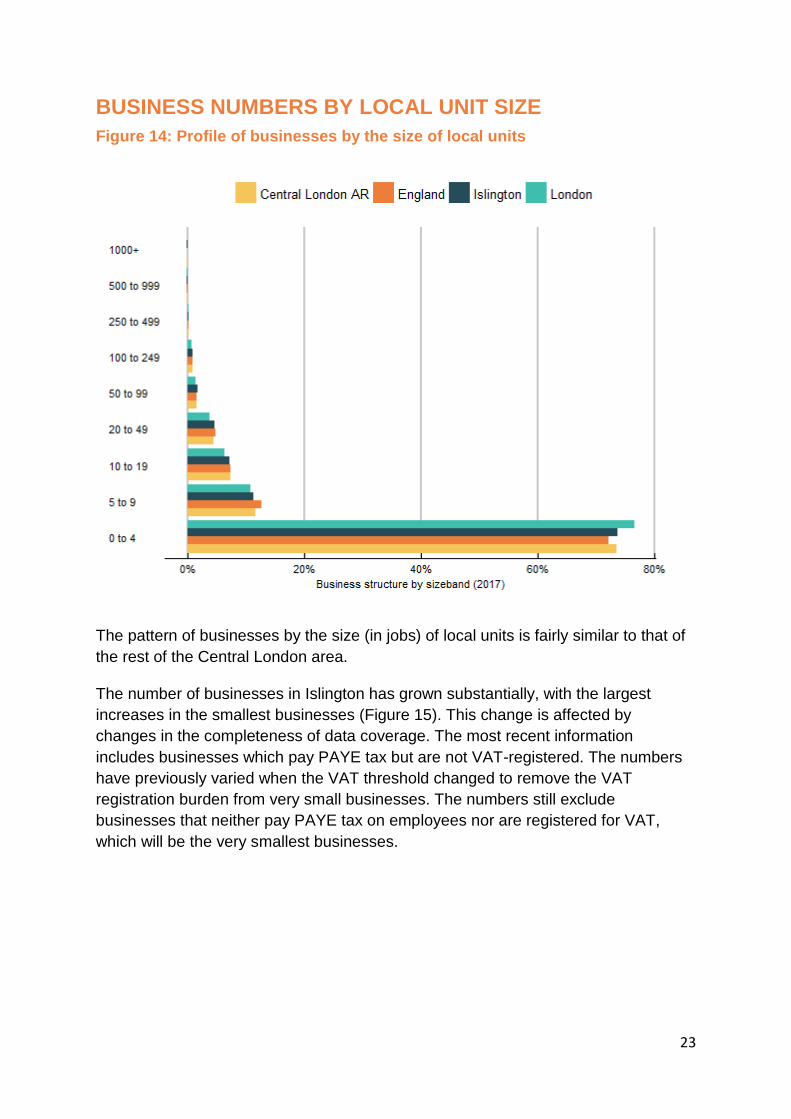
BUSINESS NUMBERS BY LOCAL UNIT SIZE
Figure 14: Profile of businesses by the size of local units
The pattern of businesses by the size (in jobs) of local units is fairly similar to that of
the rest of the Central London area.
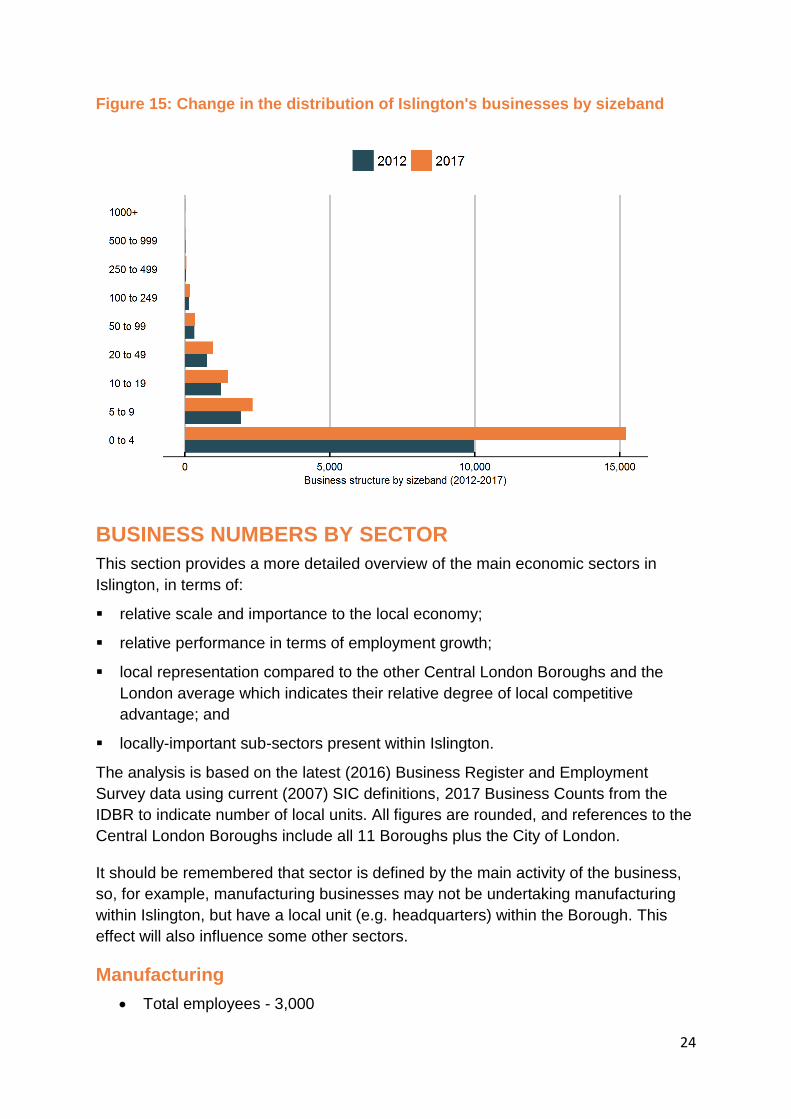
The number of businesses in Islington has grown substantially, with the largest
increases in the smallest businesses (Figure 15). This change is affected by
changes in the completeness of data coverage. The most recent information
includes businesses which pay PAYE tax but are not VAT-registered. The numbers
have previously varied when the VAT threshold changed to remove the VAT
registration burden from very small businesses. The numbers still exclude
businesses that neither pay PAYE tax on employees nor are registered for VAT,
which will be the very smallest businesses.
24
Figure 15: Change in the distribution of Islington's businesses by sizeband
BUSINESS NUMBERS BY SECTOR
This section provides a more detailed overview of the main economic sectors in
Islington, in terms of:
▪ relative scale and importance to the local economy;
▪ relative performance in terms of employment growth;
▪ local representation compared to the other Central London Boroughs and the
London average which indicates their relative degree of local competitive
advantage; and
▪ locally-important sub-sectors present within Islington.
The analysis is based on the latest (2016) Business Register and Employment
Survey data using current (2007) SIC definitions, 2017 Business Counts from the
IDBR to indicate number of local units. All figures are rounded, and references to the
Central London Boroughs include all 11 Boroughs plus the City of London.
It should be remembered that sector is defined by the main activity of the business,
so, for example, manufacturing businesses may not be undertaking manufacturing
within Islington, but have a local unit (e.g. headquarters) within the Borough. This
effect will also influence some other sectors.
Manufacturing
• Total employees - 3,000

25
• Proportion of total employment - 1.3%
• Change in employment - 750
• Number of businesses (IDBR local units) – 510
The manufacturing sector accounts for 1.3% of total employment in Islington,
supporting about 3,000 jobs and 510 enterprises.
Figure 16: Manufacturing by Borough: Central London
Source: BRES/Business demography/Learning & Work analysis
Note that the manufacturing sector includes local units whose main business is
manufacturing rather than necessarily manufacturing within Islington.
Islington’s manufacturing share is a little higher than the Central London boroughs as
a whole but lower than that for London. Haringey and to a lesser extent Hackney
have larger shares of employment in manufacturing firms.
26
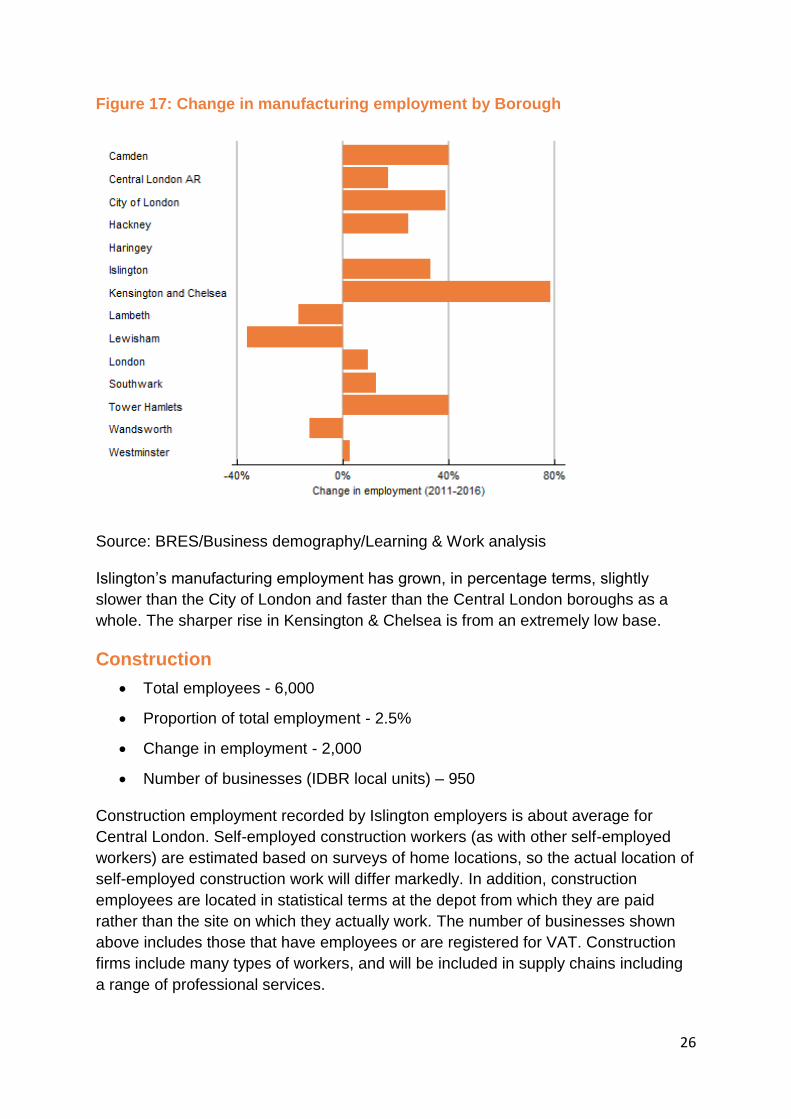
Figure 17: Change in manufacturing employment by Borough
Source: BRES/Business demography/Learning & Work analysis
Islington’s manufacturing employment has grown, in percentage terms, slightly
slower than the City of London and faster than the Central London boroughs as a
whole. The sharper rise in Kensington & Chelsea is from an extremely low base.
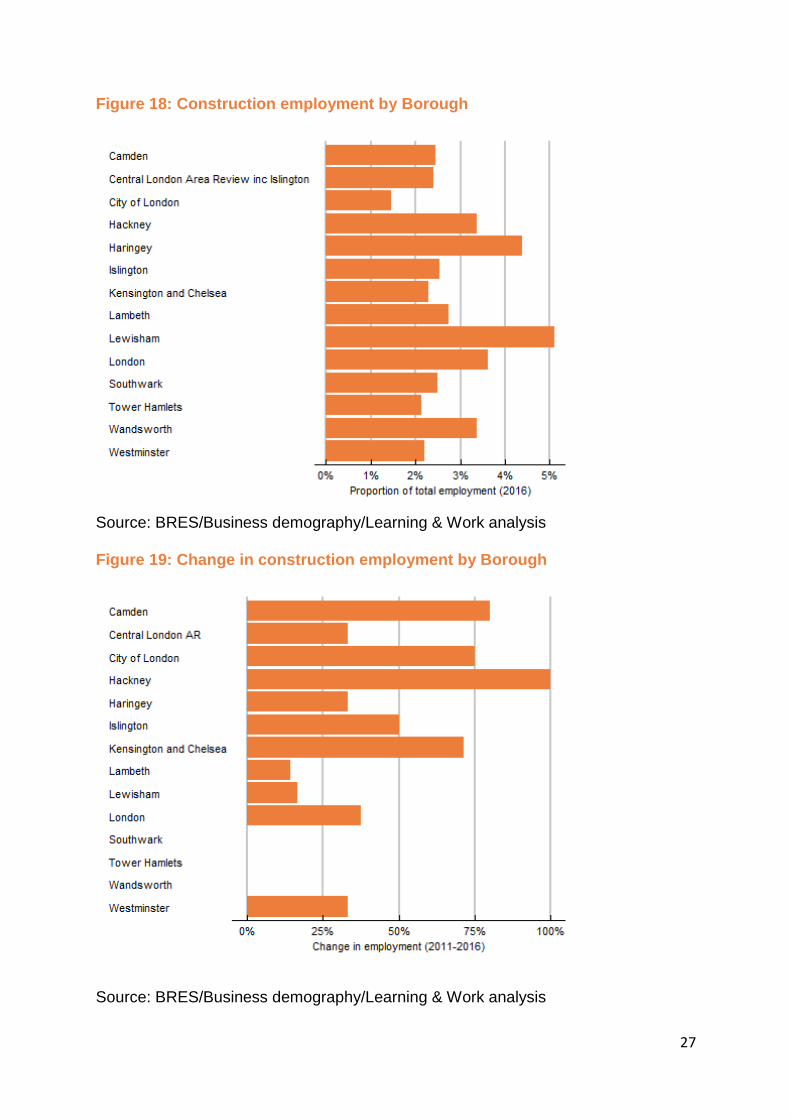
Construction
• Total employees - 6,000
• Proportion of total employment - 2.5%
• Change in employment - 2,000
• Number of businesses (IDBR local units) – 950
Construction employment recorded by Islington employers is about average for
Central London. Self-employed construction workers (as with other self-employed
workers) are estimated based on surveys of home locations, so the actual location of
self-employed construction work will differ markedly. In addition, construction
employees are located in statistical terms at the depot from which they are paid
rather than the site on which they actually work. The number of businesses shown
above includes those that have employees or are registered for VAT. Construction
firms include many types of workers, and will be included in supply chains including
a range of professional services.
27
Figure 18: Construction employment by Borough
Source: BRES/Business demography/Learning & Work analysis
Figure 19: Change in construction employment by Borough
Source: BRES/Business demography/Learning & Work analysis

28
Wholesale Trades
• Total employees - 4,000
• Proportion of total employment - 1.7%
• Change in employment – 500
• Number of businesses (IDBR local units) – 640
Wholesale businesses or local units are not an Islington speciality. Employment is in
line with the Central London average.
Figure 20: Wholesale employment in London Boroughs
Source: BRES/Business demography/Learning & Work analysis

29
Figure 21: Change in wholesale employment, Boroughs
Source: BRES/Business demography/Learning & Work analysis
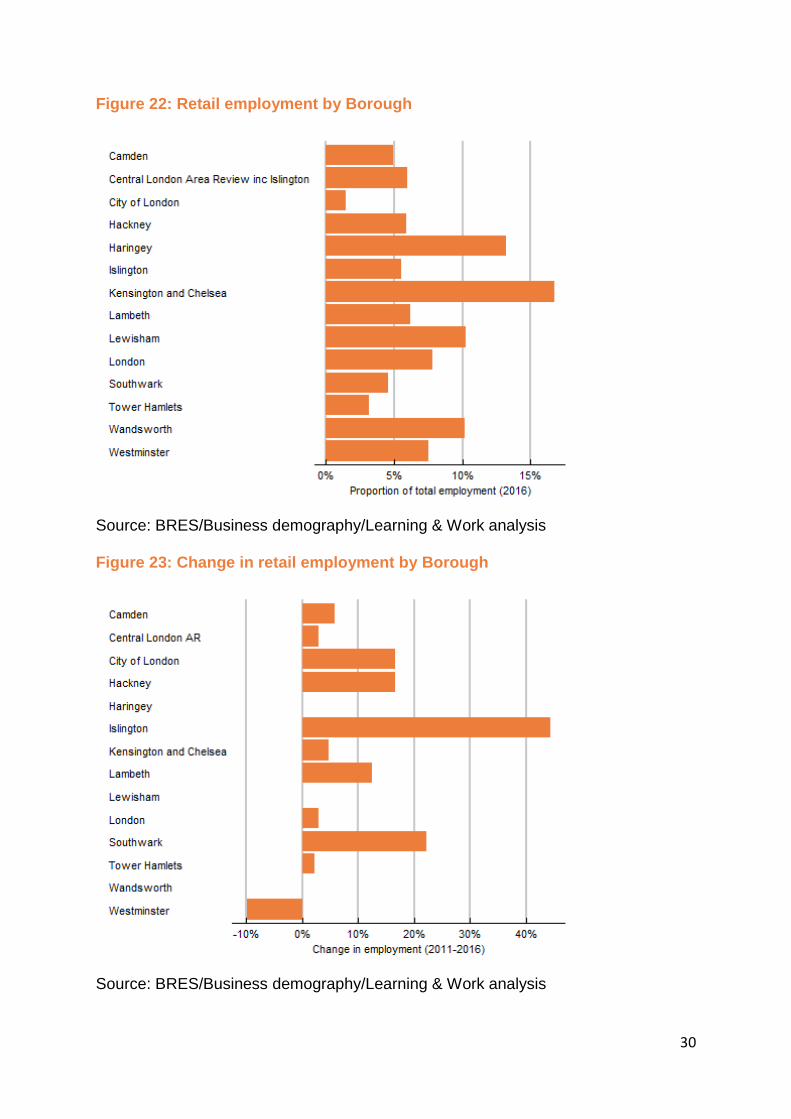
Retail Trades
• Total employees - 13,000
• Proportion of total employment - 5.5%
• Change in employment - 4,000
• Number of businesses (IDBR local units) - 1,420
Islington’s retail businesses employ a share of Islington’s employment roughly in line
with the Central London average, but below that for London as a whole. The
proportion is far below that in Kensington and Chelsea, Haringey, Lewisham and
Wandsworth. However, over the last five years the number employed has shown the
largest growth in any Central London borough.
30
Figure 22: Retail employment by Borough
Source: BRES/Business demography/Learning & Work analysis
Figure 23: Change in retail employment by Borough
Source: BRES/Business demography/Learning & Work analysis
31
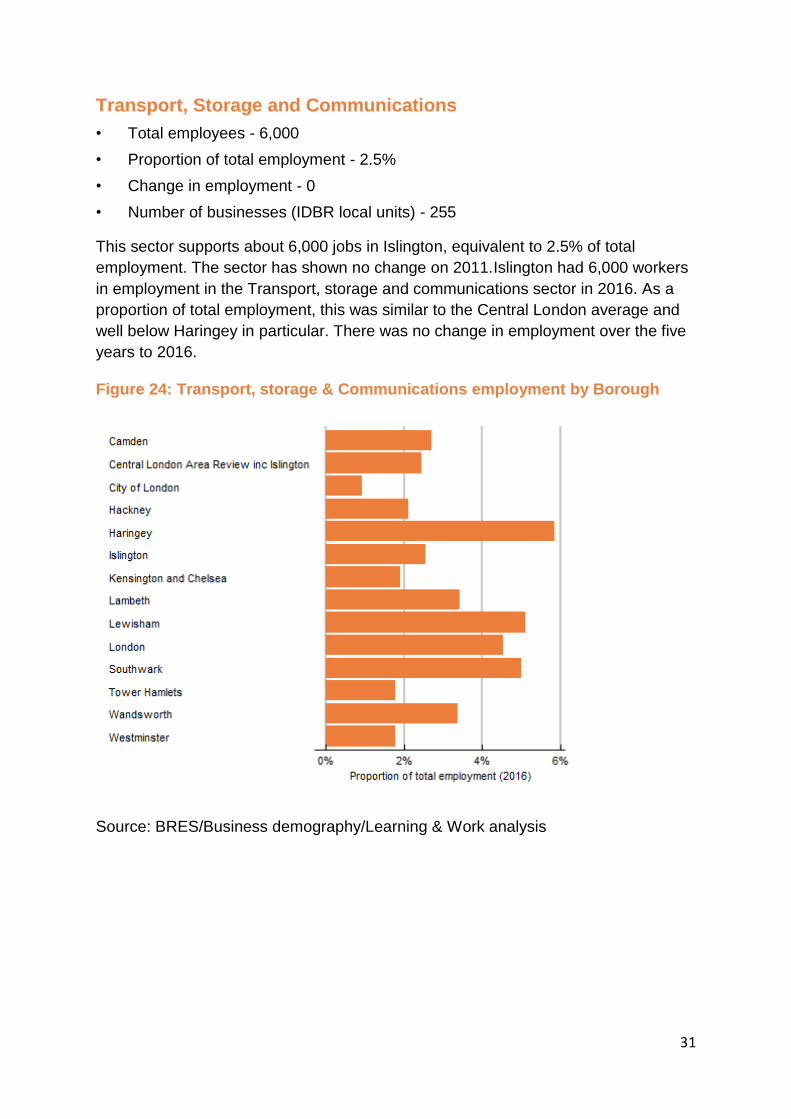
Transport, Storage and Communications
• Total employees - 6,000
• Proportion of total employment - 2.5%
• Change in employment - 0
• Number of businesses (IDBR local units) - 255
This sector supports about 6,000 jobs in Islington, equivalent to 2.5% of total
employment. The sector has shown no change on 2011.Islington had 6,000 workers
in employment in the Transport, storage and communications sector in 2016. As a
proportion of total employment, this was similar to the Central London average and
well below Haringey in particular. There was no change in employment over the five
years to 2016.
Figure 24: Transport, storage & Communications employment by Borough
Source: BRES/Business demography/Learning & Work analysis
32
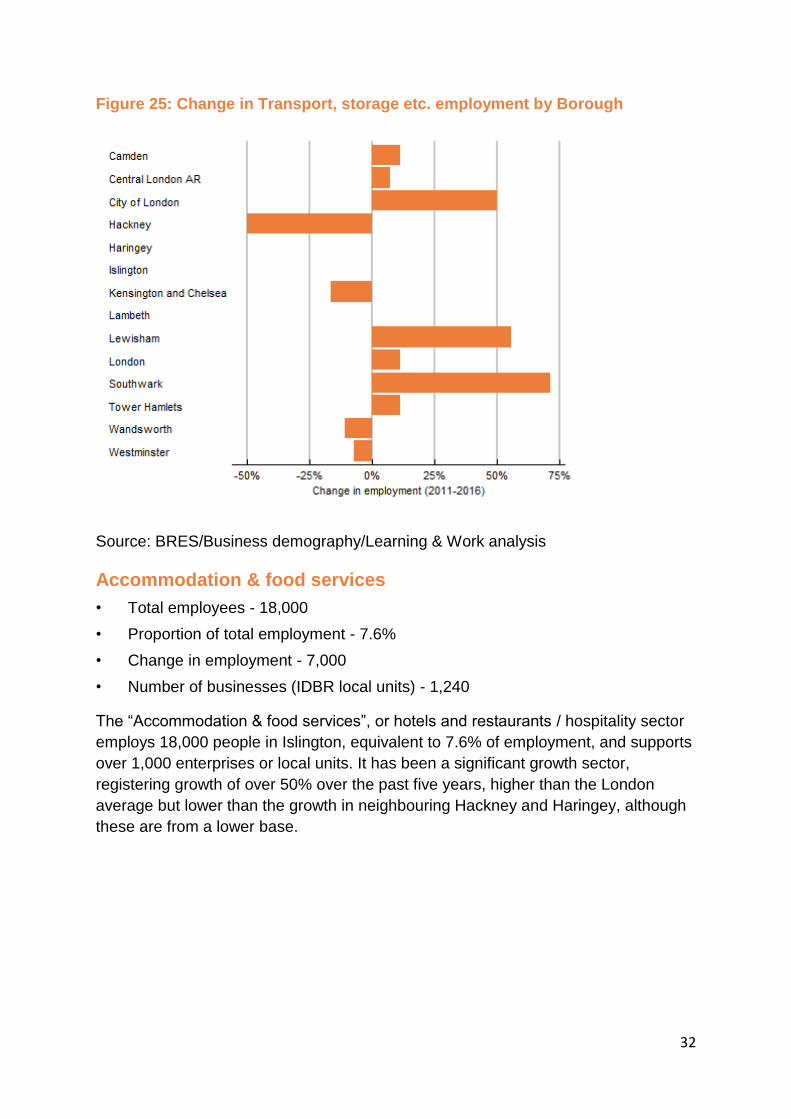
Figure 25: Change in Transport, storage etc. employment by Borough
Source: BRES/Business demography/Learning & Work analysis
Accommodation & food services
• Total employees - 18,000
• Proportion of total employment - 7.6%
• Change in employment - 7,000
• Number of businesses (IDBR local units) - 1,240
The “Accommodation & food services”, or hotels and restaurants / hospitality sector
employs 18,000 people in Islington, equivalent to 7.6% of employment, and supports
over 1,000 enterprises or local units. It has been a significant growth sector,
registering growth of over 50% over the past five years, higher than the London
average but lower than the growth in neighbouring Hackney and Haringey, although
these are from a lower base.
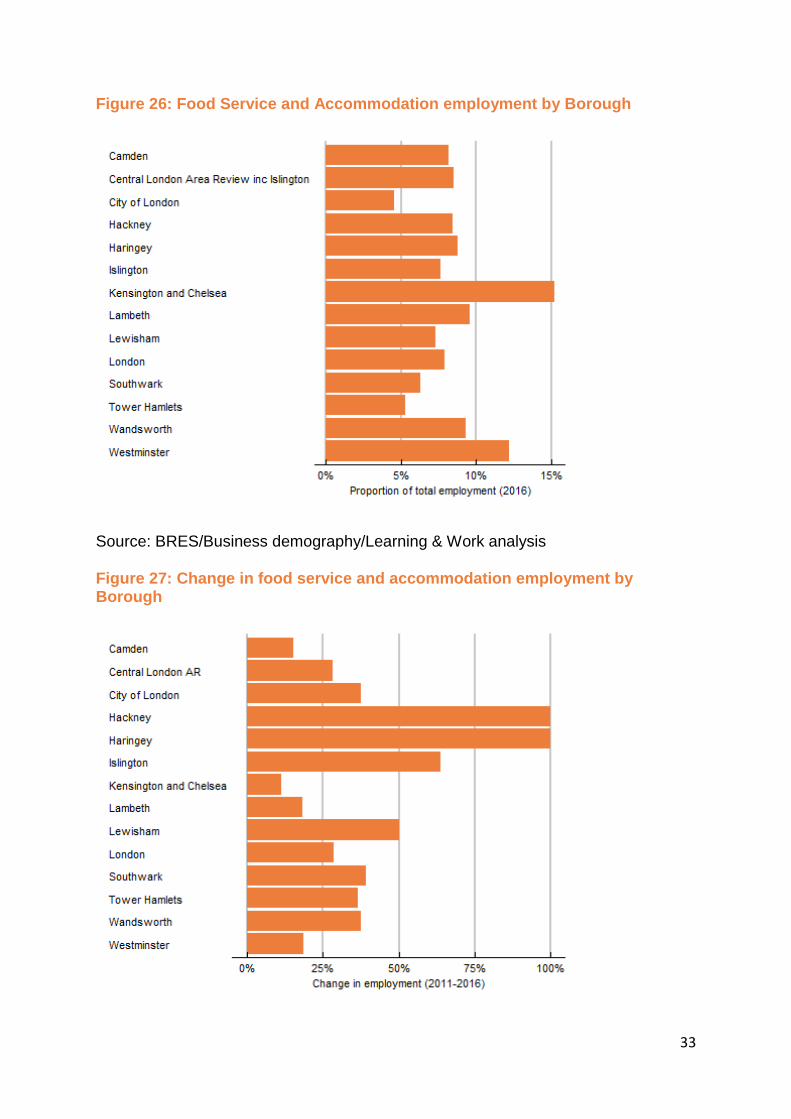
33
Figure 26: Food Service and Accommodation employment by Borough
Source: BRES/Business demography/Learning & Work analysis
Figure 27: Change in food service and accommodation employment by Borough
34
Source: BRES/Business demography/Learning & Work analysis
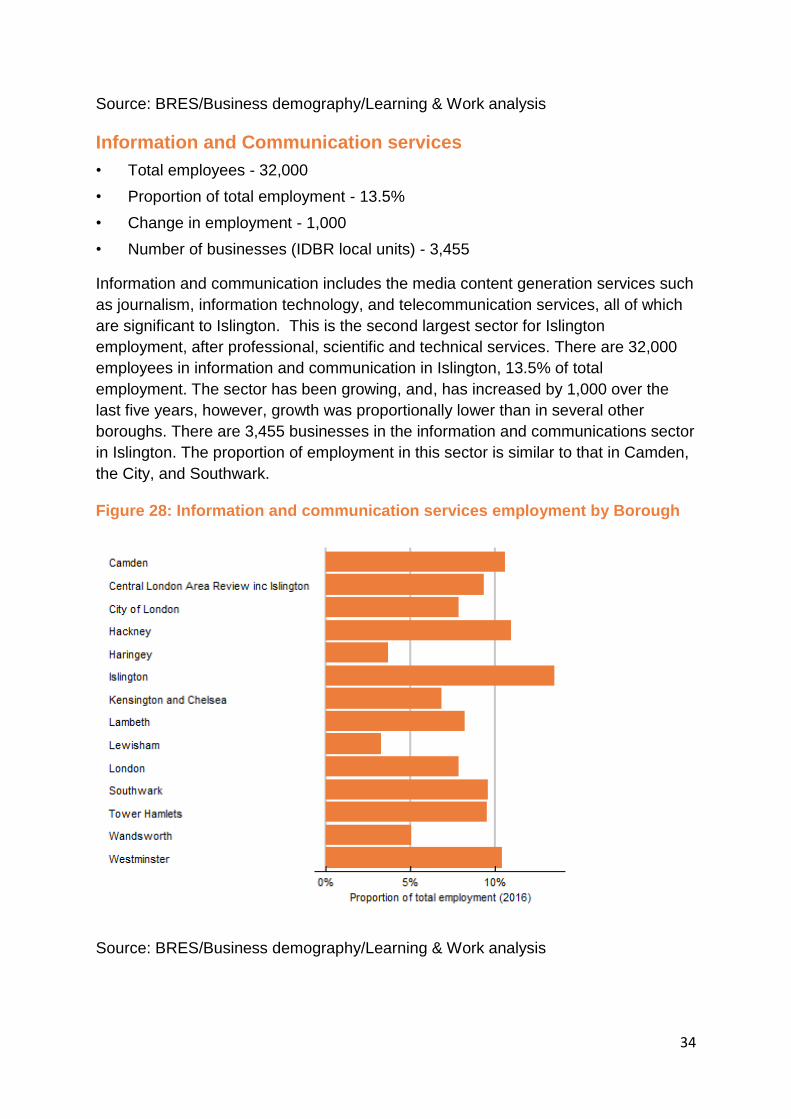
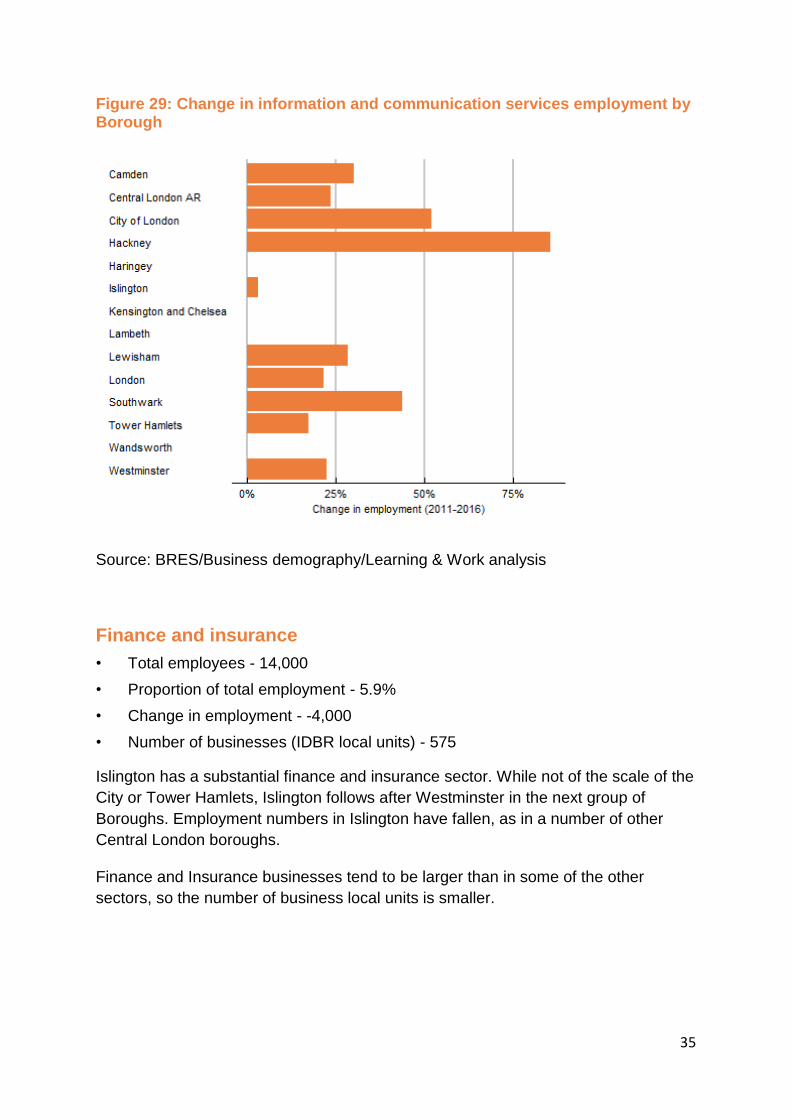
Information and Communication services
• Total employees - 32,000
• Proportion of total employment - 13.5%
• Change in employment - 1,000
• Number of businesses (IDBR local units) - 3,455
Information and communication includes the media content generation services such
as journalism, information technology, and telecommunication services, all of which
are significant to Islington. This is the second largest sector for Islington
employment, after professional, scientific and technical services. There are 32,000
employees in information and communication in Islington, 13.5% of total
employment. The sector has been growing, and, has increased by 1,000 over the
last five years, however, growth was proportionally lower than in several other
boroughs. There are 3,455 businesses in the information and communications sector
in Islington. The proportion of employment in this sector is similar to that in Camden,
the City, and Southwark.
Figure 28: Information and communication services employment by Borough
Source: BRES/Business demography/Learning & Work analysis
35
Figure 29: Change in information and communication services employment by Borough
Source: BRES/Business demography/Learning & Work analysis
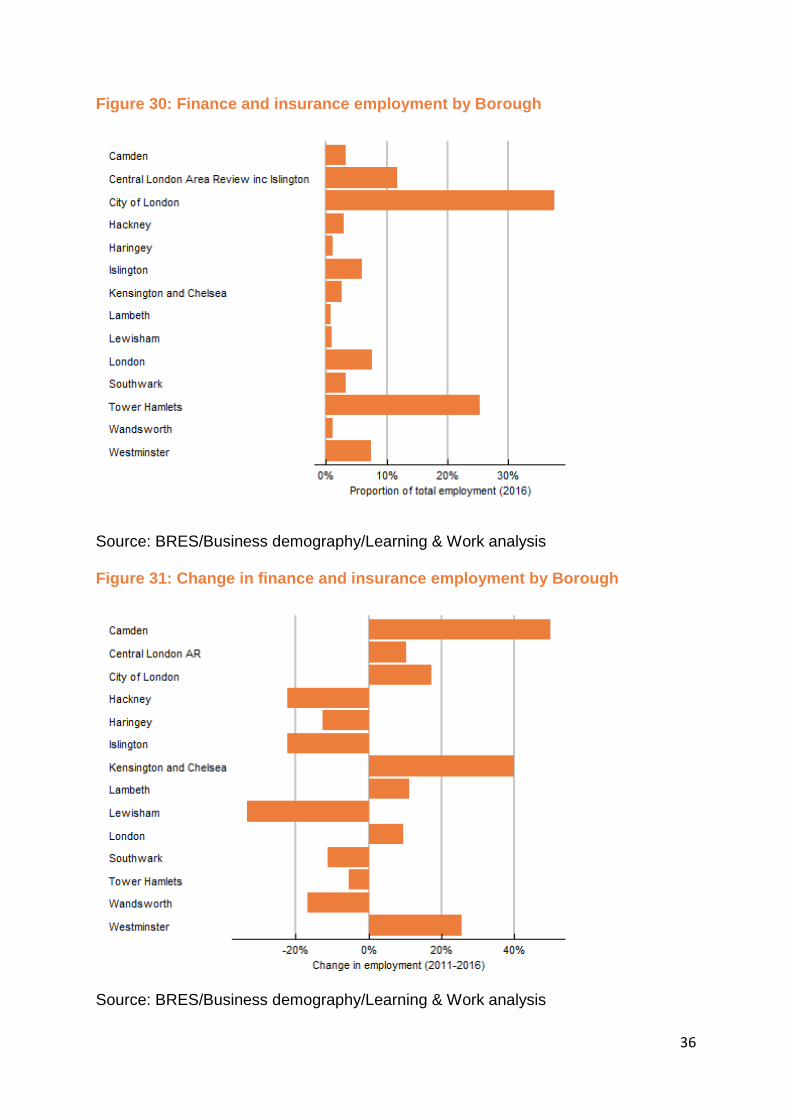
Finance and insurance
• Total employees - 14,000
• Proportion of total employment - 5.9%
• Change in employment - -4,000
• Number of businesses (IDBR local units) - 575
Islington has a substantial finance and insurance sector. While not of the scale of the
City or Tower Hamlets, Islington follows after Westminster in the next group of
Boroughs. Employment numbers in Islington have fallen, as in a number of other
Central London boroughs.
Finance and Insurance businesses tend to be larger than in some of the other
sectors, so the number of business local units is smaller.
36
Figure 30: Finance and insurance employment by Borough
Source: BRES/Business demography/Learning & Work analysis
Figure 31: Change in finance and insurance employment by Borough
Source: BRES/Business demography/Learning & Work analysis
37
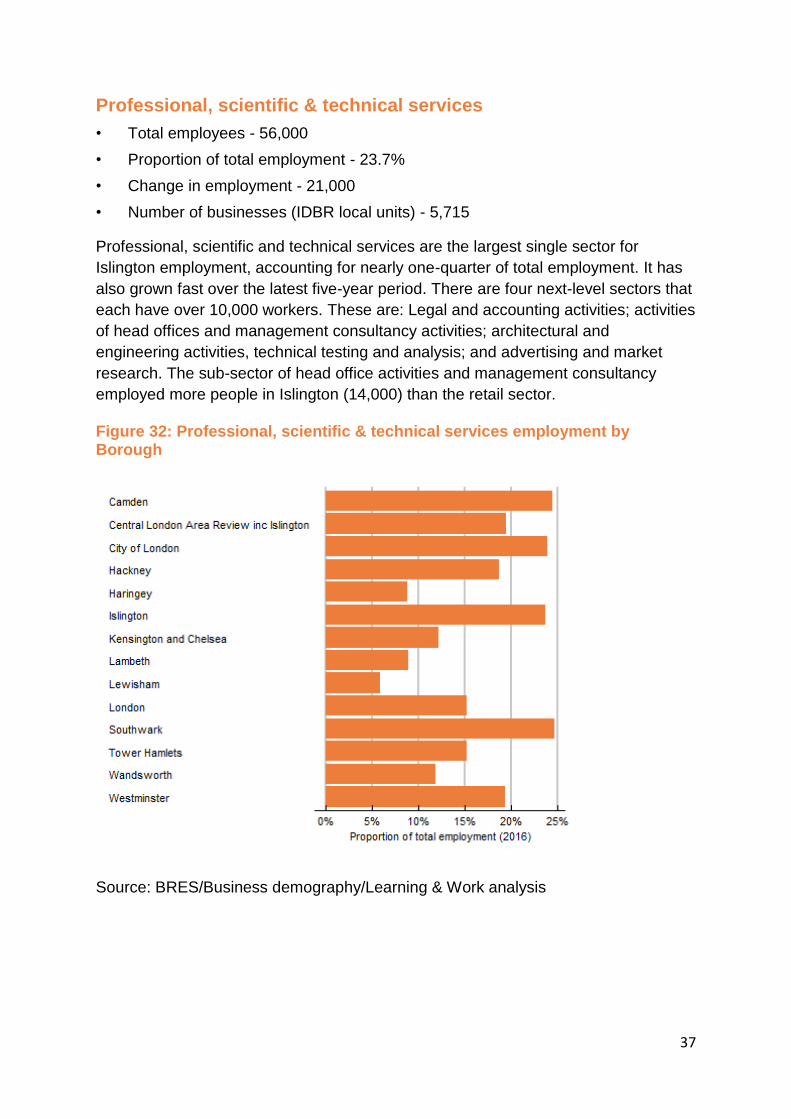
Professional, scientific & technical services
• Total employees - 56,000
• Proportion of total employment - 23.7%
• Change in employment - 21,000
• Number of businesses (IDBR local units) - 5,715
Professional, scientific and technical services are the largest single sector for
Islington employment, accounting for nearly one-quarter of total employment. It has
also grown fast over the latest five-year period. There are four next-level sectors that
each have over 10,000 workers. These are: Legal and accounting activities; activities
of head offices and management consultancy activities; architectural and
engineering activities, technical testing and analysis; and advertising and market
research. The sub-sector of head office activities and management consultancy
employed more people in Islington (14,000) than the retail sector.
Figure 32: Professional, scientific & technical services employment by Borough
Source: BRES/Business demography/Learning & Work analysis

38
Figure 33: Change in professional etc. services employment by Borough
Source: BRES/Business demography/Learning & Work analysis
Business administration & support services
• Total employees - 28,000
• Proportion of total employment - 11.8%
• Change in employment - 11,000
• Number of businesses (IDBR local units) - 1,930
This sector comprises lower value support services to businesses. More than half
the employment in this sector (15,000) is in employment activities. These are
employment agencies, and the classification includes both those operating the
agencies and the agency workers. Other noticeable groups are office administrative,
office support and other business support activities; security and investigation
activities (including security guards); and services to buildings and landscape
activities (including cleaners, where these are not employed through employment
agencies). The growth in these services in Islington was the highest in the Central
London boroughs, though followed closely by the City of London.
39
Figure 34: Business admin and support services employment by Borough
Source: BRES/Business demography/Learning & Work analysis
Figure 35: Change in business admin and support services employment by Borough
Source: BRES/Business demography/Learning & Work analysis
40
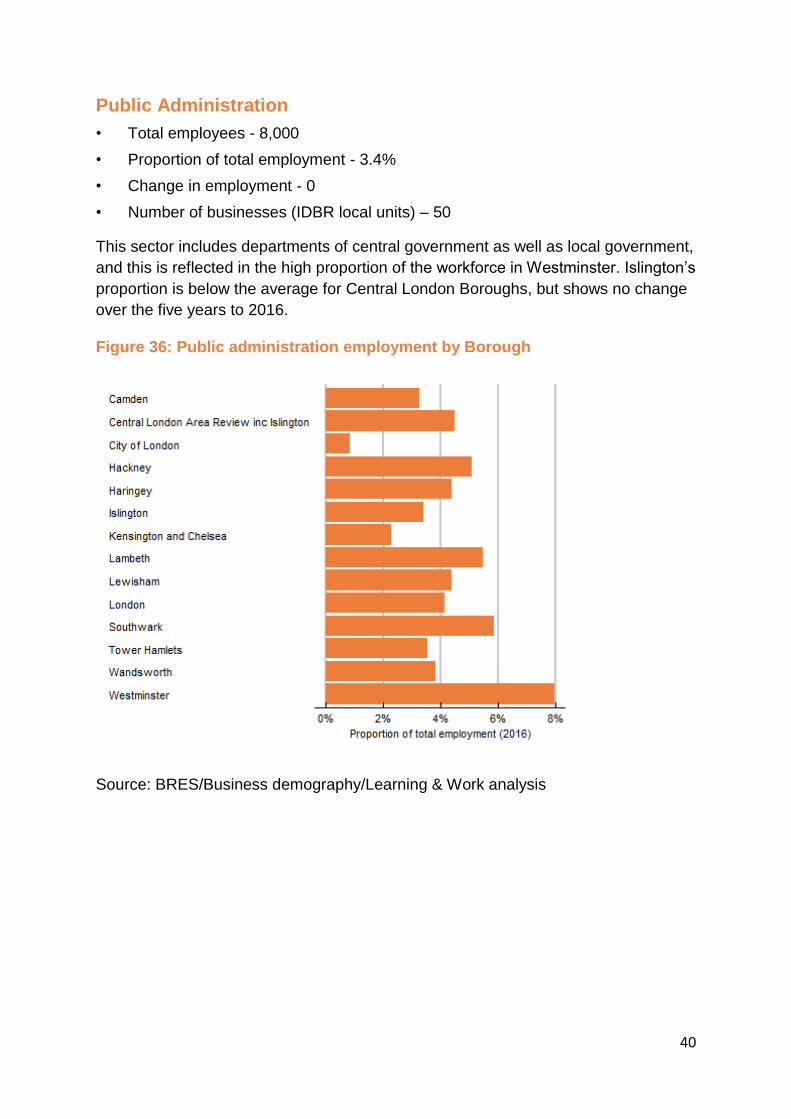
Public Administration
• Total employees - 8,000
• Proportion of total employment - 3.4%
• Change in employment - 0
• Number of businesses (IDBR local units) – 50
This sector includes departments of central government as well as local government,
and this is reflected in the high proportion of the workforce in Westminster. Islington’s
proportion is below the average for Central London Boroughs, but shows no change
over the five years to 2016.
Figure 36: Public administration employment by Borough
Source: BRES/Business demography/Learning & Work analysis
41
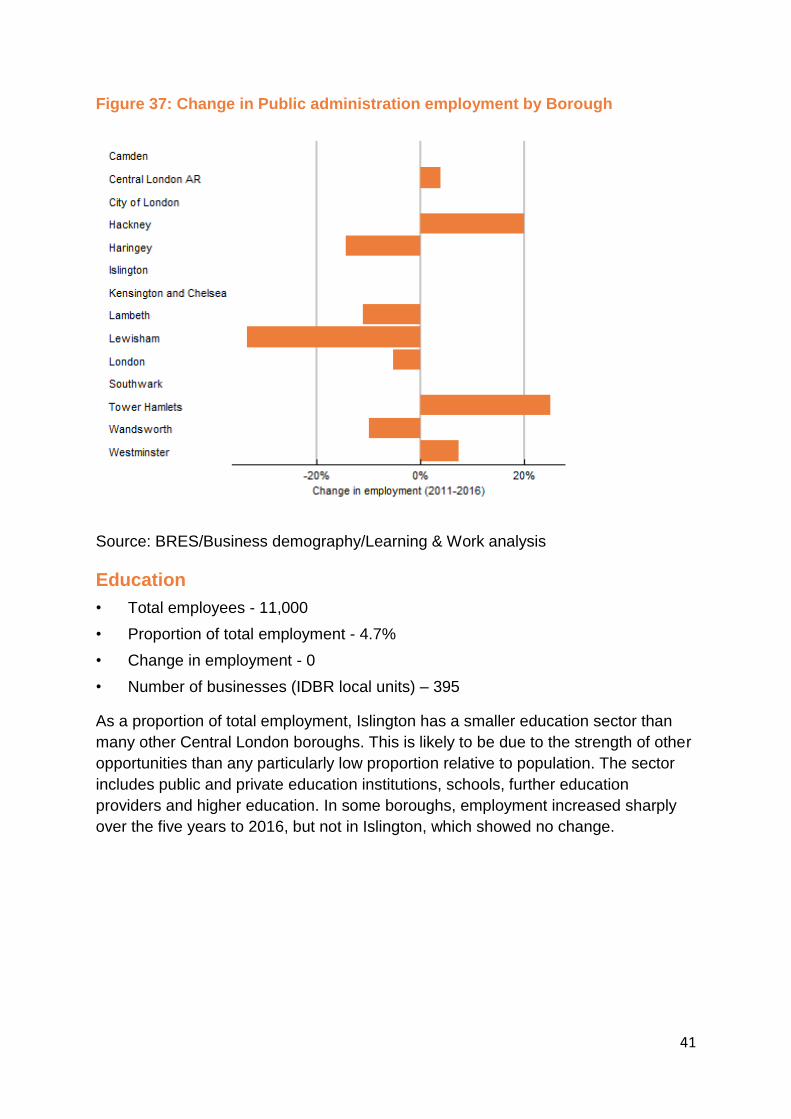
Figure 37: Change in Public administration employment by Borough
Source: BRES/Business demography/Learning & Work analysis
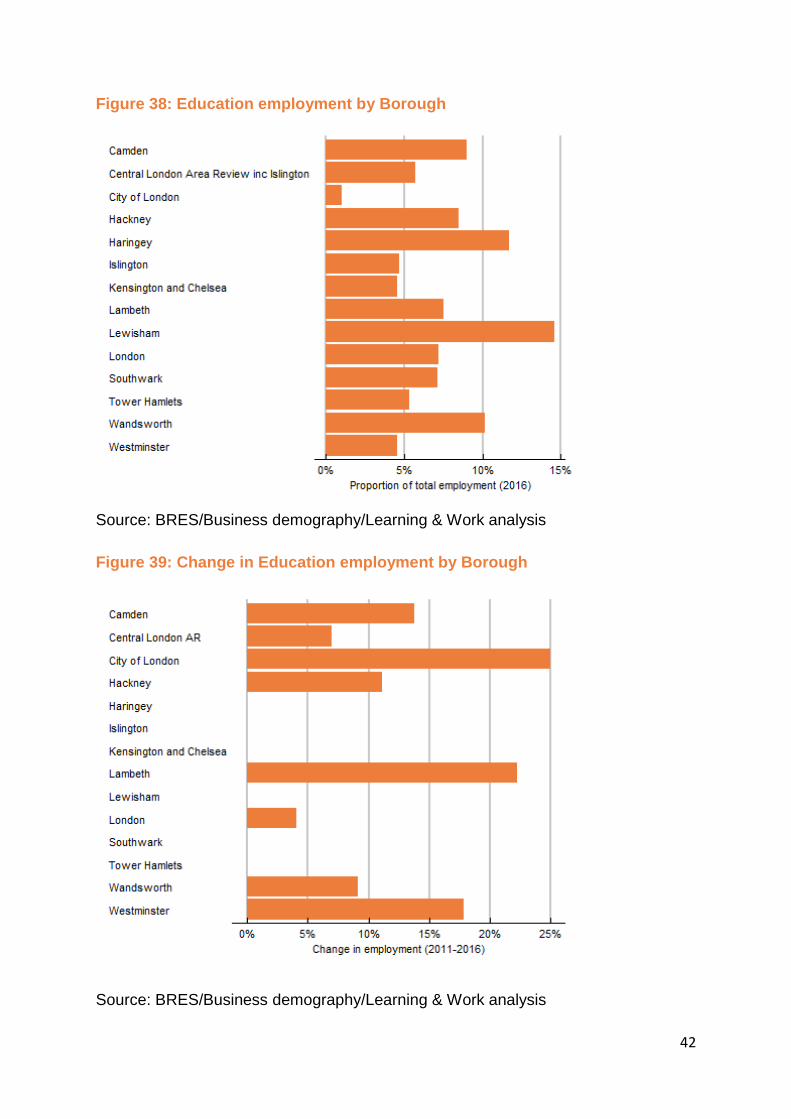
Education
• Total employees - 11,000
• Proportion of total employment - 4.7%
• Change in employment - 0
• Number of businesses (IDBR local units) – 395
As a proportion of total employment, Islington has a smaller education sector than
many other Central London boroughs. This is likely to be due to the strength of other
opportunities than any particularly low proportion relative to population. The sector
includes public and private education institutions, schools, further education
providers and higher education. In some boroughs, employment increased sharply
over the five years to 2016, but not in Islington, which showed no change.
42
Figure 38: Education employment by Borough
Source: BRES/Business demography/Learning & Work analysis
Figure 39: Change in Education employment by Borough
Source: BRES/Business demography/Learning & Work analysis
43
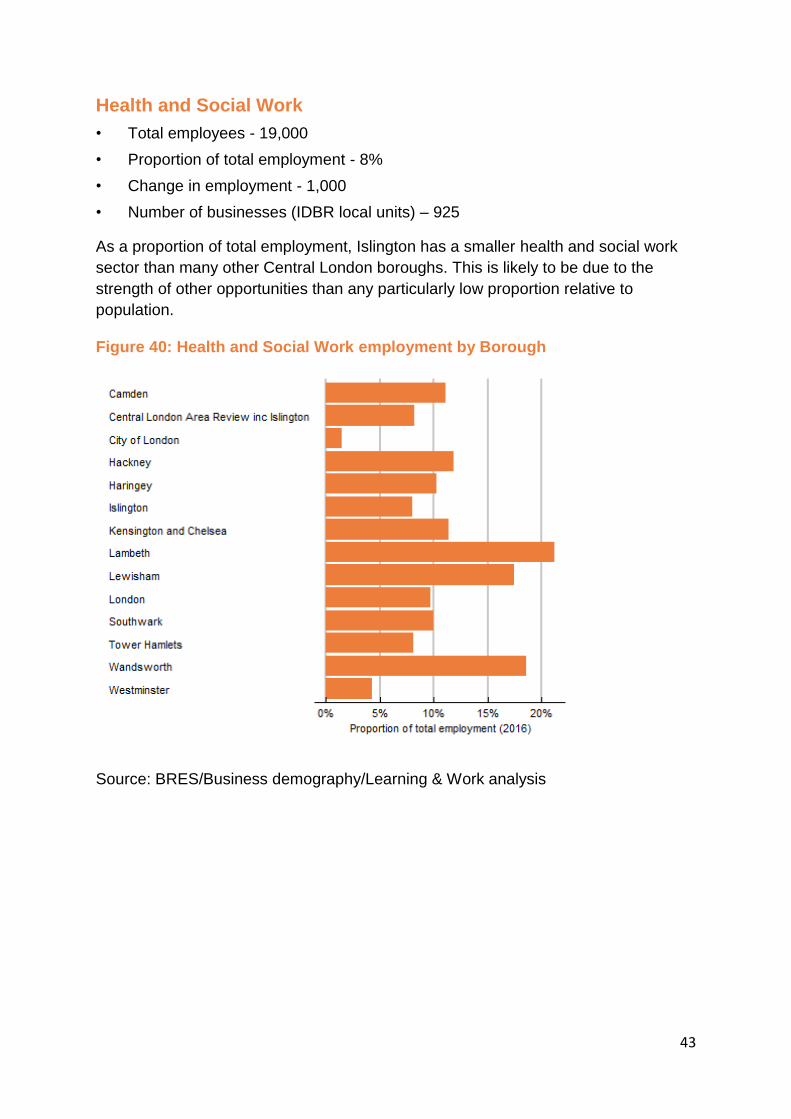
Health and Social Work
• Total employees - 19,000
• Proportion of total employment - 8%
• Change in employment - 1,000
• Number of businesses (IDBR local units) – 925
As a proportion of total employment, Islington has a smaller health and social work
sector than many other Central London boroughs. This is likely to be due to the
strength of other opportunities than any particularly low proportion relative to
population.
Figure 40: Health and Social Work employment by Borough
Source: BRES/Business demography/Learning & Work analysis

44
Figure 41: Change in Health and Social Work employment by Borough
Source: BRES/Business demography/Learning & Work analysis
Arts, entertainment, recreation & other services
• Total employees - 13,000
• Proportion of total employment - 5.5%
• Change in employment - 2,000
• Number of businesses (IDBR local units) - 1,720
Islington’s share of total employment in this sector was in line with the Central
London average. The largest sub-sectors were creative, arts and entertainment
activities and the activities of membership organisations. Together, these were just
under half the total.

45
Figure 42: Arts, entertainment, recreation and other services employment by Borough
Source: BRES/Business demography/Learning & Work analysis
Figure 43: Change in Arts, entertainment, recreation and other services employment by Borough
Source: BRES/Business demography/Learning & Work analysis
46
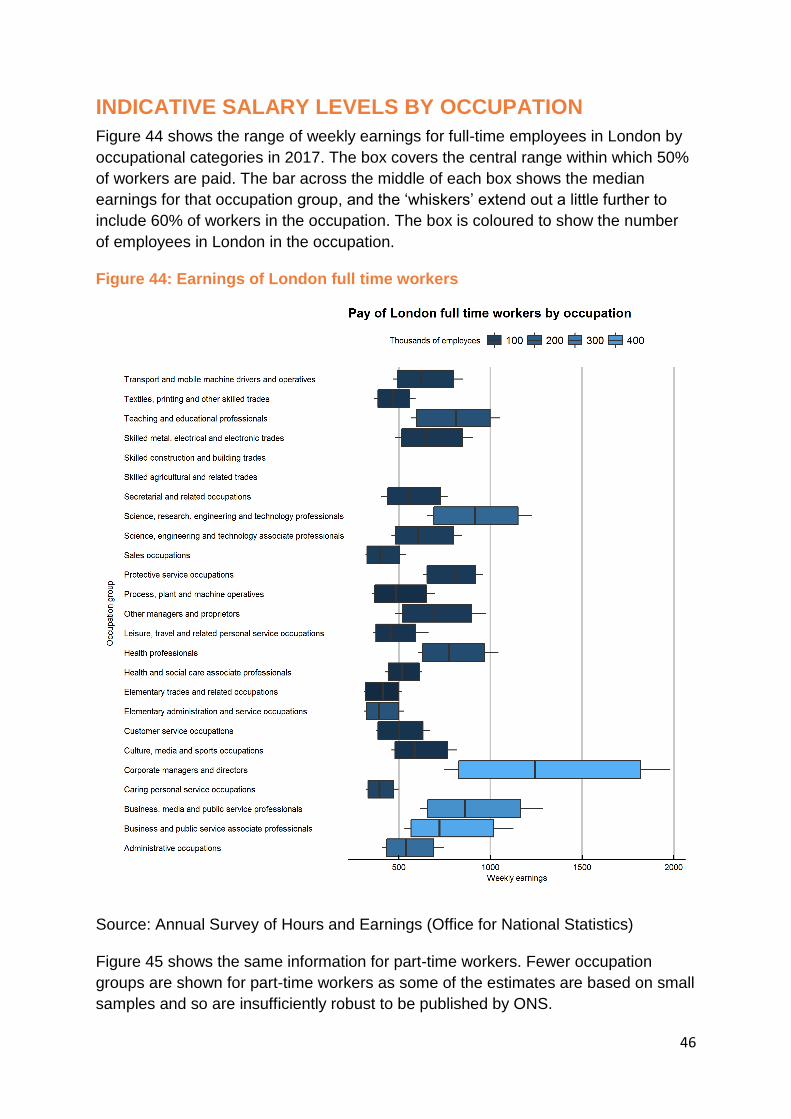
INDICATIVE SALARY LEVELS BY OCCUPATION
Figure 44 shows the range of weekly earnings for full-time employees in London by
occupational categories in 2017. The box covers the central range within which 50%
of workers are paid. The bar across the middle of each box shows the median
earnings for that occupation group, and the ‘whiskers’ extend out a little further to
include 60% of workers in the occupation. The box is coloured to show the number
of employees in London in the occupation.
Figure 44: Earnings of London full time workers
Source: Annual Survey of Hours and Earnings (Office for National Statistics)
Figure 45 shows the same information for part-time workers. Fewer occupation
groups are shown for part-time workers as some of the estimates are based on small
samples and so are insufficiently robust to be published by ONS.

47
Figure 45: Earnings of part-time workers in London
OCCUPATIONAL CHANGES WITHIN SECTORS
Sectors and occupations are different concepts. A sector is based on the main
business of a firm, and the sector classification is applied to all workers from the
Chief Executive down to the lowest paid employee. An occupation is based on the
job people do, and is what is used in recruitment adverts – normally a job title,
together with a brief description that corresponds to an occupational description.
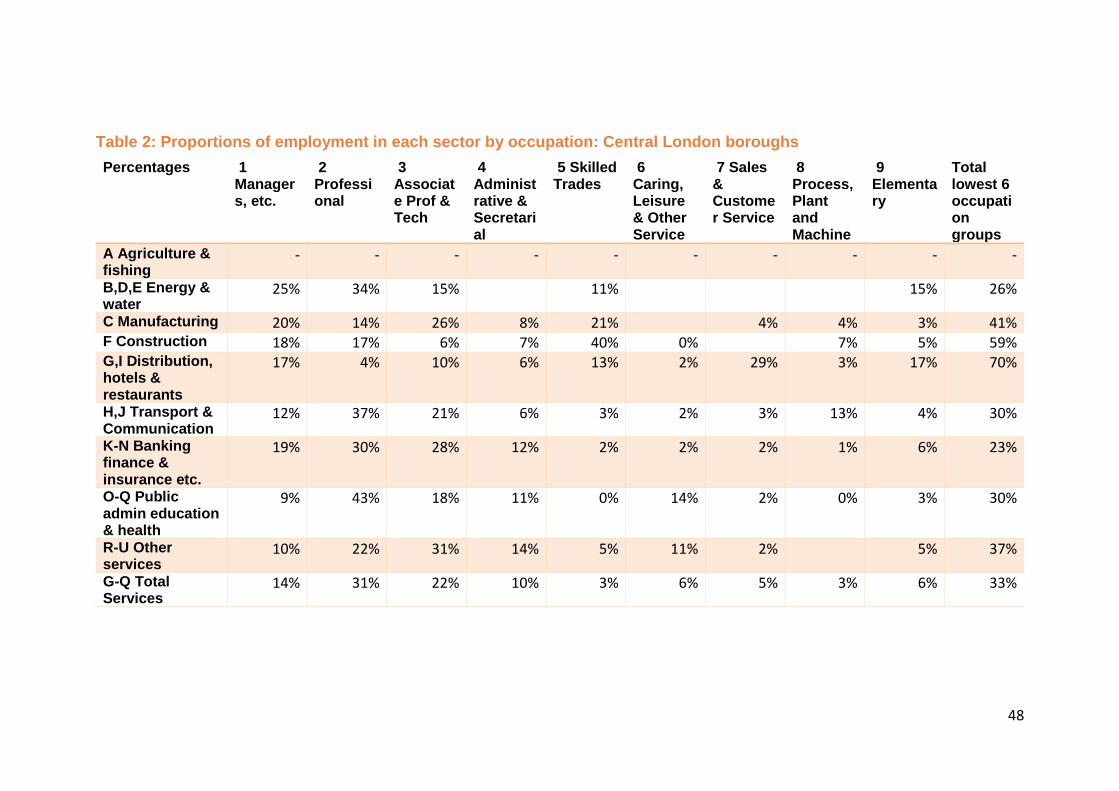
Each worker has both a sectoral and an occupational classification. Table 2 shows
the cross-tabulation of sectors and occupations for workers in Central London (using
the same Boroughs as elsewhere in this report).
48
Table 2: Proportions of employment in each sector by occupation: Central London boroughs
Percentages 1 Managers, etc.
2 Professional
3 Associate Prof & Tech
4 Administrative & Secretarial
5 Skilled Trades
6 Caring, Leisure & Other Service
7 Sales & Customer Service
8 Process, Plant and Machine
9 Elementary
Total lowest 6 occupation groups
A Agriculture & fishing
- - - - - - - - - -
B,D,E Energy & water
25% 34% 15% 11% 15% 26%
C Manufacturing 20% 14% 26% 8% 21% 4% 4% 3% 41% F Construction 18% 17% 6% 7% 40% 0% 7% 5% 59% G,I Distribution, hotels & restaurants
17% 4% 10% 6% 13% 2% 29% 3% 17% 70%
H,J Transport & Communication
12% 37% 21% 6% 3% 2% 3% 13% 4% 30%
K-N Banking finance & insurance etc.
19% 30% 28% 12% 2% 2% 2% 1% 6% 23%
O-Q Public admin education & health
9% 43% 18% 11% 0% 14% 2% 0% 3% 30%
R-U Other services
10% 22% 31% 14% 5% 11% 2% 5% 37%
G-Q Total Services
14% 31% 22% 10% 3% 6% 5% 3% 6% 33%
49
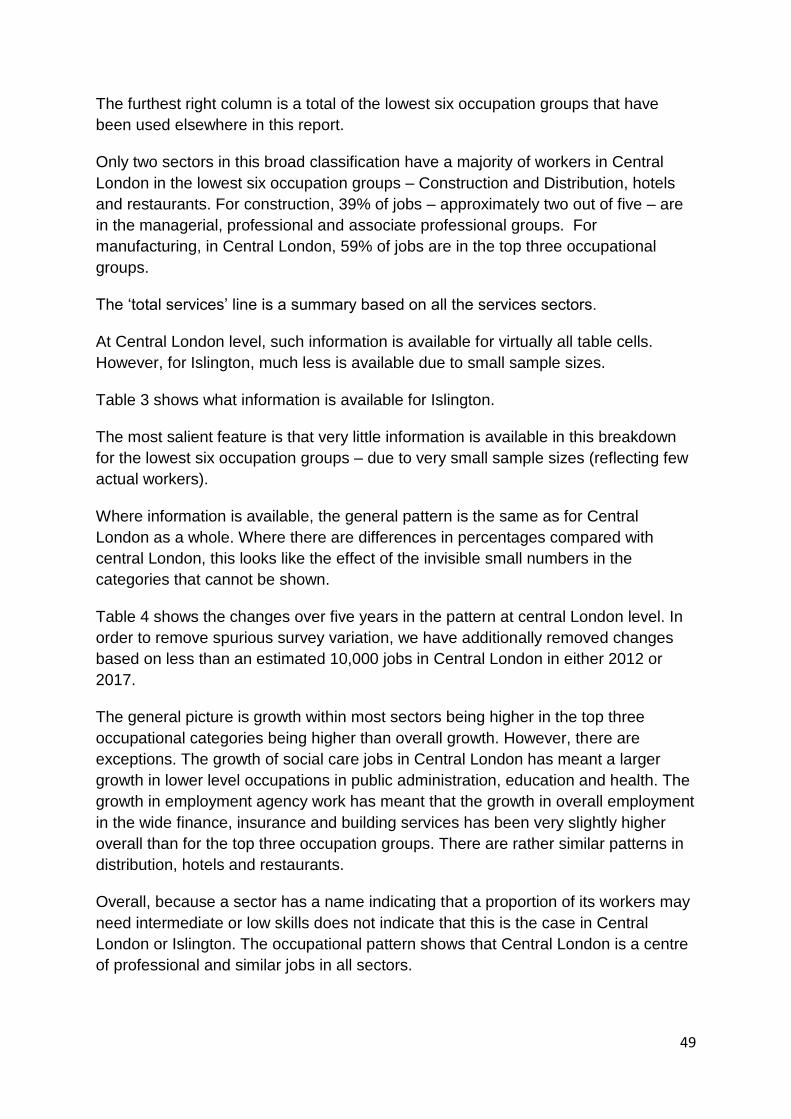
The furthest right column is a total of the lowest six occupation groups that have
been used elsewhere in this report.
Only two sectors in this broad classification have a majority of workers in Central
London in the lowest six occupation groups – Construction and Distribution, hotels
and restaurants. For construction, 39% of jobs – approximately two out of five – are
in the managerial, professional and associate professional groups. For
manufacturing, in Central London, 59% of jobs are in the top three occupational
groups.
The ‘total services’ line is a summary based on all the services sectors.
At Central London level, such information is available for virtually all table cells.
However, for Islington, much less is available due to small sample sizes.
Table 3 shows what information is available for Islington.
The most salient feature is that very little information is available in this breakdown
for the lowest six occupation groups – due to very small sample sizes (reflecting few
actual workers).
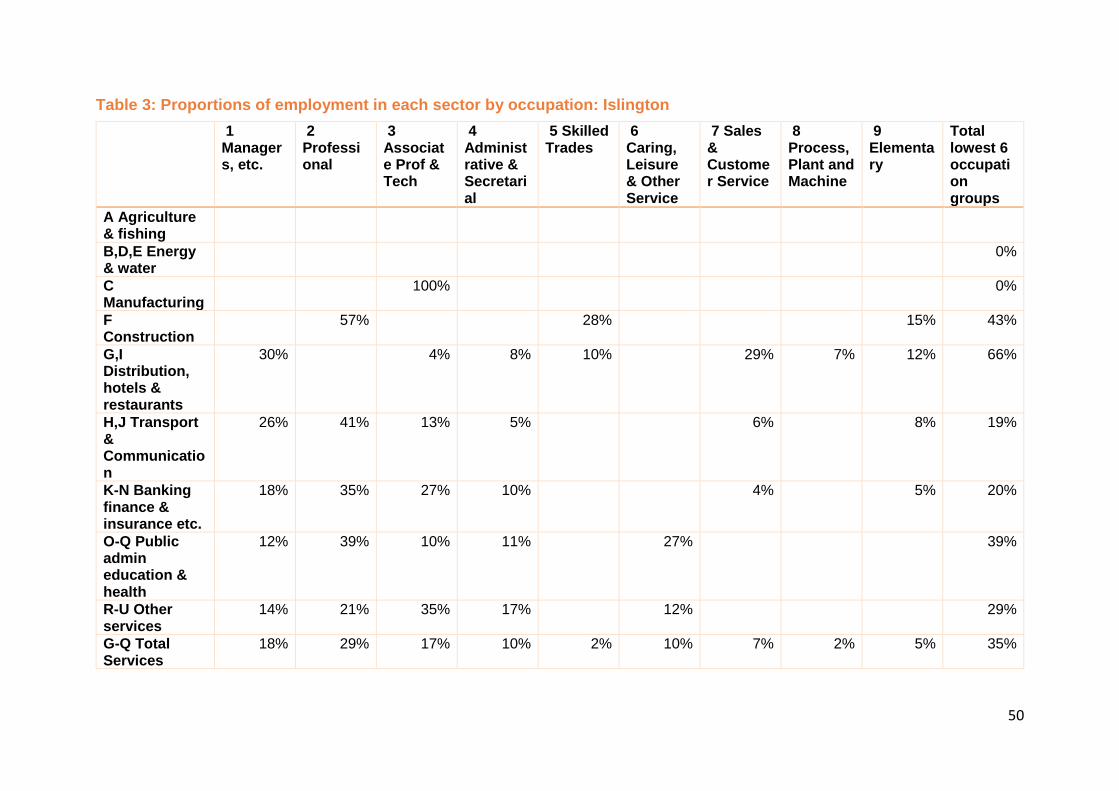
Where information is available, the general pattern is the same as for Central
London as a whole. Where there are differences in percentages compared with
central London, this looks like the effect of the invisible small numbers in the
categories that cannot be shown.
Table 4 shows the changes over five years in the pattern at central London level. In
order to remove spurious survey variation, we have additionally removed changes
based on less than an estimated 10,000 jobs in Central London in either 2012 or
2017.
The general picture is growth within most sectors being higher in the top three
occupational categories being higher than overall growth. However, there are
exceptions. The growth of social care jobs in Central London has meant a larger
growth in lower level occupations in public administration, education and health. The
growth in employment agency work has meant that the growth in overall employment
in the wide finance, insurance and building services has been very slightly higher
overall than for the top three occupation groups. There are rather similar patterns in
distribution, hotels and restaurants.
Overall, because a sector has a name indicating that a proportion of its workers may
need intermediate or low skills does not indicate that this is the case in Central
London or Islington. The occupational pattern shows that Central London is a centre
of professional and similar jobs in all sectors.
50
Table 3: Proportions of employment in each sector by occupation: Islington
1 Managers, etc.
2 Professional
3 Associate Prof & Tech
4 Administrative & Secretarial
5 Skilled Trades
6 Caring, Leisure & Other Service
7 Sales & Customer Service
8 Process, Plant and Machine
9 Elementary
Total lowest 6 occupation groups
A Agriculture & fishing
B,D,E Energy & water
0%
C Manufacturing
100% 0%
F Construction
57% 28% 15% 43%
G,I Distribution, hotels & restaurants
30% 4% 8% 10% 29% 7% 12% 66%
H,J Transport & Communication
26% 41% 13% 5% 6% 8% 19%
K-N Banking finance & insurance etc.
18% 35% 27% 10% 4% 5% 20%
O-Q Public admin education & health
12% 39% 10% 11% 27% 39%
R-U Other services
14% 21% 35% 17% 12% 29%
G-Q Total Services
18% 29% 17% 10% 2% 10% 7% 2% 5% 35%
51
Table 4: Change in occupational pattern within sectors 2012-2017, Central London boroughs
Percentage change
1 Managers, etc.
2 Professional
3 Associate Prof & Tech
4 Administrative & Secretarial
5 Skilled Trades
6 Caring, Leisure & Other Service
7 Sales & Customer Service
8 Process, Plant and Machine
9 Elementary
C Manufacturing
13% -12% 54%
F Construction 60% 26% -3% 30% 14%
G,I Distribution, hotels & restaurants
7% 22% 13% -11% 35% 13% 7%
H,J Transport & Communication
45% 34% 24% 12% 28% 0%
K-N Banking finance & insurance etc.
32% 24% 6% 0% 28% 37%
O-Q Public admin education & health
23% 21% 15% 23% 47% 6%
R-U Other services
-14% 46% 28% 7% 11% -8%
G-Q Total Services
24% 25% 13% 7% 49% 37% 24% 35% 14%
52
EMPLOYER SKILLS SURVEY 2015
The 2015 Employer Skills Survey (ESS) is the third in the series of UK-wide skills
surveys run by the UK Commission for Employment and Skills (UKCES). The survey
reports on the experiences and practices of over 91,000 employers and explores the
skills challenges that employers face both within their existing workforces and when
recruiting, their use of the skills of their staff, the levels and nature of investment in
training and development, and the relationship between skills challenges, training
activity and business strategy. The survey covers establishments with at least two
people on the payroll. This is the latest ESS available to us. The results of the 2017
ESS are due to be published in Summer 2018.
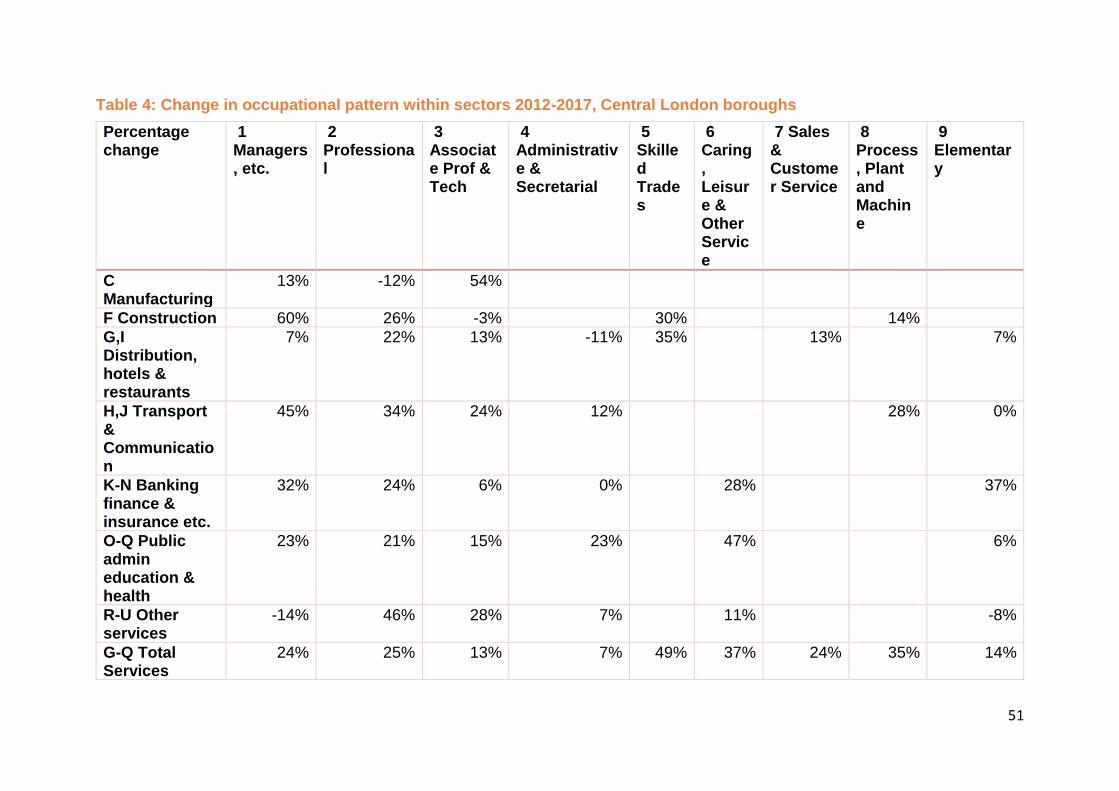
There was substantial growth in the number of employers active in the recruitment
market in 2015 compared to 2013: in England 20 per cent of establishments had at
least one current vacancy at the time of ESS 2015 fieldwork, up from 15 per cent in
2013. In London there were more employers (proportionally) with vacancies, with
nearly a quarter of establishments saying they had at least one vacancy, up from 19
per cent in 2013. This was slightly lower than Central London and significantly lower
than Islington at 25 per cent and 28 per cent respectively: in Islington this represents
18,000 vacancies. The proportion of establishments in Islington with a vacancy has
increased from 21 per cent in 2013 – see Figure 46.
Figure 46: Establishments with any vacancies
Figure 47 shows the number of vacancies as a percentage of all in employment. It
shows that there has been a very small increase in England, London and Central
London. However, Islington has seen a significant increase from three per cent in
2013 to nine per cent in 2015.

53
Figure 47 Number of vacancies as a % of all employment
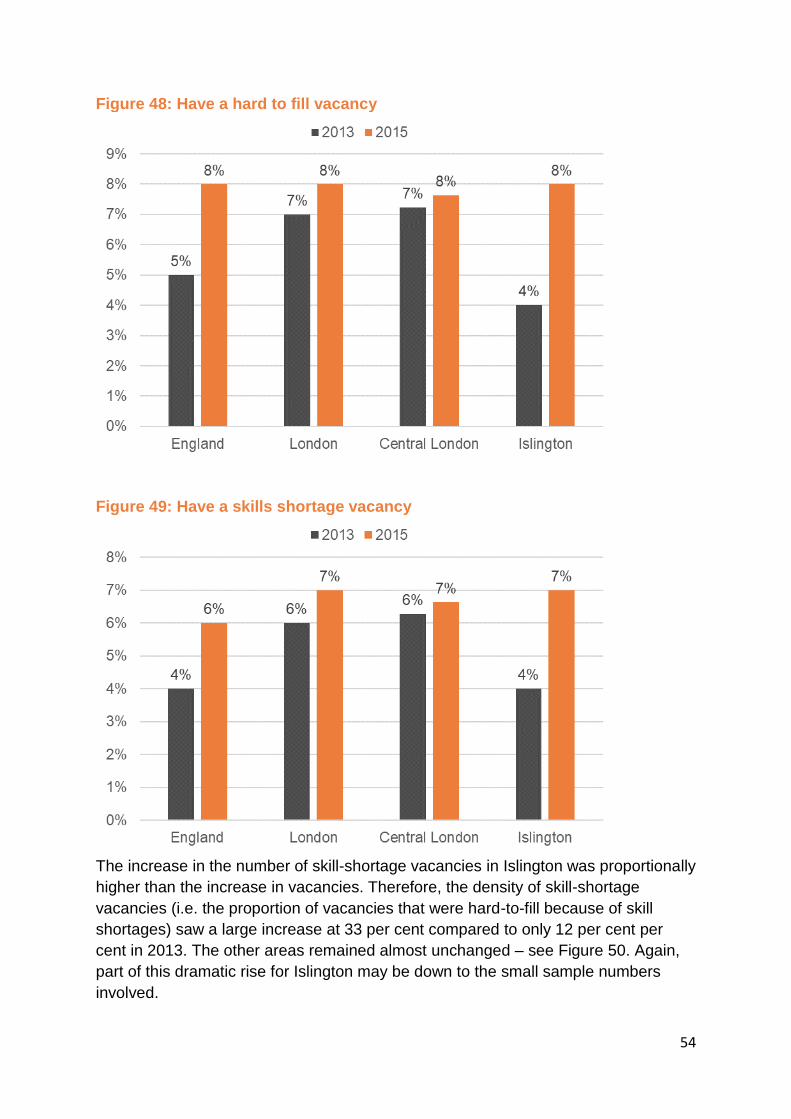
Hard to fill and skill-shortage vacancies presented a growing challenge for employers
in filling their vacancies.
Eight per cent of all employers in England had at least one hard to fil vacancy at the
time of the survey – an increase from the five per cent of employers that reported
having such vacancies in 2013. Employers in London and Central London also
reported similar proportions with eight per cent of all employers saying they had at
least one hard to fil vacancy – slightly higher than 2013 at seven per cent. However,
in Islington there was a significant increase from four per cent in 2013 to eight per
cent in 2015 – see Figure 48
Six per cent of all employers in England had at least one skill-shortage vacancy at
the time of the survey – a significant increase from the four per cent of employers
that reported having such vacancies in 2013. Again, London as a whole and Central
London only saw a single percentage point increase, whereas Islington saw an
increase from four per cent to seven per cent – see Figure 49. In volume terms,
there were nearly 6,000 reported skill-shortage vacancies which was a huge
increase of 88 per cent from the 702 reported in 2013. We suspect that part of this
increase is down to the small survey numbers for Islington and so some statistical
noise boosting the apparent rise in the vacancy rate, but part we suspect is real
reflecting the rapid growth in employment in Islington.
54
Figure 48: Have a hard to fill vacancy
Figure 49: Have a skills shortage vacancy
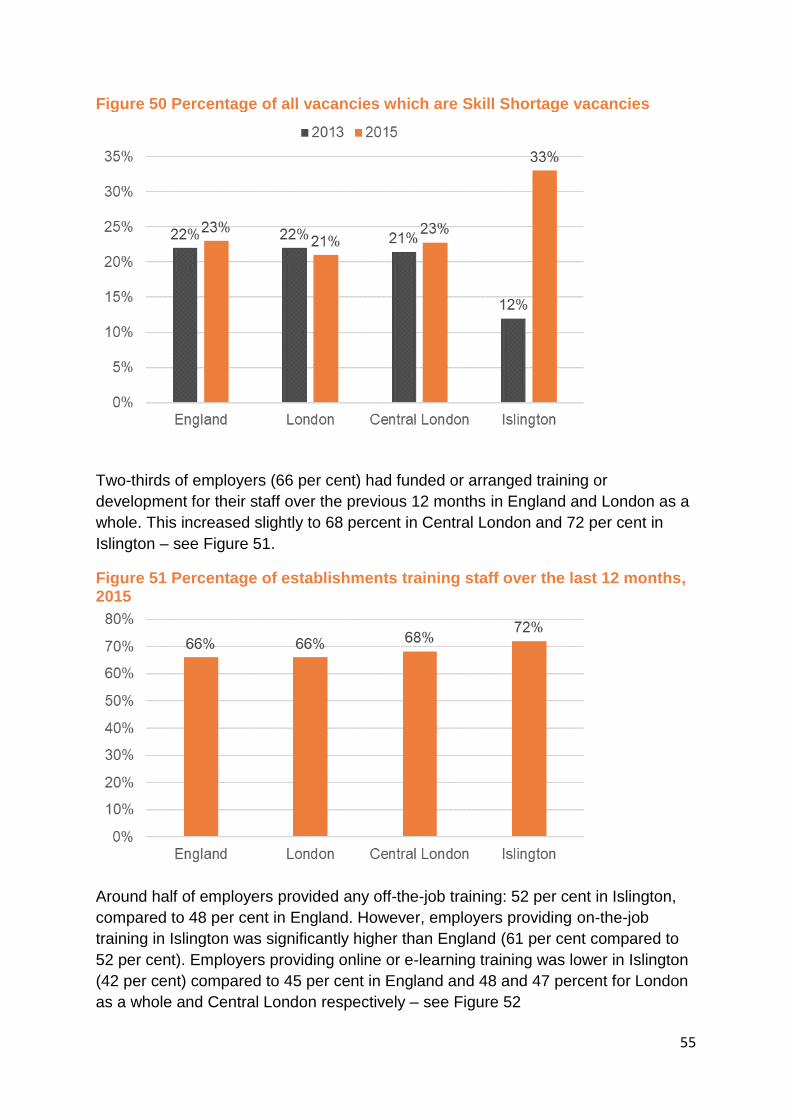
The increase in the number of skill-shortage vacancies in Islington was proportionally
higher than the increase in vacancies. Therefore, the density of skill-shortage
vacancies (i.e. the proportion of vacancies that were hard-to-fill because of skill
shortages) saw a large increase at 33 per cent compared to only 12 per cent per
cent in 2013. The other areas remained almost unchanged – see Figure 50. Again,
part of this dramatic rise for Islington may be down to the small sample numbers
involved.
55
Figure 50 Percentage of all vacancies which are Skill Shortage vacancies
Two-thirds of employers (66 per cent) had funded or arranged training or
development for their staff over the previous 12 months in England and London as a
whole. This increased slightly to 68 percent in Central London and 72 per cent in
Islington – see Figure 51.
Figure 51 Percentage of establishments training staff over the last 12 months, 2015
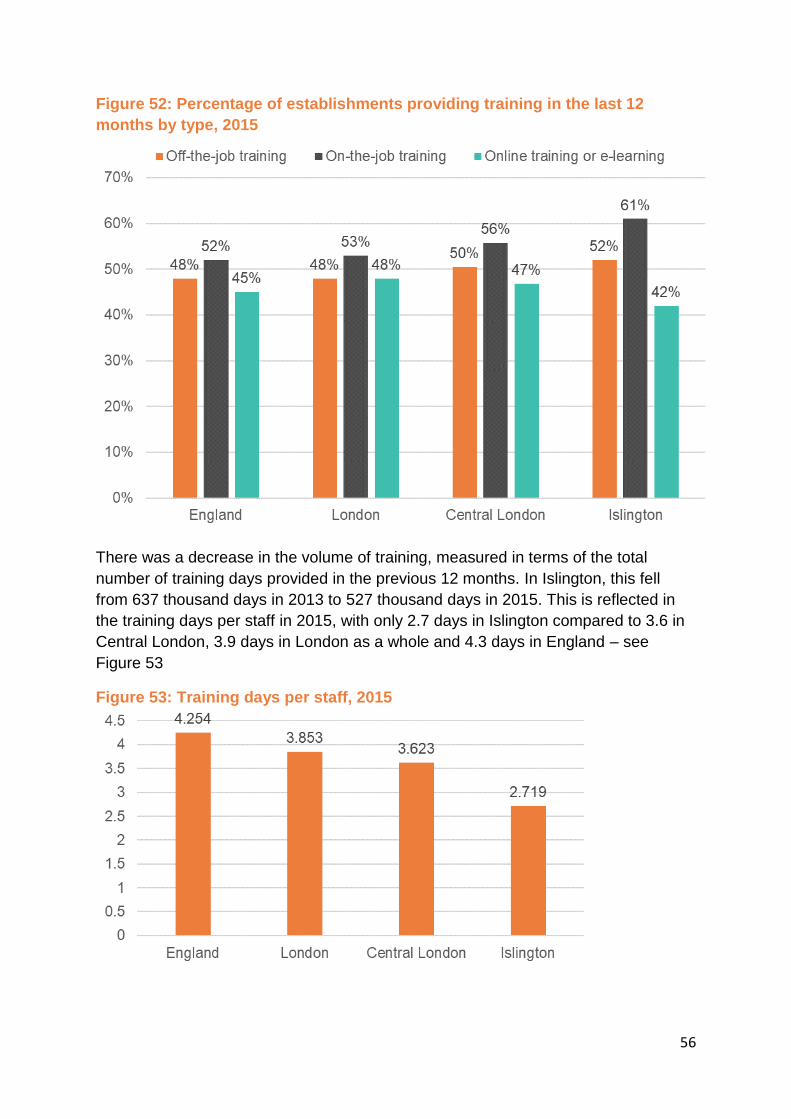
Around half of employers provided any off-the-job training: 52 per cent in Islington,
compared to 48 per cent in England. However, employers providing on-the-job
training in Islington was significantly higher than England (61 per cent compared to
52 per cent). Employers providing online or e-learning training was lower in Islington
(42 per cent) compared to 45 per cent in England and 48 and 47 percent for London
as a whole and Central London respectively – see Figure 52
56
Figure 52: Percentage of establishments providing training in the last 12
months by type, 2015
There was a decrease in the volume of training, measured in terms of the total
number of training days provided in the previous 12 months. In Islington, this fell
from 637 thousand days in 2013 to 527 thousand days in 2015. This is reflected in
the training days per staff in 2015, with only 2.7 days in Islington compared to 3.6 in
Central London, 3.9 days in London as a whole and 4.3 days in England – see
Figure 53
Figure 53: Training days per staff, 2015
57
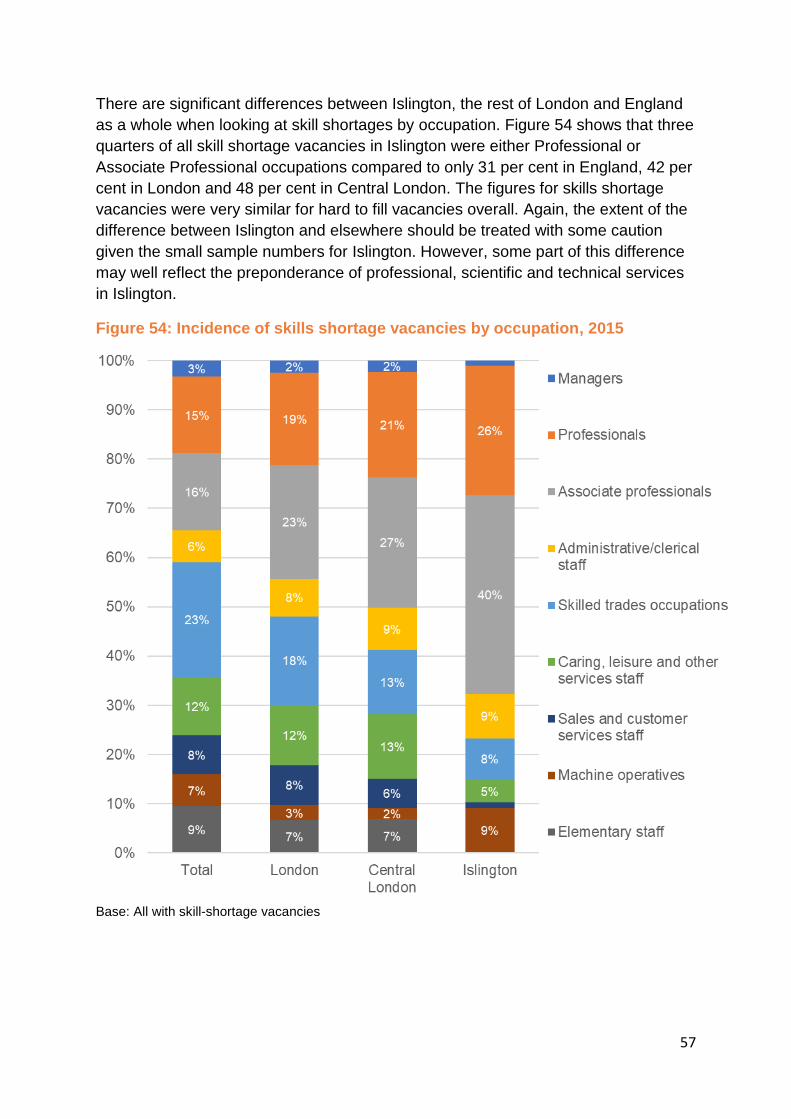
There are significant differences between Islington, the rest of London and England
as a whole when looking at skill shortages by occupation. Figure 54 shows that three
quarters of all skill shortage vacancies in Islington were either Professional or
Associate Professional occupations compared to only 31 per cent in England, 42 per
cent in London and 48 per cent in Central London. The figures for skills shortage
vacancies were very similar for hard to fill vacancies overall. Again, the extent of the
difference between Islington and elsewhere should be treated with some caution
given the small sample numbers for Islington. However, some part of this difference
may well reflect the preponderance of professional, scientific and technical services
in Islington.
Figure 54: Incidence of skills shortage vacancies by occupation, 2015
Base: All with skill-shortage vacancies
58
3. CHARACTERISTICS OF ISLINGTON
WORKERS AND RESIDENTS
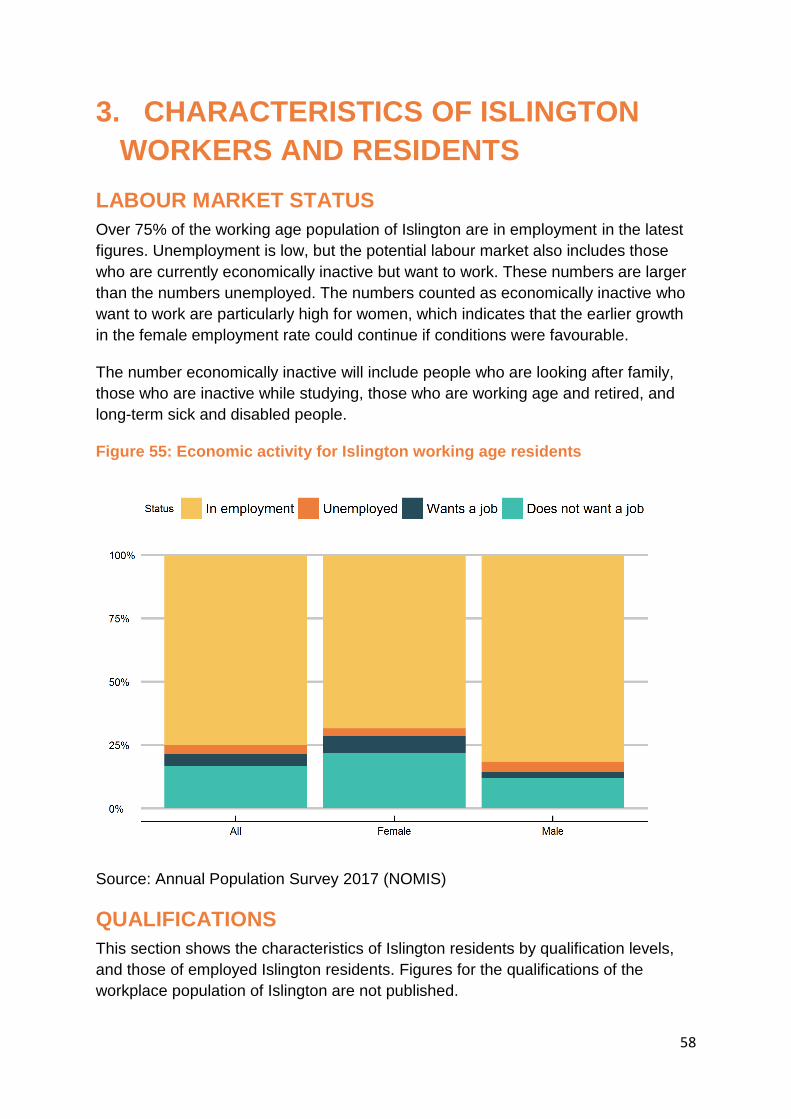
LABOUR MARKET STATUS
Over 75% of the working age population of Islington are in employment in the latest
figures. Unemployment is low, but the potential labour market also includes those
who are currently economically inactive but want to work. These numbers are larger
than the numbers unemployed. The numbers counted as economically inactive who
want to work are particularly high for women, which indicates that the earlier growth
in the female employment rate could continue if conditions were favourable.
The number economically inactive will include people who are looking after family,
those who are inactive while studying, those who are working age and retired, and
long-term sick and disabled people.
Figure 55: Economic activity for Islington working age residents
Source: Annual Population Survey 2017 (NOMIS)
QUALIFICATIONS
This section shows the characteristics of Islington residents by qualification levels,
and those of employed Islington residents. Figures for the qualifications of the
workplace population of Islington are not published.
59
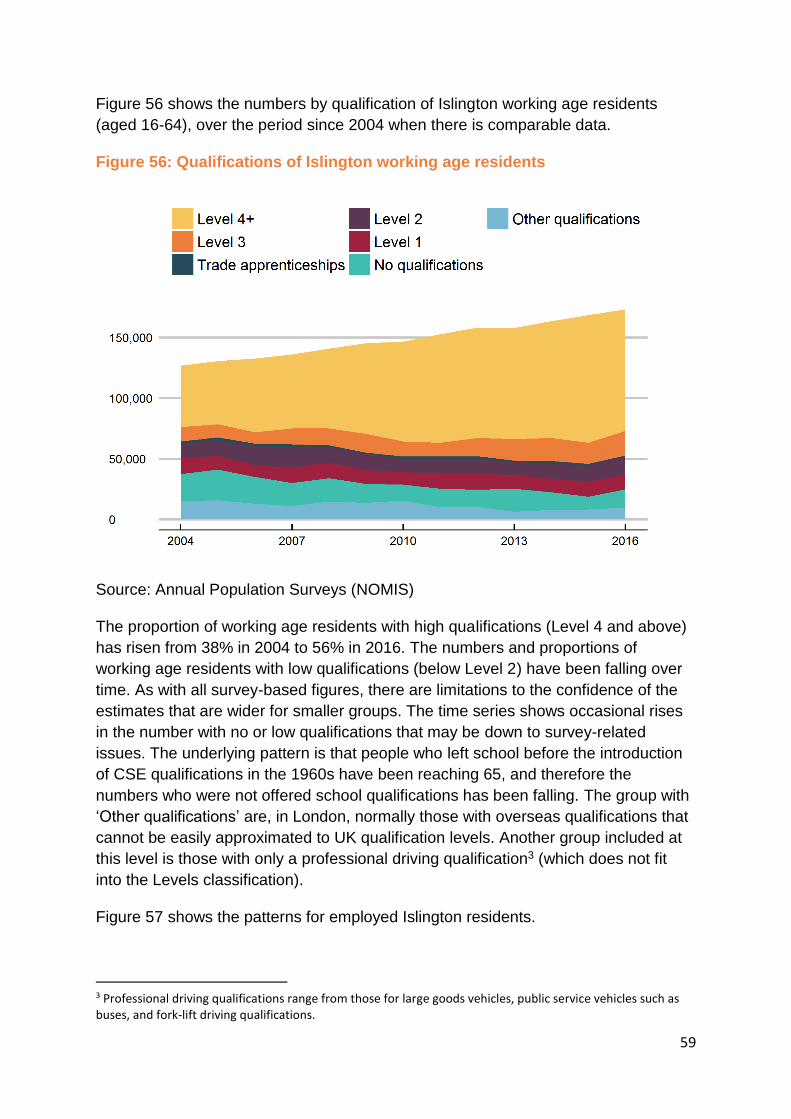
Figure 56 shows the numbers by qualification of Islington working age residents
(aged 16-64), over the period since 2004 when there is comparable data.
Figure 56: Qualifications of Islington working age residents
Source: Annual Population Surveys (NOMIS)
The proportion of working age residents with high qualifications (Level 4 and above)
has risen from 38% in 2004 to 56% in 2016. The numbers and proportions of
working age residents with low qualifications (below Level 2) have been falling over
time. As with all survey-based figures, there are limitations to the confidence of the
estimates that are wider for smaller groups. The time series shows occasional rises
in the number with no or low qualifications that may be down to survey-related
issues. The underlying pattern is that people who left school before the introduction
of CSE qualifications in the 1960s have been reaching 65, and therefore the
numbers who were not offered school qualifications has been falling. The group with
‘Other qualifications’ are, in London, normally those with overseas qualifications that
cannot be easily approximated to UK qualification levels. Another group included at
this level is those with only a professional driving qualification3 (which does not fit
into the Levels classification).
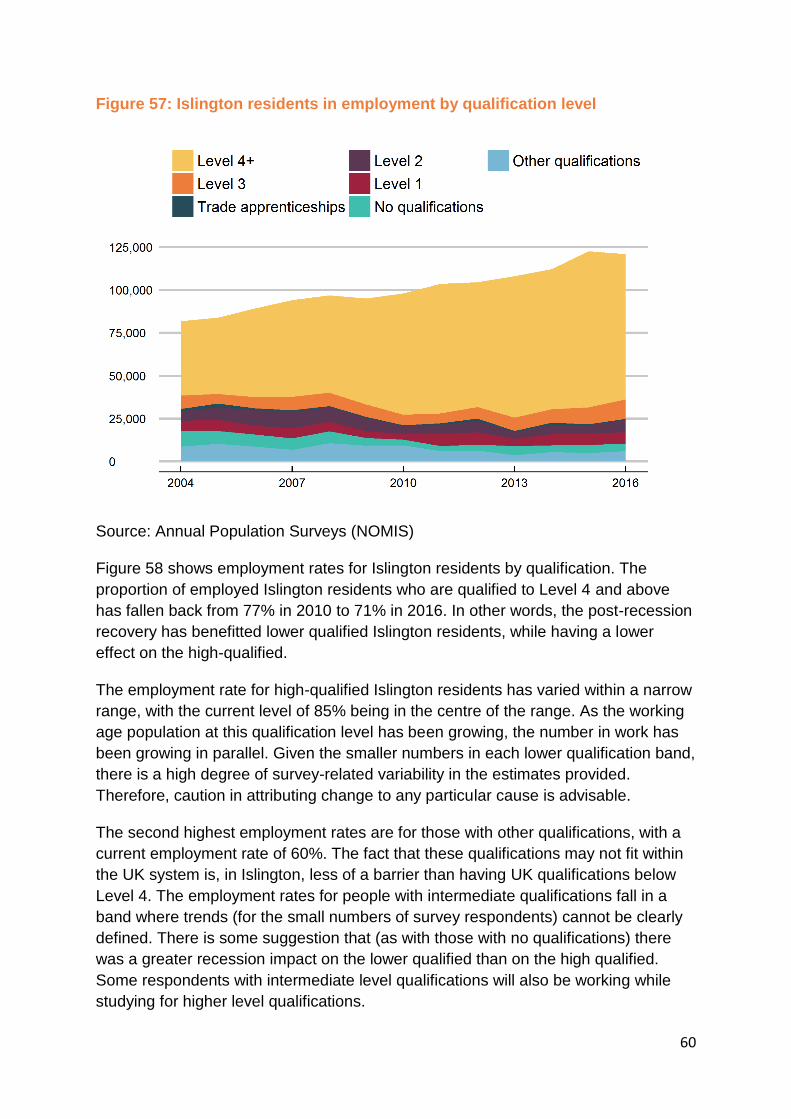
Figure 57 shows the patterns for employed Islington residents.
3 Professional driving qualifications range from those for large goods vehicles, public service vehicles such as buses, and fork-lift driving qualifications.
60
Figure 57: Islington residents in employment by qualification level
Source: Annual Population Surveys (NOMIS)
Figure 58 shows employment rates for Islington residents by qualification. The
proportion of employed Islington residents who are qualified to Level 4 and above
has fallen back from 77% in 2010 to 71% in 2016. In other words, the post-recession
recovery has benefitted lower qualified Islington residents, while having a lower
effect on the high-qualified.
The employment rate for high-qualified Islington residents has varied within a narrow
range, with the current level of 85% being in the centre of the range. As the working
age population at this qualification level has been growing, the number in work has
been growing in parallel. Given the smaller numbers in each lower qualification band,
there is a high degree of survey-related variability in the estimates provided.
Therefore, caution in attributing change to any particular cause is advisable.
The second highest employment rates are for those with other qualifications, with a
current employment rate of 60%. The fact that these qualifications may not fit within
the UK system is, in Islington, less of a barrier than having UK qualifications below
Level 4. The employment rates for people with intermediate qualifications fall in a
band where trends (for the small numbers of survey respondents) cannot be clearly
defined. There is some suggestion that (as with those with no qualifications) there
was a greater recession impact on the lower qualified than on the high qualified.
Some respondents with intermediate level qualifications will also be working while
studying for higher level qualifications.
61
The employment rate for the small number of working age respondents with no
qualifications is 30% in the latest figures. Data for qualification levels are only
available annually for complete calendar years. New estimates for 2017 are due to
be published in April 2018.
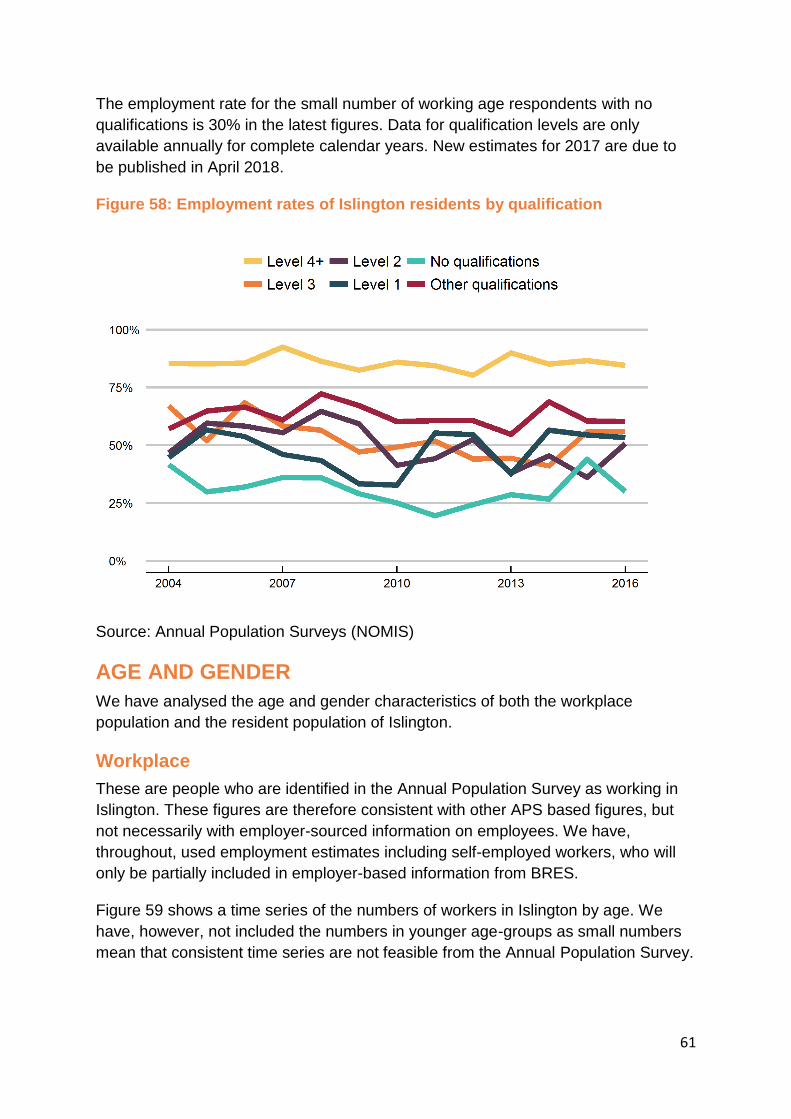
Figure 58: Employment rates of Islington residents by qualification
Source: Annual Population Surveys (NOMIS)
AGE AND GENDER
We have analysed the age and gender characteristics of both the workplace
population and the resident population of Islington.
Workplace
These are people who are identified in the Annual Population Survey as working in
Islington. These figures are therefore consistent with other APS based figures, but
not necessarily with employer-sourced information on employees. We have,
throughout, used employment estimates including self-employed workers, who will
only be partially included in employer-based information from BRES.
Figure 59 shows a time series of the numbers of workers in Islington by age. We
have, however, not included the numbers in younger age-groups as small numbers
mean that consistent time series are not feasible from the Annual Population Survey.
62
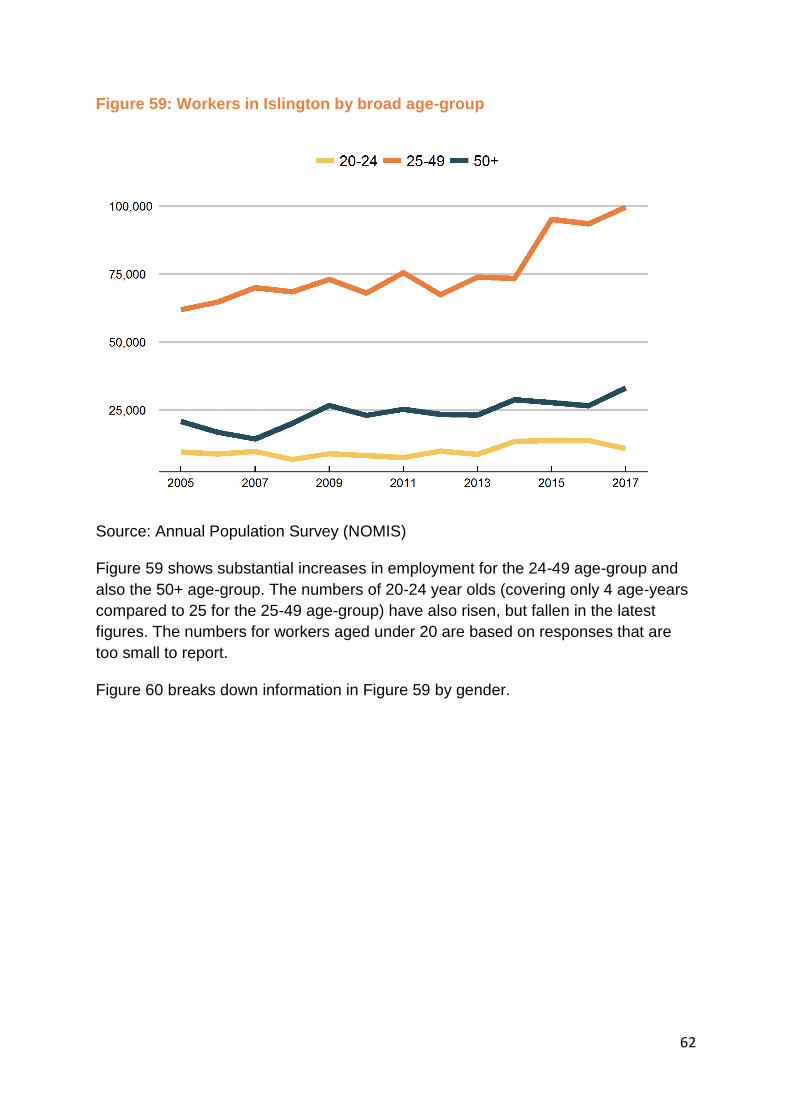
Figure 59: Workers in Islington by broad age-group
Source: Annual Population Survey (NOMIS)
Figure 59 shows substantial increases in employment for the 24-49 age-group and
also the 50+ age-group. The numbers of 20-24 year olds (covering only 4 age-years
compared to 25 for the 25-49 age-group) have also risen, but fallen in the latest
figures. The numbers for workers aged under 20 are based on responses that are
too small to report.
Figure 60 breaks down information in Figure 59 by gender.
63
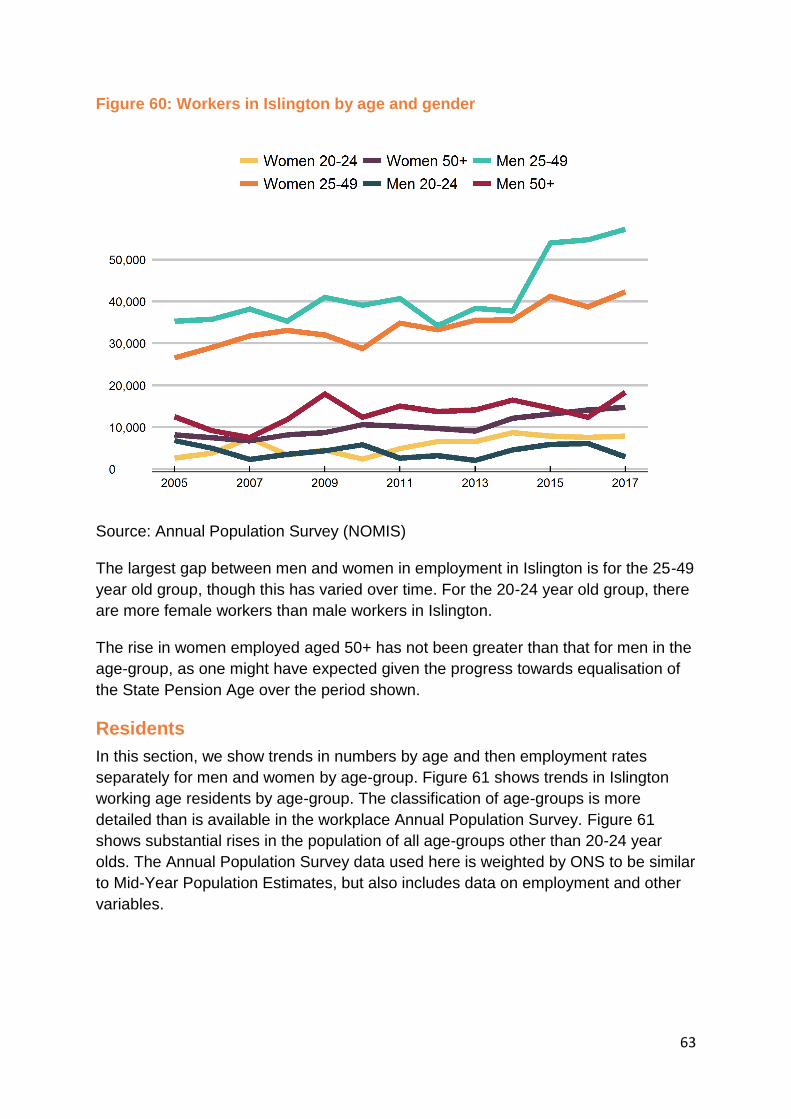
Figure 60: Workers in Islington by age and gender
Source: Annual Population Survey (NOMIS)
The largest gap between men and women in employment in Islington is for the 25-49
year old group, though this has varied over time. For the 20-24 year old group, there
are more female workers than male workers in Islington.
The rise in women employed aged 50+ has not been greater than that for men in the
age-group, as one might have expected given the progress towards equalisation of
the State Pension Age over the period shown.
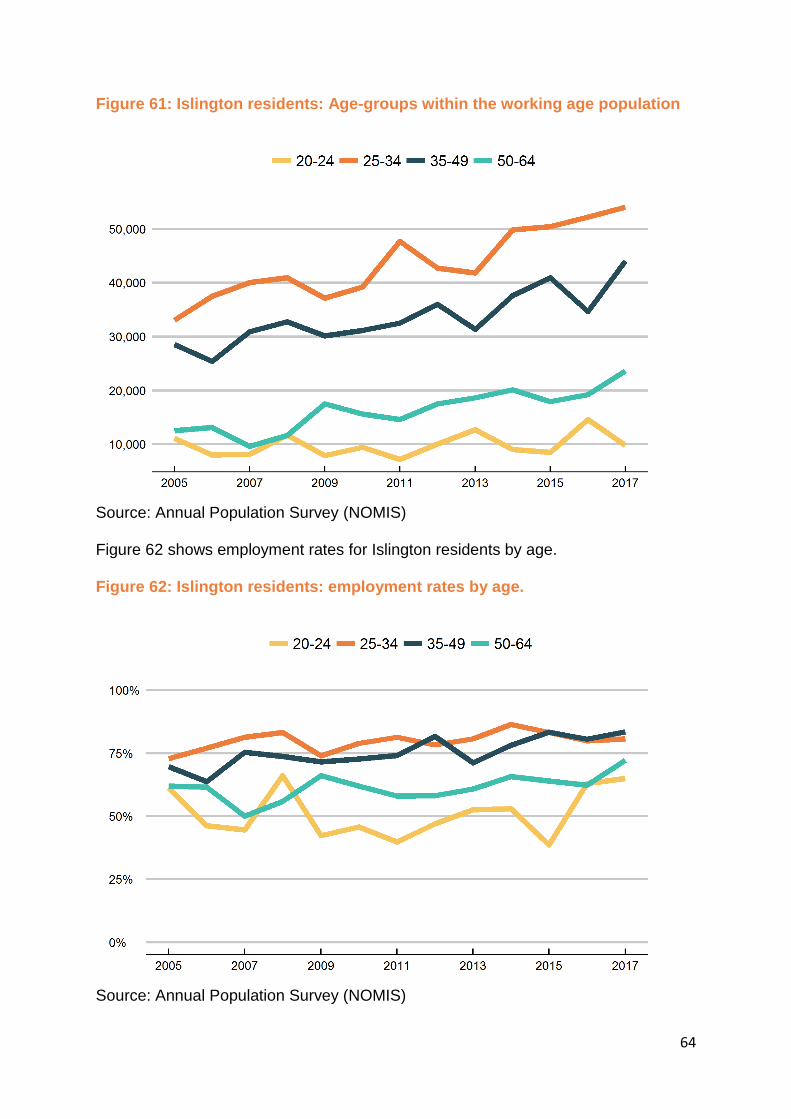
Residents
In this section, we show trends in numbers by age and then employment rates
separately for men and women by age-group. Figure 61 shows trends in Islington
working age residents by age-group. The classification of age-groups is more
detailed than is available in the workplace Annual Population Survey. Figure 61
shows substantial rises in the population of all age-groups other than 20-24 year
olds. The Annual Population Survey data used here is weighted by ONS to be similar
to Mid-Year Population Estimates, but also includes data on employment and other
variables.
64
Figure 61: Islington residents: Age-groups within the working age population
Source: Annual Population Survey (NOMIS)
Figure 62 shows employment rates for Islington residents by age.
Figure 62: Islington residents: employment rates by age.
Source: Annual Population Survey (NOMIS)
65
The employment rates for 25-34 year olds and for 35-49 year olds are similar, and
both show a rising trend over time, with little noticeable recession effect in 2008-09.
As with other analyses, groups with smaller numbers will be more affected by
random survey variation. Therefore, some caution in interpretation is advised. The
50-64 age group showed rising employment rates over the recession period, and
then continuing slow rises. This group will have been affected by the equalisation of
State Pension Age, as women who retired under age 65 will be shown as not in
employment, but be included in the denominator of the employment rate. The
employment rate for 20-24 year olds is lower, though has increased over the latest
two years shown. This group will include those in this age-group who are students. If
students are in paid work (minimum 1 hour a week) they will be shown as in
employment.
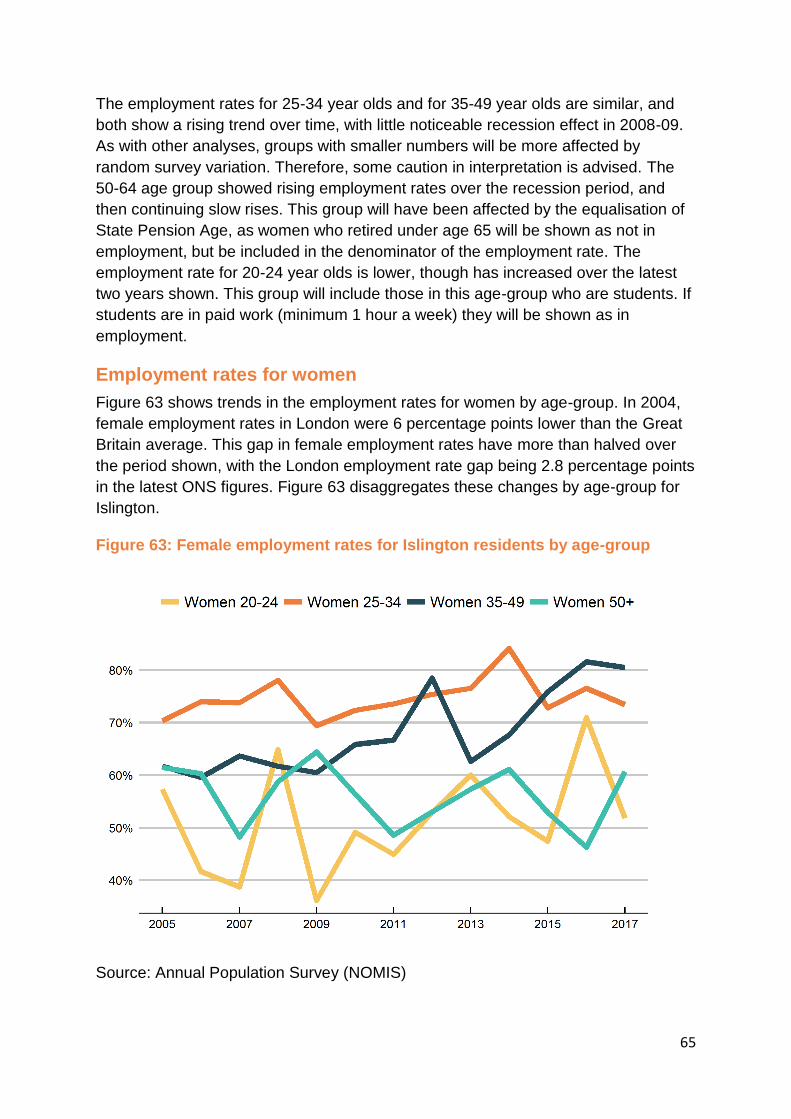
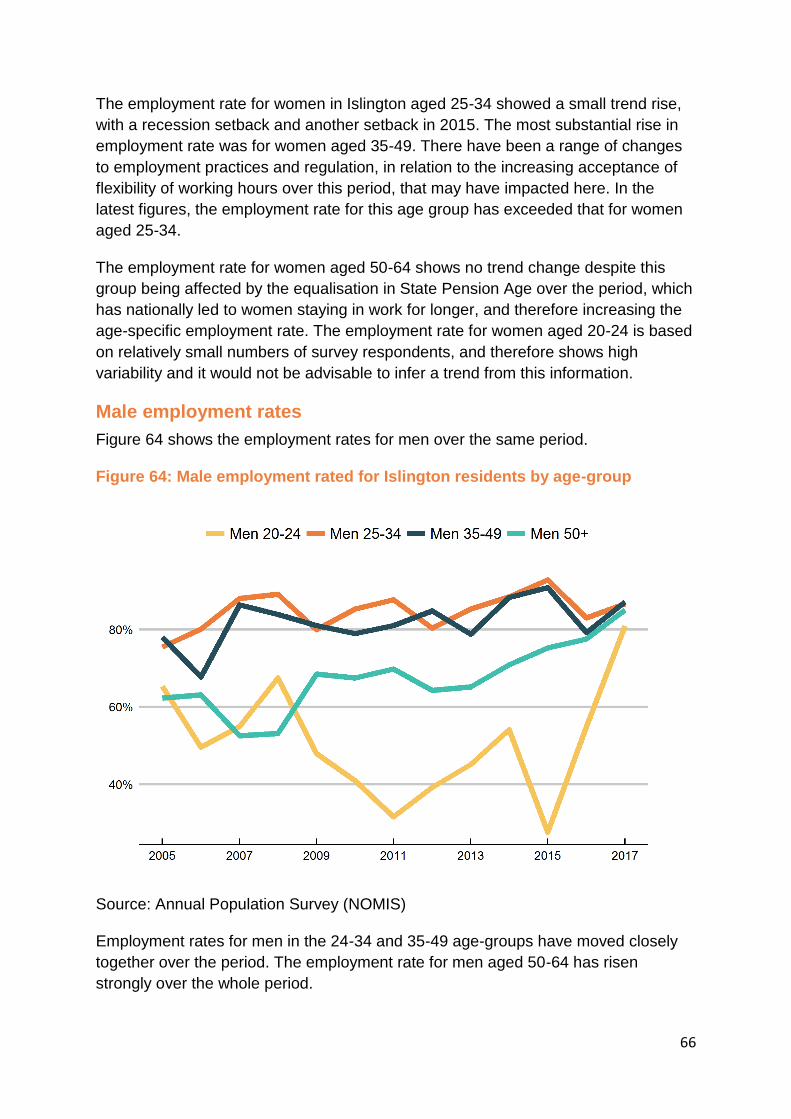
Employment rates for women
Figure 63 shows trends in the employment rates for women by age-group. In 2004,
female employment rates in London were 6 percentage points lower than the Great
Britain average. This gap in female employment rates have more than halved over
the period shown, with the London employment rate gap being 2.8 percentage points
in the latest ONS figures. Figure 63 disaggregates these changes by age-group for
Islington.
Figure 63: Female employment rates for Islington residents by age-group
Source: Annual Population Survey (NOMIS)
66
The employment rate for women in Islington aged 25-34 showed a small trend rise,
with a recession setback and another setback in 2015. The most substantial rise in
employment rate was for women aged 35-49. There have been a range of changes
to employment practices and regulation, in relation to the increasing acceptance of
flexibility of working hours over this period, that may have impacted here. In the
latest figures, the employment rate for this age group has exceeded that for women
aged 25-34.
The employment rate for women aged 50-64 shows no trend change despite this
group being affected by the equalisation in State Pension Age over the period, which
has nationally led to women staying in work for longer, and therefore increasing the
age-specific employment rate. The employment rate for women aged 20-24 is based
on relatively small numbers of survey respondents, and therefore shows high
variability and it would not be advisable to infer a trend from this information.
Male employment rates
Figure 64 shows the employment rates for men over the same period.
Figure 64: Male employment rated for Islington residents by age-group
Source: Annual Population Survey (NOMIS)
Employment rates for men in the 24-34 and 35-49 age-groups have moved closely
together over the period. The employment rate for men aged 50-64 has risen
strongly over the whole period.
67
The employment rates for 20-24 year old men are affected by survey variability,
being based on small numbers of respondents. The recent sharp rise, for example,
would not look so sharp if the 2015 estimate had been, for example, at the same
level as 2014.
ETHNICITY, COUNTRY OF BIRTH AND NATIONALITY
This section first examines numbers and employment rates for each breakdown that
is feasible using the Annual Population Survey (APS) for Islington. We have
examined whether or not we could report APS statistics by more detailed ethnicity
grouping than we have done, but concluded that the numbers of survey respondents
in Islington in the more detailed analyses are not sufficient for us to have any
confidence in the estimates. Instead we look at data from the 2011 Census to obtain
a more detailed albeit dated picture. We have therefore used APS data that is
sufficiently robust to enable a triangulation of the picture using information on
ethnicity and gender, ethnicity and country of birth and ethnicity and nationality. In
each case the ethnicity dimension is a two-level classification of White and BAME,
and for country of birth and nationality the breakdowns are UK/Non-UK.
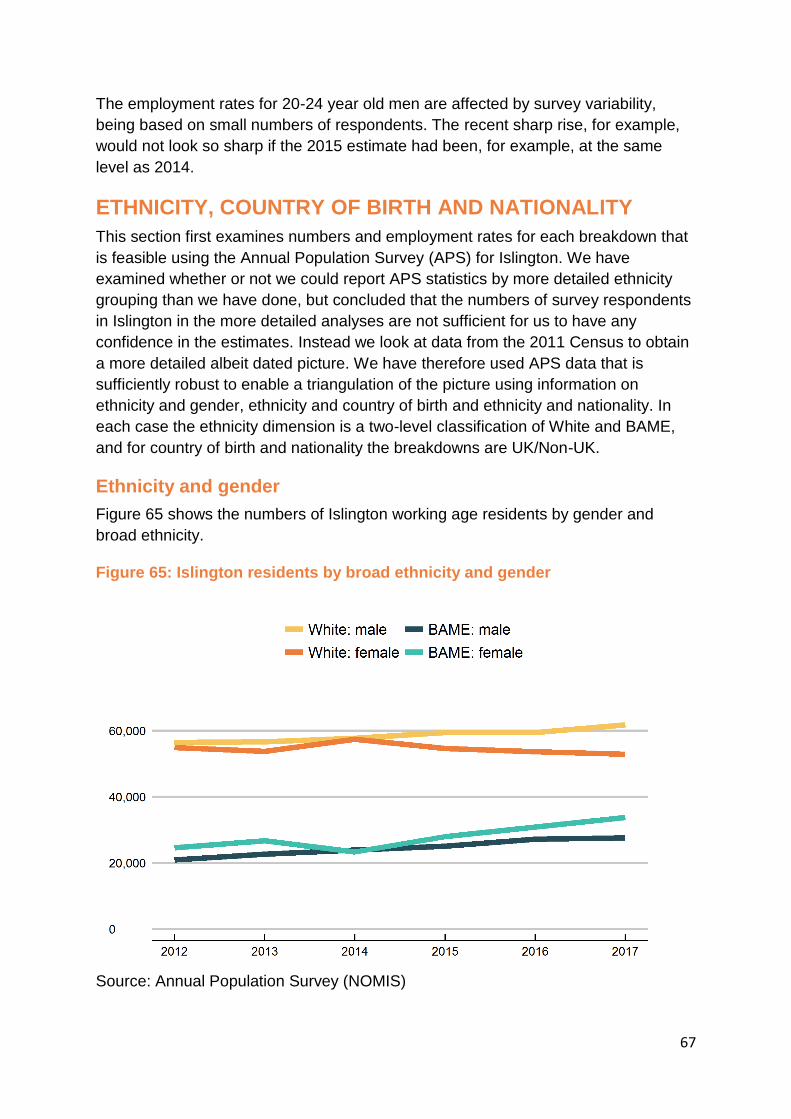
Ethnicity and gender
Figure 65 shows the numbers of Islington working age residents by gender and
broad ethnicity.
Figure 65: Islington residents by broad ethnicity and gender
Source: Annual Population Survey (NOMIS)
68
Figure 65 shows that there are substantially more white working age residents in
Islington than BAME residents, but the numbers of BAME residents have been
rising.
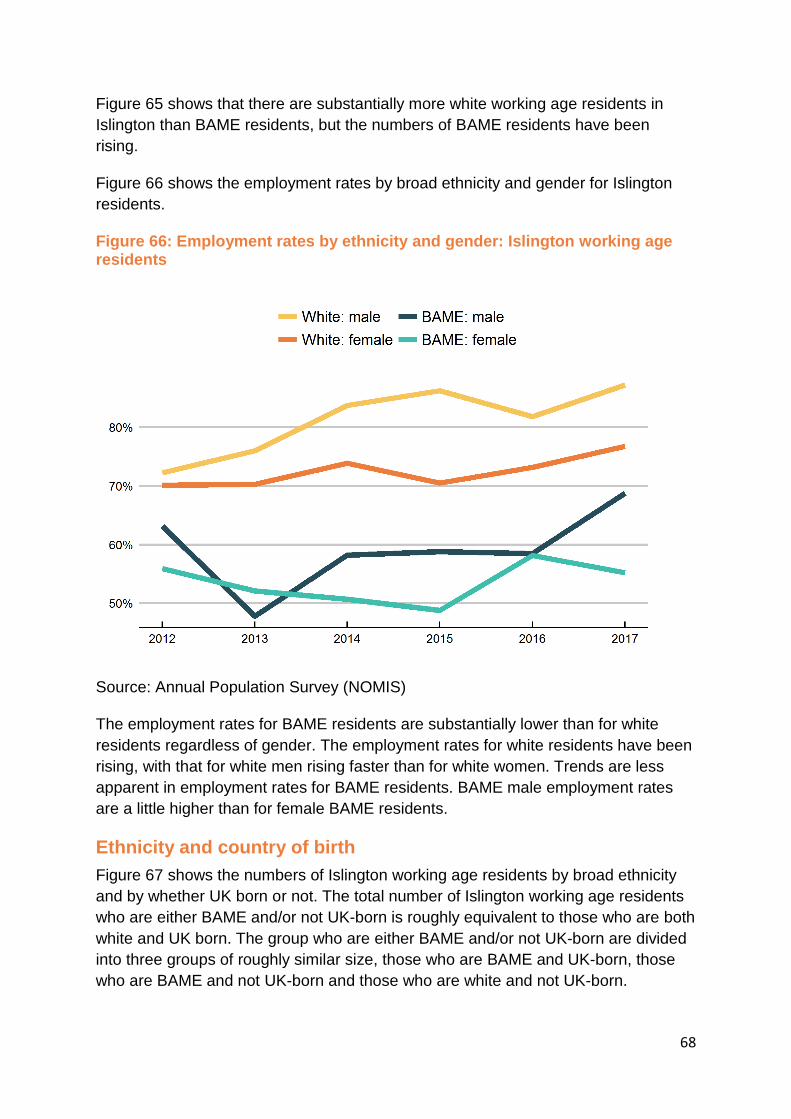
Figure 66 shows the employment rates by broad ethnicity and gender for Islington
residents.
Figure 66: Employment rates by ethnicity and gender: Islington working age residents
Source: Annual Population Survey (NOMIS)
The employment rates for BAME residents are substantially lower than for white
residents regardless of gender. The employment rates for white residents have been
rising, with that for white men rising faster than for white women. Trends are less
apparent in employment rates for BAME residents. BAME male employment rates
are a little higher than for female BAME residents.
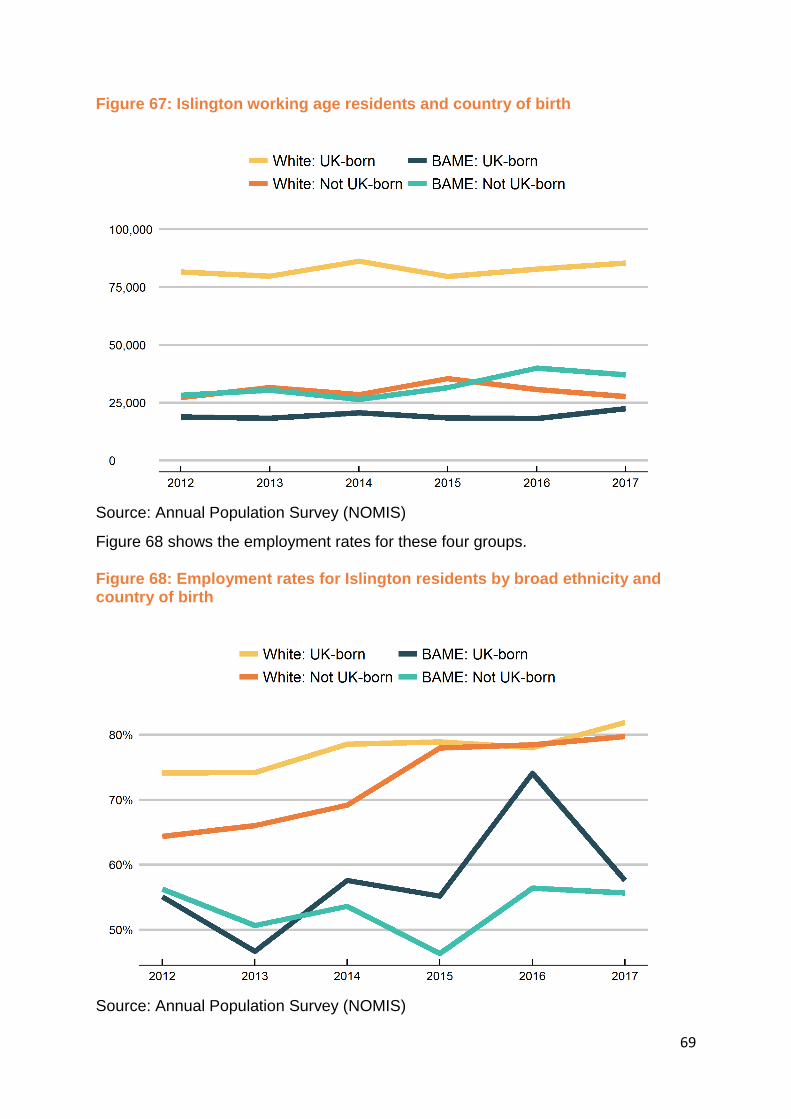
Ethnicity and country of birth
Figure 67 shows the numbers of Islington working age residents by broad ethnicity
and by whether UK born or not. The total number of Islington working age residents
who are either BAME and/or not UK-born is roughly equivalent to those who are both
white and UK born. The group who are either BAME and/or not UK-born are divided
into three groups of roughly similar size, those who are BAME and UK-born, those
who are BAME and not UK-born and those who are white and not UK-born.
69
Figure 67: Islington working age residents and country of birth
Source: Annual Population Survey (NOMIS)
Figure 68 shows the employment rates for these four groups.
Figure 68: Employment rates for Islington residents by broad ethnicity and country of birth
Source: Annual Population Survey (NOMIS)

70
The employment rates for white residents are closely similar regardless of the
country of birth, while the same applies to BAME residents. The employment rates
for UK-born BAME working-age residents, while highly variable likely due to survey
variations, are, in the latest figures, not significantly different from those for BAME
residents who are not UK-born.
Ethnicity and nationality
At the Islington level, it is not possible to use data on detailed nationality. Figure 69
shows the numbers of working-age residents in Islington by broad ethnicity and
broad nationality.
Figure 69: Islington working age residents by ethnicity and nationality
Source: Annual Population Survey (NOMIS)
The numbers of BAME UK nationals are slightly higher than those for either white
non-UK nationals or BAME non-UK nationals. Figure 70 shows the employment
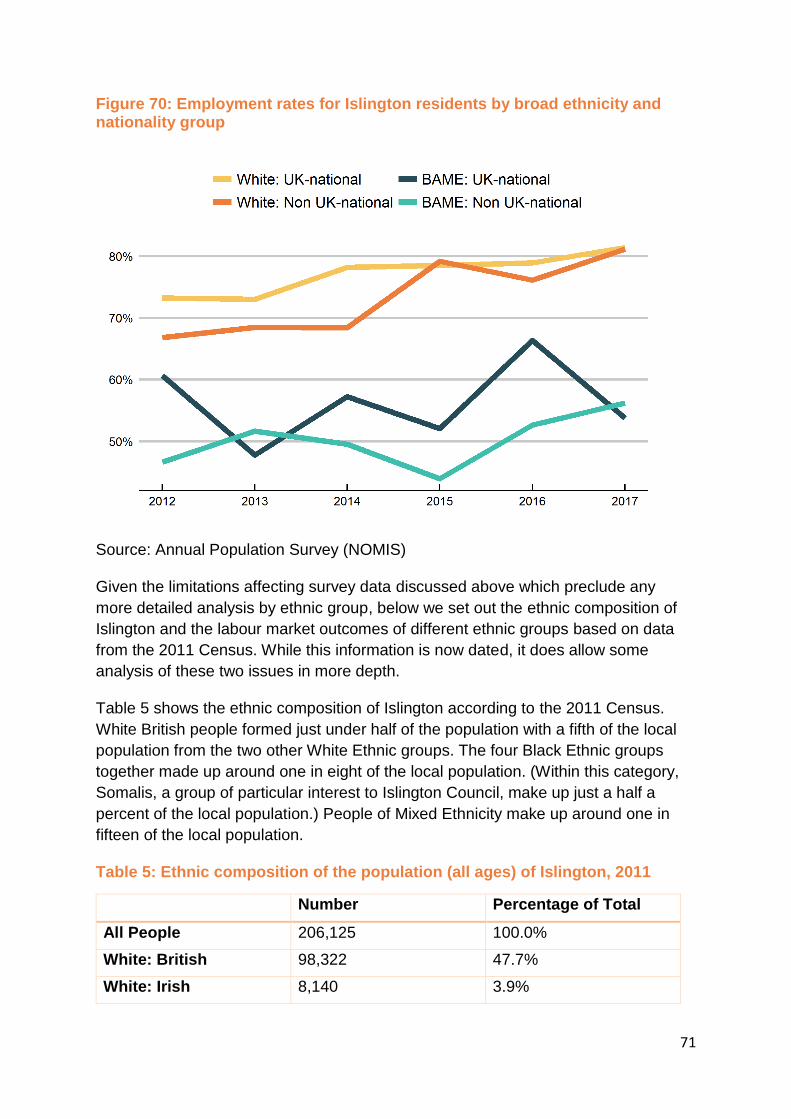
rates for these groups.
The employment rates by nationality group show very much the same picture as we
have seen previously, with the possible exception that in most years, the
employment rate for BAME Islington residents who are UK nationals is slightly above
that for BAME Islington residents who are not UK nationals. However, these changes
and differences between the BAME groups may not be significantly different, given
the relatively small survey samples available.
71
Figure 70: Employment rates for Islington residents by broad ethnicity and nationality group
Source: Annual Population Survey (NOMIS)
Given the limitations affecting survey data discussed above which preclude any
more detailed analysis by ethnic group, below we set out the ethnic composition of
Islington and the labour market outcomes of different ethnic groups based on data
from the 2011 Census. While this information is now dated, it does allow some
analysis of these two issues in more depth.
Table 5 shows the ethnic composition of Islington according to the 2011 Census.
White British people formed just under half of the population with a fifth of the local
population from the two other White Ethnic groups. The four Black Ethnic groups
together made up around one in eight of the local population. (Within this category,
Somalis, a group of particular interest to Islington Council, make up just a half a
percent of the local population.) People of Mixed Ethnicity make up around one in
fifteen of the local population.
Table 5: Ethnic composition of the population (all ages) of Islington, 2011
Number Percentage of Total
All People 206,125 100.0%
White: British 98,322 47.7%
White: Irish 8,140 3.9%
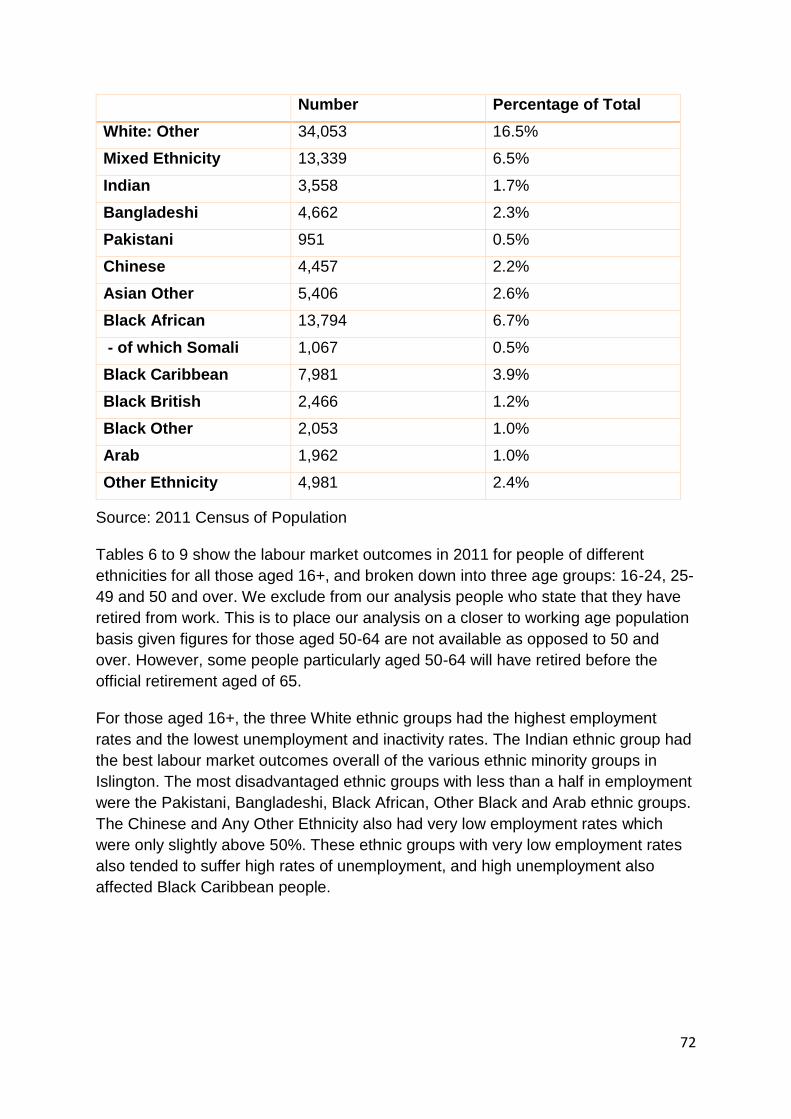
72
Number Percentage of Total
White: Other 34,053 16.5%
Mixed Ethnicity 13,339 6.5%
Indian 3,558 1.7%
Bangladeshi 4,662 2.3%
Pakistani 951 0.5%
Chinese 4,457 2.2%
Asian Other 5,406 2.6%
Black African 13,794 6.7%
- of which Somali 1,067 0.5%
Black Caribbean 7,981 3.9%
Black British 2,466 1.2%
Black Other 2,053 1.0%
Arab 1,962 1.0%
Other Ethnicity 4,981 2.4%
Source: 2011 Census of Population
Tables 6 to 9 show the labour market outcomes in 2011 for people of different
ethnicities for all those aged 16+, and broken down into three age groups: 16-24, 25-
49 and 50 and over. We exclude from our analysis people who state that they have
retired from work. This is to place our analysis on a closer to working age population
basis given figures for those aged 50-64 are not available as opposed to 50 and
over. However, some people particularly aged 50-64 will have retired before the
official retirement aged of 65.
For those aged 16+, the three White ethnic groups had the highest employment
rates and the lowest unemployment and inactivity rates. The Indian ethnic group had
the best labour market outcomes overall of the various ethnic minority groups in
Islington. The most disadvantaged ethnic groups with less than a half in employment
were the Pakistani, Bangladeshi, Black African, Other Black and Arab ethnic groups.
The Chinese and Any Other Ethnicity also had very low employment rates which
were only slightly above 50%. These ethnic groups with very low employment rates
also tended to suffer high rates of unemployment, and high unemployment also
affected Black Caribbean people.
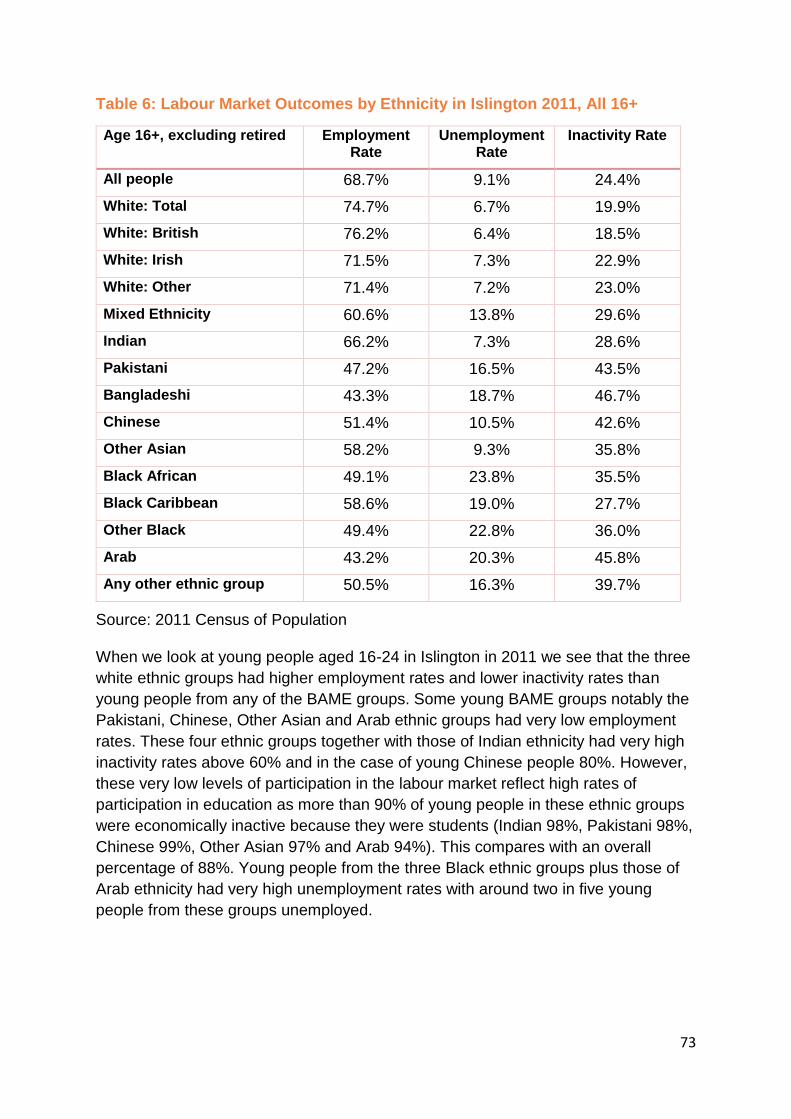
73
Table 6: Labour Market Outcomes by Ethnicity in Islington 2011, All 16+
Age 16+, excluding retired Employment Rate
Unemployment Rate
Inactivity Rate
All people 68.7% 9.1% 24.4%
White: Total 74.7% 6.7% 19.9%
White: British 76.2% 6.4% 18.5%
White: Irish 71.5% 7.3% 22.9%
White: Other 71.4% 7.2% 23.0%
Mixed Ethnicity 60.6% 13.8% 29.6%
Indian 66.2% 7.3% 28.6%
Pakistani 47.2% 16.5% 43.5%
Bangladeshi 43.3% 18.7% 46.7%
Chinese 51.4% 10.5% 42.6%
Other Asian 58.2% 9.3% 35.8%
Black African 49.1% 23.8% 35.5%
Black Caribbean 58.6% 19.0% 27.7%
Other Black 49.4% 22.8% 36.0%
Arab 43.2% 20.3% 45.8%
Any other ethnic group 50.5% 16.3% 39.7%
Source: 2011 Census of Population
When we look at young people aged 16-24 in Islington in 2011 we see that the three
white ethnic groups had higher employment rates and lower inactivity rates than
young people from any of the BAME groups. Some young BAME groups notably the
Pakistani, Chinese, Other Asian and Arab ethnic groups had very low employment
rates. These four ethnic groups together with those of Indian ethnicity had very high
inactivity rates above 60% and in the case of young Chinese people 80%. However,
these very low levels of participation in the labour market reflect high rates of
participation in education as more than 90% of young people in these ethnic groups
were economically inactive because they were students (Indian 98%, Pakistani 98%,
Chinese 99%, Other Asian 97% and Arab 94%). This compares with an overall
percentage of 88%. Young people from the three Black ethnic groups plus those of
Arab ethnicity had very high unemployment rates with around two in five young
people from these groups unemployed.

74
Table 7: Labour Market Outcomes by Ethnicity in Islington 2011, Aged 16-24
Age 16 to 24, excluding retired
Employment Rate
Unemployment Rate
Inactivity Rate
All people 40.3% 22.2% 48.2%
White: Total 48.6% 16.8% 41.6%
White: British 52.6% 15.6% 37.6%
White: Irish 51.5% 16.6% 38.2%
White: Other 36.6% 21.3% 53.5%
Mixed Ethnicity 36.6% 27.4% 49.6%
Indian 29.0% 21.3% 63.1%
Pakistani 23.8% 29.1% 66.4%
Bangladeshi 33.8% 34.1% 48.7%
Chinese 13.7% 31.1% 80.1%
Other Asian 21.0% 30.6% 69.7%
Black African 27.3% 41.7% 53.2%
Black Caribbean 33.3% 40.8% 43.8%
Other Black 27.7% 37.0% 55.9%
Arab 18.3% 42.5% 68.3%
Any other ethnic group 27.3% 32.4% 59.6%
Source: 2011 Census of Population
For those of prime age, 25-49, the three white ethnic groups again have relatively
high employment rates and relatively low unemployment and inactivity rates.
However, people of Indian ethnicity in this age group had slightly better labour
market outcomes than the three white groups, and were the group with the most
favourable labour market outcomes. People of Chinese ethnicity also had relatively
favourable labour market outcomes compared to other BAME groups. In this age
group, five groups stand out as having relatively low employment rates (below 60%):
Bangladeshis, Black Africans, people of Other Black ethnicity, Arabs and people
from the Any Other Ethnic Group. The three Black ethnic groups and Arabs all
suffered unemployment rates more than double the overall rate for this age group.
Two groups, Bangladeshis and Arabs, stand out as having particularly high inactivity
rates with around two in five from these groups not participating in the labour market.
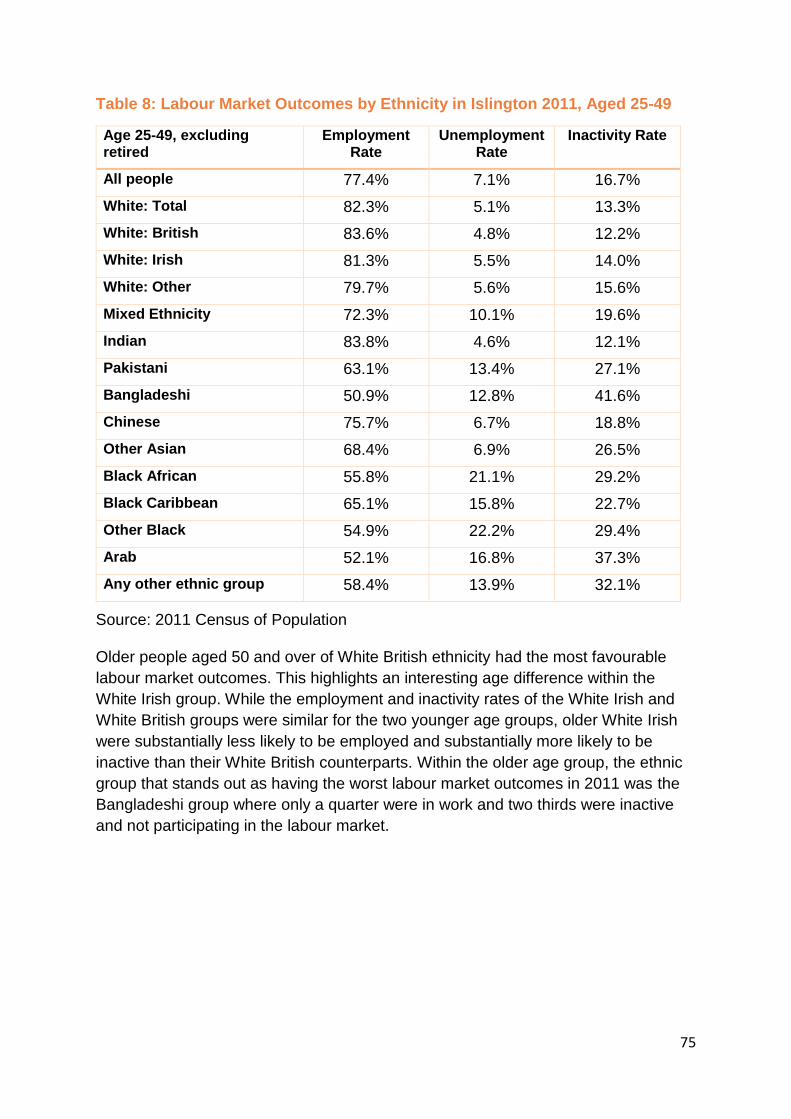
75
Table 8: Labour Market Outcomes by Ethnicity in Islington 2011, Aged 25-49
Age 25-49, excluding retired
Employment Rate
Unemployment Rate
Inactivity Rate
All people 77.4% 7.1% 16.7%
White: Total 82.3% 5.1% 13.3%
White: British 83.6% 4.8% 12.2%
White: Irish 81.3% 5.5% 14.0%
White: Other 79.7% 5.6% 15.6%
Mixed Ethnicity 72.3% 10.1% 19.6%
Indian 83.8% 4.6% 12.1%
Pakistani 63.1% 13.4% 27.1%
Bangladeshi 50.9% 12.8% 41.6%
Chinese 75.7% 6.7% 18.8%
Other Asian 68.4% 6.9% 26.5%
Black African 55.8% 21.1% 29.2%
Black Caribbean 65.1% 15.8% 22.7%
Other Black 54.9% 22.2% 29.4%
Arab 52.1% 16.8% 37.3%
Any other ethnic group 58.4% 13.9% 32.1%
Source: 2011 Census of Population
Older people aged 50 and over of White British ethnicity had the most favourable
labour market outcomes. This highlights an interesting age difference within the
White Irish group. While the employment and inactivity rates of the White Irish and
White British groups were similar for the two younger age groups, older White Irish
were substantially less likely to be employed and substantially more likely to be
inactive than their White British counterparts. Within the older age group, the ethnic
group that stands out as having the worst labour market outcomes in 2011 was the
Bangladeshi group where only a quarter were in work and two thirds were inactive
and not participating in the labour market.

76
Table 9: Labour Market Outcomes by Ethnicity in Islington 2011, Aged 50+
Age 50 and over, excluding retired
Employment Rate
Unemployment Rate
Inactivity Rate
All people 67.2% 7.6% 27.3%
White: Total 70.2% 6.3% 25.1%
White: British 72.7% 5.8% 22.8%
White: Irish 59.8% 8.9% 34.3%
White: Other 64.8% 7.0% 30.3%
Mixed Ethnicity 60.7% 10.8% 31.9%
Indian 63.6% 7.5% 31.2%
Pakistani 51.9% 8.9% 43.0%
Bangladeshi 26.6% 17.1% 67.9%
Chinese 61.8% 12.0% 29.7%
Other Asian 65.0% 7.9% 29.4%
Black African 59.1% 14.9% 30.5%
Black Caribbean 62.0% 14.4% 27.6%
Other Black 55.0% 10.3% 38.6%
Arab 48.0% 14.4% 43.9%
Any other ethnic group 51.4% 11.5% 41.9%
4. ENTRY LEVEL DEMAND
Since vacancy data on entry level occupations is no longer publicly available since
the closure of Jobcentre Plus vacancy systems, we have sourced information on the
patterns of entry level recruitment from jobs filled using Labour Force Survey
microdata. We have identified jobs filled by occupation using the latest eight
Quarterly Labour Force Survey datasets, covering two full years of job starts.
We have done this at a London level, because the Office for National Statistics no
longer makes more detailed statistics available on those working in Central London,
Inner and Outer London. This decision is, we consider, a sensible one, because the
latest eight datasets only give us a total of 789 respondents who started a job in
London as a whole in the lowest six (out of nine) major occupation groups, over two
years.
77
These 789 respondents provide just enough to enable us to identify the major
features of recruitment for these occupations at the London level. If we had halved
(or so) the number of respondents by looking at Central and Inner London, then the
robustness of any conclusions reached would be substantially lower, and
insufficiently robust to provide guidance to policy-makers.
Job starts4 are defined as a person starting a job regardless of whether they were
previously in work. They are based on people who are in a job and started that job
within the last three months.
JOB STARTS IN LONDON BY OCCUPATION GROUP
Figure 71 shows the weighted estimates for job starts in London for major
occupation groups, with confidence intervals. It should be noted that even at the
London level, the confidence intervals at this level of occupation grouping are quite
wide.
Figure 71:
Figure 71 shows that the average numbers of job starts vary widely even at major
occupation group level. Some of these differences exist because some occupations
have high-turnover characteristics. These include jobs in the elementary occupations
group as well as jobs in sales and customer services and in caring and leisure
4 In presentation of numbers, we have used the Office for National Statistics’ grossing weights that
they use to match the responses to population levels. As these are grossed to the population within a single dataset, we have divided these by the number of datasets (eight) to give a set of numbers that would (across the UK) correspond to current numbers of job starts, in a single quarter.
78
occupations. The numbers of job starts in London for both process, plant and
machine operators – in London, these are mostly driving jobs, and skilled trades
occupations are relatively small.
Figure 72 extends this analysis by examining job starts by three-digit occupation
group, again, across London as a whole, and averaged to a single quarter’s
recruitment flow. There will be seasonal variations in recruitment (such as retail and
logistics around the Christmas season) that will affect flows in individual quarters.
Figure 72 shows that recruitment within most of the major occupation groups is
concentrated within a few detailed occupations. Among elementary occupations,
recruitment is concentrated in ‘elementary services occupations’ such as shelf-
stacking, baristas, waiting and catering assistant jobs in restaurants, and suchlike.
This is followed at a considerable distance by cleaning jobs and elementary
construction jobs (construction labouring). Among process, plant and machine
operatives, the only noticeable occupation is road transport drivers. For sales and
customer service occupations, the major recruitment is for sales assistants and retail
cashiers. For caring, leisure etc. occupations, the major recruiters in London were
caring personal services – social care occupations and childcare and related.
Notably, recruitment of hairdressers, included in this group, is relatively small.
Among the skilled trades group, although there are relatively small numbers of
recruits, the largest occupation is food preparation and hospitality trades – chefs and
cooks. This is followed by two groups of construction-related trades, construction
trades themselves and electricians. For administrative and clerical jobs, the
recruitment pattern appears more diverse. However, the occupational classification
here may be more difficult for users to classify people between secretarial and other
administrative roles. Finance related clerical jobs are more distinct. Higher level
administrative roles may have been redefined as ‘associate professional’ – such as
accountancy technicians and are not included in this analysis.
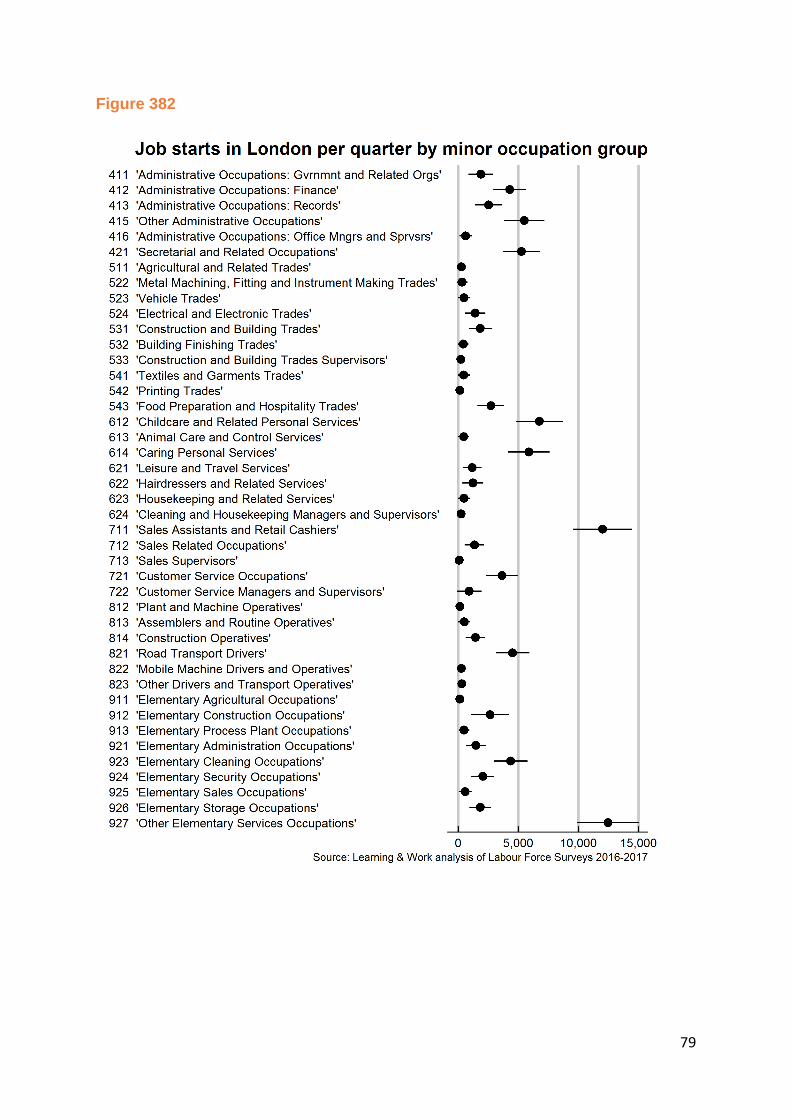
79
Figure 382
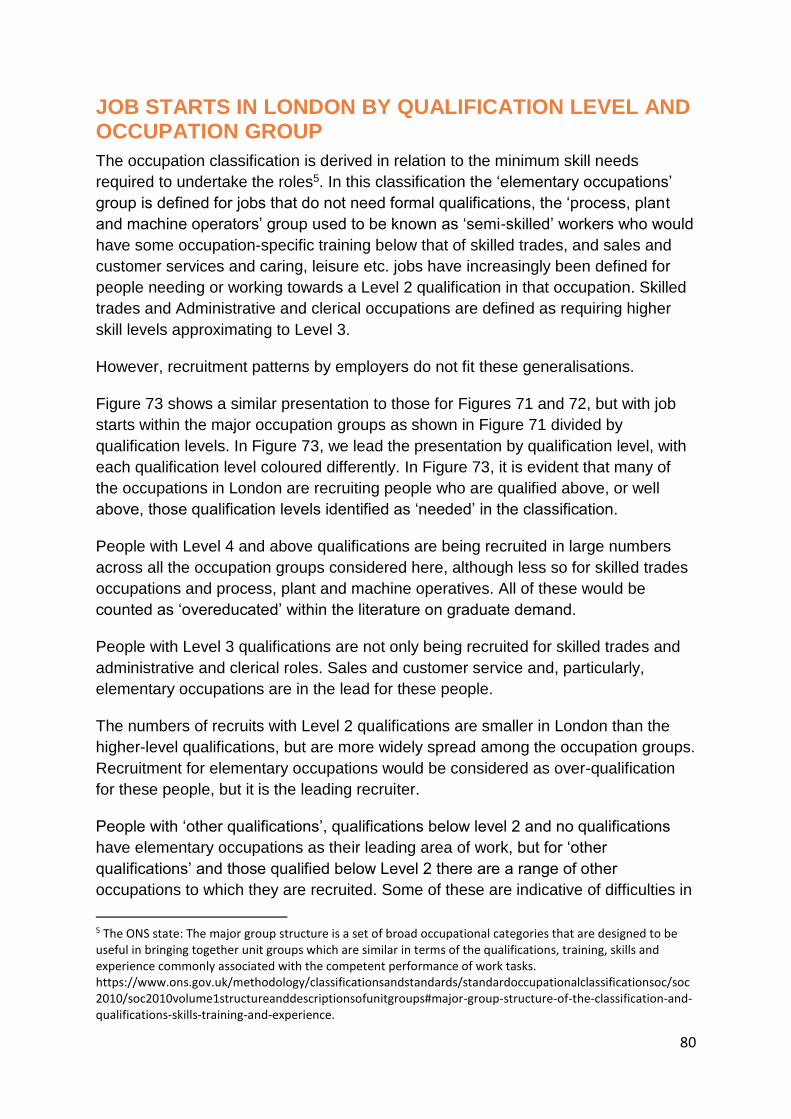
80
JOB STARTS IN LONDON BY QUALIFICATION LEVEL AND OCCUPATION GROUP
The occupation classification is derived in relation to the minimum skill needs
required to undertake the roles5. In this classification the ‘elementary occupations’
group is defined for jobs that do not need formal qualifications, the ‘process, plant
and machine operators’ group used to be known as ‘semi-skilled’ workers who would
have some occupation-specific training below that of skilled trades, and sales and
customer services and caring, leisure etc. jobs have increasingly been defined for
people needing or working towards a Level 2 qualification in that occupation. Skilled
trades and Administrative and clerical occupations are defined as requiring higher
skill levels approximating to Level 3.
However, recruitment patterns by employers do not fit these generalisations.
Figure 73 shows a similar presentation to those for Figures 71 and 72, but with job
starts within the major occupation groups as shown in Figure 71 divided by
qualification levels. In Figure 73, we lead the presentation by qualification level, with
each qualification level coloured differently. In Figure 73, it is evident that many of
the occupations in London are recruiting people who are qualified above, or well
above, those qualification levels identified as ‘needed’ in the classification.
People with Level 4 and above qualifications are being recruited in large numbers
across all the occupation groups considered here, although less so for skilled trades
occupations and process, plant and machine operatives. All of these would be
counted as ‘overeducated’ within the literature on graduate demand.
People with Level 3 qualifications are not only being recruited for skilled trades and
administrative and clerical roles. Sales and customer service and, particularly,
elementary occupations are in the lead for these people.
The numbers of recruits with Level 2 qualifications are smaller in London than the
higher-level qualifications, but are more widely spread among the occupation groups.
Recruitment for elementary occupations would be considered as over-qualification
for these people, but it is the leading recruiter.
People with ‘other qualifications’, qualifications below level 2 and no qualifications
have elementary occupations as their leading area of work, but for ‘other
qualifications’ and those qualified below Level 2 there are a range of other
occupations to which they are recruited. Some of these are indicative of difficulties in
5 The ONS state: The major group structure is a set of broad occupational categories that are designed to be useful in bringing together unit groups which are similar in terms of the qualifications, training, skills and experience commonly associated with the competent performance of work tasks. https://www.ons.gov.uk/methodology/classificationsandstandards/standardoccupationalclassificationsoc/soc2010/soc2010volume1structureanddescriptionsofunitgroups#major-group-structure-of-the-classification-and-qualifications-skills-training-and-experience.

81
classifying either occupations or qualifications – skilled trades are defined as
needing a qualification, but this does not seem to be the practice in the data.
Figure 73
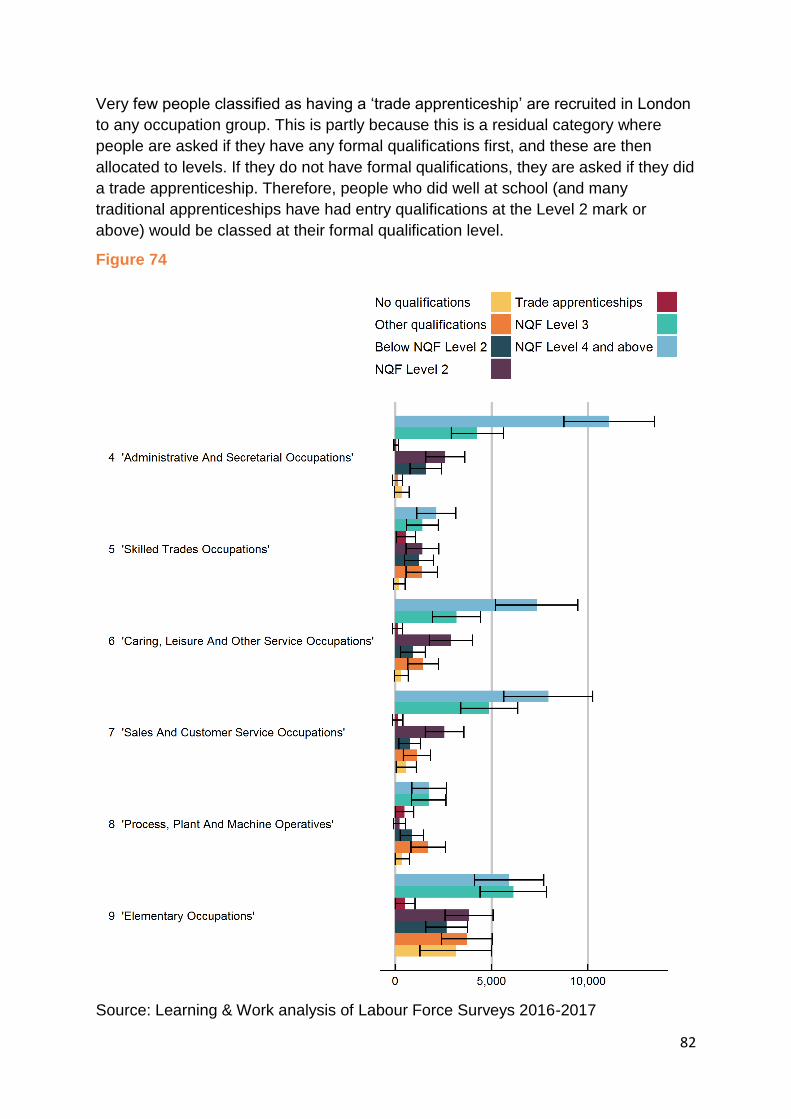
82
Very few people classified as having a ‘trade apprenticeship’ are recruited in London
to any occupation group. This is partly because this is a residual category where
people are asked if they have any formal qualifications first, and these are then
allocated to levels. If they do not have formal qualifications, they are asked if they did
a trade apprenticeship. Therefore, people who did well at school (and many
traditional apprenticeships have had entry qualifications at the Level 2 mark or
above) would be classed at their formal qualification level.
Figure 74
Source: Learning & Work analysis of Labour Force Surveys 2016-2017
83
Figure 74 shows similar information but presented in a bar chart, with the occupation
group taking the lead in the presentation. As there are relatively wide confidence
intervals around these numbers, we present the confidence intervals around the
bars. For all occupation groups other than elementary occupations, the largest
number of recruits were those with Level 4 and above qualifications (including
graduates).
For elementary occupations, the largest recruitment group was those with Level 3
and above, which was just ahead of the Level 4 and up group. Given that elementary
occupations do not require any qualifications, the fact that both the Level 3 and Level
4 and up groups are far ahead of the next may be a surprise. However, students who
are working at this level while undertaking their studies (or in holidays) would count
as Level 3 (undergraduates) or Level 4 (postgraduates).
For Process, plant and machine operatives, which, as we have seen, are largely
drivers in London, having at least an ‘Other qualification’ would be appropriate.
However, there are many with Level 3 or Level 4 qualifications securing work at this
level. Couriers, depending on the method of transport, could be either in ‘road
transport drivers’ here, or in elementary occupations.
Sales and customer services occupation recruiting in London is dominated by people
qualified to Level 3 and above. There is, however, a sizeable number qualified to
level 2, which may be appropriate given the skill demands.
For caring occupations, there are regulatory requirements and recommendations
towards moving towards a higher qualified workforce. This may affect the recruitment
pattern.
For administrative and clerical occupations, employers are recruiting people with
Level 4 and above qualifications as well as those with appropriate level
qualifications.
Discussion
It is evident that the pattern of recruitment to jobs that do not formally require high
qualifications in London is dominated by highly qualified individuals, most of whom
would be counted as ‘over-qualified’ or ‘over-educated’.
One group of these are students who are working below their qualification level while
continuing their education. It will also include numbers of those who have recently
completed their qualification who have not yet gained a ‘career job’ and are
continuing with a ‘student job’ while applying for more appropriate careers.
A second group is people (largely women) who are working part-time below their
qualification level because people are not recruited to their previous career on a part-
time basis. While part-time working or other forms of flexible hours are increasingly
84
available, the numbers tend to be dominated by people who have continuing
employment, and have reduced their hours rather than taken a career break and
sought to return on a part-time basis.
For Islington, these different reasons may play out differently across London. Our
figures are based on recruitment on a London basis, and the available data does not
permit defining this more closely while using only relatively timely information. We
would expect student recruitment to lower level jobs to be based close to where
student populations live, or close to higher or further education institutions. For
people working part-time below their skill levels, we would expect this pattern to
occur close to areas where such people live. A major issue for part-time working in
London is simply travel time, and a commute of a normal London length of 35-45
minutes would cut quite sharply into available working time if that is limited by needs
to drop off and pick up children from school. This is not the case in other parts of the
country where 15-minute commutes are more usual.
Therefore, we caution that forecasts based on occupation growth and replacement
demand for lower level occupations may well, in Islington, be filled by people who
are qualified well above the appropriate level. This pattern will vary across the
Borough by both the pattern of jobs and where students and people looking to work
part-time around families live.
5. 19+ LEARNING PROVISION AND
ACHIEVEMENTS
In this section we analyse the National Achievement Rate Tables produced by the
Department for Education and its predecessors for 19+ provision within the Further
Education system. This includes provision by a range of providers, but will not
include wholly private sector provision that has no public funding. It does include
‘Specialist Colleges’ such as the Worker’s Educational Association, and adult
provision by Islington Borough Council (as Other Public Sector).
The information about delivery either to Islington residents or inside Islington is
limited, so we have in some cases used information on the profile rather than
number of delivery or achievements by providers that deliver in Islington or to
Islington residents. We assume that the pattern of delivery is similar for Islington
residents.
In particular, for private sector public funded providers, we have taken those that
deliver in Islington and show the profile of their delivery, which may (and was, in the
case of Learndirect), national. For institutions that the DfE classify as Specialist
Colleges, we have taken those that deliver in the Central London boroughs and
85
show their profile, as we have no direct knowledge about their delivery to Islington
residents.
In the information from DfE, there is information on the numbers of learners and the
achievement rate. The achievement rate is comprised of two elements, the retention
rate (those completed the course and took the qualification) and the pass rate (those
who took the qualification and who passed it). We have calculated the number of
achievements from this information and used this in our analysis of the contribution
of 19+ provision to skill needs in Islington.
We have analysed the information on ‘Education and Training’ in these tables, rather
than the completely separate information on Apprenticeships. Therefore, we should
note that some of the decline over time in provision and achievements may have
been replacement by provision badged as Apprenticeships.
We have also, as requested, analysed 19+ achievements and provision. This has an
impact on the patterns shown as the provision analysed would have attracted
funding either by the Adult Education Budget, by Adult Learner Loans, or through
Jobcentre Plus contracted provision, or similar. Adult Education Budget and
Jobcentre Plus provision is concentrated on basic skill needs, so a consequence of
the funding arrangements is that provision is concentrated on learning aims
(courses) categorised as below National Qualification Framework Level 2. Higher
level qualifications are fundable through FE Adult Learner Loans, but there is little
sign of any success of these loans in this data. Learning & Work has previously both
commented on the substantial underspends in the Adult Learner Loans budget and
worked to try to understand and promote such higher-level learning in London6.
LEARNING PROVISION OVER TIME
Figure 75 shows the numbers of 19+ learners who had been funded in Islington over
the three years to 2015/17. The data for the 2016/17 educational year is expected in
late March 2018. It shows a fall from 22,000 in 2013/14 down to 10,660 in 2015/16,
or approximately a halving of provision.
.
6 See for example: Ambition London. http://www.learningandwork.org.uk/our-work/work-and-careers/ambition-london/
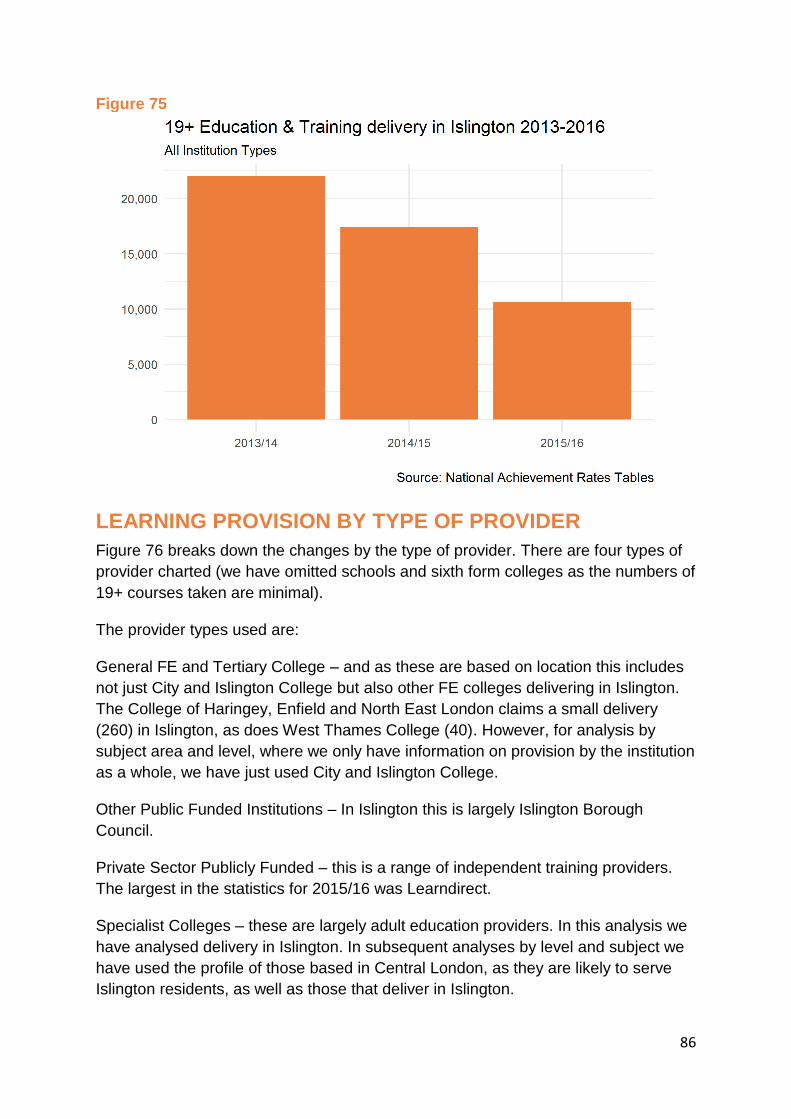
86
Figure 75
LEARNING PROVISION BY TYPE OF PROVIDER
Figure 76 breaks down the changes by the type of provider. There are four types of
provider charted (we have omitted schools and sixth form colleges as the numbers of
19+ courses taken are minimal).
The provider types used are:
General FE and Tertiary College – and as these are based on location this includes
not just City and Islington College but also other FE colleges delivering in Islington.
The College of Haringey, Enfield and North East London claims a small delivery
(260) in Islington, as does West Thames College (40). However, for analysis by
subject area and level, where we only have information on provision by the institution
as a whole, we have just used City and Islington College.
Other Public Funded Institutions – In Islington this is largely Islington Borough
Council.
Private Sector Publicly Funded – this is a range of independent training providers.
The largest in the statistics for 2015/16 was Learndirect.
Specialist Colleges – these are largely adult education providers. In this analysis we
have analysed delivery in Islington. In subsequent analyses by level and subject we
have used the profile of those based in Central London, as they are likely to serve
Islington residents, as well as those that deliver in Islington.
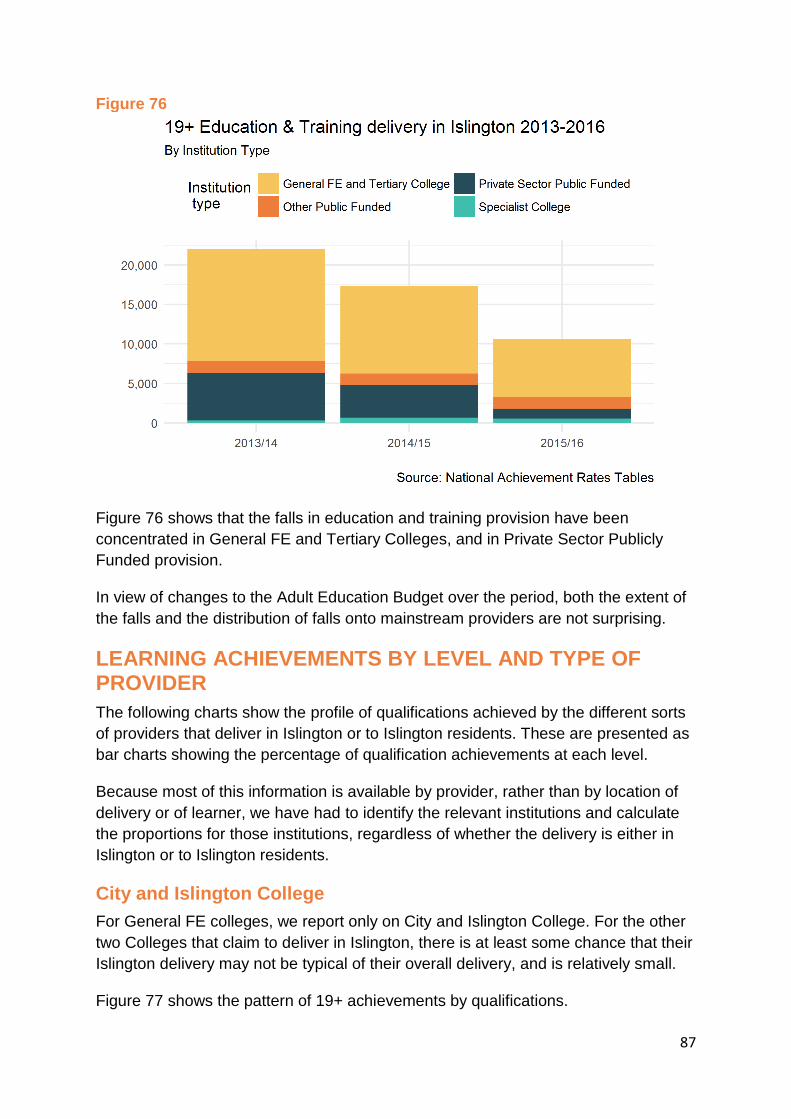
87
Figure 76
Figure 76 shows that the falls in education and training provision have been
concentrated in General FE and Tertiary Colleges, and in Private Sector Publicly
Funded provision.
In view of changes to the Adult Education Budget over the period, both the extent of
the falls and the distribution of falls onto mainstream providers are not surprising.
LEARNING ACHIEVEMENTS BY LEVEL AND TYPE OF PROVIDER
The following charts show the profile of qualifications achieved by the different sorts
of providers that deliver in Islington or to Islington residents. These are presented as
bar charts showing the percentage of qualification achievements at each level.
Because most of this information is available by provider, rather than by location of
delivery or of learner, we have had to identify the relevant institutions and calculate
the proportions for those institutions, regardless of whether the delivery is either in
Islington or to Islington residents.
City and Islington College
For General FE colleges, we report only on City and Islington College. For the other
two Colleges that claim to deliver in Islington, there is at least some chance that their
Islington delivery may not be typical of their overall delivery, and is relatively small.
Figure 77 shows the pattern of 19+ achievements by qualifications.
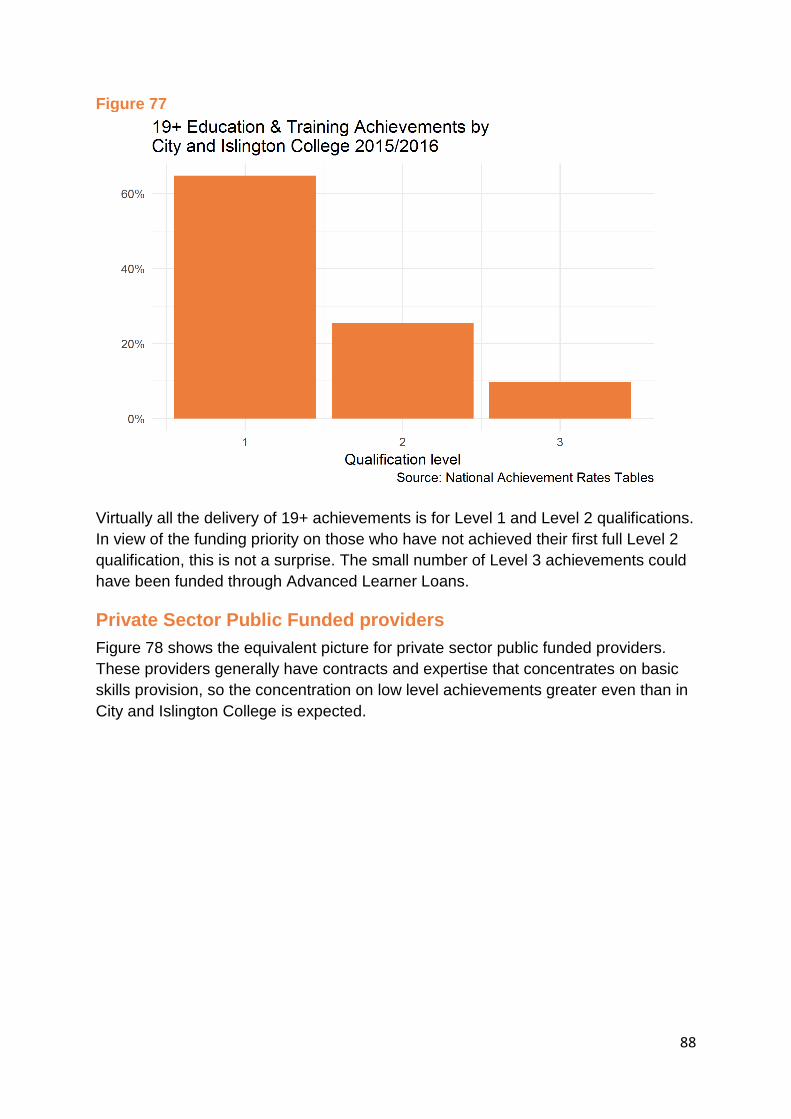
88
Figure 77
Virtually all the delivery of 19+ achievements is for Level 1 and Level 2 qualifications.
In view of the funding priority on those who have not achieved their first full Level 2
qualification, this is not a surprise. The small number of Level 3 achievements could
have been funded through Advanced Learner Loans.
Private Sector Public Funded providers
Figure 78 shows the equivalent picture for private sector public funded providers.
These providers generally have contracts and expertise that concentrates on basic
skills provision, so the concentration on low level achievements greater even than in
City and Islington College is expected.
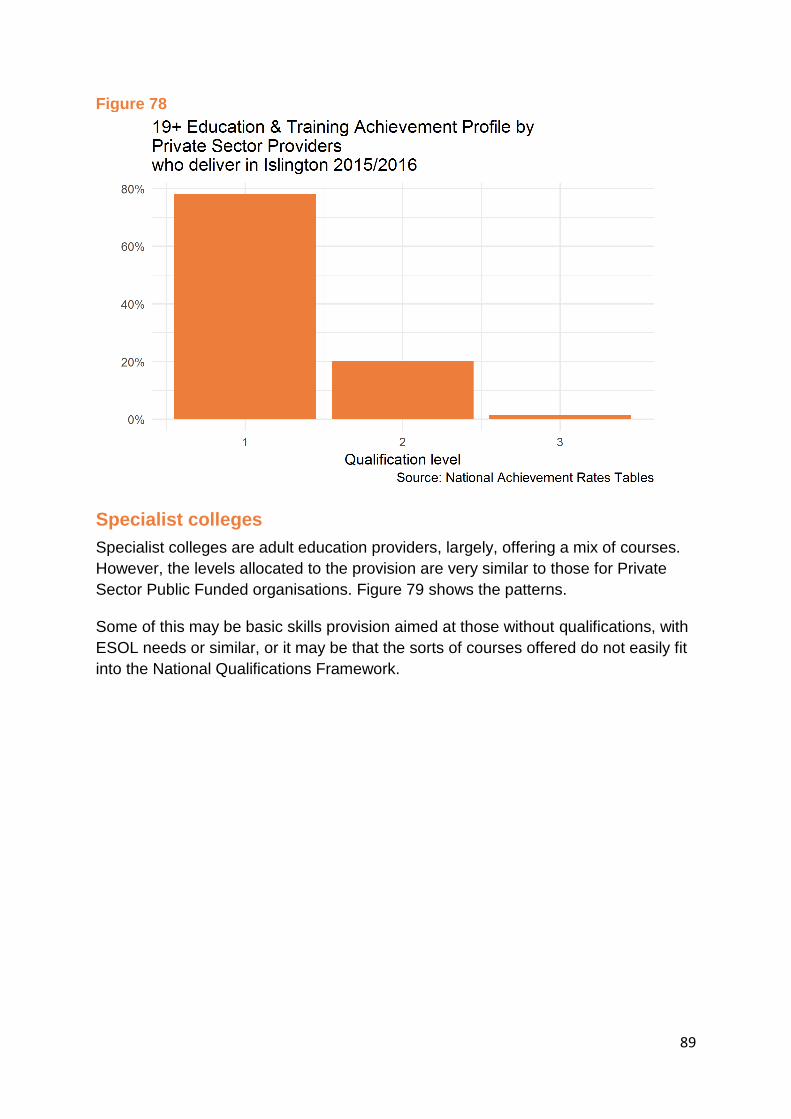
89
Figure 78
Specialist colleges
Specialist colleges are adult education providers, largely, offering a mix of courses.
However, the levels allocated to the provision are very similar to those for Private
Sector Public Funded organisations. Figure 79 shows the patterns.
Some of this may be basic skills provision aimed at those without qualifications, with
ESOL needs or similar, or it may be that the sorts of courses offered do not easily fit
into the National Qualifications Framework.
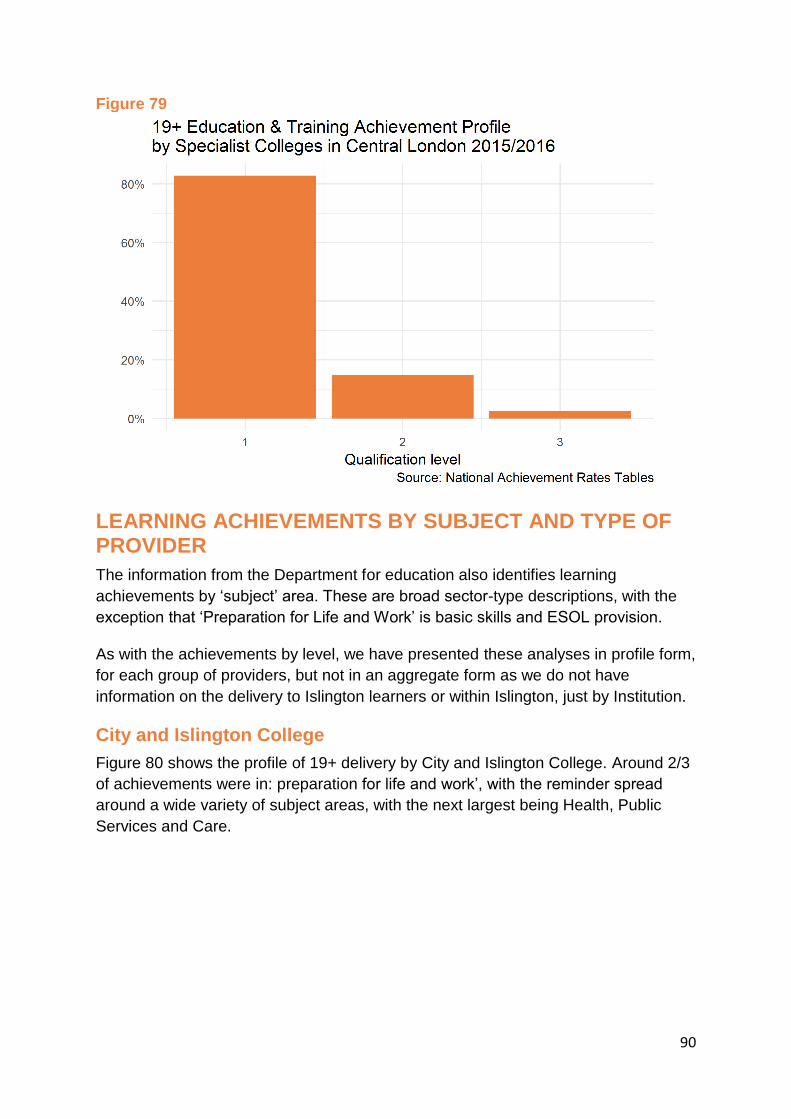
90
Figure 79
LEARNING ACHIEVEMENTS BY SUBJECT AND TYPE OF PROVIDER
The information from the Department for education also identifies learning
achievements by ‘subject’ area. These are broad sector-type descriptions, with the
exception that ‘Preparation for Life and Work’ is basic skills and ESOL provision.
As with the achievements by level, we have presented these analyses in profile form,
for each group of providers, but not in an aggregate form as we do not have
information on the delivery to Islington learners or within Islington, just by Institution.
City and Islington College
Figure 80 shows the profile of 19+ delivery by City and Islington College. Around 2/3
of achievements were in: preparation for life and work’, with the reminder spread
around a wide variety of subject areas, with the next largest being Health, Public
Services and Care.

91
Figure 80
Private Sector Public Funded
Figure 81shows the profile for Private Sector Publicly Funded providers. For this
group, while Preparation for Life and Work was much the largest subject area,
Information and Communication Technology (including basic level computer usage
skills such as ECDL) and Business Administration and Law, which includes fairly
basic office-type skills) were also important.

92
Figure 81
Other Public Funded
Figure 82 shows the pattern for Other Public Funded provision, which in this case is
that provided by Islington Borough Council. The concentration on preparation for life
and work is similar to City and Islington College, but the rest of the pattern differs.
Figure 82
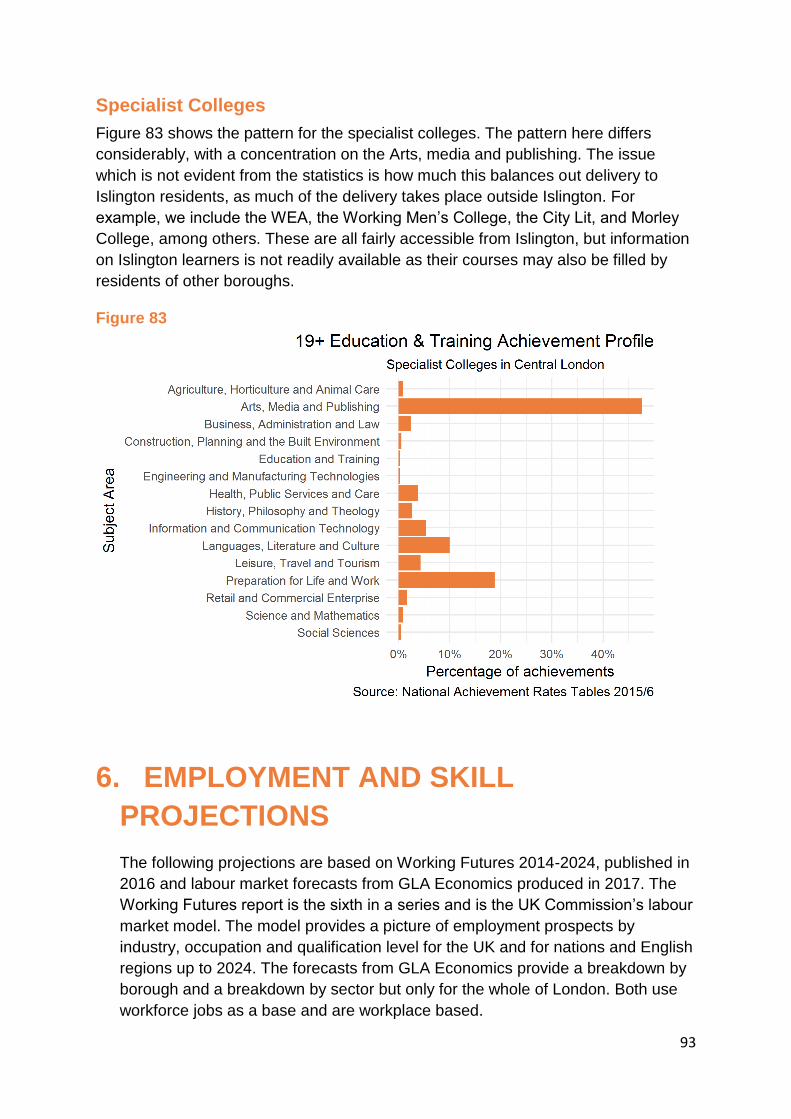
93
Specialist Colleges
Figure 83 shows the pattern for the specialist colleges. The pattern here differs
considerably, with a concentration on the Arts, media and publishing. The issue
which is not evident from the statistics is how much this balances out delivery to
Islington residents, as much of the delivery takes place outside Islington. For
example, we include the WEA, the Working Men’s College, the City Lit, and Morley
College, among others. These are all fairly accessible from Islington, but information
on Islington learners is not readily available as their courses may also be filled by
residents of other boroughs.
Figure 83
6. EMPLOYMENT AND SKILL
PROJECTIONS
The following projections are based on Working Futures 2014-2024, published in
2016 and labour market forecasts from GLA Economics produced in 2017. The
Working Futures report is the sixth in a series and is the UK Commission’s labour
market model. The model provides a picture of employment prospects by
industry, occupation and qualification level for the UK and for nations and English
regions up to 2024. The forecasts from GLA Economics provide a breakdown by
borough and a breakdown by sector but only for the whole of London. Both use
workforce jobs as a base and are workplace based.
94
As with all projections and forecasts, the analysis presented in Working Futures
and those produced by GLA Economics should be regarded as being indicative
of likely trends and orders of magnitude, given a continuation of past patterns of
behaviour and performance, rather than precise predictions of the future. The
results should not be seen as definitive and should be used in conjunction with
other sources of intelligence about the labour market.
The expansion and replacement demand projections from Working Futures are
not available below regional level therefore we have applied the percentage
changes for London up to 2024 to Central London and Islington, after using GLA
Economic data to estimate the base employment figures for Central London and
Islington in 2016 – therefore the results do not take into account local factors
which would normally have an impact on future employment patterns such as
local labour market and migration patterns, local business and economic
developments, improvements to local transport links and the availability of local
housing.
Occupation forecasts
Working Futures provides projections of employment by occupation which gives
an insight into the future prospects for different types of job. This is useful for
people making careers decisions but also for other groups with an interest in the
labour market, such as education and training providers, employers and
policymakers.
Changes in occupational employment structure are largely driven by longer term
trends, including those related to sectoral employment patterns and technological
and organisational trends that influence the patterns of demand within sectors.
The occupational pattern consists of strong growth for higher level, white collar
occupations and for some lower skilled occupations, particularly service-related
jobs that are harder to automate. This is consistent for most areas in England but
is more pronounced in London. See Figures 84 to 87.
In Islington, we estimate an additional 22,000 in employment by 2024 based on a
net requirement that takes into account expansion demand and replacement
demand7. Overall, we estimate that there will be 265,000 workforce jobs by 2024
compared to 243,000 in 2016. However, the extent to which this expansion can
be achieved from local residents is dependent on enough people having the
required qualifications to satisfy the rise in higher level occupations.
In Islington, like the rest of London, significant employment growth is expected for
higher level occupations including managers, most professional occupations and
7 Working futures definition for replacement demand takes into account retirements, occupation
mobility and migration. However, the assumption within Working Futures is that there is no change in occupation mobility and migration, therefore replacement demand is based on retirements only, hence the net requirement is the same as the expansion demand.

95
many associate professional and technical roles. Media, leisure and other service
occupations are also projected to see significant employment growth. Net job
losses are projected for administrative & secretarial occupations; skilled trade
occupations, and sales. Elementary occupations are projected to experience
mixed fortunes with some modest growth in jobs where tasks are not so easily
subject to automation, but job losses in other areas – see Table10.
Table 10 Employment projections by occupation for Islington, 2016 to 2024
Occupation
Em
plo
ym
en
t
level:
201
6/1
7
Exp
an
sio
n
dem
an
d
Rep
lac
em
en
t
dem
an
d
Em
plo
ym
en
t
level:
202
4
Corporate Managers and Directors 30,825 5,393 11,821 36,218
Other Managers and Proprietors 14,042 1,394 6,839 15,436
Science, Research, Engineering and Technology Professionals 30,653 4,735 9,686 35,388
Health Professionals 8,391 1,001 3,405 9,392
Teaching and Educational Professionals 7,364 940 3,306 8,304
Business, Media and Public Service Professionals 27,057 4,278 11,716 31,335
Science, Engineering and Technology Associate Professionals 5,137 298 1,593 5,435
Health and Social Care Associate Professionals 3,082 419 1,192 3,501
Protective Service Occupations
Culture, Media and Sports Occupations 15,070 1,899 6,364 16,968
Business and Public Service Associate Professionals 15,926 2,261 6,095 18,187
Administrative Occupations 18,323 -1,761 7,555 16,562
Secretarial and Related Occupations 5,480 -2,310 2,319 3,170
Skilled Agricultural and Related Trades
Skilled Metal, Electrical and Electronic Trades
Skilled Construction and Building Trades 3,767 311 1,294 4,079
Textiles, Printing and Other Skilled Trades 2,911 -176 1,064 2,735
Caring Personal Service Occupations 19,865 2,413 8,375 22,278
Leisure, Travel and Related Personal Service Occupations 2,226 95 1,033 2,321
Sales Occupations 9,419 -681 3,278 8,737
Customer Service Occupations 6,507 785 2,258 7,293
Process, Plant and Machine Operatives
Transport and Mobile Machine Drivers and Operatives 3,082 -155 1,295 2,927
Elementary Trades and Related Occupations 1,541 -88 503 1,453
Elementary Administration and Service Occupations 12,330 458 5,037 12,788
Total 243,000 21,508 96,028 264,508

96
Figure 84: Job opportunities by occupation for Islington, 2016 to 2024
Figure 85: Job opportunities by occupation for Central London, 2016 to
2024
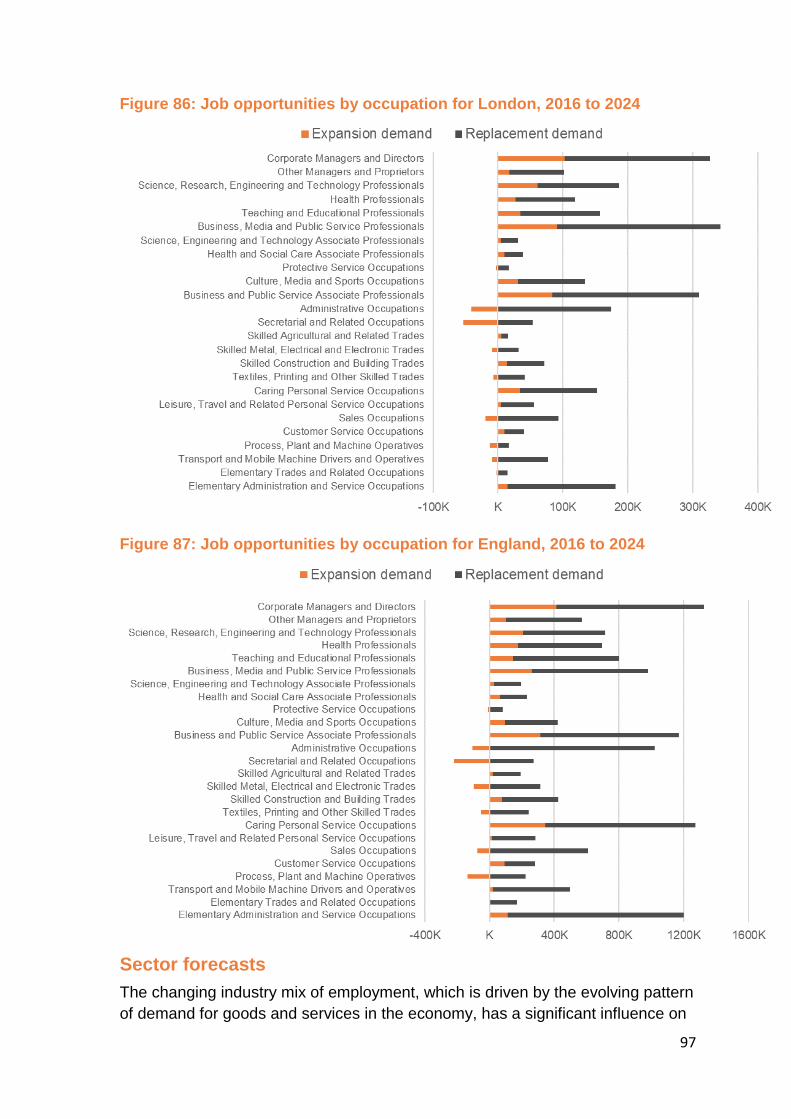
97
Figure 86: Job opportunities by occupation for London, 2016 to 2024
Figure 87: Job opportunities by occupation for England, 2016 to 2024
Sector forecasts
The changing industry mix of employment, which is driven by the evolving pattern
of demand for goods and services in the economy, has a significant influence on
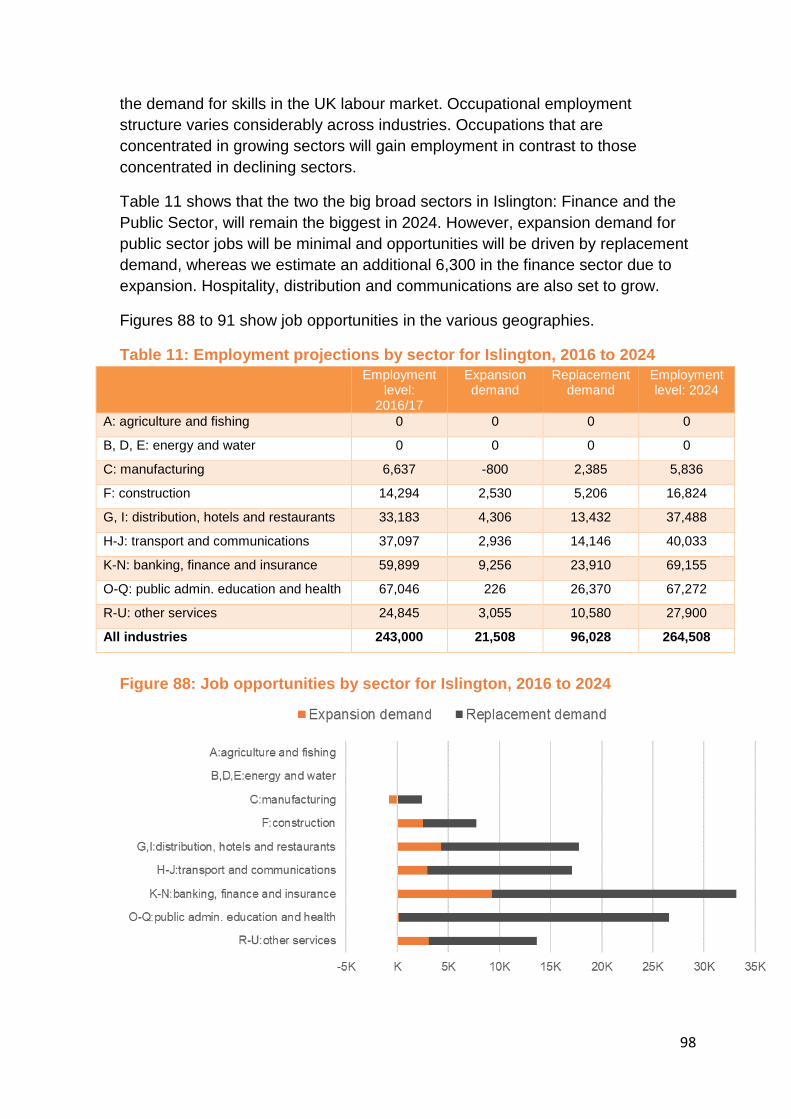
98
the demand for skills in the UK labour market. Occupational employment
structure varies considerably across industries. Occupations that are
concentrated in growing sectors will gain employment in contrast to those
concentrated in declining sectors.
Table 11 shows that the two the big broad sectors in Islington: Finance and the
Public Sector, will remain the biggest in 2024. However, expansion demand for
public sector jobs will be minimal and opportunities will be driven by replacement
demand, whereas we estimate an additional 6,300 in the finance sector due to
expansion. Hospitality, distribution and communications are also set to grow.
Figures 88 to 91 show job opportunities in the various geographies.
Table 11: Employment projections by sector for Islington, 2016 to 2024 Employment
level: 2016/17
Expansion demand
Replacement demand
Employment level: 2024
A: agriculture and fishing 0 0 0 0
B, D, E: energy and water 0 0 0 0
C: manufacturing 6,637 -800 2,385 5,836
F: construction 14,294 2,530 5,206 16,824
G, I: distribution, hotels and restaurants 33,183 4,306 13,432 37,488
H-J: transport and communications 37,097 2,936 14,146 40,033
K-N: banking, finance and insurance 59,899 9,256 23,910 69,155
O-Q: public admin. education and health 67,046 226 26,370 67,272
R-U: other services 24,845 3,055 10,580 27,900
All industries 243,000 21,508 96,028 264,508
Figure 88: Job opportunities by sector for Islington, 2016 to 2024

99
Figure 89: Job opportunities by sector for Central London, 2016 to 2024
Figure 90: Job opportunities by sector for Greater London, 2016 to 2024
Figure 91: Job opportunities by sector for England, 2016 to 2024
100
Qualification forecasts
Along with occupation, formal qualifications are an important means of defining
and measuring skills in the labour market. The latest Working Futures projections
indicate that, based on recent trends, the qualification profile of employment will
continue to see a shift towards more people holding more high-level
qualifications.
By 2024, around 75 per cent of people in employment will need to be qualified at
level 4 and above in Islington and the rest of London (compared to 54 per cent in
England), whilst the proportion of people with no formal qualifications will need to
fall to just over one per cent – see Table 12 and Figure 92.
The changing qualification profile reflects both supply and demand factors,
although since they interact it is difficult to separate out the individual influences
of each. The supply of skills in the labour market is set to continue to grow, as
educational participation levels remain strong and more people (especially young
people) acquire higher level qualifications. At the same time, older people, who
are less well-qualified on average, will retire from the labour force.
Growing demand for formal qualifications is most clearly reflected in the marked
shift in occupational employment structure in favour of the higher skilled
occupational groups, which tend to employ higher qualified people (see above).
Looking at the qualification profiles within occupations (the shares of employment
qualified at different levels) in almost all cases these have changed in favour of
higher level qualifications (Level 4+), combined with sharp reductions in the
employment shares of those with no qualifications. How much this is due to
increasing skill requirements within jobs, as opposed to "qualifications inflation"
(as supply has risen) remains a bone of contention.
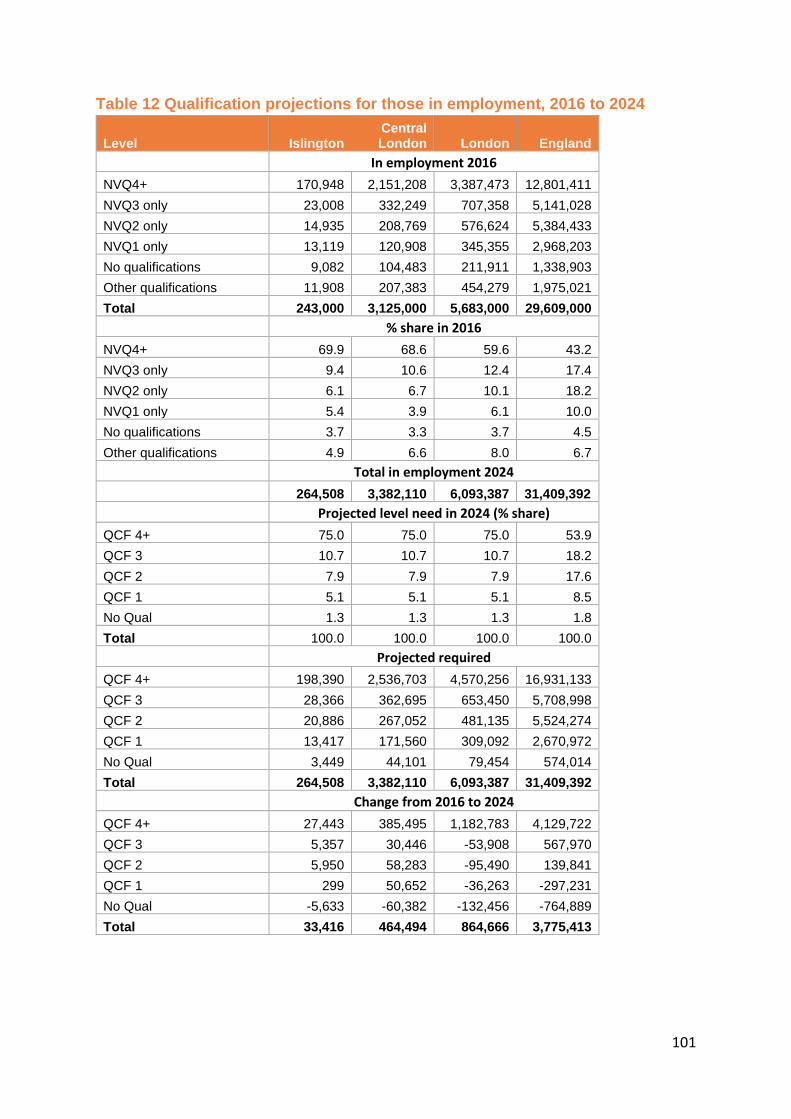
101
Table 12 Qualification projections for those in employment, 2016 to 2024
Level Islington Central London London England
In employment 2016
NVQ4+ 170,948 2,151,208 3,387,473 12,801,411
NVQ3 only 23,008 332,249 707,358 5,141,028
NVQ2 only 14,935 208,769 576,624 5,384,433
NVQ1 only 13,119 120,908 345,355 2,968,203
No qualifications 9,082 104,483 211,911 1,338,903
Other qualifications 11,908 207,383 454,279 1,975,021
Total 243,000 3,125,000 5,683,000 29,609,000
% share in 2016
NVQ4+ 69.9 68.6 59.6 43.2
NVQ3 only 9.4 10.6 12.4 17.4
NVQ2 only 6.1 6.7 10.1 18.2
NVQ1 only 5.4 3.9 6.1 10.0
No qualifications 3.7 3.3 3.7 4.5
Other qualifications 4.9 6.6 8.0 6.7
Total in employment 2024
264,508 3,382,110 6,093,387 31,409,392
Projected level need in 2024 (% share)
QCF 4+ 75.0 75.0 75.0 53.9
QCF 3 10.7 10.7 10.7 18.2
QCF 2 7.9 7.9 7.9 17.6
QCF 1 5.1 5.1 5.1 8.5
No Qual 1.3 1.3 1.3 1.8
Total 100.0 100.0 100.0 100.0
Projected required
QCF 4+ 198,390 2,536,703 4,570,256 16,931,133
QCF 3 28,366 362,695 653,450 5,708,998
QCF 2 20,886 267,052 481,135 5,524,274
QCF 1 13,417 171,560 309,092 2,670,972
No Qual 3,449 44,101 79,454 574,014
Total 264,508 3,382,110 6,093,387 31,409,392
Change from 2016 to 2024
QCF 4+ 27,443 385,495 1,182,783 4,129,722
QCF 3 5,357 30,446 -53,908 567,970
QCF 2 5,950 58,283 -95,490 139,841
QCF 1 299 50,652 -36,263 -297,231
No Qual -5,633 -60,382 -132,456 -764,889
Total 33,416 464,494 864,666 3,775,413
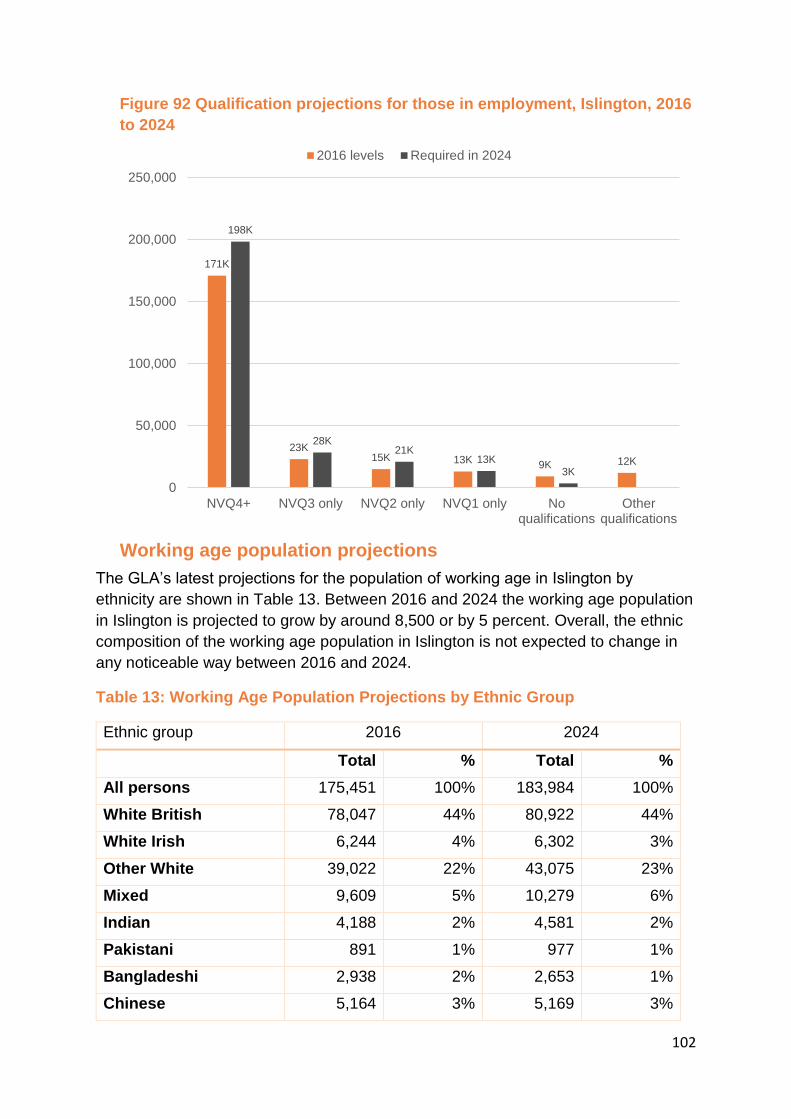
102
Figure 92 Qualification projections for those in employment, Islington, 2016
to 2024
Working age population projections
The GLA’s latest projections for the population of working age in Islington by
ethnicity are shown in Table 13. Between 2016 and 2024 the working age population
in Islington is projected to grow by around 8,500 or by 5 percent. Overall, the ethnic
composition of the working age population in Islington is not expected to change in
any noticeable way between 2016 and 2024.
Table 13: Working Age Population Projections by Ethnic Group
Ethnic group 2016 2024
Total % Total %
All persons 175,451 100% 183,984 100%
White British 78,047 44% 80,922 44%
White Irish 6,244 4% 6,302 3%
Other White 39,022 22% 43,075 23%
Mixed 9,609 5% 10,279 6%
Indian 4,188 2% 4,581 2%
Pakistani 891 1% 977 1%
Bangladeshi 2,938 2% 2,653 1%
Chinese 5,164 3% 5,169 3%
171K
23K15K 13K 9K 12K
198K
28K21K
13K3K
0
50,000
100,000
150,000
200,000
250,000
NVQ4+ NVQ3 only NVQ2 only NVQ1 only Noqualifications
Otherqualifications
2016 levels Required in 2024
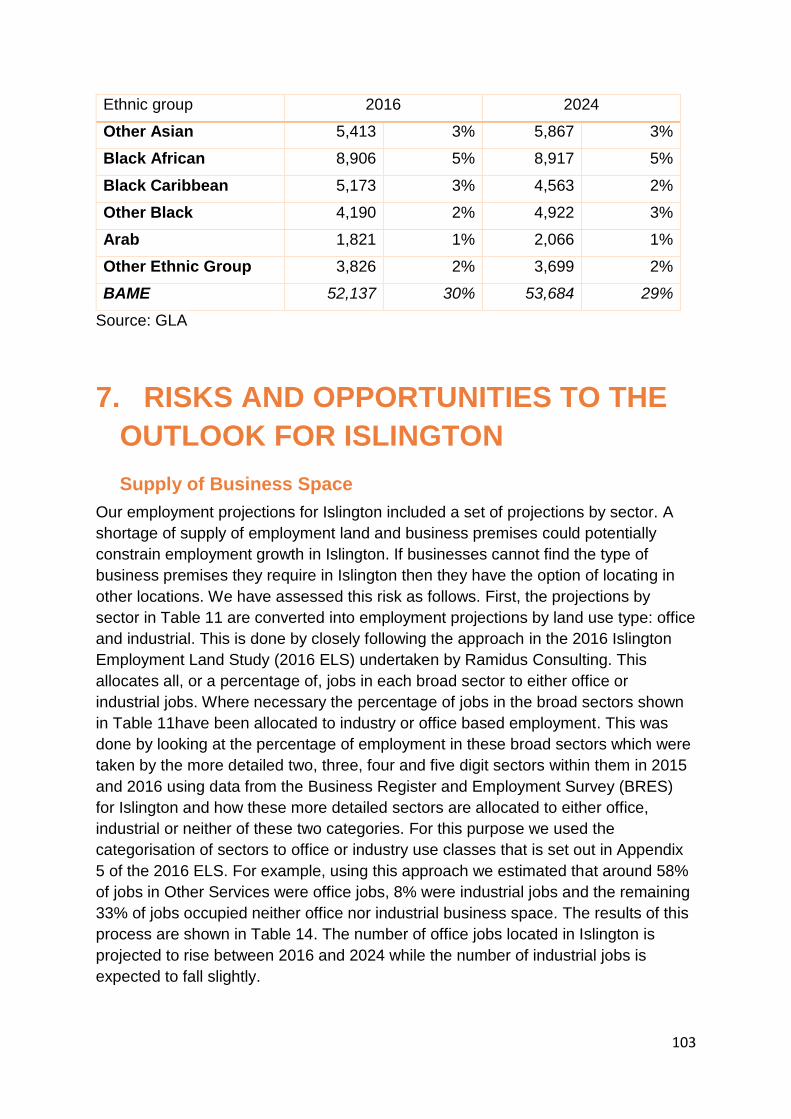
103
Ethnic group 2016 2024
Other Asian 5,413 3% 5,867 3%
Black African 8,906 5% 8,917 5%
Black Caribbean 5,173 3% 4,563 2%
Other Black 4,190 2% 4,922 3%
Arab 1,821 1% 2,066 1%
Other Ethnic Group 3,826 2% 3,699 2%
BAME 52,137 30% 53,684 29%
Source: GLA
7. RISKS AND OPPORTUNITIES TO THE
OUTLOOK FOR ISLINGTON
Supply of Business Space
Our employment projections for Islington included a set of projections by sector. A
shortage of supply of employment land and business premises could potentially
constrain employment growth in Islington. If businesses cannot find the type of
business premises they require in Islington then they have the option of locating in
other locations. We have assessed this risk as follows. First, the projections by
sector in Table 11 are converted into employment projections by land use type: office
and industrial. This is done by closely following the approach in the 2016 Islington
Employment Land Study (2016 ELS) undertaken by Ramidus Consulting. This
allocates all, or a percentage of, jobs in each broad sector to either office or
industrial jobs. Where necessary the percentage of jobs in the broad sectors shown
in Table 11have been allocated to industry or office based employment. This was
done by looking at the percentage of employment in these broad sectors which were
taken by the more detailed two, three, four and five digit sectors within them in 2015
and 2016 using data from the Business Register and Employment Survey (BRES)
for Islington and how these more detailed sectors are allocated to either office,
industrial or neither of these two categories. For this purpose we used the
categorisation of sectors to office or industry use classes that is set out in Appendix
5 of the 2016 ELS. For example, using this approach we estimated that around 58%
of jobs in Other Services were office jobs, 8% were industrial jobs and the remaining
33% of jobs occupied neither office nor industrial business space. The results of this
process are shown in Table 14. The number of office jobs located in Islington is
projected to rise between 2016 and 2024 while the number of industrial jobs is
expected to fall slightly.
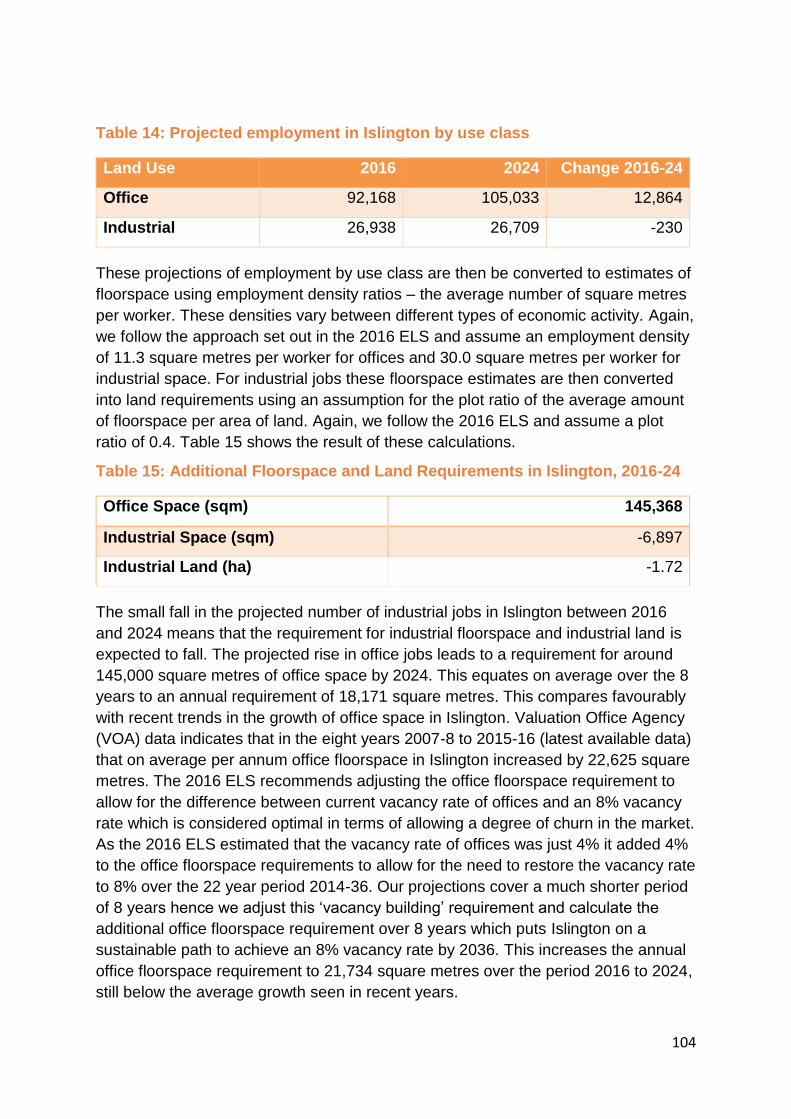
104
Table 14: Projected employment in Islington by use class
Land Use 2016 2024 Change 2016-24
Office 92,168 105,033 12,864
Industrial 26,938 26,709 -230
These projections of employment by use class are then be converted to estimates of
floorspace using employment density ratios – the average number of square metres
per worker. These densities vary between different types of economic activity. Again,
we follow the approach set out in the 2016 ELS and assume an employment density
of 11.3 square metres per worker for offices and 30.0 square metres per worker for
industrial space. For industrial jobs these floorspace estimates are then converted
into land requirements using an assumption for the plot ratio of the average amount
of floorspace per area of land. Again, we follow the 2016 ELS and assume a plot
ratio of 0.4. Table 15 shows the result of these calculations.
Table 15: Additional Floorspace and Land Requirements in Islington, 2016-24
Office Space (sqm) 145,368
Industrial Space (sqm) -6,897
Industrial Land (ha) -1.72
The small fall in the projected number of industrial jobs in Islington between 2016
and 2024 means that the requirement for industrial floorspace and industrial land is
expected to fall. The projected rise in office jobs leads to a requirement for around
145,000 square metres of office space by 2024. This equates on average over the 8
years to an annual requirement of 18,171 square metres. This compares favourably
with recent trends in the growth of office space in Islington. Valuation Office Agency
(VOA) data indicates that in the eight years 2007-8 to 2015-16 (latest available data)
that on average per annum office floorspace in Islington increased by 22,625 square
metres. The 2016 ELS recommends adjusting the office floorspace requirement to
allow for the difference between current vacancy rate of offices and an 8% vacancy
rate which is considered optimal in terms of allowing a degree of churn in the market.
As the 2016 ELS estimated that the vacancy rate of offices was just 4% it added 4%
to the office floorspace requirements to allow for the need to restore the vacancy rate
to 8% over the 22 year period 2014-36. Our projections cover a much shorter period
of 8 years hence we adjust this ‘vacancy building’ requirement and calculate the
additional office floorspace requirement over 8 years which puts Islington on a
sustainable path to achieve an 8% vacancy rate by 2036. This increases the annual
office floorspace requirement to 21,734 square metres over the period 2016 to 2024,
still below the average growth seen in recent years.
105
In May 2013 Permitted Development Rights (PDR) were extended to allow the
conversion of offices to residential properties without the need for formal planning
consent. Exemptions were allowed for the Central Activities Zone (which includes
part of south Islington), and Tech City (covering part of Islington as well as Hackney),
and some other parts of London outside Islington. However, these exemptions will
end from June 2019. Hence PDR could constrain the supply of office space in
Islington which could in turn constrain the growth in office based jobs in the borough.
The 2017 London Office Policy Review noted that in the three years 2012-13 to
2015-16, PDR had resulted in a loss of 16,565 square metres of office floorspace in
Islington. The historic growth in office floorspace between 2007-08 and 2015-16
noted above will have been impacted by this PDR related loss of floorspace in the
last three years of this period. Going forward PDR would apply for the full eight years
between 2016 and 2024 (assuming the policy is not revoked sometime between now
and 2024) rather than for just three years. If we assume that the impact of PDR per
annum is the same as that seen between 2012-13 and 2015-16 over the eight years
2016-2024 then this would reduce our extrapolation of the expected growth in office
floorspace to just 19,174 square metres per annum from 22,625 square metres. This
is still above our initial estimate of the annual requirement for additional office space
between 2016 and 2024 of 18,171 square metres but below that of the adjusted
requirement calculated to support an increase in vacancy rates of 21,734 square
metres. Hence, PDR related conversion of offices to residential usage may result in
office vacancy rates in Islington remaining at low levels on an ongoing basis,
especially given the end of the exemptions from PDR from June 2019 which could
create additional upward pressure on office rents, and or prevent businesses finding
office space to suit their particular needs in Islington. In consequence, some
businesses may relocate jobs to locations outside of Islington and, or not locate in
Islington in the first place.
Transport Infrastructure
Another potential constraint on employment growth in Islington relates to transport
accessibility and transport capacity. Improved transport accessibility and capacity
widens the pool of labour from which Islington based employers can draw. This
enables the employer to hire at a lower cost and, or achieve a better match of the
workers on offer to jobs, relative to the case with lower accessibility and capacity and
thus smaller pools of labour to recruit from. Hence, improvements in transport
accessibility and capacity for Islington should boost employment. Equally, this means
that where accessibility is low or capacity is squeezed then this may constrain
employment growth in an area. GLA Economics’ produce employment projections by
London borough on annual basis. These normally combine projections made on the
basis of historic trends, business space capacity and transport accessibility.
However, the latest 2017 set of GLA Economics’ employment projections do not
include transport accessibility as a factor. This is because:

106
“… the borough transport accessibility study looked at trends from 2007-2015
between transport provision and jobs, but did not find evidence of how transport
infrastructure constrained jobs growth. In the absence of such evidence the
transport accessibility projections have not been used in the development of
borough employee projections.”8
The detailed note on transport accessibility for GLA Economics produced by Volterra
Partners concluded that:
“Growth in both Population and Employment from 2007 to 2015 has occurred
without any significant investments in transport. In the short term it is possible
for London to grow without additions to [transport] accessibility…”
The above conclusion is relevant to Islington: in the eight years 2008-16 the number
of jobs located in Islington rose by 29,000. In the eight years from 2016 our
projections have jobs in Islington rising by 22,000. It appears unlikely that this growth
would be constrained by insufficient transport accessibility or capacity.
Living Costs / Housing Costs
The major factor behind growing living costs in an Inner London area such as
Islington are housing costs, and more specifically housing costs outside of the social
renting sector. It is individuals who have to seek housing in the private market that
are most impacted by rising housing costs. Projections of housing or private rental
costs for Islington are beyond the scope of this project and would be a very major
undertaking in themselves. Instead we assess recent trends for Islington, Inner
London and London utilising Valuation Office Agency (VOA) data on private rents.
Below we assess trends since 2010 in the level of monthly private rents for six
different housing types:
• Room - not self-contained single room with shared facilities. Includes bedsits,
and house or flat shares
• Studio Flats
• One Bedroom Properties
• Two Bedroom Properties
• Three Bedroom Properties
• Four or More Bedroom Properties
Given the focus on lower and medium level skills and jobs, we have focused on two
measures: the lower quartile and median rent levels for these six property types9.
8 GLA Economics (2017), “London labour market projections 2017”, August. 9 We also considered the mean rent levels. However, these figures were typically pulled up by a relatively small number of properties within each of the six types which attract very high rents. Hence, the median rent is a better measure of the typical rent levels that an individual or family might face.

107
Rooms
Figure 93 shows the lower quartile of monthly rents for Rooms in Islington, Inner
London, London and England between October 2010-September 2011 and October
2016 to September 2017. Throughout the period these rent levels were highest in
Islington followed by Inner London. In addition, the lower quartile rent for a room has
grown considerably faster in Islington and Inner London than in England as a whole.
As Figure 94 indicates, in 2010-11, the lower quartile rent for a room in Islington was
around one and half times that in England but this rose to around two times by 2016-
17.
Figure 93
Figure 94
0
100
200
300
400
500
600
700
Oct 2010-Sept2011
Oct 2011-Sept2012
Oct 2012-Sept2013
Oct 2013-Sept2014
Oct 2014-Sept2015
Oct 2015-Sept2016
Oct 2016-Sept2017
Monthly Rent for Room £s (not self-contained), Lower Quartile
Islington Lower Quartile Inner London Lower Quartile London Lower Quartile England Lower Quartile
1.0
1.2
1.4
1.6
1.8
2.0
2.2
Oct 2010-Sept2011
Oct 2011-Sept2012
Oct 2012-Sept2013
Oct 2013-Sept2014
Oct 2014-Sept2015
Oct 2015-Sept2016
Oct 2016-Sept2017
Monthly Rent for Room (not self-contained), Lower Quartile, Ratio to England
Islington Lower Quartile Inner London Lower Quartile London Lower Quartile
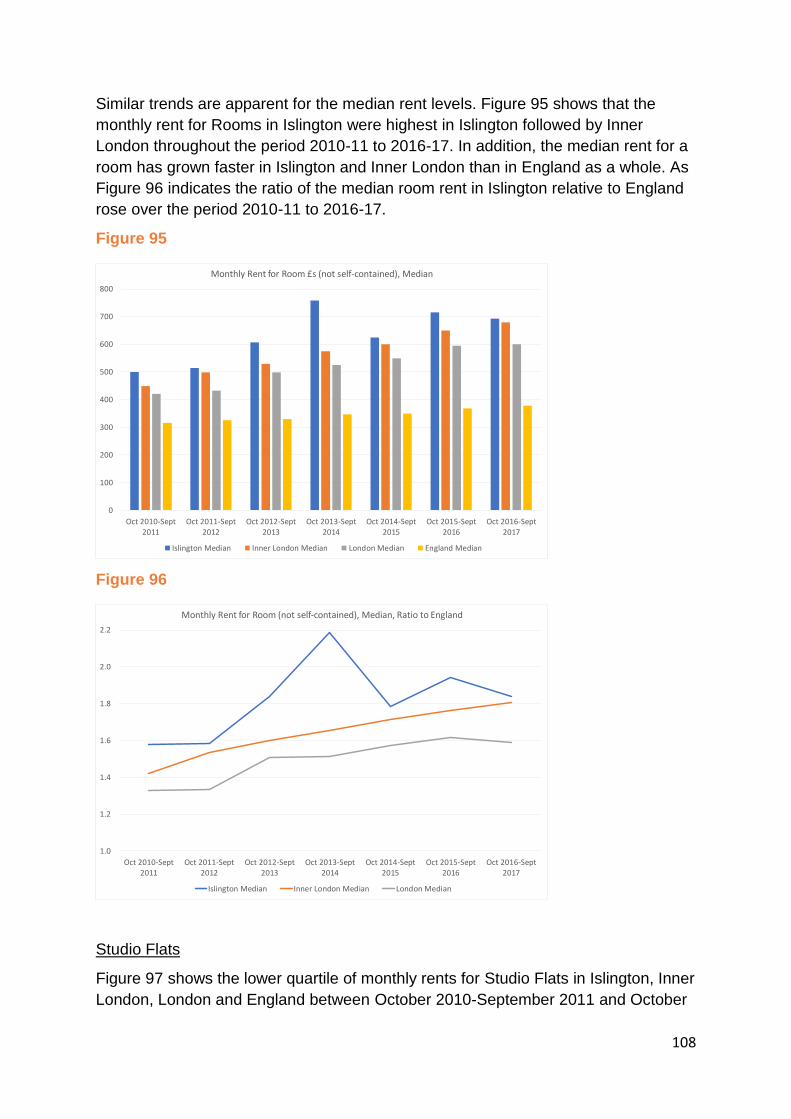
108
Similar trends are apparent for the median rent levels. Figure 95 shows that the
monthly rent for Rooms in Islington were highest in Islington followed by Inner
London throughout the period 2010-11 to 2016-17. In addition, the median rent for a
room has grown faster in Islington and Inner London than in England as a whole. As
Figure 96 indicates the ratio of the median room rent in Islington relative to England
rose over the period 2010-11 to 2016-17.
Figure 95
Figure 96
Studio Flats
Figure 97 shows the lower quartile of monthly rents for Studio Flats in Islington, Inner
London, London and England between October 2010-September 2011 and October
0
100
200
300
400
500
600
700
800
Oct 2010-Sept2011
Oct 2011-Sept2012
Oct 2012-Sept2013
Oct 2013-Sept2014
Oct 2014-Sept2015
Oct 2015-Sept2016
Oct 2016-Sept2017
Monthly Rent for Room £s (not self-contained), Median
Islington Median Inner London Median London Median England Median
1.0
1.2
1.4
1.6
1.8
2.0
2.2
Oct 2010-Sept2011
Oct 2011-Sept2012
Oct 2012-Sept2013
Oct 2013-Sept2014
Oct 2014-Sept2015
Oct 2015-Sept2016
Oct 2016-Sept2017
Monthly Rent for Room (not self-contained), Median, Ratio to England
Islington Median Inner London Median London Median
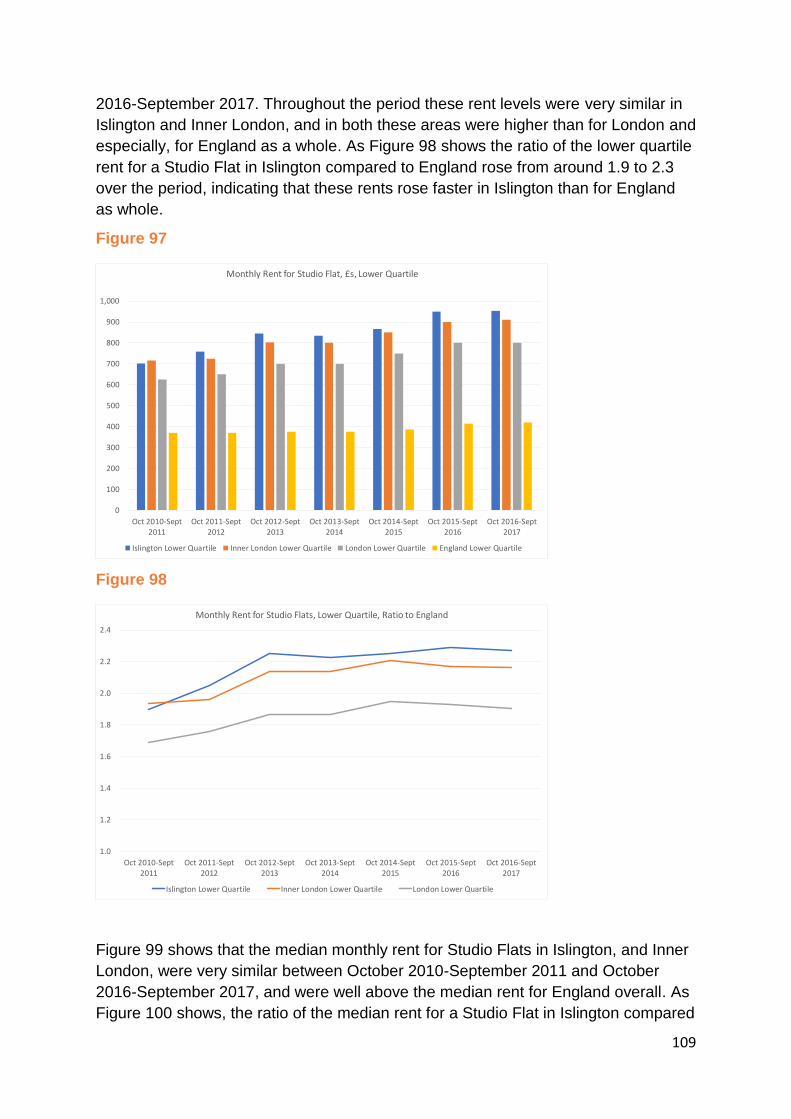
109
2016-September 2017. Throughout the period these rent levels were very similar in
Islington and Inner London, and in both these areas were higher than for London and
especially, for England as a whole. As Figure 98 shows the ratio of the lower quartile
rent for a Studio Flat in Islington compared to England rose from around 1.9 to 2.3
over the period, indicating that these rents rose faster in Islington than for England
as whole.
Figure 97
Figure 98
Figure 99 shows that the median monthly rent for Studio Flats in Islington, and Inner
London, were very similar between October 2010-September 2011 and October
2016-September 2017, and were well above the median rent for England overall. As
Figure 100 shows, the ratio of the median rent for a Studio Flat in Islington compared
0
100
200
300
400
500
600
700
800
900
1,000
Oct 2010-Sept2011
Oct 2011-Sept2012
Oct 2012-Sept2013
Oct 2013-Sept2014
Oct 2014-Sept2015
Oct 2015-Sept2016
Oct 2016-Sept2017
Monthly Rent for Studio Flat, £s, Lower Quartile
Islington Lower Quartile Inner London Lower Quartile London Lower Quartile England Lower Quartile
1.0
1.2
1.4
1.6
1.8
2.0
2.2
2.4
Oct 2010-Sept2011
Oct 2011-Sept2012
Oct 2012-Sept2013
Oct 2013-Sept2014
Oct 2014-Sept2015
Oct 2015-Sept2016
Oct 2016-Sept2017
Monthly Rent for Studio Flats, Lower Quartile, Ratio to England
Islington Lower Quartile Inner London Lower Quartile London Lower Quartile
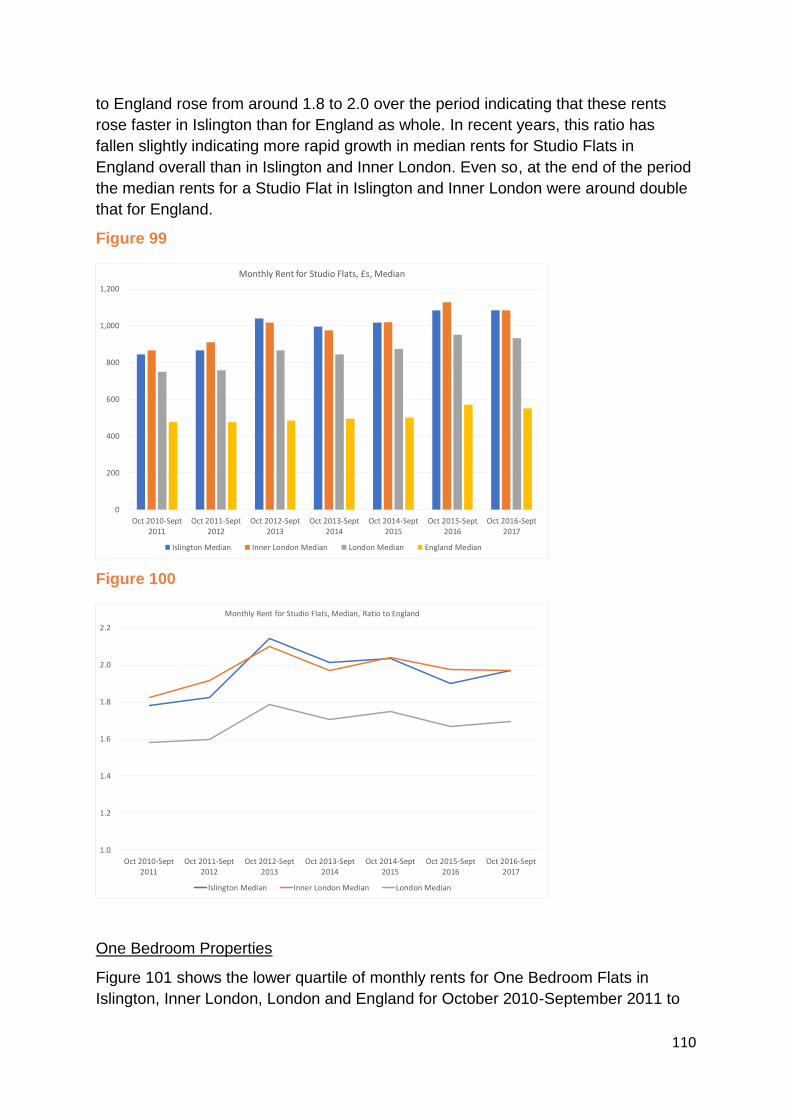
110
to England rose from around 1.8 to 2.0 over the period indicating that these rents
rose faster in Islington than for England as whole. In recent years, this ratio has
fallen slightly indicating more rapid growth in median rents for Studio Flats in
England overall than in Islington and Inner London. Even so, at the end of the period
the median rents for a Studio Flat in Islington and Inner London were around double
that for England.
Figure 99
Figure 100
One Bedroom Properties
Figure 101 shows the lower quartile of monthly rents for One Bedroom Flats in
Islington, Inner London, London and England for October 2010-September 2011 to
0
200
400
600
800
1,000
1,200
Oct 2010-Sept2011
Oct 2011-Sept2012
Oct 2012-Sept2013
Oct 2013-Sept2014
Oct 2014-Sept2015
Oct 2015-Sept2016
Oct 2016-Sept2017
Monthly Rent for Studio Flats, £s, Median
Islington Median Inner London Median London Median England Median
1.0
1.2
1.4
1.6
1.8
2.0
2.2
Oct 2010-Sept2011
Oct 2011-Sept2012
Oct 2012-Sept2013
Oct 2013-Sept2014
Oct 2014-Sept2015
Oct 2015-Sept2016
Oct 2016-Sept2017
Monthly Rent for Studio Flats, Median, Ratio to England
Islington Median Inner London Median London Median
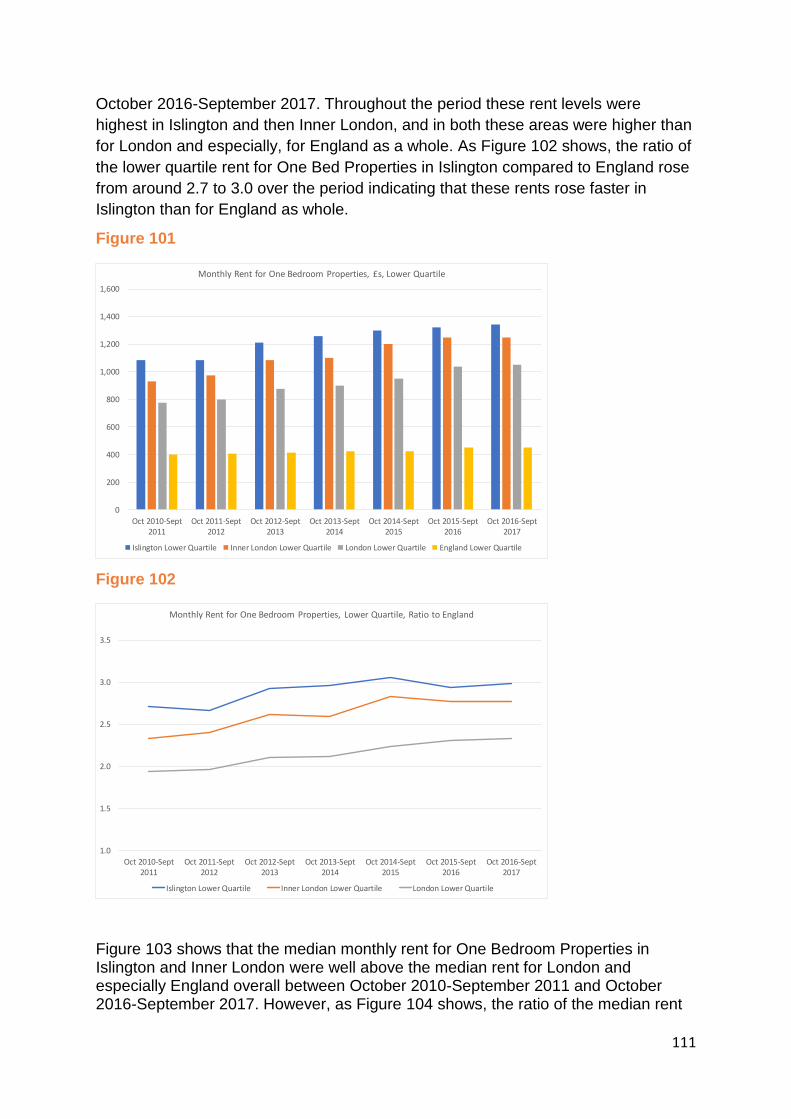
111
October 2016-September 2017. Throughout the period these rent levels were
highest in Islington and then Inner London, and in both these areas were higher than
for London and especially, for England as a whole. As Figure 102 shows, the ratio of
the lower quartile rent for One Bed Properties in Islington compared to England rose
from around 2.7 to 3.0 over the period indicating that these rents rose faster in
Islington than for England as whole.
Figure 101
Figure 102
Figure 103 shows that the median monthly rent for One Bedroom Properties in Islington and Inner London were well above the median rent for London and especially England overall between October 2010-September 2011 and October 2016-September 2017. However, as Figure 104 shows, the ratio of the median rent
0
200
400
600
800
1,000
1,200
1,400
1,600
Oct 2010-Sept2011
Oct 2011-Sept2012
Oct 2012-Sept2013
Oct 2013-Sept2014
Oct 2014-Sept2015
Oct 2015-Sept2016
Oct 2016-Sept2017
Monthly Rent for One Bedroom Properties, £s, Lower Quartile
Islington Lower Quartile Inner London Lower Quartile London Lower Quartile England Lower Quartile
1.0
1.5
2.0
2.5
3.0
3.5
Oct 2010-Sept2011
Oct 2011-Sept2012
Oct 2012-Sept2013
Oct 2013-Sept2014
Oct 2014-Sept2015
Oct 2015-Sept2016
Oct 2016-Sept2017
Monthly Rent for One Bedroom Properties, Lower Quartile, Ratio to England
Islington Lower Quartile Inner London Lower Quartile London Lower Quartile

112
for One Bedroom Properties in Islington and Inner London compared to England initially rose, but ended the period at the same level as at the start indicating that median rents for One Bedroom Properties in Islington and Inner London did not become relatively more expensive. Even so median rents for One Bedroom Properties in Islington and Inner London were, in 2016-17, around two and a half times that for England overall.
Figure 103
Figure 104
Two Bedroom Properties
Figure 105 shows the lower quartile of monthly rents for Two Bedroom Properties in
Islington, Inner London, London and England for October 2010-September 2011 to
0
200
400
600
800
1,000
1,200
1,400
1,600
Oct 2010-Sept2011
Oct 2011-Sept2012
Oct 2012-Sept2013
Oct 2013-Sept2014
Oct 2014-Sept2015
Oct 2015-Sept2016
Oct 2016-Sept2017
Monthly Rent for One Bedroom Properties, £s, Median
Islington Median Inner London Median London Median England Median
1.0
1.2
1.4
1.6
1.8
2.0
2.2
2.4
2.6
2.8
3.0
Oct 2010-Sept2011
Oct 2011-Sept2012
Oct 2012-Sept2013
Oct 2013-Sept2014
Oct 2014-Sept2015
Oct 2015-Sept2016
Oct 2016-Sept2017
Monthly Rent for One Bedroom Properties, Median, Ratio to England
Islington Median Inner London Median London Median
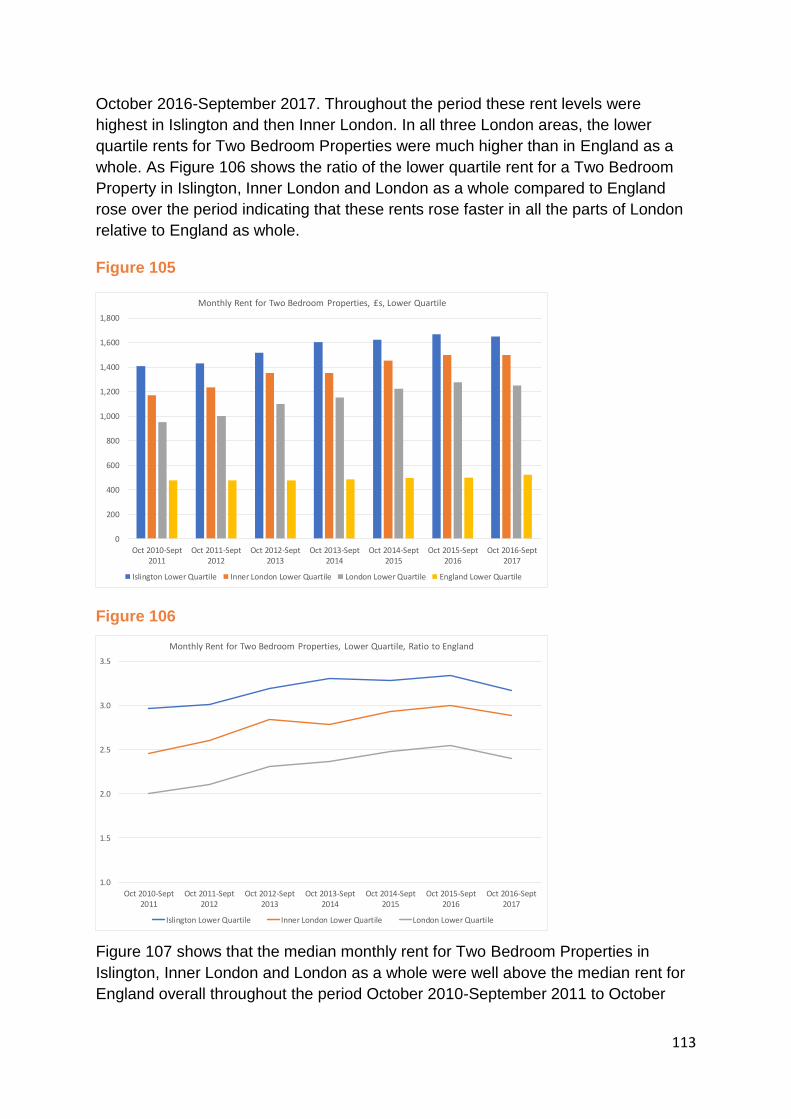
113
October 2016-September 2017. Throughout the period these rent levels were
highest in Islington and then Inner London. In all three London areas, the lower
quartile rents for Two Bedroom Properties were much higher than in England as a
whole. As Figure 106 shows the ratio of the lower quartile rent for a Two Bedroom
Property in Islington, Inner London and London as a whole compared to England
rose over the period indicating that these rents rose faster in all the parts of London
relative to England as whole.
Figure 105
Figure 106
Figure 107 shows that the median monthly rent for Two Bedroom Properties in
Islington, Inner London and London as a whole were well above the median rent for
England overall throughout the period October 2010-September 2011 to October
0
200
400
600
800
1,000
1,200
1,400
1,600
1,800
Oct 2010-Sept2011
Oct 2011-Sept2012
Oct 2012-Sept2013
Oct 2013-Sept2014
Oct 2014-Sept2015
Oct 2015-Sept2016
Oct 2016-Sept2017
Monthly Rent for Two Bedroom Properties, £s, Lower Quartile
Islington Lower Quartile Inner London Lower Quartile London Lower Quartile England Lower Quartile
1.0
1.5
2.0
2.5
3.0
3.5
Oct 2010-Sept2011
Oct 2011-Sept2012
Oct 2012-Sept2013
Oct 2013-Sept2014
Oct 2014-Sept2015
Oct 2015-Sept2016
Oct 2016-Sept2017
Monthly Rent for Two Bedroom Properties, Lower Quartile, Ratio to England
Islington Lower Quartile Inner London Lower Quartile London Lower Quartile
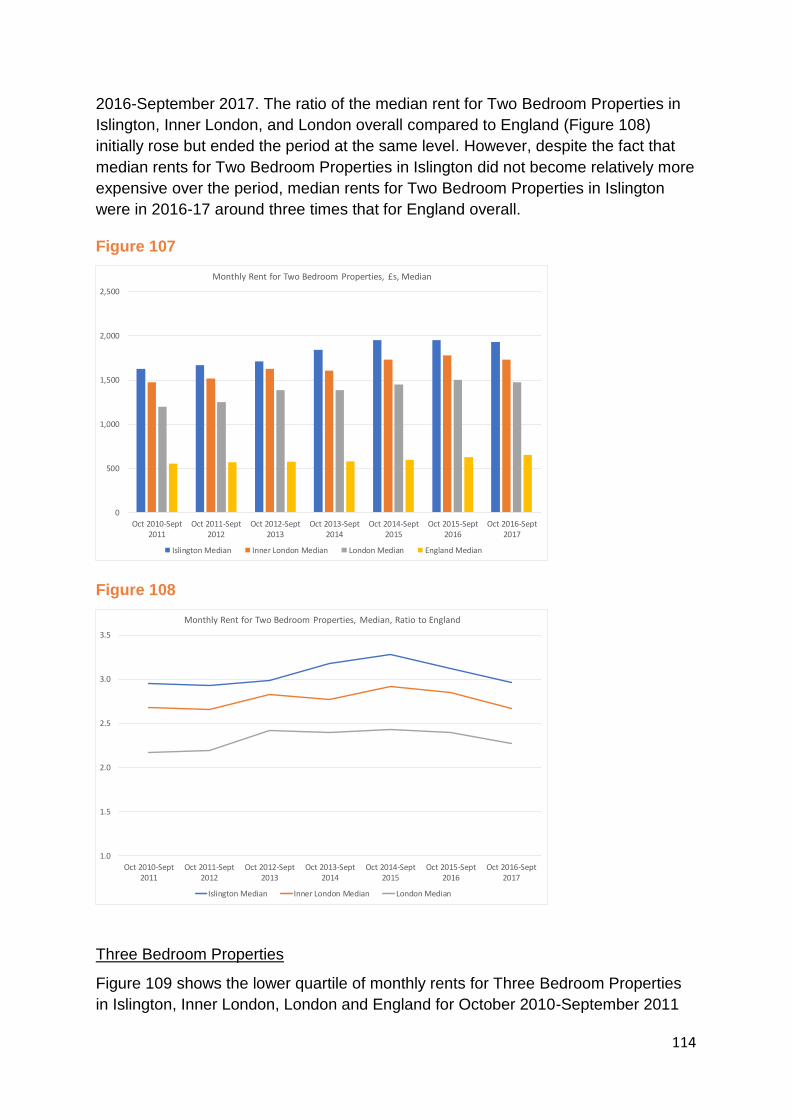
114
2016-September 2017. The ratio of the median rent for Two Bedroom Properties in
Islington, Inner London, and London overall compared to England (Figure 108)
initially rose but ended the period at the same level. However, despite the fact that
median rents for Two Bedroom Properties in Islington did not become relatively more
expensive over the period, median rents for Two Bedroom Properties in Islington
were in 2016-17 around three times that for England overall.
Figure 107
Figure 108
Three Bedroom Properties
Figure 109 shows the lower quartile of monthly rents for Three Bedroom Properties
in Islington, Inner London, London and England for October 2010-September 2011
0
500
1,000
1,500
2,000
2,500
Oct 2010-Sept2011
Oct 2011-Sept2012
Oct 2012-Sept2013
Oct 2013-Sept2014
Oct 2014-Sept2015
Oct 2015-Sept2016
Oct 2016-Sept2017
Monthly Rent for Two Bedroom Properties, £s, Median
Islington Median Inner London Median London Median England Median
1.0
1.5
2.0
2.5
3.0
3.5
Oct 2010-Sept2011
Oct 2011-Sept2012
Oct 2012-Sept2013
Oct 2013-Sept2014
Oct 2014-Sept2015
Oct 2015-Sept2016
Oct 2016-Sept2017
Monthly Rent for Two Bedroom Properties, Median, Ratio to England
Islington Median Inner London Median London Median

115
to October 2016-September 2017. Throughout the period in all three London areas,
the lower quartile rents for Three Bedroom Properties were much higher than in
England as a whole. In addition, as Figure 110 shows the ratio of the lower quartile
rent for a Three Bedroom Property in Islington, Inner London and London as a whole
compared to England all rose over the period indicating that these rents rose faster
in all the parts of London relative to England as whole.
Figure 109
Figure 110
Figure 111 shows that the median monthly rent for Three Bedroom Properties in
Islington, Inner London and London as a whole were all well above the median rent
for England overall throughout the period October 2010-September 2011 to October
2016-September 2017. The ratio of the median rent for Three Bedroom Properties in
Islington, Inner London, and London overall compared to England (Figure 112) were
0
500
1,000
1,500
2,000
2,500
Oct 2010-Sept2011
Oct 2011-Sept2012
Oct 2012-Sept2013
Oct 2013-Sept2014
Oct 2014-Sept2015
Oct 2015-Sept2016
Oct 2016-Sept2017
Monthly Rent for Three Bedroom Properties, £s, Lower Quartile
Islington Lower Quartile Inner London Lower Quartile London Lower Quartile England Lower Quartile
1.0
1.5
2.0
2.5
3.0
3.5
4.0
Oct 2010-Sept2011
Oct 2011-Sept2012
Oct 2012-Sept2013
Oct 2013-Sept2014
Oct 2014-Sept2015
Oct 2015-Sept2016
Oct 2016-Sept2017
Monthly Rent for Three Bedroom Properties, Lower Quartile, Ratio to England
Islington Lower Quartile Inner London Lower Quartile London Lower Quartile
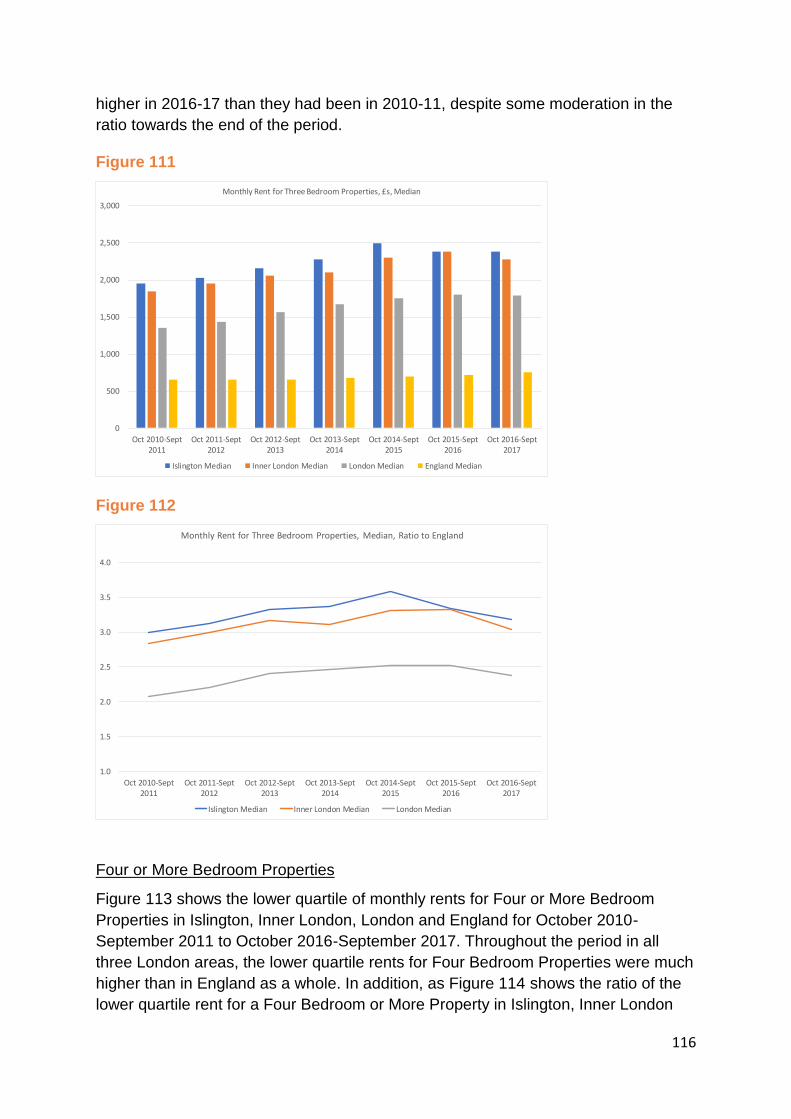
116
higher in 2016-17 than they had been in 2010-11, despite some moderation in the
ratio towards the end of the period.
Figure 111
Figure 112
Four or More Bedroom Properties
Figure 113 shows the lower quartile of monthly rents for Four or More Bedroom
Properties in Islington, Inner London, London and England for October 2010-
September 2011 to October 2016-September 2017. Throughout the period in all
three London areas, the lower quartile rents for Four Bedroom Properties were much
higher than in England as a whole. In addition, as Figure 114 shows the ratio of the
lower quartile rent for a Four Bedroom or More Property in Islington, Inner London
0
500
1,000
1,500
2,000
2,500
3,000
Oct 2010-Sept2011
Oct 2011-Sept2012
Oct 2012-Sept2013
Oct 2013-Sept2014
Oct 2014-Sept2015
Oct 2015-Sept2016
Oct 2016-Sept2017
Monthly Rent for Three Bedroom Properties, £s, Median
Islington Median Inner London Median London Median England Median
1.0
1.5
2.0
2.5
3.0
3.5
4.0
Oct 2010-Sept2011
Oct 2011-Sept2012
Oct 2012-Sept2013
Oct 2013-Sept2014
Oct 2014-Sept2015
Oct 2015-Sept2016
Oct 2016-Sept2017
Monthly Rent for Three Bedroom Properties, Median, Ratio to England
Islington Median Inner London Median London Median
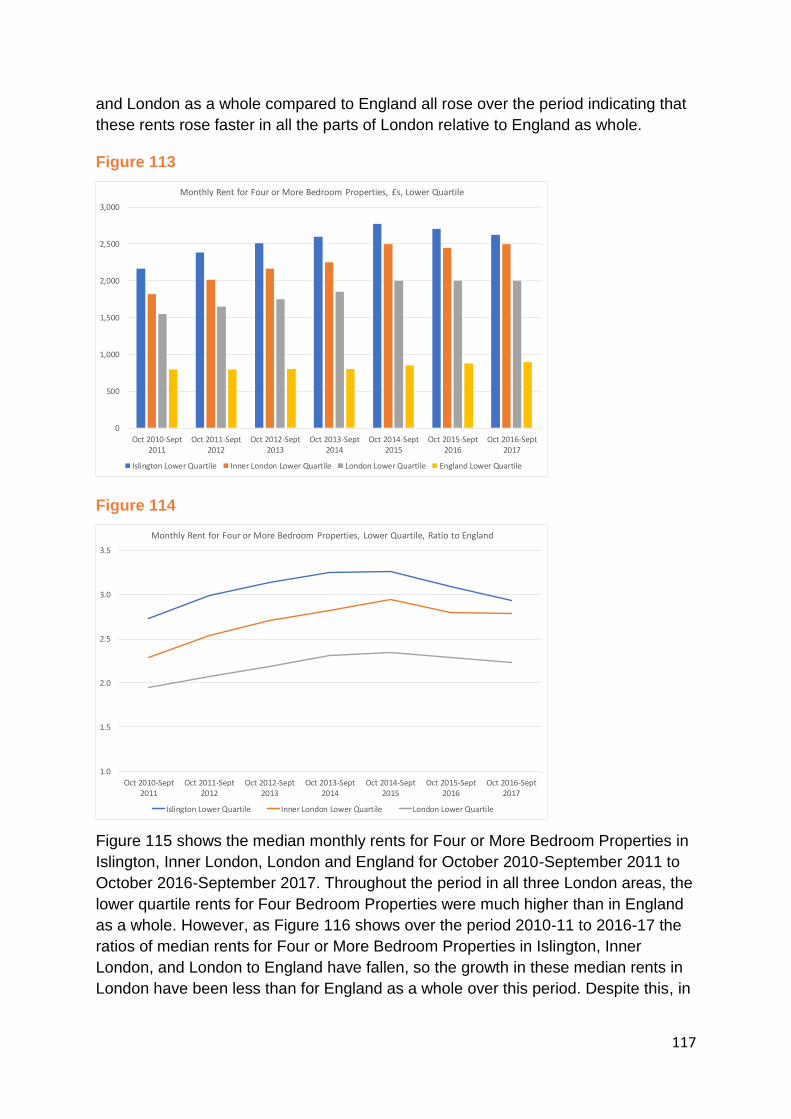
117
and London as a whole compared to England all rose over the period indicating that
these rents rose faster in all the parts of London relative to England as whole.
Figure 113
Figure 114
Figure 115 shows the median monthly rents for Four or More Bedroom Properties in
Islington, Inner London, London and England for October 2010-September 2011 to
October 2016-September 2017. Throughout the period in all three London areas, the
lower quartile rents for Four Bedroom Properties were much higher than in England
as a whole. However, as Figure 116 shows over the period 2010-11 to 2016-17 the
ratios of median rents for Four or More Bedroom Properties in Islington, Inner
London, and London to England have fallen, so the growth in these median rents in
London have been less than for England as a whole over this period. Despite this, in
0
500
1,000
1,500
2,000
2,500
3,000
Oct 2010-Sept2011
Oct 2011-Sept2012
Oct 2012-Sept2013
Oct 2013-Sept2014
Oct 2014-Sept2015
Oct 2015-Sept2016
Oct 2016-Sept2017
Monthly Rent for Four or More Bedroom Properties, £s, Lower Quartile
Islington Lower Quartile Inner London Lower Quartile London Lower Quartile England Lower Quartile
1.0
1.5
2.0
2.5
3.0
3.5
Oct 2010-Sept2011
Oct 2011-Sept2012
Oct 2012-Sept2013
Oct 2013-Sept2014
Oct 2014-Sept2015
Oct 2015-Sept2016
Oct 2016-Sept2017
Monthly Rent for Four or More Bedroom Properties, Lower Quartile, Ratio to England
Islington Lower Quartile Inner London Lower Quartile London Lower Quartile

118
2016-17 the median monthly rent for a Four Bedroom Property in Islington was
nearly double that for England in 2016-17.
Figure 115
Figure 116
Private Rental Market Some Conclusions
The ratios between rental levels in Islington and England provide an indicator of the
extent to which housing costs are higher in Islington than England as a whole. These
ratios rise as you move from up the housing market from rooms and studio flats
0
500
1,000
1,500
2,000
2,500
3,000
3,500
Oct 2010-Sept2011
Oct 2011-Sept2012
Oct 2012-Sept2013
Oct 2013-Sept2014
Oct 2014-Sept2015
Oct 2015-Sept2016
Oct 2016-Sept2017
Monthly Rent for Four or More Bedroom Properties, £s, Median
Islington Median Inner London Median London Median England Median
1.0
1.2
1.4
1.6
1.8
2.0
2.2
2.4
2.6
2.8
Oct 2010-Sept2011
Oct 2011-Sept2012
Oct 2012-Sept2013
Oct 2013-Sept2014
Oct 2014-Sept2015
Oct 2015-Sept2016
Oct 2016-Sept2017
Monthly Rent for Four or More Bedroom Properties, Median, Ratio to England
Islington Median Inner London Median London Median
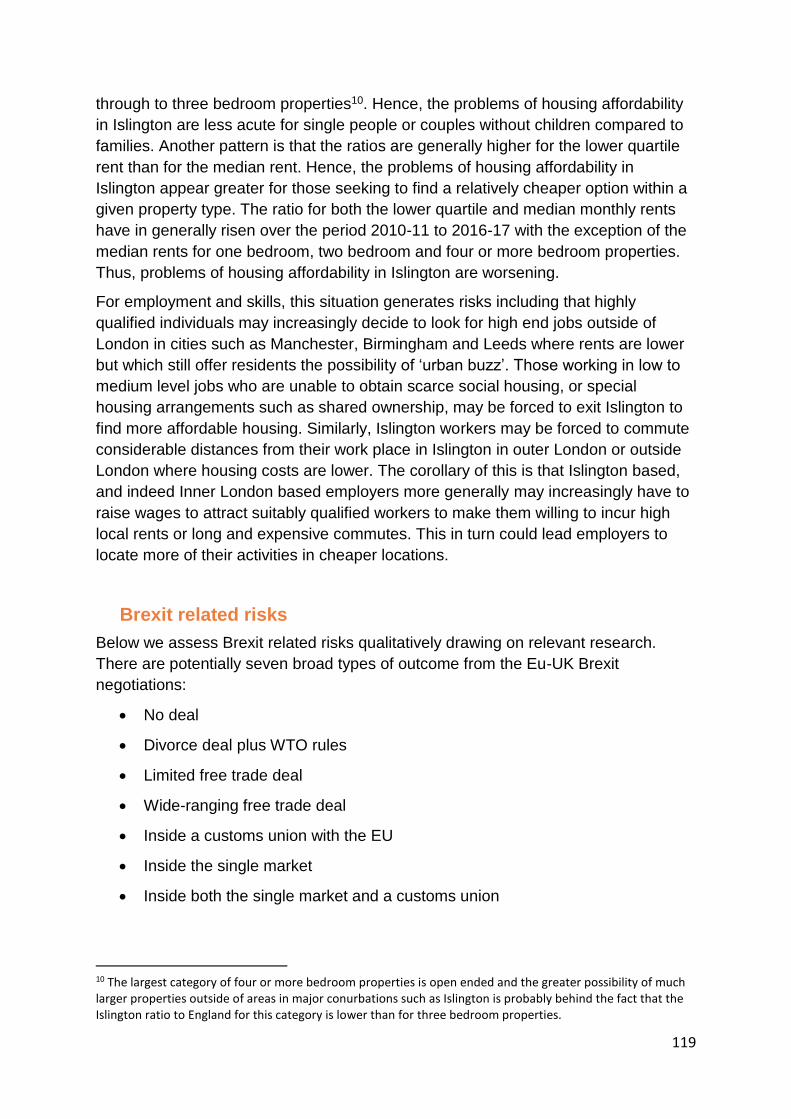
119
through to three bedroom properties10. Hence, the problems of housing affordability
in Islington are less acute for single people or couples without children compared to
families. Another pattern is that the ratios are generally higher for the lower quartile
rent than for the median rent. Hence, the problems of housing affordability in
Islington appear greater for those seeking to find a relatively cheaper option within a
given property type. The ratio for both the lower quartile and median monthly rents
have in generally risen over the period 2010-11 to 2016-17 with the exception of the
median rents for one bedroom, two bedroom and four or more bedroom properties.
Thus, problems of housing affordability in Islington are worsening.
For employment and skills, this situation generates risks including that highly
qualified individuals may increasingly decide to look for high end jobs outside of
London in cities such as Manchester, Birmingham and Leeds where rents are lower
but which still offer residents the possibility of ‘urban buzz’. Those working in low to
medium level jobs who are unable to obtain scarce social housing, or special
housing arrangements such as shared ownership, may be forced to exit Islington to
find more affordable housing. Similarly, Islington workers may be forced to commute
considerable distances from their work place in Islington in outer London or outside
London where housing costs are lower. The corollary of this is that Islington based,
and indeed Inner London based employers more generally may increasingly have to
raise wages to attract suitably qualified workers to make them willing to incur high
local rents or long and expensive commutes. This in turn could lead employers to
locate more of their activities in cheaper locations.
Brexit related risks
Below we assess Brexit related risks qualitatively drawing on relevant research.
There are potentially seven broad types of outcome from the Eu-UK Brexit
negotiations:
• No deal
• Divorce deal plus WTO rules
• Limited free trade deal
• Wide-ranging free trade deal
• Inside a customs union with the EU
• Inside the single market
• Inside both the single market and a customs union
10 The largest category of four or more bedroom properties is open ended and the greater possibility of much larger properties outside of areas in major conurbations such as Islington is probably behind the fact that the Islington ratio to England for this category is lower than for three bedroom properties.

120
The above options are in order of the degree to which the UK remains integrated
with the EU after leaving. An important finding of research on the economic
consequences of leaving the EU is that while Brexit in any form, compared to
continuing EU membership, would harm the UK’s economy through reduced trade,
this cost would be less when the UK remains more economically integrated with the
EU11. Hence, the above options are also in order of the options which are likely to
impose the largest economic costs on the UK through to those likely to impose the
least economic costs.
No Deal
This outcome is literally unthinkable and not viable. The UK would no longer be
bound by the EU treaties and there would be nothing to replace the thousands of
international agreements that stem from them. It would involve disruption on a scale
not seen in peacetime, for example, a lack of customs facilitation deals would disrupt
trade at borders, there would be no regulatory approval to fly between the UK and
the EU, and British lorry drivers would not be licensed to drive their vehicles in the
EU, nor their EU counterparts in the UK. The UK and the EU reached agreement in
December 2017 on the “Stage One” issues of the Divorce Bill, the position of EU
citizens in the UK, and that of UK citizens in the EU, and the Irish border. While
‘nothing is agreed until everything is agreed’ this reduces the chances of the No Deal
Scenario. Additionally, the consequences of a literal no deal scenario noted above
are so extreme that even in the circumstances of no agreement more widely some
limited UK-EU agreement would occur to prevent their eventuality.
Divorce deal plus WTO rules
This means that the most likely no deal type outcome is an agreement that covers
such matters and the size of the ‘divorce bill’ that the UK would pay to the EU on
exit. Trade between the UK and the EU would occur on WTO rules. Companies
involved in EU-British trade would be hit by tariff and non-tariff barriers. Customs
delays would be significant at the UK-EU border and also behind it as companies
would need to make complex customs declarations. This increase in trade barriers
with the UK’s biggest market would have very substantial negative impact on exports
with no guarantee that alternative trade deals would boost exports elsewhere.
Moreover, the UK would lose all our current preferential trade access to non-EU
countries, as they are contingent on EU membership.
Limited free trade deal
A limited free-trade agreement is struck with the EU. This maintains tariff-free trade
in goods. Customs checks would still increase the costs of trading with the EU. Firms
might also have to duplicate their production lines, in order to make goods that
satisfied UK regulations and others to meet EU rules where these differed.
11 Ottaviano, G., J. Pessoa, T. Sampson and J. Van Reenen (2014) ‘The Costs and Benefits of
Leaving the EU’, Centre for Economic Performance Policy Analysis.

121
Companies with complex cross-border supply chains would have to deal with non-
tariff barriers and customs delays.
Such an outcome would not, however, benefit services where UK exports to the EU
are much larger than imports from the EU, unlike goods. Importantly, for Islington
and London, financial services would lose its “passporting” rights, which allow
services to be sold across the EU. Professional and business services would also
face significant non-tariff barriers. While, the UK Government aspires to a wide
ranging free trade agreement this is quite a likely outcome. Historically, free-trade
deals covering goods have been much easier to agree than deals which facilitate
trade in services.
Wide-ranging free trade deal
A more comprehensive free trade deal between the UK and the EU covering
services as well as goods. This would benefit UK services. However, financial
services are generally not covered in their entirety in such deals. For example, the
Swiss-EU agreement provides access to the EU for Swiss insurance, but not
banking. Optimists argue that it should be possible to include a wider range of
services in such a deal than is usually the case because UK services would start
from a position of being fully compliant with EU rules.
Inside a customs union with the EU
Being in a customs union with the EU would seek to smooth trade in goods at the
UK-EU border. UK tariffs on goods and trade agreements covering goods would be
determined by the EU. The experience of Turkey shows that while such
arrangements do not lead to wholly frictionless trade, many non-tariff barriers would
be substantially eased. Services would not benefit from a customs union only deal.
However, a customs union could be combined with a wide ranging free-trade
agreement covering services. The UK Government has ruled out membership of a
customs union with the EU and instead wants “a new customs arrangement that
facilitates the freest and most frictionless trade possible in goods between the UK
and the EU.”12
Inside the single market
If the UK was to remain in the single market by retaining membership of the
European Economic Area it would ensure continued regulatory alignment (no non-
tariff barriers) with the EU and tariff-free trade. This would ensure that UK goods and
services could be sold in the EU. Continued passporting of UK financial services
would ensure that they can be sold in the EU. Sectors using large numbers of EU
nationals, such as hospitality, would gain as Britain would have to accept the free
movement of labour as part of a deal to remain in the single market. The UK
Government has ruled out membership of the single market.
12 HM Government (2017), ‘Future customs arrangements - a future partnership paper’, https://www.gov.uk/government/publications/future-customs-arrangements-a-future-partnership-paper

122
Inside both the single market and a customs union
In terms of trading arrangements being inside the single market and in a customs
union with the EU would essentially replicate the existing situation that the UK faces
inside the EU. The UK Government has ruled out membership of both the single
market and being in a customs union with the EU.
Recent analyses of the economic implications of Brexit
Two recent studies have sort to model the potential economic impacts of Brexit down
to London and sub-regional level:
• Dhingra, S., S. Machin, and H. G. Overman (2017), “The Local Economic
Effects of Brexit”, CEP Brexit Analysis No.10
• Cambridge Econometrics (CE) (2018). “Preparing for Brexit”, a report for the
Greater London Authority
Dhingra et al (2017) models two scenarios: Hard Brexit and Soft Brexit while CE
(2018) model five different scenarios. Table 16 shows the broad correspondence
between these modelled scenarios and the seven types of Brexit noted above.
Table 16: Types of Brexit and modelled Brexit Scenarios
Seven Types of Brexit GLA (2018) CEP (2017)
No deal
Divorce deal plus WTO rules Scenario 4 / Scenario 5 Hard Brexit
Limited free trade deal
Wide-ranging free trade deal
Soft Brexit
Inside a customs union with the EU Scenario 3
Inside the single market Scenario 2
Inside both the single market and a customs union
Scenario 1
Dhingra et al (2017)
In the Soft Brexit scenario, the UK is assumed to remain in the Single Market. In the
Hard Brexit scenario, the UK and the EU are assumed to trade under WTO rules.
This study just seeks to model the potential impacts of Brexit on trade and not
investment or migration. The aim is to estimate the long run impacts on GVA
(economic output) of the two Brexit scenarios which are assumed to occur over a 10-
year period. The impacts are modelled down to the local authority level including
Islington. Table 17 shows the results for Islington and London as a whole.

123
Table 17: Long run (10 year) GVA impact of Soft and Hard Brexit
Soft Brexit Hard Brexit
Islington -1.3% -2.8%
London -1.3% -2.6%
Islington is expected to be one of the hardest hit local authorities in the UK. It
features in the top ten of authorities expected to be hardest hit by Brexit alongside
two other central-inner London boroughs: the City of London (1st) and Tower
Hamlets (3rd). This study does not estimate the impacts of the two Brexit scenarios
on employment. The reductions in economic output suggested by this study would
likely breakdown into a reduction in employment and a reduction in productivity.
Using an 80:20 split for this breakdown13 would suggest that long run impacts on
employment in Islington of Soft and Hard Brexit of -1.0% and -2.2% respectively. By
2030, this approximates to a reduction in jobs located in Islington of around 3,000
and 6,300 in the Soft and Hard Brexit scenarios respectively. Given the extent to
which Islington residents work outside of the borough the wider impact of the two
Brexit scenarios should be considered. Applying the same 80:20 decomposition to
the London GVA impacts shown in Table 16 would suggest that by 2030 this
approximates to a reduction in jobs in the Central London Forward area of around
39,500 and 79,000 in the Soft and Hard Brexit scenarios respectively.
CE (2018)
This study was undertaken for the Greater London Authority by Cambridge
Econometrics (CE). It looked at the potential impact of five different Brexit scenarios
on London, Inner and Outer London, and London’s sub-regional partnership areas,
including Central London Forward which includes Islington. The five scenarios are:
• Scenario 1 – continued membership of the Single Market and the Customs
Union from March 2019
• Scenario 2 – Two-year transition period followed by membership of the
Customs Union but not the Single Market
• Scenario 3 – Two-year transition period followed by membership of the Single
Market but not the Customs Union
• Scenario 4 - Two-year transition period followed by trading under WTO rules,
no UK-EU free trade agreement
• Scenario 5 – No transition period, followed by trading under WTO rules, no
UK-EU free trade agreement
13 This is based on how the modelled reduction in output in London breakdowns in the Cambridge Econometrics (2018) study for the Greater London Authority.
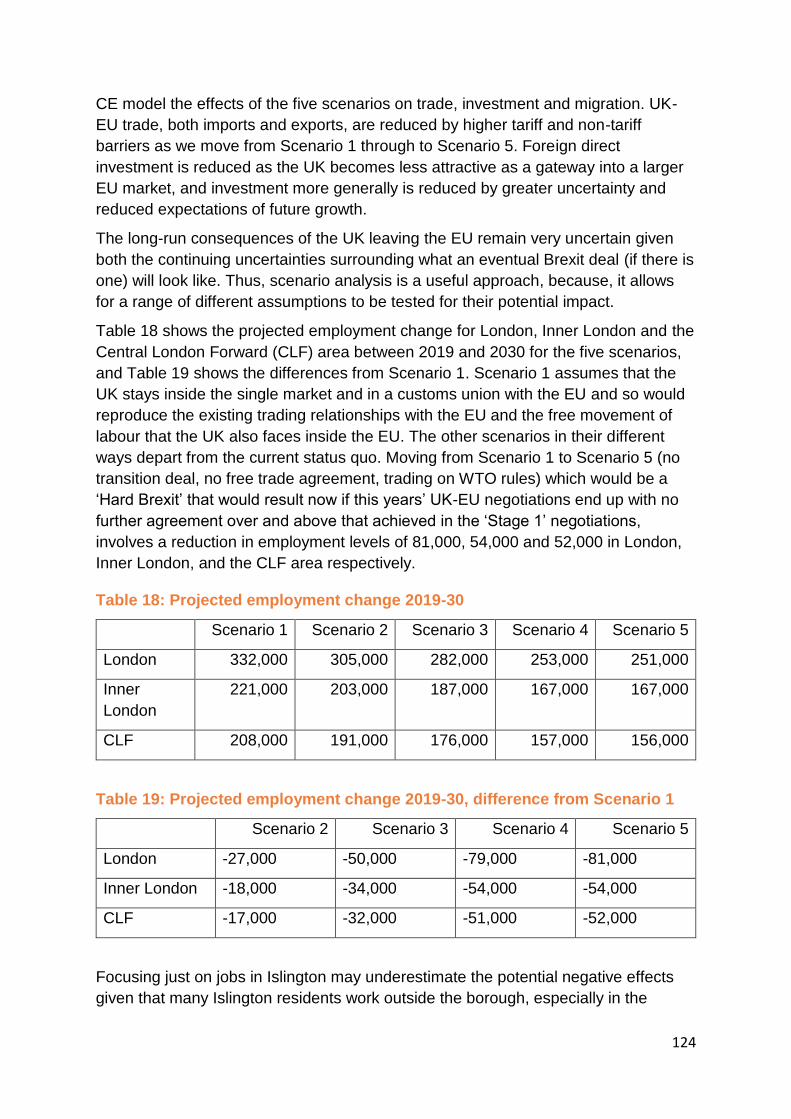
124
CE model the effects of the five scenarios on trade, investment and migration. UK-
EU trade, both imports and exports, are reduced by higher tariff and non-tariff
barriers as we move from Scenario 1 through to Scenario 5. Foreign direct
investment is reduced as the UK becomes less attractive as a gateway into a larger
EU market, and investment more generally is reduced by greater uncertainty and
reduced expectations of future growth.
The long-run consequences of the UK leaving the EU remain very uncertain given
both the continuing uncertainties surrounding what an eventual Brexit deal (if there is
one) will look like. Thus, scenario analysis is a useful approach, because, it allows
for a range of different assumptions to be tested for their potential impact.
Table 18 shows the projected employment change for London, Inner London and the
Central London Forward (CLF) area between 2019 and 2030 for the five scenarios,
and Table 19 shows the differences from Scenario 1. Scenario 1 assumes that the
UK stays inside the single market and in a customs union with the EU and so would
reproduce the existing trading relationships with the EU and the free movement of
labour that the UK also faces inside the EU. The other scenarios in their different
ways depart from the current status quo. Moving from Scenario 1 to Scenario 5 (no
transition deal, no free trade agreement, trading on WTO rules) which would be a
‘Hard Brexit’ that would result now if this years’ UK-EU negotiations end up with no
further agreement over and above that achieved in the ‘Stage 1’ negotiations,
involves a reduction in employment levels of 81,000, 54,000 and 52,000 in London,
Inner London, and the CLF area respectively.
Table 18: Projected employment change 2019-30
Scenario 1 Scenario 2 Scenario 3 Scenario 4 Scenario 5
London 332,000 305,000 282,000 253,000 251,000
Inner
London
221,000 203,000 187,000 167,000 167,000
CLF 208,000 191,000 176,000 157,000 156,000
Table 19: Projected employment change 2019-30, difference from Scenario 1
Scenario 2 Scenario 3 Scenario 4 Scenario 5
London -27,000 -50,000 -79,000 -81,000
Inner London -18,000 -34,000 -54,000 -54,000
CLF -17,000 -32,000 -51,000 -52,000
Focusing just on jobs in Islington may underestimate the potential negative effects
given that many Islington residents work outside the borough, especially in the
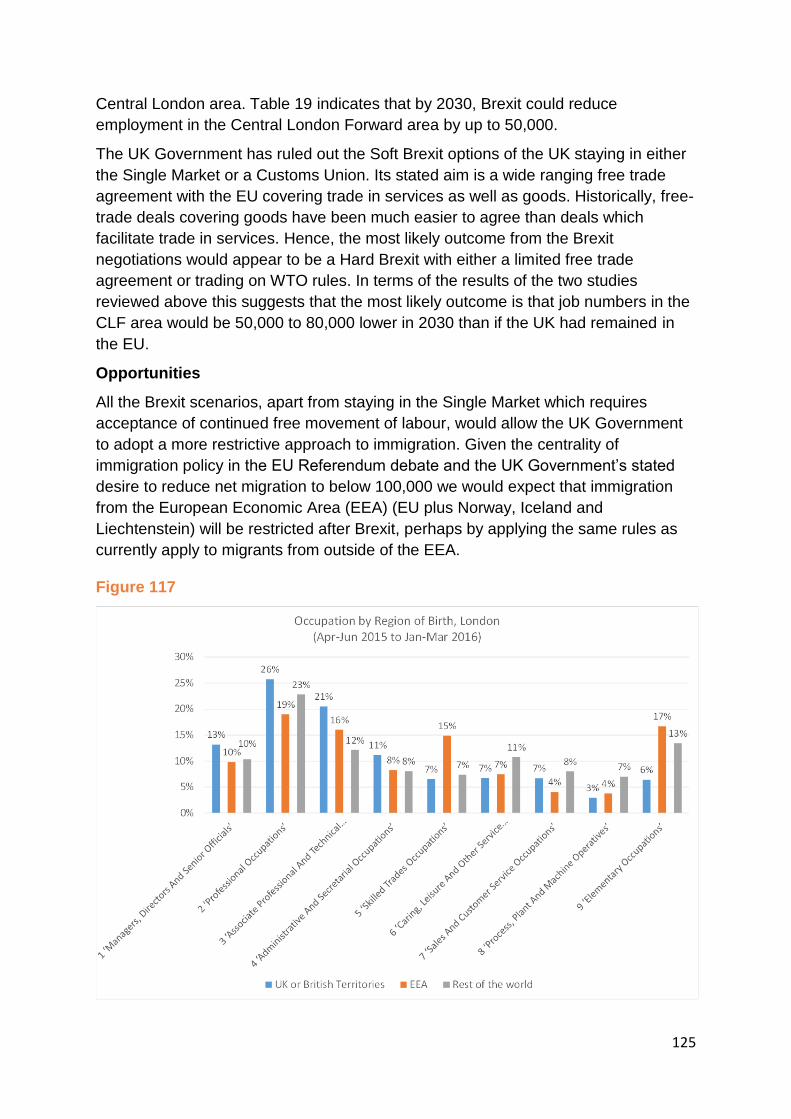
125
Central London area. Table 19 indicates that by 2030, Brexit could reduce
employment in the Central London Forward area by up to 50,000.
The UK Government has ruled out the Soft Brexit options of the UK staying in either
the Single Market or a Customs Union. Its stated aim is a wide ranging free trade
agreement with the EU covering trade in services as well as goods. Historically, free-
trade deals covering goods have been much easier to agree than deals which
facilitate trade in services. Hence, the most likely outcome from the Brexit
negotiations would appear to be a Hard Brexit with either a limited free trade
agreement or trading on WTO rules. In terms of the results of the two studies
reviewed above this suggests that the most likely outcome is that job numbers in the
CLF area would be 50,000 to 80,000 lower in 2030 than if the UK had remained in
the EU.
Opportunities
All the Brexit scenarios, apart from staying in the Single Market which requires
acceptance of continued free movement of labour, would allow the UK Government
to adopt a more restrictive approach to immigration. Given the centrality of
immigration policy in the EU Referendum debate and the UK Government’s stated
desire to reduce net migration to below 100,000 we would expect that immigration
from the European Economic Area (EEA) (EU plus Norway, Iceland and
Liechtenstein) will be restricted after Brexit, perhaps by applying the same rules as
currently apply to migrants from outside of the EEA.
Figure 117
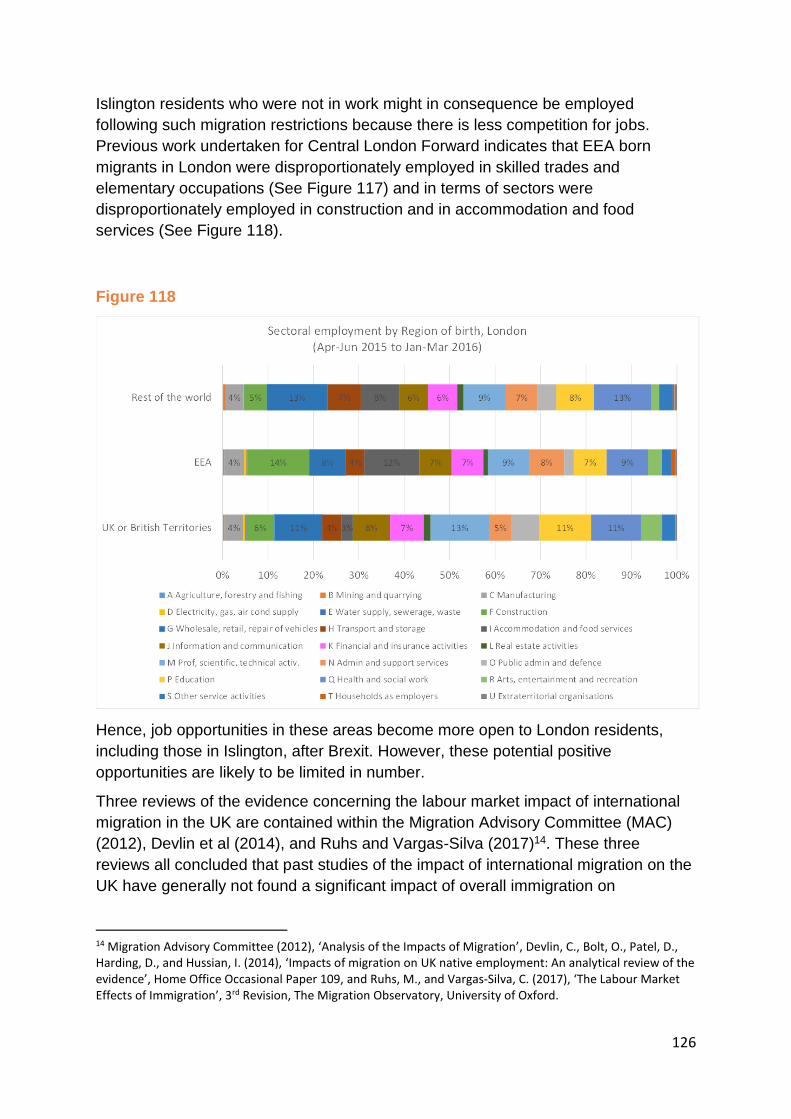
126
Islington residents who were not in work might in consequence be employed
following such migration restrictions because there is less competition for jobs.
Previous work undertaken for Central London Forward indicates that EEA born
migrants in London were disproportionately employed in skilled trades and
elementary occupations (See Figure 117) and in terms of sectors were
disproportionately employed in construction and in accommodation and food
services (See Figure 118).
Figure 118
Hence, job opportunities in these areas become more open to London residents,
including those in Islington, after Brexit. However, these potential positive
opportunities are likely to be limited in number.
Three reviews of the evidence concerning the labour market impact of international
migration in the UK are contained within the Migration Advisory Committee (MAC)
(2012), Devlin et al (2014), and Ruhs and Vargas-Silva (2017)14. These three
reviews all concluded that past studies of the impact of international migration on the
UK have generally not found a significant impact of overall immigration on
14 Migration Advisory Committee (2012), ‘Analysis of the Impacts of Migration’, Devlin, C., Bolt, O., Patel, D., Harding, D., and Hussian, I. (2014), ‘Impacts of migration on UK native employment: An analytical review of the evidence’, Home Office Occasional Paper 109, and Ruhs, M., and Vargas-Silva, C. (2017), ‘The Labour Market Effects of Immigration’, 3rd Revision, The Migration Observatory, University of Oxford.
127
employment and unemployment in the UK. One notable exception is Nathan (2011)15
which finds that a rise in the migrant population share in British cities reduces the
employment rates of the UK born population there who have low or intermediate
level skills. In contrast with these findings Wadsworth (2017)16 shows that if anything
areas which have seen higher increases in the share of migrants in the local
population have seen lower increases / falls in their local unemployment rate.
Jean and Jimenez (2007)17 in a cross-country study of 18 OECD countries, including
the UK, finds that an increase in migrants in the UK reduces employment of UK born
males and increases the unemployment of the UK born. However, these impacts are
only short run: the impact on employment only lasts for one year, while that for
unemployment only lasts for two to three years.
In addition, to reviewing the available literature on the impact of migration in the UK
the MAC also undertook an analysis of their own18. This analysis concluded that an
increase in non-EU migrants, but not EU migrants, for the 1995-2010 period reduced
the employment of the UK born population. This finding was assessed by Devlin et
al19 who found that the MAC’s results depended on the inclusion of data for 2009
and 2010. When data for these two years is excluded then the impact of non-EU
migration on the employment of the UK born population is no longer statistically
significant. The 2009 to 2010 period was one of a downturn the labour market with
rising unemployment. The MAC themselves say that their results are only statistically
significant when the economy is operating below full capacity. Hence, their results
may well not be relevant to the current period through to 2022, given the economy,
with the unemployment rate close to 4%, is operating at or near full employment.
Overall, there is little evidence to suggest that migration has caused the
displacement of UK born workers from the labour market in periods when the
economy has been strong. There is some evidence for such displacement in years
when the economy was weak. However, these appear to be only short run impacts
which dissipate in the longer term once the labour market adjusts.
Concerns that migrants may take jobs from UK born workers, focus on the fact that
migrants expand the supply of labour in the economy. However, in addition to this
immigration also increases the demand for labour. Migrants purchase goods and
services in the same way as the UK born population and expand consumer demand
for goods and services. This in turn should stimulate more business investment. Both
of these effects result in greater demand for labour. Hence, the impact of increased
immigration on the employment of the UK born population will depend on the
15 Nathan, M. (2011), ‘The long-term impacts of migration in British cities: Diversity, Wages, Employment and Prices 16 Wadsworth, J. (2017), ‘Immigration and the UK Economy’, Centre for Economic Performance, Election Analysis Paper No. 39. 17 Jean, S. and Jimenez, M. (2007), ‘The Unemployment Impact of Immigration in OECD Countries’, OECD Economics Department Working Paper No. 563. 18 MAC, op. cit. 19 Devlin, op. cit.

128
balance of labour supply and labour demand effects. It also highlights that the
number of jobs in an economy is not fixed (the “lump of labour fallacy”). During an
economic downturn labour demand may respond more slowly than during times of
faster economic growth and this may explain the finding that higher immigration
temporarily reduces the employment of the UK born population during periods of
economic weakness.
The corollary of this conclusion that higher migration to the UK has probably not
adversely impacted on the employment of the UK born population, apart from a
possible short run temporary impact, is that Brexit related reductions in immigration
will not generate significant additional employment opportunities for Islington’s
residents in the London labour market.
Protectionism
A rise in trade protectionism represents a risk to global economic growth which could
impact on the UK economy and so the employment located in Islington and the
employment opportunities of Islington residents. While there is much focus on the
trade policies of President Trump in the USA, protectionism has been in the rise
more widely than just the USA since the global financial crisis: since the global
financial crisis up to 2016 the number of trade limiting measures implemented by the
G20 countries has more than quadrupled20. This rise in protectionism matters
because there is a remarkable correlation between global GDP growth and global
trade growth. In the last five years global trade growth has been sluggish and much
lower than that experienced before the global financial crisis.
The major risk of substantially heightened trade protectionism is likely to originate in
the USA with President Trump. During his election campaign, Trump claimed that
China has undertaken ‘the greatest jobs theft in history’21, and threatened to impose
tariffs of 45% on Chinese exports to the USA. In office he has yet to impose such
tariffs, and instead has initiated numerous anti-dumping and countervailing duty
investigations against China. In addition, while previous US administrations tended
to take trade actions against China via the World Trade Organisation (WTO), Trump
has shifted to unilateral policy actions on China. Related to Trump’s antagonism
towards Chins is his January 2017 decision to withdraw the USA from the Trans-
Pacific Partnership (TPP) trade agreement to reduce tariff and non-tariff barriers to
trade between a group of Pacific countries, including China.
Trump has also described the North American Free Trade Agreement (NAFTA) as
‘the worst trade deal in history’22, and has promised to renegotiate or withdraw from
the agreement. In May 2017, he notified Congress of his intention to renegotiate the
agreement. In this context he threatened to impose 35% tariffs on Mexican exports
20 World Trade Organisation 2016, ‘Report on G20 Trade Measures (Mid-May 2016 to Mid-October 2016)’ Geneva. 21 Trump, D. 2016, Declaring American Economic Independence, Speech to Alumisource Factory, Monessen, Pennsylvania. 22 Ibid

129
to the USA where companies had shifted production from the USA to Mexico. More
widely, in a series of tweets in December 2016, Trump stated that any company that
shifted production from the USA to another country would face a 35 per cent tariff on
their exports to the USA.
More widely the Trump administration has sought to enact protectionist measures,
for example, the attempt to impose tariffs of 292% on imports of Bombardier C-series
jet aircraft, and Trump himself has criticised German trade policy as ‘very bad’23 for
the USA.
Up until very recently, Trump’s actions on trade, as opposed to his rhetoric, have not
been especially radical and have been more in line with the steady rise in
protectionism seen over the last 10 years. However, in early March 2018 Trump
imposed a 25 per cent tariff on steel imports and a 10 per cent tariff on aluminium
imports into the USA. A number of countries / trading blocs have intimated that they
will retaliate with tariffs on a range of American imports. In particular, the EU has
said that in the absence of being exempted from these tariffs, it would respond with
tariffs on a rage of US products including Harley-Davidson motorcycles and bourbon.
Trump has said that he would meet such a response from the EU with tariffs on
European cars.
This narrative clearly demonstrates the risks of a vicious spiral of heightening
protectionist measures leading to a full-blown trade war of the sort not seen since the
1930s, when average tariff levels rose substantially and world trade levels declined
by nearly 30% between 1929 and 1932. The likely result of such a scenario would be
global economic recession. As things stand today it remains very uncertain as to
how this latest episode will turn out in practice. For this and other reasons, it is not
possible to quantify the potential risks here or the impact on employment in Islington,
or the London labour market. It is clear, however, that the risks of substantially
heightened protectionism and so much lower global trade and global growth have
increased substantially as a result of Trump’s imposition of these steel and
aluminium tariffs.
23 Quoted in the Washington Post, 30 May 2017. Note that there is no such thing as German trade policy given Germany’s membership of the EU.
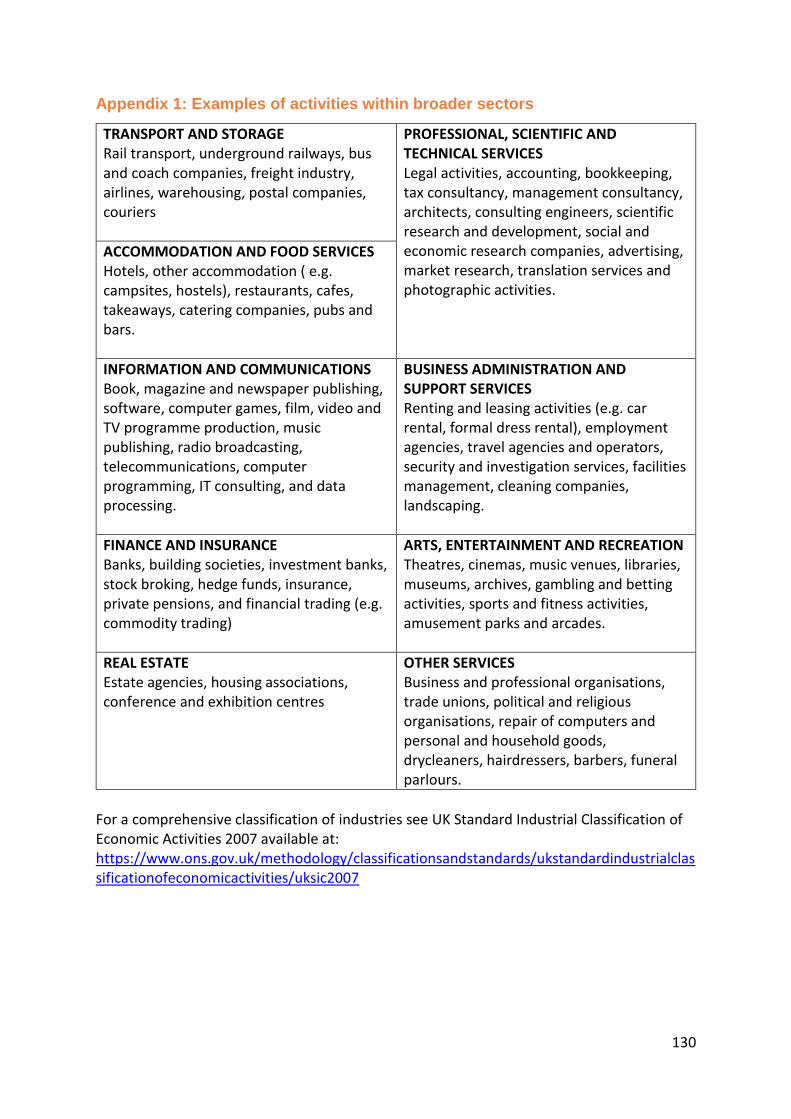
130
Appendix 1: Examples of activities within broader sectors
TRANSPORT AND STORAGE Rail transport, underground railways, bus and coach companies, freight industry, airlines, warehousing, postal companies, couriers
PROFESSIONAL, SCIENTIFIC AND TECHNICAL SERVICES Legal activities, accounting, bookkeeping, tax consultancy, management consultancy, architects, consulting engineers, scientific research and development, social and economic research companies, advertising, market research, translation services and photographic activities.
ACCOMMODATION AND FOOD SERVICES Hotels, other accommodation ( e.g. campsites, hostels), restaurants, cafes, takeaways, catering companies, pubs and bars.
INFORMATION AND COMMUNICATIONS Book, magazine and newspaper publishing, software, computer games, film, video and TV programme production, music publishing, radio broadcasting, telecommunications, computer programming, IT consulting, and data processing.
BUSINESS ADMINISTRATION AND SUPPORT SERVICES Renting and leasing activities (e.g. car rental, formal dress rental), employment agencies, travel agencies and operators, security and investigation services, facilities management, cleaning companies, landscaping.
FINANCE AND INSURANCE Banks, building societies, investment banks, stock broking, hedge funds, insurance, private pensions, and financial trading (e.g. commodity trading)
ARTS, ENTERTAINMENT AND RECREATION Theatres, cinemas, music venues, libraries, museums, archives, gambling and betting activities, sports and fitness activities, amusement parks and arcades.
REAL ESTATE Estate agencies, housing associations, conference and exhibition centres
OTHER SERVICES Business and professional organisations, trade unions, political and religious organisations, repair of computers and personal and household goods, drycleaners, hairdressers, barbers, funeral parlours.
For a comprehensive classification of industries see UK Standard Industrial Classification of Economic Activities 2007 available at: https://www.ons.gov.uk/methodology/classificationsandstandards/ukstandardindustrialclassificationofeconomicactivities/uksic2007
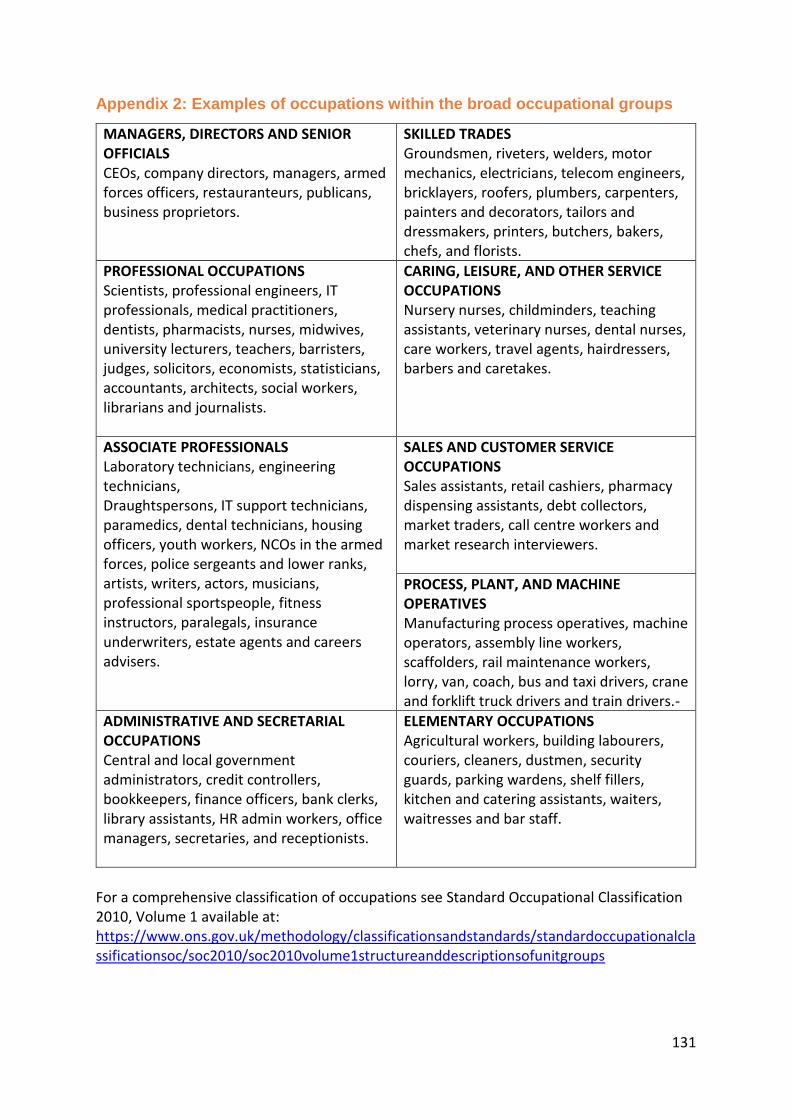
131
Appendix 2: Examples of occupations within the broad occupational groups
MANAGERS, DIRECTORS AND SENIOR OFFICIALS CEOs, company directors, managers, armed forces officers, restauranteurs, publicans, business proprietors.
SKILLED TRADES Groundsmen, riveters, welders, motor mechanics, electricians, telecom engineers, bricklayers, roofers, plumbers, carpenters, painters and decorators, tailors and dressmakers, printers, butchers, bakers, chefs, and florists.
PROFESSIONAL OCCUPATIONS Scientists, professional engineers, IT professionals, medical practitioners, dentists, pharmacists, nurses, midwives, university lecturers, teachers, barristers, judges, solicitors, economists, statisticians, accountants, architects, social workers, librarians and journalists.
CARING, LEISURE, AND OTHER SERVICE OCCUPATIONS Nursery nurses, childminders, teaching assistants, veterinary nurses, dental nurses, care workers, travel agents, hairdressers, barbers and caretakes.
ASSOCIATE PROFESSIONALS Laboratory technicians, engineering technicians, Draughtspersons, IT support technicians, paramedics, dental technicians, housing officers, youth workers, NCOs in the armed forces, police sergeants and lower ranks, artists, writers, actors, musicians, professional sportspeople, fitness instructors, paralegals, insurance underwriters, estate agents and careers advisers.
SALES AND CUSTOMER SERVICE OCCUPATIONS Sales assistants, retail cashiers, pharmacy dispensing assistants, debt collectors, market traders, call centre workers and market research interviewers.
PROCESS, PLANT, AND MACHINE OPERATIVES Manufacturing process operatives, machine operators, assembly line workers, scaffolders, rail maintenance workers, lorry, van, coach, bus and taxi drivers, crane and forklift truck drivers and train drivers.-
ADMINISTRATIVE AND SECRETARIAL OCCUPATIONS Central and local government administrators, credit controllers, bookkeepers, finance officers, bank clerks, library assistants, HR admin workers, office managers, secretaries, and receptionists.
ELEMENTARY OCCUPATIONS Agricultural workers, building labourers, couriers, cleaners, dustmen, security guards, parking wardens, shelf fillers, kitchen and catering assistants, waiters, waitresses and bar staff.
For a comprehensive classification of occupations see Standard Occupational Classification 2010, Volume 1 available at: https://www.ons.gov.uk/methodology/classificationsandstandards/standardoccupationalclassificationsoc/soc2010/soc2010volume1structureanddescriptionsofunitgroups