Embed Size (px)
Citation preview

Wayne State University
Wayne State University Dissertations
1-1-2015
Islet Dysfunction In DiabetesSyeda KhadijaWayne State University,
Follow this and additional works at: http://digitalcommons.wayne.edu/oa_dissertations
Part of the Medicinal Chemistry and Pharmaceutics Commons
This Open Access Dissertation is brought to you for free and open access by DigitalCommons@WayneState. It has been accepted for inclusion inWayne State University Dissertations by an authorized administrator of DigitalCommons@WayneState.
Recommended CitationKhadija, Syeda, "Islet Dysfunction In Diabetes" (2015). Wayne State University Dissertations. Paper 1342.

ISLET DYSFUNCTION IN DIABETES
by
KHADIJA G. SYEDA
DISSERTATION
Submitted to the Graduate School
of Wayne State University,
Detroit, Michigan
in partial fulfillment of the requirements
for the degree of
DOCTOR OF PHILOSOPHY
2015
MAJOR: PHARMACEUTICAL SCIENCES
Approved by:
_____________________________________ Advisor Date
_____________________________________
_____________________________________
_____________________________________
_____________________________________

ii
DEDICATION
This work is dedicated to my mother, whose love and prayers have been a constant source of
strength for me.

iii
ACKNOWLEDGEMENTS
At the outset, I would like to express my sincere gratitude to my advisor, Dr. Anjan
Kowluru, for first of all accepting to be a mentor for my graduate studies and research work, and
then, for being a constant source of inspiration, guidance and motivation throughout my learning
process. I have been privileged to have got the opportunity to be trained under the mentorship
of Dr. Kowluru so early in my career and it is a matter of pride for me to graduate from one of
the most productive and well run labs in the university.
I would like to extend my appreciation to all the previous and current members of Dr.
Kowluru’s lab especially, Abiy, Dr. Veluthakal, Vaibhav, Dr. Arora, Dr. Matti and Baker for their
support and encouragement during various phases of my research work.
I am deeply grateful to Dr. Chen, Dr. Hadden and Dr. Commissaris for being members of
my dissertation committee and for the time and constructive suggestions given by them during
the committee meetings. Their inputs and advice have been extremely valuable for making
progress in my project.
I would like to take this opportunity to extend my gratitude to Dr. Corcoran and the
members of the Department of Pharmaceutical Sciences for their continued support and
encouragement.
Special thanks to all my friends, old and new, for their tremendous support in times when
I needed it the most.
Finally, I would like to express my heartfelt appreciation towards each member of my
family for their steadfast care and encouragement during the tough times, their pride and
happiness during the good times and for their unconditional love throughout.

iv
TABLE OF CONTENTS
Dedication……………………………………………………………………………………...…….. ii
Acknowledgements…………………………………………………………………………………. iii
List of Tables……………………………………………………………………………………..….. vi
List of Figures…………………………………………………………………………….……….... vii
List of Abbreviations………………………………………………………………………………... xi
Chapter 1: Introduction……………………………………………………………………………. 1
Chapter 2: Materials and Methods……………………………………………………………….. 30
Chapter 3: Mitochondrial dysfunction induced by glucotoxic and diabetic conditions results in caspase mediated lamin degradation in pancreatic beta cells……………………. 37
Chapter 4: Identification of downstream signaling events involved in glucotoxicity induced endoplasmic reticulum [ER] stress leading to dysfunction in pancreatic β-cells………...…………………………………………………………………………… 55
Chapter 5: Consequences of inhibition of requisite post translational prenylation on the pancreatic β-cell………………………………………………………….………….. 73
Chapter 6: Discussion……………………………………………………………………………… 86
Chapter 7: Conclusion and Future directions………………………………………….…………. 99
Appendix A Syeda et al. 2013………………………………………………………………….…. 103
Appendix B Syeda et al. 2014……………………………………………………………………. 112
References………………………………………………………………………………………… 123
Abstract………………………………………………………………………………………....... 139

v
Autobiographical Statement……………………………………………………………………. 141
vi
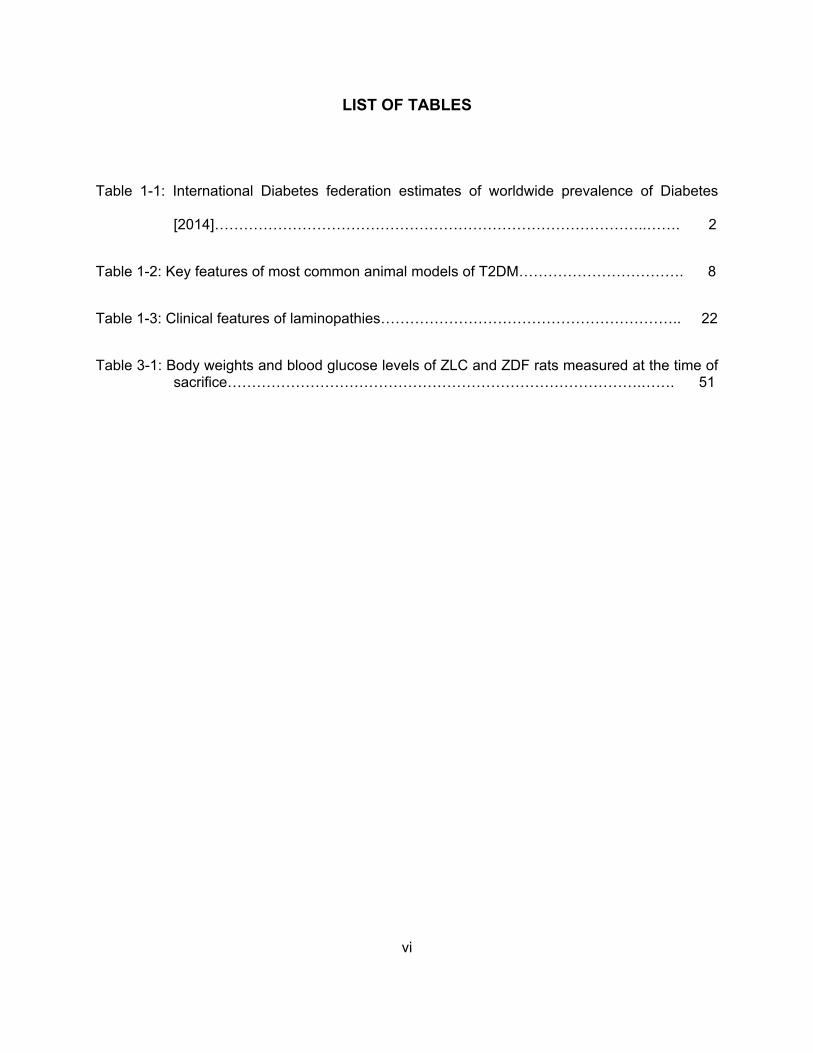
LIST OF TABLES
Table 1-1: International Diabetes federation estimates of worldwide prevalence of Diabetes
[2014]……………………………………………………………………………..……. 2
Table 1-2: Key features of most common animal models of T2DM……………………………. 8
Table 1-3: Clinical features of laminopathies…………………………………………………….. 22
Table 3-1: Body weights and blood glucose levels of ZLC and ZDF rats measured at the time of sacrifice………………………………………………………………………….……. 51

vii
LIST OF FIGURES
Figure 1-1: Worldwide incidence of Diabetes and projected increase of the disease by 2035, International Diabetes federation estimates 2014…………………..……………. 3
Figure 1-2: Pancreatic islets obtained from normal male Sprague Dawley rats observed under light microscope………………………………………………………….……..…… 4
Figure 1-3: Pathogenesis of T2DM.……………………………………………………………..... 7
Figure 1-4: Protein structure of lamins……………………………………………………………... 12
Figure 1-5: PTM steps involved in processing of nuclear lamins……………………………....... 15
Figure 1-6: Assembly and disassembly of the nuclear lamina……………………………........... 19
Figure 1-7: Acute and chronic effects of various glucose concentrations on the beta cell……. 27
Figure 1-8: Proposed working model for ER-stress induced, caspase-mediated degradation of nuclear lamins under glucotoxic conditions in pancreatic beta cells.………………………………………………………………………………….. 29
Figure 3-1: Exposure of INS-1 832/13 cells to glucotoxic conditions results in caspase 3 activation and lamin B degradation……………………………………………….. 41
Figure 3-2: Caspase 6 activation and lamin A cleavage in INS-1 832/13 cells treated with high glucose……………………………………………………………………………… 42
Figure 3-3: Glucotoxic conditions attenuate GSIS in INS-1 832/13 beta cells………..…….. 43
Figure 3-4: Treatment of normal rat islets with high glucose results in caspase 3 and 6 activation and hydrolytic cleavage of downstream substrates: lamin A and B……………… 45
Figure 3-5: Glucotoxic conditions promote caspase 3 and 6 activation and nuclear lamina breakdown in normal human islets treated with high glucose…………………….. 46
Figure 3-6: ZMPSTE 24 is expressed in INS-1 832/13 cells and normal human islets. Lack of effects of high glucose exposure on the expression of ZMPSTE24…………….. 48
Figure 3-7: Exposure to high glucose results in altered subcellular distribution of caspase 3 and degraded product of lamin B in INS-1 832/13 cells………………………………. 50
Figure 3-8: Activation of caspase and lamin degradation are observed in islets obtained from ZDF rats……………………………………………………………………………… 52

viii
Figure 3-9: Caspase 3 and 6 activation and lamin A and B degradation in diabetic human islets………………………………………………………………………………….. 53
Figure 4-1: Chemical Structure of Thapsigargin……………………………………………..… 55
Figure 4-2: Thapsigargin, a known inducer of ER stress, also promotes caspase 3 activation and lamin B degradation in INS-1 832/13 cells………………………………… 58
Figure 4-3: Akita mouse cells show noticeable increase in caspase 3 activation and lamin B degradation…………………………………………………………………………... 60
Figure 4-4: Chemical Structure of PBA………………………………………………………….. 60
Figure 4-5: PBA, a known inhibitor of ER stress, markedly attenuates glucose-induced CHOP expression, caspase 3 activation and lamin B degradation in INS-1 832/13 cells……………………………………………………………………………..… 61
Figure 4-6: Chemical Structure of Nifedipine………………………………………………… 62
Figure 4-7: Nifedipine, a calcium channel blocker, inhibits glucose-induced caspase 3 activation and lamin B degradation in INS-1 832/13 cells………………………………… 64
Figure 4-8: Z-DEVD-FMK, a known inhibitor of caspase 3, prevented high glucose induced caspase 3 activation and lamin B breakdown in INS-1 832/13 cells…………. 66
Figure 4-9: Z-DEVD-FMK, a known inhibitor of caspase 3, prevented high glucose induced caspase 6 activation and lamin A breakdown in INS-1 832/13 cells…………... 68
Figure 4-10: High glucose-induced caspase 6 activation and breakdown of lamin A cleavage were attenuated by Z-VEID-FMK, a specific inhibitor of caspase 6, in INS-1 832/13 cells……………………………………………………………………………………. 70
Figure 4-11: Rottlerin had no effect on high glucose induced activation of caspase 3 and lamin B
degradation…………………………………………………………………………… 72
Figure 5-1: The cholesterol biosynthesis pathway……………………………………………… 74
Figure 5-2: Exposure of INS-1 832/13 cells, rat pancreatic islets to simvastatin results in caspase 3 activation and degradation of lamin B along with changes in cell morphology…………………………………………………………………………… 76
Figure 5-3: Simvastatin treatment causes a marked increase in phosphorylation of p38 MAP Kinase and significantly decreases phosphorylation of phospho-p44/42 ERK1/2 and a reduction in cell viability……………………………………………………………. 79
Figure 5-4: FTI-277 treatment results in caspase 3 mediated degradation of lamin B along with alterations in its subcellular distribution and reduction in cell viability………… 82
Figure 5-5: GGTI-2147 has minimal effects on the integrity of nuclear lamin B and caspase 3 ……………………………………………………………………………………….. 84

ix
Figure 6-1: Working model for high glucose-mediated, ER-stress-induced β-cell damage/dysfunction via caspase 3 mediated degradation of lamin B in pancreatic beta cells…………………………………………………………………………….. 87
Figure 6-2: Chemical structures of inhibitors of protein prenylation…………………………. 94

x
LIST OF ABBREVIATIONS
CHOP: C/EBP homologous protein
ECL: Electrochemiluminescence
ELISA: Enzyme-linked immunosorbent assay
ER: Endoplasmic reticulum
ERK 1/2: extracellular mitogen regulated kinase ½
FBS: Fetal bovine serum
FPP: Farnesyl pyrophosphate
FTase: farnesyl transferase
FTI: farnesyl transferase inhibitor
GGPP: Geranylgeranyl pyrophosphate
GGTase: Geranylgeranyl transferase
GGTI: Geranylgeranyl transferase inhibitor
GSIS: Glucose stimulated insulin secretion
ICMT: Isoprenylcysteine carboxyl methyltransferase
IF: Intermediate filament
IFNγ: Interferon gamma
IL-1β: Interleukin-1beta

xi
LMNA: Lamin A gene
LMNB1: Lamin B1 gene
NE: Nuclear envelope
PACS-2: phosphor-acidic cluster sorting protein 2
PBA: 4-phenylbutyric acid
PTM: Post translational modification
T1DM: Type 1 Diabetes Mellitus
T2DM: Type 2 Diabetes Mellitus
Tg: Thapsigargin
TNFα: Tumor necrosis factor alpha
Z-DEVD-FMK: Caspase 3 inhibitor [Z-Asp-Glu-Val- Asp-fluoromethylketone]
ZDF: Zucker diabetic fatty
ZLC: Zucker lean control
ZMPSTE24: Zinc metallopeptidase [STE24 homolog]
Z-VEID-FMK: Caspase 6 inhibitor [Z-Val-Glu-Ile-Asp-fluoromethylketone
1
CHAPTER 1
INTRODUCTION
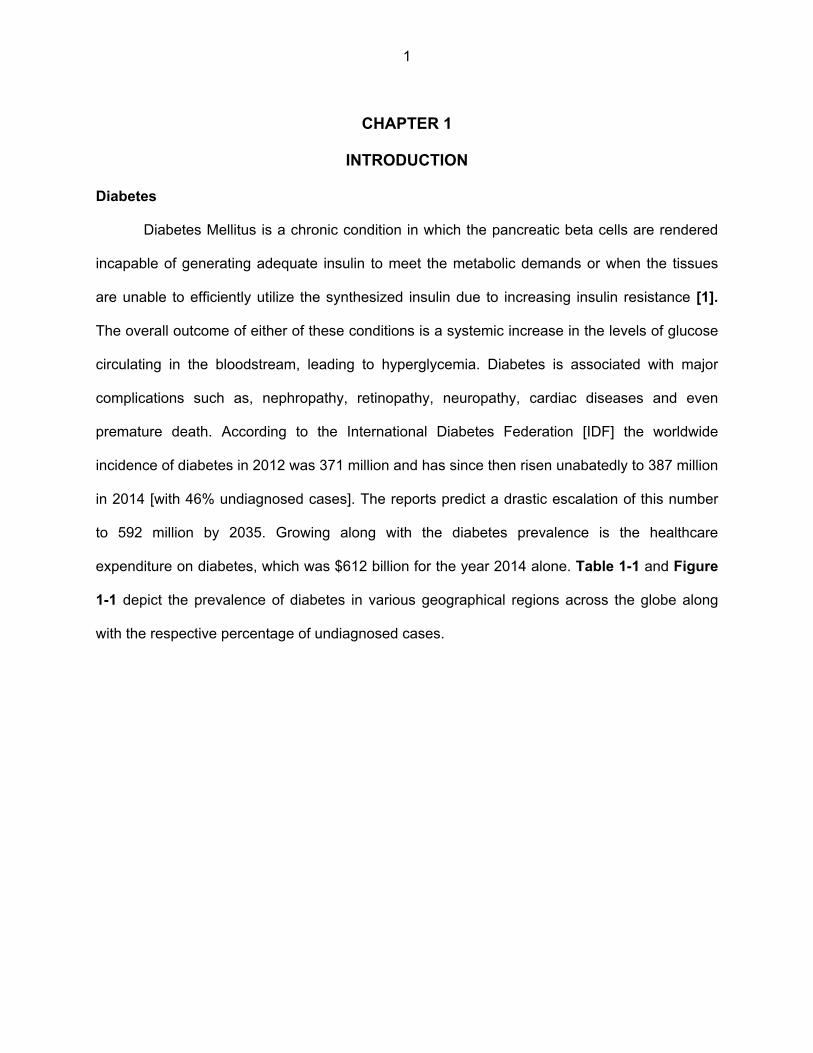
Diabetes
Diabetes Mellitus is a chronic condition in which the pancreatic beta cells are rendered
incapable of generating adequate insulin to meet the metabolic demands or when the tissues
are unable to efficiently utilize the synthesized insulin due to increasing insulin resistance [1].
The overall outcome of either of these conditions is a systemic increase in the levels of glucose
circulating in the bloodstream, leading to hyperglycemia. Diabetes is associated with major
complications such as, nephropathy, retinopathy, neuropathy, cardiac diseases and even
premature death. According to the International Diabetes Federation [IDF] the worldwide
incidence of diabetes in 2012 was 371 million and has since then risen unabatedly to 387 million
in 2014 [with 46% undiagnosed cases]. The reports predict a drastic escalation of this number
to 592 million by 2035. Growing along with the diabetes prevalence is the healthcare
expenditure on diabetes, which was $612 billion for the year 2014 alone. Table 1-1 and Figure
1-1 depict the prevalence of diabetes in various geographical regions across the globe along
with the respective percentage of undiagnosed cases.

2
Table 1-1: International Diabetes Federation estimates of worldwide prevalence of Diabetes [2014]. [http://www.idf.org/diabetesatlas]
International Diabetes Federation 2014 estimates of worldwide prevalence of Diabetes
REGION PEOPLE LIVING WITH
DIABETES
PERCENT PREVALENCE
UNDIAGNOSED CASES
North America and Caribbean (NAC)
39 Million 11.4% 27.1%
South and Central America (SACA)
25 Million 8.1% 27.4%
Europe (EUR) 52 Million 7.9% 33.1%
Middle East and North Africa (MENA)
37 Million 9.7% 48.6%
Africa (AFR) 22 Million 5.1% 62.5%
South-East Asia (SEA) 75 Million 8.3% 52.8%
Western Pacific (WP) 138 Million 8.5% 53.6%

3
Figure 1-1: Worldwide incidence of Diabetes and projected increase of the disease by 2035 International Diabetes Federation estimates 2014. [http://www.idf.org/diabetesatlas]
Type 1 Diabetes Mellitus [T1DM] and Type 2 Diabetes Mellitus [T2DM] are the 2 major forms of
diabetes.
T1DM: Previously called as juvenile onset diabetes, T1DM occurs early on in the
developmental stages during childhood or adolescence, and is a result of autoimmune-mediated
death of the beta cells of the islets of Langerhans. This results in a severe deficiency in the
synthesis and secretion of insulin by the pancreas. Genetic predisposition as well as
environmental factors could trigger the immune system to cause beta cell death in this form of
the disease. Patients with T1DM require daily doses of insulin for glucose homeostasis.
T2DM: T2DM is now a global health crisis and approximately 90% of cases of diabetes
fall under this class making it the most common form of diabetes. It is characterized by insulin
resistance manifested by target tissues [adipose, muscle], which the beta cells initially try to
2012 2014 2035
IDF estimates of Diabetes incidenceInciden
ce (Millions)
371 million
387 million
592 million

4
compensate for by synthesizing additional amounts of insulin [hyperinsulinemia]. However, as
the disease progresses, the beta cells are unable to cope with the rapidly rising blood glucose
levels and in due course, a decline in the secretion of insulin by the islet beta cells is observed,
followed by absolute insulin deficiency, hyperglycemia and onset of diabetes.
Pancreatic islets
The islets of Langerhans derive their name from the German pathologist Dr. Paul
Langerhans, who discovered this hormone-producing cluster of cells in the year 1869. The islets
are found in the pancreas, located in the abdominal cavity posterior to the stomach. Typically a
normal adult pancreas contains approximately a million islets. Each islet shows a well organized
structure made up of 3 main types of cells: alpha [15-20%], beta [~65–80%] and delta [~3-10%]
cells which secrete glucagon, insulin and somatostatin, respectively. Besides these, the islets
also contain small number of pancreatic polypeptide [PP] cells which produce pancreatic
polypeptide and Epsilon cells that secrete ghrelin [2, 3].
Figure 1-2: Pancreatic islets obtained from normal male, 8 week old, Sprague Dawley rats observed under light microscope. [The above image is a representative preparation that were used in my studies]

5
Fundamental role of beta cells in insulin secretion and maintenance of glucose
homeostasis
Under physiological conditions, a balance between the levels of glucose circulating in the
blood and the amount of glucose that the cells need for energy is tightly regulated, thus maintaining
glucose homeostasis. A balanced production and secretion of hormones by the islet cells is
essential towards maintaining optimum levels of glucose in the blood. After a meal, as the level
of glucose in blood circulation ascends, the beta cells respond by secreting insulin. This
facilitates the uptake of glucose by the muscle and adipose cells, thereby bringing the blood glucose
levels back to a normal level. On the other hand, when blood glucose levels are low, the alpha cells
release glucagon. This hormone exerts its stimulatory action on the liver, inducing the release of
stored glucose from glycogen, and in doing so; glucose homeostasis is re-established [4].
The process of insulin secretion is very tightly regulated and involves a few key steps.
1. An increase in the blood glucose levels causes the uptake of glucose molecules by
the GLUT-2 transporters located on the beta cells.
2. The internalized glucose undergoes metabolism generating high amounts of ATP
in the process.
3. As the ATP/ADP ratio in the cell increases, it causes the closing of the ATP
sensitive K+ channels, resulting in membrane depolarization.
4. Following this, the voltage dependent Ca++ channels open up leading to influx of
Ca++ ions into the cell.
5. Ca++ promotes the movement of insulin-laden secretory granules towards the
plasma membrane where they fuse and release the insulin [5].

6
Factors that impair insulin release into the bloodstream cause a reduction in glucose uptake by the
insulin-sensitive muscle and adipose tissues, which leads to increased levels of glucose circulating
in the blood or hyperglycemia, a hallmark of T2DM.
Pathogenesis of T2DM
Beta cell dysfunction and insulin resistance are the 2 major contributing factors to the
pathogenesis of T2DM. However, a lot remains to be understood in regard to the exact
mechanisms that the beta cells undergo during these events. Insulin secretion by the beta cell
occurs in a biphasic fashion; with the first phase burst occurring within 5-10 minutes of glucose
ingestion, with the release of insulin from the granules docked at the membrane, followed by a
steady second phase, which involves the mobilization of the insulin granules from the reserve
pool in the cell towards the plasma membrane for exocytosis [6]. Insulin release is considered
as a direct measure of beta cell function and any impairment in either phase of insulin secretion,
chiefly the first phase, may be the earliest evidence of an individual’s progression towards
T2DM. Assessment of insulin secretion as a function for beta cell performance is most
commonly done by measurement of fasting plasma insulin concentrations, HOMA-B index
[fasting insulin to fasting glucose ratios], plasma C-peptide concentrations, acute insulin
response [7, 8]. Insulin resistance is manifested by impairment in uptake of glucose by the
insulin sensitive tissues [muscle and adipose] and could be a result of genetic and
environmental factors, diet-induced obesity, inflammatory cytokines or cellular stress signaling.
There has been considerable deliberation over the specific contribution of beta cell failure and
insulin resistance and sequence of occurrence of either of these events towards the progression
of T2DM. However, the two events are not mutually exclusive and there exists a feedback
communication between them [7]. The beta cell tries to play a compensatory role under
conditions of insulin resistance, and as T2DM progresses the exhausted beta cell is unable to
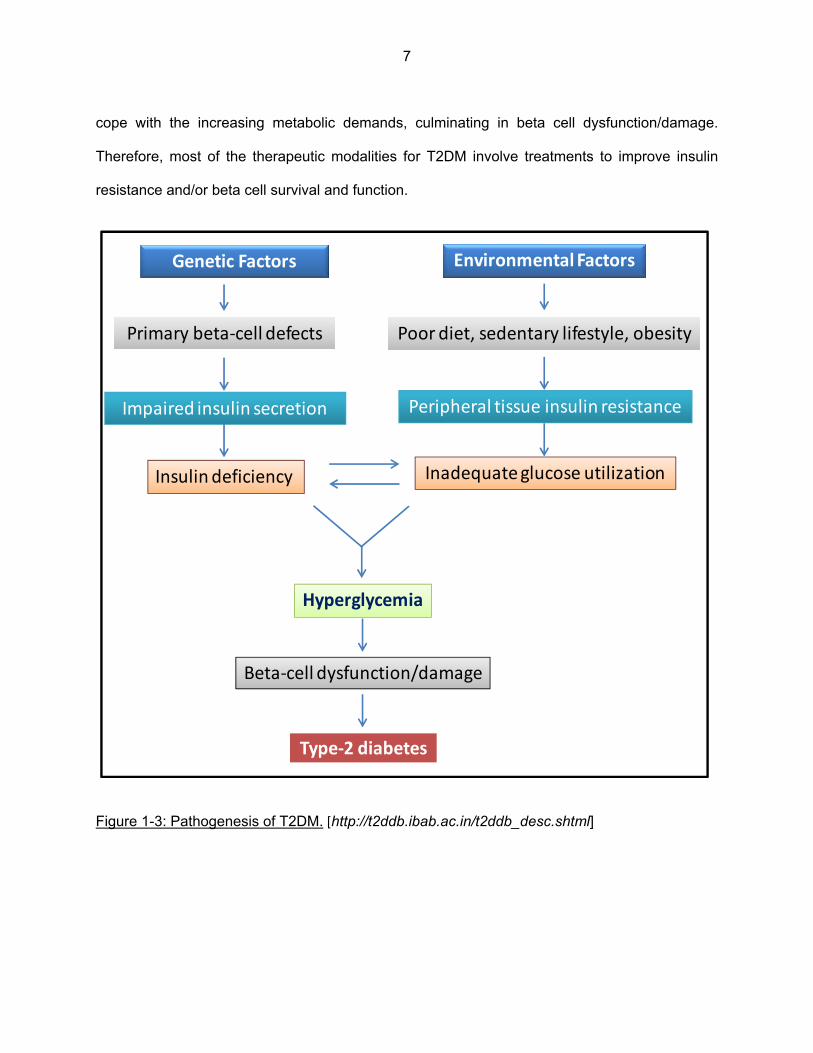
7
cope with the increasing metabolic demands, culminating in beta cell dysfunction/damage.
Therefore, most of the therapeutic modalities for T2DM involve treatments to improve insulin
resistance and/or beta cell survival and function.
Figure 1-3: Pathogenesis of T2DM. [http://t2ddb.ibab.ac.in/t2ddb_desc.shtml]
Genetic Factors Environmental Factors
Poor diet, sedentary lifestyle, obesityPrimary beta‐cell defects
Impaired insulin secretion Peripheral tissue insulin resistance
Inadequate glucose utilization
Hyperglycemia
Beta‐cell dysfunction/damage
Type‐2 diabetes
Insulin deficiency

8
Animal models of T2DM
Generally, animal models of T2DM display obesity and manifest insulin resistance
and/or beta cell dysfunction. Table 1-2 enlists the most common animal models used in T2DM
research along with the method of induction and basic features [9, 10 and 11].
Model T2DM induction method Features
Lep ob/ob mice
[Obese]
Spontaneous mutation in ob
gene coding for the protein leptin
Leptin deficiency
Exhibit rapid weight gain ~2
weeks
Obesity induced hyperglycemia
Develop hyperinsulinemia and
insulin resistance in 3-4 weeks
Lepr db/db mice
[Obese]
Autosomal recessive mutation in
Leptin receptor gene- Lepr
Leptin receptor deficient
Hyperinsulinemia and insulin
resistant [~2 weeks]
Obesity [~3-4 weeks]
Hyperglycemia [~4-8 weeks] due
to beta cell failure
Short life span

9
Zucker Diabetic
Fatty [ZDF] rat
[Obese]
Point mutation in Leptin receptor
gene- Lepr
Obesity [~4 weeks]induced
hyperglycemia [~7 weeks]
Hyperinsulinemia followed by
decrease in insulin levels
Diabetes develops at ~8-10
weeks
Kuo Kondo [KK]
mice
Mildly obese polygenic model of
T2DM and obesity
Obesity induced hyperglycemia
Severe hyperinsulinemia and
insulin resistance in muscle and
adipose tissue
High fat feeding
[C57BL/6] mice
Diet/Nutrition induced obesity Obesity induced hyperglycemia
Hyperinsulinemia
Weight gain linked to insulin
resistance
Glucose intolerance due to beta
cell insufficiency
Goto-Kakizaki [GK]
rat
Non-obese Defective glucose induced insulin
secretion

10
Hyperglycemia caused by loss of
beta cell function
Akita mice
[Ins2Akita]
Mutation in insulin gene-
Ins2,causing misfolding of insulin
in the ER resulting in beta cell
damage/death
Pancreatic beta cell damage due
to ER stress
Table 1-2: Key features of most common animal models of T2DM
Nuclear lamins
The nucleus of a cell is surrounded by a protective bilayer; comprised of the inner
nuclear membrane [INM] and the outer nuclear membrane [ONM], which are collectively called
the nuclear envelope [NE]. The globular form of the nucleus is held together by a network of
filaments on the inner surface of the INM that provide mechanical support and maintain nuclear
integrity [12]. This network of filaments is known as the nuclear lamina and the major proteins of
the lamina are the nuclear lamins which are type V intermediate filaments [IF]. The lamin protein
network in the nucleus is situated on the inner [nucleoplasm facing] side of the INM, in close
proximity to the outer fringes of chromatin [13]. In addition to being important elements of the
nuclear architecture, the nuclear lamins play an essential role in critical functions of the nucleus,
such as nucleoplasmic organization of chromatin, DNA replication and damage repair [14, 15,
and 16].
The lamin protein family is classified on the basis of the gene responsible for encoding of
that particular lamin. Therefore, in humans, lamin A and C which are formed by alternative
11
splicing of the gene LMNA are placed in the same class [Type A] along with scarce isoforms,
A∆10 and C2, whereas lamin B1 and B2/B3, which are encoded by the genes LMNB1 and
LMNB2 respectively, are Type B lamins. Type A lamins are expressed in differentiated cells,
have neutral isoelectric points whereas, at least one of the type B lamins is expressed in every
cell irrespective of differentiation status, have acidic isoelectric points, and during mitosis tend to
remain associated with the nuclear membrane [17-19].
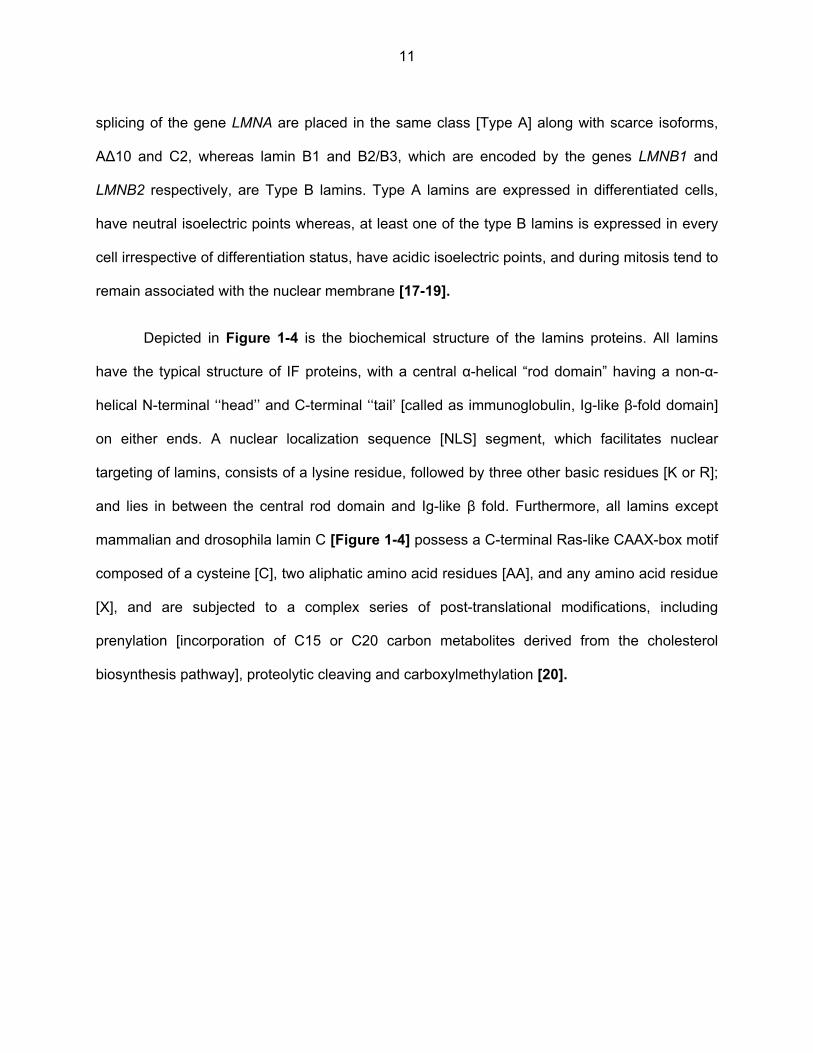
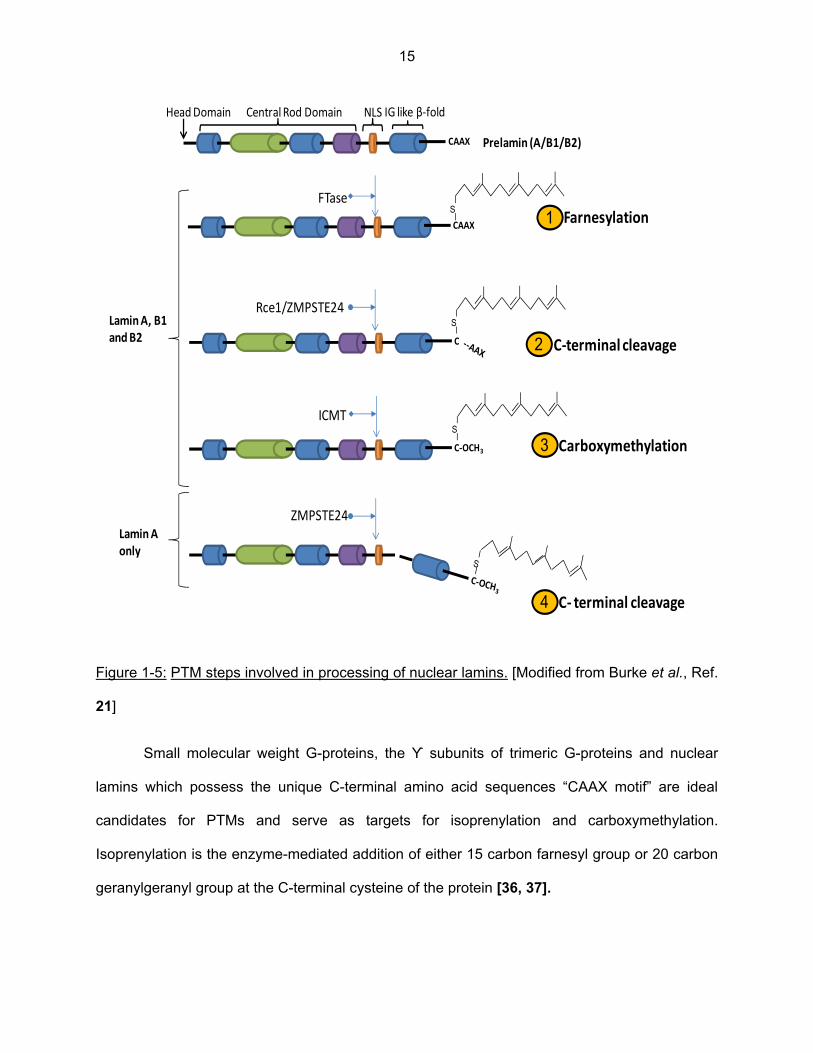
Depicted in Figure 1-4 is the biochemical structure of the lamins proteins. All lamins
have the typical structure of IF proteins, with a central α-helical “rod domain” having a non-α-
helical N-terminal ‘‘head’’ and C-terminal ‘‘tail’ [called as immunoglobulin, Ig-like β-fold domain]
on either ends. A nuclear localization sequence [NLS] segment, which facilitates nuclear
targeting of lamins, consists of a lysine residue, followed by three other basic residues [K or R];
and lies in between the central rod domain and Ig-like β fold. Furthermore, all lamins except
mammalian and drosophila lamin C [Figure 1-4] possess a C-terminal Ras-like CAAX-box motif
composed of a cysteine [C], two aliphatic amino acid residues [AA], and any amino acid residue
[X], and are subjected to a complex series of post-translational modifications, including
prenylation [incorporation of C15 or C20 carbon metabolites derived from the cholesterol
biosynthesis pathway], proteolytic cleaving and carboxylmethylation [20].
12
Figure 1-4: Protein structure of lamins. [Modified from Burke et al., Ref. 21] Functions of nuclear lamina in cellular physiology and nuclear processes:
1) Mechanical Support:
A number of early studies have described lamins as structures comparable to IFs which
are insoluble in non ionic detergents [22-24]. Further studies involving mutational analyses of
nuclear lamina proteins [lamins A, C and B1] by Lammerding and associates demonstrated a
decrease in nuclear rigidity in cells devoid of lamins A and C exhibiting frailty of the nucleus,
A C
B
B1 B2
LMNA gene (alternative splicing )
LMNB1 gene
LMNB2 gene
586/620Central Rod Domain NLS IG like -foldHead Domain
Lamin B1/B2 CAAX
CAAX
664Central Rod Domain NLS IG like -foldHead Domain
Pre-lamin A
646
Lamin A
572
Lamin C
LAMINS

13
which leads to increased cell death induced by mechanical stress. Lamin B1-deficient cells
however, did not display aberrant nuclear mechanics, even though appearance of nuclear blebs
increased significantly [25]. Another rheological study conducted on lamin B 1 filaments
demonstrates that these filaments exhibit tough elasticity when exposed to shear stress and the
disintegration of the nuclear envelope would entail mechanical stress as well as biochemical
alterations of lamin B1 [26]. These studies highlight the importance of lamins A and C in
maintaining the mechanical stiffness of nuclei, and lamin B1 towards preserving nuclear
integrity.
2) Chromatin Organization:
At the molecular level, lamins bind to regions of the chromatin via chromatin binding
proteins or by direct interaction. It has been shown that lamins form attachments with histones,
DNA and chromatin-associated protein apart from directly associating with Lamin B receptors
[LBR]. An earlier study conducted by Taniura and colleagues has identified chromatin binding
sites on the tail region of lamins C, B1 and B2 [27]. The transcriptionally silent heterochromatin
is localized near the periphery of nuclei of most cells and lamins mediate the attachment of
chromatin to the nuclear envelope. Studies conducted in LMNA knockout mice have shown that
localization of the heterochromatin is completely lost from the nuclear periphery especially in
fibroblasts and myocytes [28, 29]. Similar phenotypical abnormalities have been noted in
fibroblasts of patients with Hutchinson–Gilford progeria syndrome [HGPS] — a clinical disorder
caused by mutations in the LMNA gene [30].

14
3) DNA replication:
An increasing body of evidence suggests that lamins play a key role in regulating the
complex DNA replication process. One such study by Moir et al. demonstrated, in 3T3 cells
exposed to BrDU and stained with proliferating cell nuclear antigen [PCNA], that lamin B1
localizes at the replication foci with BrDU and the replication factor PCNA in replication sites
during “S phase”, suggesting the potential role of lamins in replication [31]. Most of the evidence
showing the association of lamin and replication process is based on studies carried out in vitro
in Xenopus egg interphase nuclei extracts. Xenopus eggs when immunodepleted with XLB3, a
major lamin in this species, or when transfected with a dominant-negative N-terminally deleted
mutant of lamin B1, exhibited a reduction in DNA replication [32-34]. Evidence for the
importance of lamins in transcription is shown in studies with N-terminally deleted lamins, which
disrupts the head-to-tail assembly of lamin dimers and the subsequent formation of lamin
filament structures. This N-terminally deleted mutant of lamins, when inserted in Xenopus
embryos, bring about dissociation of the lamina which then leads to a decrease in RNA
polymerase II activity, which is directly involved in the process of transcription [35].
Processing of pre-lamins for the formation of mature lamin filaments
Post-Translational Modification
Post translational modifications [PTMs] are a series of steps implicated in the priming and
processing of proteins and play a vital role in enhancing the functional range of the protein.
They involve covalent addition of certain functional groups [phosphorylation, methylation,
prenylation etc.], enzymatic cleavage of regulatory subunits or degradation of entire proteins
[ubiquitination] and influence major facets of cell physiology and pathology. Identifying and
understanding PTMs is critical in the study of cell biology and disease preclusion and therapy.
15
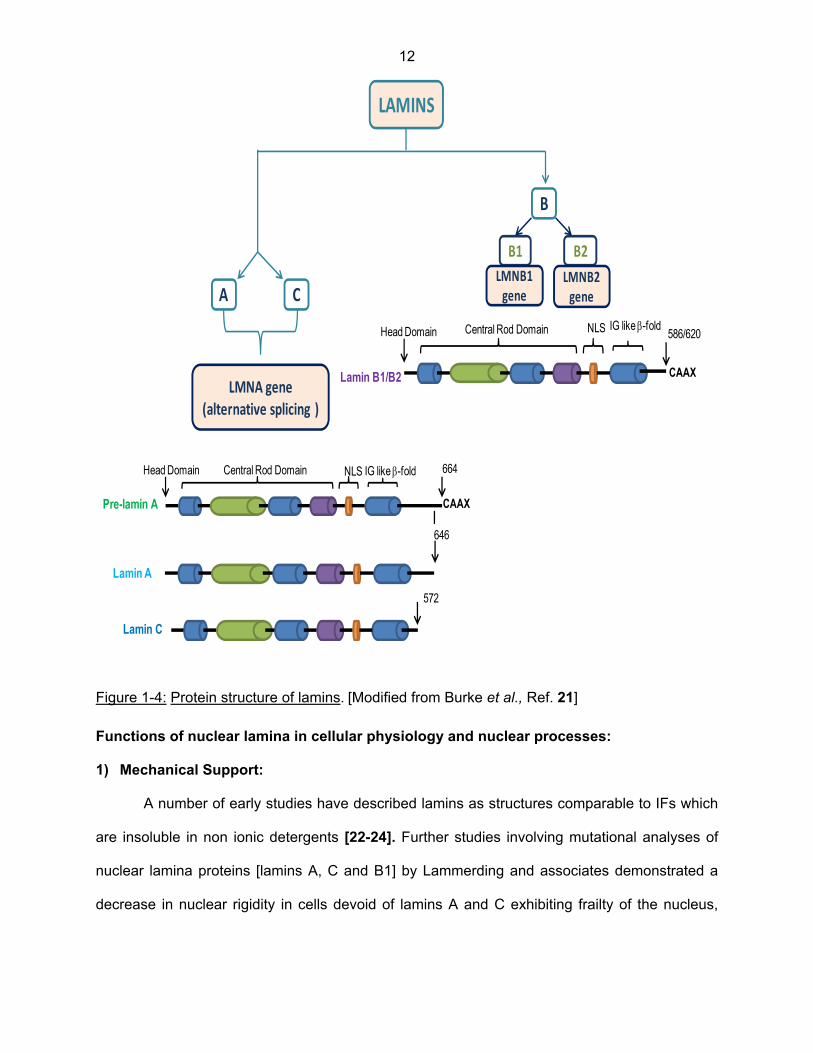
Figure 1-5: PTM steps involved in processing of nuclear lamins. [Modified from Burke et al., Ref.
21]
Small molecular weight G-proteins, the ϒ subunits of trimeric G-proteins and nuclear
lamins which possess the unique C-terminal amino acid sequences “CAAX motif” are ideal
candidates for PTMs and serve as targets for isoprenylation and carboxymethylation.
Isoprenylation is the enzyme-mediated addition of either 15 carbon farnesyl group or 20 carbon
geranylgeranyl group at the C-terminal cysteine of the protein [36, 37].
1
CAAX
FarnesylationFTase
C‐terminal cleavage
Rce1/ZMPSTE24
Carboxymethylation
ICMT
ZMPSTE24
C‐ terminal cleavage
CAAX
C
S
C‐OCH3
S
Lamin A, B1 and B2
Lamin A only
S
Prelamin (A/B1/B2)
2
3
4
Central Rod Domain NLS IG like β‐foldHead Domain

16
Lamins A, B1 and B2, which are initially translated in the form of pre-lamins, possess the
C-terminal CAAX motif which marks the proteins for farnesylation of the cysteine residue [21].
Lamins require additional PTMs at CAAX box in order to be converted to their mature form.
Soon after their synthesis, lamins are subjected to a multistep PTM process, in the following
order: initial farnesylation by the enzyme farnesyltransferase [FTase], endoproteolytic cleavage
of C-terminal -AAX amino acids by Ras converting enzyme 1 [Rce-1] or Zinc metallopeptidase
[ZMPSTE24] and finally carboxymethylation by isoprenylcysteine carboxyl methyltransferase
[ICMT] [38, 39]. B type lamins are permanently farnesylated and carboxymethylated while
prelamin A undergoes an additional step of removal of 15 amino acids at the C-terminal by
ZMPSTE24 to generate mature lamin A which lacks the modifications at the C-terminal. This
step is unique to lamin A. Lamin C on the other hand, does not possess the CAAX motif and
hence is not farnesylated or modified [21, 39, and 40].
Farnesylation:
The major purpose of these lipid post-translational modifications of lamins is directing
them towards the membrane for protein-membrane interactions or protein-protein interactions
for nuclear envelope assembly, which begins with the insertion of a 15 carbon farnesyl group at
the C-terminal cysteine and is an irreversible modification [36]. Farnesyl pyrophosphate is a
metabolite derived during the synthesis of cholesterol from mevalonate. The presence of CAAX
motif at C-terminal of lamins marks them as target proteins for FTase-catalyzed farnesylation.
FTase incorporates this 15 carbon derivative of mevalonate into the C-terminal cysteine residue
which has been shown to increase the hydrophobicity of the proteins and results in membrane
targeting [20]. A recent study by Jung and colleagues has highlighted the role of farnesylation of
lamin B in neuronal development. They have developed knock-in mice expressing non-
farnesylated versions of lamin B1 and lamin B2. In this study, the non-farnesylated lamin B1

17
expressing mice died due to neuronal abnormalities since the chromatin could not be retained
within the nuclear lamina during the process of neuronal migration [41].
Endoproteolytic cleavage:
Endoproteolytic cleavage involves the shortening of the C-terminal by severing the last 3
amino acids of the CAAX motif by either Rce-1 or ZMPSTE24, and the subsequent removal of
the last 15 amino acids by ZMPSTE24 in the case of prelamin A producing mature lamin A [42].
Rce-1 is a type II CAAX prenyl endopeptidase with a wide specificity, processing all
farnesylated and geranylgeranylated CAAX proteins while ZMPSTE24 is a type I CAAX
processing enzyme and has a specific role in processing of prelamin A [43, 44]. These are
integral membrane proteins that reside in the ER and INM. Recently, Manolaridis and
associates have reported the crystal structure of an Rce-1 homologue from Methanococcus
maripaludis, which has specificity for farnesylated peptides similar to that shown by eukaryotic
Rce-1 [38].
Carboxymethylation:
The next step in the PTM of lamins is the addition of carboxymethyl group to farnesyl
cysteine of CAAX box by ICMT, a prenyl-protein specific methyltransferase of the ER. Initial
studies from our laboratory have characterized the carboxylmethylation of lamin by vapor phase
equilibration assay using either [3H] S-adenosyl methionine in cell lysates or [3H]-methionine in
intact cells. The initial observation characterized a protein in the molecular range of 65-70 kDa
was carboxymethylated. Further, studies were carried out by immunoprecipitating the lysates or
intact beta cells after incubating with [3H] S-adenosyl methionine or [3H]-methionine using anti-
lamin B antibody suggested that the methylated protein was lamin B [45].

18
Although farnesylation of lamins is involved in increasing their hydrophobicity and driving
them towards the nuclear membrane, both endoproteolytic cleavage and carboxymethylation
play an essential role in the proper formation of the nuclear lamina as shown in a recent study
by Maske et al. They have demonstrated that absence of endoproteolysis or carboxymethylation
in the C-terminal of lamins would lead to distorted nuclear lamina [46].
B type lamins are permanently farnesylated and carboxymethylated while prelamin A
undergoes an additional endoproteolytic cleavage step and finally converts into mature lamin A
[21]. Recently we have also shown in INS-1 832/13 cells that ICMT produces an increase in
activity of a small molecular weight GTP binding protein, Rac1, which is essential for the
assembly of NOX2. NOX2 holoenzyme assembly mediates the production of reactive oxygen
species [ROS], which is necessary for GSIS [47].
Nuclear lamina assembly and disassembly
Nuclear lamina assembly is a dynamic process that begins after the sister chromatids are
formed during anaphase and in final stages of mitosis, especially telophase. The nuclear
envelope [NE] and its associated structures start to reassemble around the separated sister
chromosomes to form functional daughter nuclei. Nuclear reassembly is characterized at
molecular level based on a tightly regulated sequence of protein interactions, which occur in the
following order: [i] targeting of individual nucleoskeletal proteins to the chromosomal surface, [ii]
membrane recruitment and fusion, [iii] assembly of nuclear pore complexes [NPCs], [iv]
transport of the bulk of lamins into the nucleus through newly formed NPCs, and [v] formation of
the nuclear lamina and, at the early G1 phase, the chromatin becomes fully enclosed by an
intact NE. As the nucleus enlarges by import of nuclear proteins through NPCs, the NE expands
and the chromatin becomes fully de-condensed. Being intermediate filament proteins, lamins

19
assemble together to form the nuclear lamina meshwork that remains connected during
interphase, but disassembles during mitosis [48, 49].
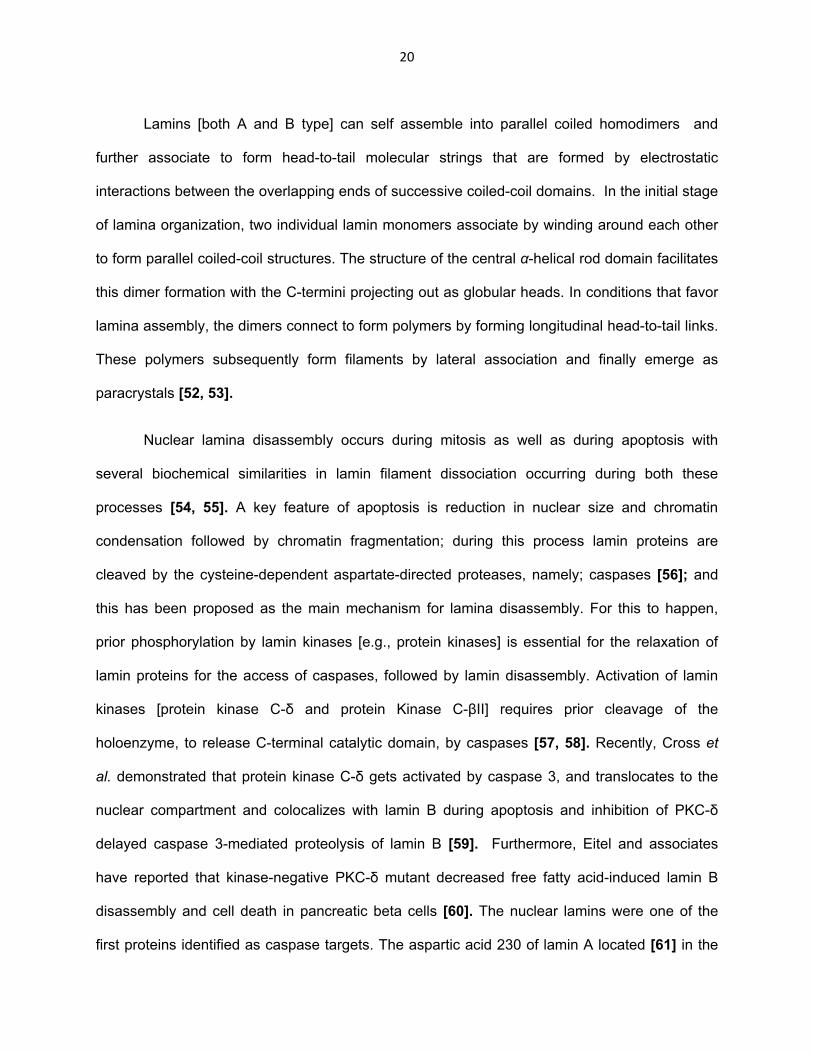
Figure 1-6: Assembly and disassembly of the nuclear lamina. [Modified from Davidson et al. Ref. 50 and THE CELL, Third Edition Ref. 51].
Lamin polypeptide
Dimer
Head-to-tail association of dimers
Polymer
Filament
Side by side association of polymers
Lamin Filament
Phosphorylation
LaminDimersPP
P
P
PP
P
P
PP
P
P
20
Lamins [both A and B type] can self assemble into parallel coiled homodimers and
further associate to form head-to-tail molecular strings that are formed by electrostatic
interactions between the overlapping ends of successive coiled-coil domains. In the initial stage
of lamina organization, two individual lamin monomers associate by winding around each other
to form parallel coiled-coil structures. The structure of the central α-helical rod domain facilitates
this dimer formation with the C-termini projecting out as globular heads. In conditions that favor
lamina assembly, the dimers connect to form polymers by forming longitudinal head-to-tail links.
These polymers subsequently form filaments by lateral association and finally emerge as
paracrystals [52, 53].
Nuclear lamina disassembly occurs during mitosis as well as during apoptosis with
several biochemical similarities in lamin filament dissociation occurring during both these
processes [54, 55]. A key feature of apoptosis is reduction in nuclear size and chromatin
condensation followed by chromatin fragmentation; during this process lamin proteins are
cleaved by the cysteine-dependent aspartate-directed proteases, namely; caspases [56]; and
this has been proposed as the main mechanism for lamina disassembly. For this to happen,
prior phosphorylation by lamin kinases [e.g., protein kinases] is essential for the relaxation of
lamin proteins for the access of caspases, followed by lamin disassembly. Activation of lamin
kinases [protein kinase C-δ and protein Kinase C-βII] requires prior cleavage of the
holoenzyme, to release C-terminal catalytic domain, by caspases [57, 58]. Recently, Cross et
al. demonstrated that protein kinase C-δ gets activated by caspase 3, and translocates to the
nuclear compartment and colocalizes with lamin B during apoptosis and inhibition of PKC-δ
delayed caspase 3-mediated proteolysis of lamin B [59]. Furthermore, Eitel and associates
have reported that kinase-negative PKC-δ mutant decreased free fatty acid-induced lamin B
disassembly and cell death in pancreatic beta cells [60]. The nuclear lamins were one of the
first proteins identified as caspase targets. The aspartic acid 230 of lamin A located [61] in the
21
2B region of the central rod domain, a highly conserved region in all known IF proteins is critical
for polymerization and is recognized as caspase cleavage site. Each caspase has a distinct
type of lamin as a substrate, which possesses a unique recognition sequence for the protease,
despite the fact that the aspartic acid 230 residue is the target site for caspase cleavage in
human lamins A and B1. Rao and colleagues have demonstrated that HeLa cells which are
transfected with caspase-uncleavable mutants of lamins, displayed an impediment in the
advancement of shrinkage process of the nucleus, and a slowdown in chromatin condensation
and cell death [62].
Diseases due to genetic mutations and improper processing of lamins
Most of the disease related mutations in lamins originate in the LMNA gene [e.g.,
Emery-Dreifuss muscular dystrophy, dilated cardiomyopathy, Hutchinson-Gilford Progeria
Syndrome etc.] along with few others [Adult onset autosomal dominant leukodystrophy and
Pelger-Huet anomaly], occurring due to mutations in the lamin B1 [LMNB1] gene and lamin B
receptor [LBR] gene [63]. Enlisted in the table below are some of the major disorders
associated with lamin protein family [also called ‘laminopathies’], the mutated genes and the
phenotypical characteristics of the diseases [64-79].
Disease Lamin involved Mutation gene Clinical Phenotype
Emery-Dreifuss
Muscular
Dystrophy
Lamin A/C LMNA Affects mainly skeletal and
cardiac muscles
Phenotypical signs appear by

22
age 10
Joint deformities [contractures]
at elbows and Achille’s tendon
Rigidity in spine and neck
Increasing muscle weakness
and wasting
Most patients have cardiac
complications by adulthood
Restrictive
Dermopathy
Accumulation of
farnesylated
prelamin A
ZMPSTE24 Lethal congenital skin condition
Intrauterine growth retardation
Tightening/rigidity of skin
[especially of face and around
the mouth]
Respiratory insufficiency
Most infants do not live long due
to pulmonary problems
Hutchinson-
Gilford Progeria
Lamin A
[accumulation of
LMNA Physical appearance is normal
at birth

23
Syndrome.
aberrant form of
prelamin A
‘progerin’]
Premature and accelerated
aging
Reduction/absence of
subcutaneous fat
Alopecia
Hearing loss
Most do not live beyond 13-14
yrs
Death usually occurs due to
cardiovascular diseases
Dunnigan-type
familial partial
lipodystrophy
[FPLD]
Lamin A/C LMNA Phenotypical appearance of the
disease occurs during
adolescence
Progressive loss of fat from
limbs and trunk
Glucose intolerance
Hyperinsulinemia
Insulin resistance

24
T2DM
Adult Onset
autosomal
dominant
leukodystrophy
Lamin B1
[Increased
expression]
LMNB1 Phenotype is similar to chronic
progressive multiple sclerosis
Progressive neurological
disorder
Autonomic dysfunction, e.g., low
blood pressure, incontinence,
blurred vision
Charcot-Marie
tooth disease,
axonal Type 2B1
Lamin A/C LMNA Symptoms begin in late
childhood/early adulthood
Progressive loss of muscle
tissue and sensation
Mild sensory loss
Wasting and weakness of lower
limbs
Pelger-Huet
anomaly
Lamin B receptor LBR Benign blood disorder
[hyposegmentation of nucleus of
WBCs/neutrophils]

25
Mild skeletal malformation
Dilated
Cardiomyopathy
Lamin A/C LMNA Affects mainly cardiac muscle,
skeletal muscle is minimally
affected
Progressive ventricular dilation
Impaired systolic function
Pulmonary edema
Table 1-3: Clinical features of laminopathies.
Nuclear Lamins in beta cell and T2DM
Beta cell damage is characterized by specific changes in the morphology of the cell. The
cell undergoes shrinkage, blebbing [bulges in the plasma membrane], nuclear fragmentation
and chromatin condensation. Degradation of lamins leads to the breakdown of nuclear lamina
which is a preliminary stage of apoptosis as this is followed by DNA degradation and chromatin
condensation [80]. It is well established that beta cell dysfunction and failure are characteristic
features of Type 1 and 2 diabetes. Therefore, it is necessary to study the intracellular events
that the pancreatic beta cell undergoes, and understanding of such events will aid in searching
for a possible drug target for the management and/or prevention of the disease. So far, not
much is known regarding the role of lamins in the etiology of diabetes, apart from some
genome-wide association studies [GWAS]. GWAS typically focus on associations between

26
single-nucleotide polymorphisms [SNPs] and major diseases by comparing the genetic
materials from normal and diseased state individuals. LMNA gene mutations are responsible for
multiple clinically relevant disorders, such as Dunnigan-type familial partial lipodystrophy
[FPLD]. Individuals with this disease display a characteristic loss of subcutaneous fat, insulin
resistance, glucose intolerance, hypertension in addition to other phenotypical changes
observed in metabolic syndrome. Hegele and associates were the first research group to
discover that a cause of Dunnigan-type lipodystrophy, a body fat disorder which leads to
diabetes, is mutation in LMNA gene in the chromosome 1q21.22 [81].
Role of caspases in nuclear lamin degradation
The caspase family is one of the most important factors in the apoptotic pathway. Many
proteins in the cell, including a large number of structural proteins, are cleaved by activated
caspases which culminates in apoptosis of the cell. The caspase 8, 9 and 10 are initiator
caspases whereas caspase 3, 6 and 7 are effector caspases. The initiator caspases cleave and
activate the effector caspases leading to cell death [82]. These caspases exist in the form of
inactive zymogens [also referred to as pro-caspases], which are activated by the process of
cleavage by other upstream proteases or by auto- or trans-activation [83]. In the recent years a
variety of substrates of caspases have been recognized [e.g., PARP, PKC-δ, nuclear lamins].
Caspase-dependent degradation of nuclear lamins has been identified as a precursor to nuclear
lamina disassembly [56].

27
Glucotoxicity and the beta cell
Figure 1-7: Acute and chronic effects of various glucose concentrations on the beta cell. [Modified from Bensallem et al. 2012, Ref. 84]
A constant glucose overload on the beta cell causes reduced expression of Glut2,
preproinsulin, Pdx-1, diminished glucose sensitivity and impairment in its basic function of
insulin secretion and eventually beta cell damage [84, 85]. Figure 1-8 shows the effect of
glucotoxicity on beta cell function and survival. Several intracellular signaling events have been
identified as causal to high glucose-induced metabolic dysregulation of the islet. The most
commonly studied are endoplasmic reticulum [ER] and oxidative stress. It has been suggested
that both oxidative and ER stress lead to mitochondrial dysfunction, cytochrome C release, and
caspase activation [86]. Recently, a multifunctional sorting protein, PACS-2 [phosphor-acidic
cluster sorting protein 2], which controls the ER-mitochondria axis has been identified [87].
Despite this growing body of evidence, very little is known in the context of the islet beta cells on
potential detrimental effects of glucotoxic conditions on ER, mitochondria, caspase activation
and associated degradation of their respective substrate proteins.
2 5 10 30 (mM Glucose)
Acute effects
Sub‐acute effects
Chronic effects
(Time)
‐↑Insulin secre on‐↑Protein synthesis (proinsulin)‐↑Ca2+ pumping into the ER
‐↑Func on‐↑Prolifera on and Differentiation‐↑Survival
‐↓Func on‐↓Prolifera on and Differentiation‐↑Apoptosis
Glucotoxicity
28
On the basis of the above literature review, the central objective of my thesis work is to
study the mechanisms involved in beta cell dysfunction in diabetes and to elucidate the role of
ER-mitochondrial axis in initiating the activation of executioner caspases which leads to nuclear
lamina disassembly in insulin-secreting INS-1 832/13 cells exposed to acute and/or long-term
incubation conditions. In addition, I propose to extend these in vitro studies to islets obtained
from animal models of obesity and T2DM [e.g., Zucker Diabetic Fatty - ZDF rat].
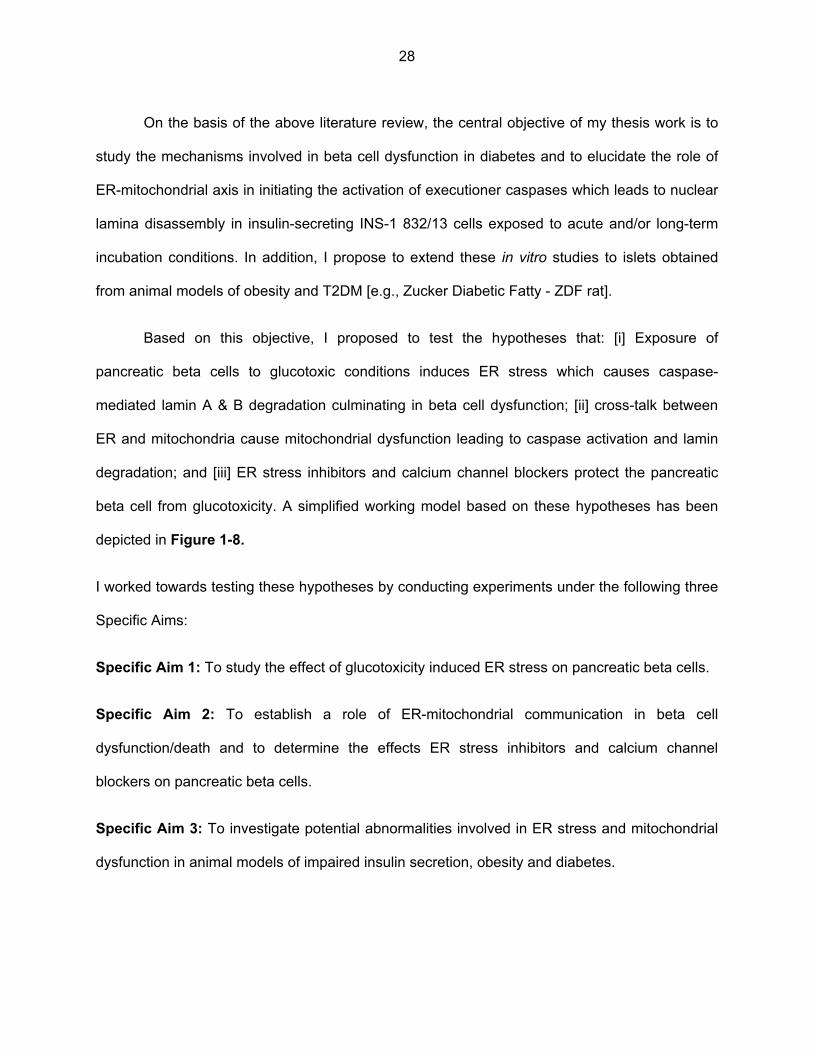
Based on this objective, I proposed to test the hypotheses that: [i] Exposure of
pancreatic beta cells to glucotoxic conditions induces ER stress which causes caspase-
mediated lamin A & B degradation culminating in beta cell dysfunction; [ii] cross-talk between
ER and mitochondria cause mitochondrial dysfunction leading to caspase activation and lamin
degradation; and [iii] ER stress inhibitors and calcium channel blockers protect the pancreatic
beta cell from glucotoxicity. A simplified working model based on these hypotheses has been
depicted in Figure 1-8.
I worked towards testing these hypotheses by conducting experiments under the following three
Specific Aims:
Specific Aim 1: To study the effect of glucotoxicity induced ER stress on pancreatic beta cells.
Specific Aim 2: To establish a role of ER-mitochondrial communication in beta cell
dysfunction/death and to determine the effects ER stress inhibitors and calcium channel
blockers on pancreatic beta cells.
Specific Aim 3: To investigate potential abnormalities involved in ER stress and mitochondrial
dysfunction in animal models of impaired insulin secretion, obesity and diabetes.

29
Specific Aim 4: To study the consequences of inhibition of requisite post translational
prenylation of lamins on the pancreatic beta cell.
Figure 1-8: Proposed working model for ER-stress induced, caspase-mediated degradation of nuclear lamins under glucotoxic conditions in pancreatic beta cells. We propose that exposure of insulin-secreting cells to high glucose leads to increased ER stress leading to mitochondrial dysfunction [86, 87]. As a consequence, cytosolic caspase 3 and 6 are activated by the released cytochrome C from the dysregulated mitochondria. Activation of caspases leads to degradation of lamin A and B culminating in nuclear damage and altered distribution of degraded lamins into various subcellular compartments, leading to nuclear lamina disassembly.
Glucotoxicity
Mitochondrial damage
Caspase 3 activation
Caspase 6 activation
Lamin A & B cleavage
Nuclear Lamina Disassembly
Cell damage/dysfunction
Nucleus Nucleus
ER Stress
30
CHAPTER 2
MATERIALS AND METHODS
2.1 Materials
Chemicals: Glucose, nifedipine, thapsigargin, 4-phenylbutyric acid, simvastatin, triton X-
114 were obtained from Sigma Aldrich [St. Louis, MO]. Inhibitors of caspase 3 [Z-DEVD-FMK]
and caspase 6 [Z-VEID-FMK] were from Enzo Lifesciences [Farmingdale, NY]. FTI-277 was
purchased from Tocris Biosciences [Minneapolis, MN]. GGTI-2147 was obtained from
Calbiochem-EMD Millipore [Billerica, MA] and Rottlerin was procured from Cayman Chemical
Company [Ann Arbor, MI].
Antibodies: Antisera directed against lamin A, caspase 3, cleaved caspase 3, cleaved
caspase 6, CHOP, phospho-p44/42 ERK1/2 [Thr202/Tyr204] and total p44/42 ERK1/2 were
obtained from Cell Signaling [Danvers, MA]. Antibody for lamin B, phospho-p38MAPK and total-
p38MAPK was from Santa Cruz Biotechnology [Santa Cruz, CA]. Antibody for ZMPSTE24 was
procured from Abcam [Cambridge, MA]. Anti-β actin was purchased from Sigma Aldrich [St.
Louis, MO]. Anti-mouse IgG and Anti-rabbit IgG conjugated to horseradish peroxidase were
from GE Healthcare [UK]. Anti-goat IgG conjugated to horseradish peroxidase was obtained
from Santa Cruz Biotechnology [Santa Cruz, CA].
Assay kits: ELISA kit [Rat insulin] was procured from American Laboratory Products Co
[Windham, NH]. Metabolic cell viability assay kit [MTT] was purchased from Sigma Aldrich [St.
Louis, MO]. ProteoExtract - Subcellular Proteome Extraction Kit was obtained from EMD
Millipore [Billerica, MA].

31
Animals: Male Sprague-Dawley rats were purchased from Harlan Laboratories [Oxford,
MI]. Male Zucker Diabetic fatty [ZDF] and Zucker Lean Control [ZLC] rats were obtained from
Charles River Laboratories [Wilmington, MA]. All animals were maintained in a 12 hrs light/dark
cycle with free access to water and food. The ZDF and ZLC rats were fed the Purina Diet 5008.
Blood glucose was measured by tail vein puncture using Freestyle lite glucometer [Abott
Diabetes Care, Inc., Alameda, CA].
2.2 INS-1 832/13 cells, rat islets and human islets: Culture conditions
INS-1 832/13 cells: INS-1 832/13 cells were kindly made available by Dr. Chris
Newgard, Duke University Medical Center, Durham, NC. The cells were cultured and
maintained in RPMI-1640 medium prepared with 10% heat inactivated Fetal Bovine Serum
[FBS]. The medium was supplemented with antibiotics [100 IU/ml penicillin and streptomycin],
10 mM HEPES, 1mM sodium pyruvate and 50 μM 2-mercaptoethanol [pH 7.4]. Passages 53-61
were used for the studies. Cells were exposed to low and high glucose [2.5 and 20 mM] or
simvastatin/FTI-277/GGTI-2147 for time periods ranging from 0-48 hrs as indicated in each
study. For the studies involving pharmacological inhibitors, cells were pre-incubated with the
compounds for either 1 or 12 hrs as indicated for each study, and then further treated with low
and high glucose in the continuous presence or absence of inhibitors. At the end of the
incubation period, the cells were harvested and lysed in radio immunoprecipitation assay [RIPA]
buffer containing protease inhibitor cocktail, 1 mM NaF, 1 mM PMSF and 1 mM Na3VO4.
Isolation of islets: All animal protocols were utilized after prior assessment and
obtaining consent of the Institutional Animal Care and Use Committee at Wayne State
University. Islets from normal 6-8 week-old male Sprague–Dawley rats were isolated by the
collagenase digestion method, wherein collagenase was injected into the common bile duct of
32
the euthanized animal. The pancreata were then excised and digested at 37°C followed by
density gradient purification using Histopaque 1077, in order to separate out islets from
pancreatic acinar tissue. After isolation, islets were cultured overnight in RPMI-1640 medium
containing 10% heat-inactivated FBS supplemented with 100 IU/ ml penicillin and 100 IU/ml
streptomycin, 1 mM sodium pyruvate and 10 mM HEPES [pH 7.4] and further incubated in the
low [2.5 mM] and high glucose [20 mM]. At the end of the incubation islets were harvested and
lysed in RIPA buffer.
Human islets: Human islets [~90-95% purity] from two normal [38-year-old female and
64-year-old male] and one diabetic [44-year-old male] donors and islet culture medium were
procured from Prodo Laboratories, Inc. [Irvine, CA]. Following incubations in the presence of
low [5.8 mM] or high [30 mM] glucose, normal human islets and T2D human islets were
homogenized in RIPA buffer and used for Western blotting.
2.3 Isolation of subcellular fractions
Extraction of cytosolic, membrane/organelle and nucleic protein fraction was carried out as
per the manufacturer’s instructions using the ProteoExtract® Subcellular Proteome Extraction Kit.
INS-1 832/13 cells were exposed to low and high glucose for 24 hrs. The cells were scraped and
suspended in wash buffer and pelleted by centrifugation for 10 min at 200 g at 4°C. The pellet
obtained was then resuspended in the extraction buffer-I and protease inhibitor cocktail provided in
the kit. After incubation for 10 min at 4°C the cells were centrifuged for 10 min at 750 g, the
supernatant obtained was the cytosolic fraction. The pellet was then resuspended in Extraction
buffer-II and protease inhibitor cocktail and incubated for 30 min and then centrifuged for 10 min at
5500 g. The supernatant thus obtained was the membrane/organelle fraction. Finally the pellet was
resuspended in extraction buffer-III, protease inhibitor cocktail and benzonase, incubated for 10 min
33
at 4°C and centrifuged at 6800 g for 10 min. The supernatant obtained was the nucleic protein
fraction.
2.4 Subcellular phase partitioning using Triton X-114
INS-1 832/13 cells were incubated overnight in low glucose and 2.5% FBS and FTI-277
[10 µM]. Cells were then treated with media containing low glucose [2.5 mM] in the absence and
presence of FTI-277 [10 µM] for 24 hrs. Cell lysates were homogenized in a homogenization
buffer [20 mM Tris-HCl, pH 7.5, 0.5 mM EGTA, 2 mM MgCl2 and protease inhibitor cocktail] and
subjected to a single-step centrifugation at 100,000g for 60 min at 4°C in order to separate the
cytosol [supernatant] and the membrane [pellet] fractions. The membrane fraction was then
subjected to phase partitioning using Triton X-114, a non-ionic detergent. Triton X-114 exists as
a homogenous solution at 0°C; however, as the temperature rises upto 20°C, it splits into
aqueous and detergent phases. This property is taken advantage of during phase partitioning,
by overlaying the sample on a 6% sucrose cushion containing 150 mM NaCl, 0.06% Triton X-
114 in 10 mM Tris-Hcl buffer [pH 7.4] and centrifugation at 300g for 3 minutes at room
temperature; wherein, the hydrophilic proteins emerge in the aqueous phase while the
amphiphilic, integral membrane proteins are found in the detergent phase [88].
2.5 Akita cells
Akita cell line was provided by Prof. Sasanka Ramanadham, University of Alabama,
Birmingham, AL. Akita and wild type cells were maintained in DMEM medium prepared with
17.5% heat-inactivated FBS, with antibiotic preparation [100 IU/ml penicillin and streptomycin]
and 2-mercaptoethanol. The cultured cells were harvested and lysed in RIPA buffer containing
protease inhibitor cocktail, 1 mM NaF, 1 mM PMSF and 1 mM Na3VO4.

34
2.6 Western Blotting
Cell lysate proteins [30-50 µg loaded per lane] were subjected to SDS-Polyacrylamide
gel electrophoresis and electro transferred onto a nitrocellulose membrane. The membranes
were blocked with 5% non-fat dry milk in 10 mM Tris–HCl, pH 7.6, 1.5 M NaCl and 0.1% Tween
20 [TBS-T] followed by incubation with primary antibodies in TBS-T containing 5% BSA at room
temperature for 1 hr and washed 5X for 5 min each with TBS-T. The membrane was then
incubated with corresponding secondary antibodies conjugated to horseradish peroxidase
[1:1000] in 5 % non-fat dry milk in TBS-T at room temperature for 1 hr. After washing the blots in
TBS-T again, the signal for proteins on the blots was enhanced using
electrochemiluminescence [ECL] and the images of the blots were developed using Kodak Pro
Image 400 R [New Haven, CT]. To ensure uniform protein loading and efficient transfer onto the
membrane, the blots were stripped and re-probed with antibody raised against β actin. Intensity
of protein bands was quantified by using Carestream Molecular Imaging Software to measure
the band density. Ratios of band densities of proteins of interest with β actin were calculated
and expressed as fold change values.
2.7 Measurement of lamin A and B degradation
Following treatment with low glucose [2.5 mM], high glucose [20 mM] or inhibitors [as
indicated in the text], INS-1 832/13 cells, isolated rat or human islets were lysed in RIPA buffer
supplemented with 1mM PMSF, 10 μg/mL leupeptin, 10 μg/mL aprotinin, 5 mM EGTA, 5 mM
EDTA, 10 mM NaF and 1 mM sodium orthovanadate. The samples were clarified by incubating
on ice for 15 min followed by centrifugation at 14000 rpm for 15 min. The supernatants were
collected and subjected to a protein estimation assay using Pierce 660 nm protein assay
reagent. Equal amounts of protein were loaded and separated by SDS-PAGE. Resolved

35
proteins were transferred onto nitrocellulose membrane and probed for lamin B or cleaved lamin
A as indicated in text, followed by re-probing with β actin. Intensity of protein bands was
quantified by using Carestream Molecular Imaging Software to measure the band density.
Ratios of band densities of degraded lamin B and cleaved lamin A with β actin were calculated
and expressed as fold change values in lamin A or B degradation.
2.8 Activation of caspase 3 and 6
Cells treated with low and high glucose or other stimulants/inhibitors [as indicated in the
text]. Lysate proteins were subjected to Western blotting. Activation of caspases was estimated
by the appearance of the bands of cleaved [active] hydrolytic product at 17 and 18 kDa for
caspase 3 and 6 respectively.
2.9 Cell viability assay
INS-1 832/13 cells were cultured in 96-well plates and treated with low glucose [2.5 mM]
in the absence or presence of Simvastatin or FTI-277 [10 µM]. After 24 hrs cell viability was
assessed by using a colorimetric assay with MTT [tetrazolium salt] which measures the
reduction of the tetrazolium salt into the purple formazan crystals at 570 nm.
2.10 Insulin release studies
Insulin secretion experiments were performed in static incubation conditions. INS-1
832/13 cells were incubated in the presence of low or high glucose. After 24 hrs, the cells were
incubated with KRB buffer for 1 hr, prior to stimulation with low or high glucose for 45 min at
37°C. Insulin secreted by the cells into the medium was detected and measured by ELISA.
36
2.11 Cell morphology studies
Observation of cell morphology was carried out using an Olympus IX71 microscope.
INS-1 832/13 cells, incubated overnight in RPMI containing low glucose and 2.5% FBS, were
treated the following day with media containing low glucose [2.5 mM] alone and in the presence
of diluent [DMSO], FTI-277 [10 µM] or Simvastatin [15 and 30 µM]. Changes in cell morphology
were visualized by light microscopy after 24 hrs.
2.12 Statistical analysis of experimental data
Data are represented as Mean ± SEM values. The statistical significance of the
differences in values between the experimental conditions was established by either Student’s t-
test or ANOVA followed by SNK Post-Hoc test where appropriate. P value < 0.05 was
considered significant.

37
CHAPTER 3
MITOCHONDRIAL DYSFUNCTION INDUCED BY GLUCOTOXIC AND DIABETIC CONDITIONS RESULTS IN CASPASE MEDIATED LAMIN DEGRADATION IN
PANCREATIC BETA CELLS
Portions of this work have been published [copies of the published manuscripts are appended] Khadija S, Veluthakal R, Sidarala V, Kowluru A. Glucotoxic and diabetic conditions induce
caspase 6-mediated degradation of nuclear lamin A in human islets, rodent islets and INS-1
832/13 cells. Apoptosis. 2014; 19[12]:1691-701.
Syeda K, Mohammed AM, Arora DK, Kowluru A. Glucotoxic conditions induce endoplasmic
reticulum stress to cause caspase 3 mediated lamin B degradation in pancreatic β-cells:
protection by nifedipine. Biochem Pharmacol. 2013 1;86[9]:1338-46.
The interior of the nuclear envelope is lined by the nuclear lamina which is composed of
three proteins; lamins A, B and C. The A type lamins, which include lamins A and C, are
products of alternative splicing of the same gene LMNA whereas lamin B is encoded by the
LMNB1 gene [21]. These lamins are type V intermediate filament proteins and are lined up on
the inner face of the inner nuclear membrane. The nuclear lamina is a fundamental part of major
nuclear activities, namely mitosis, chromatin organization and in DNA replication. Lamins also
play key functional roles in providing structural support, thereby contributing to the nuclear
architecture [89]. Evidence in multiple cell types suggests significant alterations in nuclear
structure and organization during apoptosis [62]. Some of these include accelerated
degradation of nuclear lamins A, B and C by executioner caspases 3 and 6 leading to defective
nuclear assembly and mistargeting of constituents of nuclear lamina to improper subcellular
compartments [e.g., cytosol]. Degradation of lamins leads to the breakdown of nuclear lamina
38
which is a preliminary stage of apoptosis as this is followed by DNA degradation and chromatin
condensation [80].
Previous results from our laboratory indicated that IL-1β treatment causes an increase in
lamin B degradation mediated by caspases [90]. In addition, a recent study highlighted the
involvement of caspase 3 in the breakdown of the nuclear matrix by cleaving nuclear lamin B. It
has been stated that this cleavage probably occurs by activation of caspase 3 directly or by
other downstream proteases [91]. Recent evidence in PC12 and rat cortical cells also implicates
cell apoptosis via caspase 3 activation and cleavage of lamin B under lipotoxic conditions
induced by saturated fatty acids, such as palmitic acid [92].
The overall objective of this study, therefore, is to investigate the role of caspases on the
degradation of nuclear lamins, specifically lamin A and B in insulin secreting INS-1 832/13 cells,
rodent and human islets under high glucose exposure.
Exposure to glucotoxic conditions cause caspase 3-mediated degradation of lamin B in
INS-1 832/13 cells
At the outset, INS-1 832/13 cells were incubated with either low [2.5 mM] or high [20
mM] glucose for 12, 24 and 48 hrs, and caspase 3 activation, as evidenced by the emergence
of caspase 3 degradation fragment, was monitored by Western blotting, and the data were then
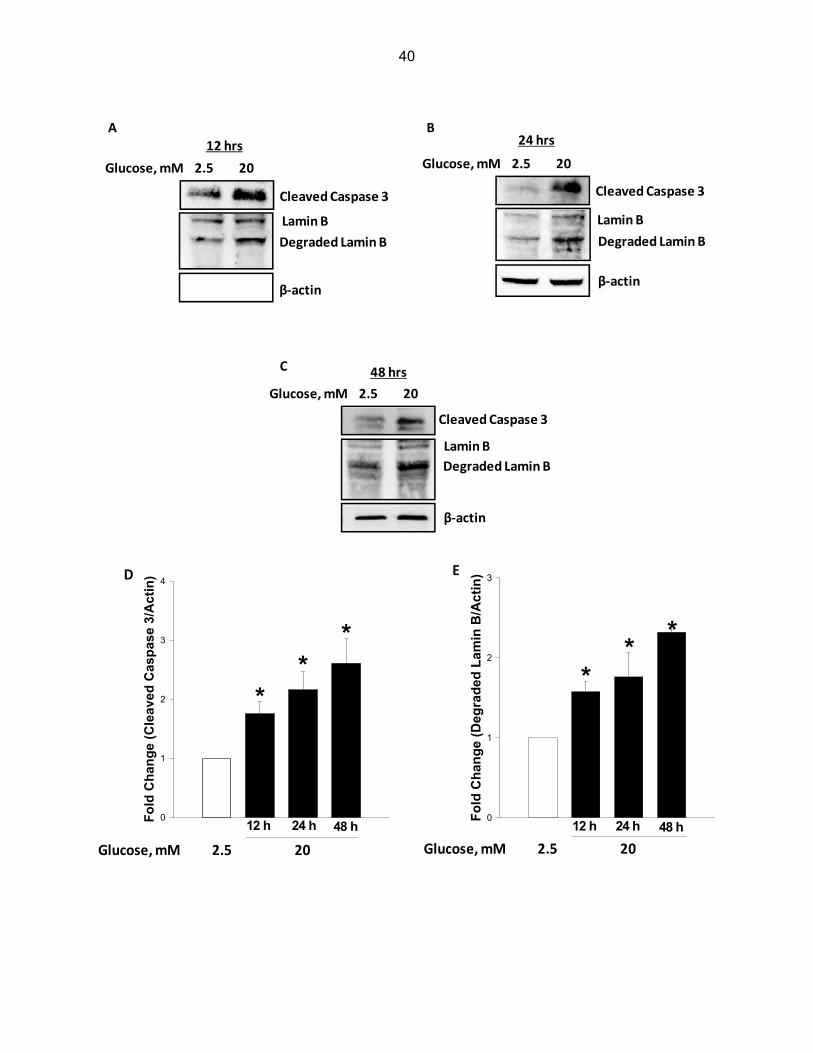
quantified by densitometry. Data depicted in Figure 3-1 demonstrate a marked increase in
caspase 3 activation as early as 12 hrs [1.8-fold; Panel A], which continued to increase as a
function of time [2.2- and 2.6-fold increase at 24 and 48 hrs, respectively; Panels B and C].
Furthermore, we noticed a marked increase in the degradation of lamin B under these
conditions [Figure 3-1]. For example the fold increase in lamin B degradation represented 1.6-
fold at 12 hrs [Panel A], 1.8-fold at 24 hrs [Panel B] and 2.3-fold at 48 hrs [Panel C]. Panels D
39
and E depict combined data from multiple experiments. Together, data in Figure 3-1 suggest
activation of caspase 3 and degradation of lamin B under glucotoxic conditions. It should be
noted that the observed effects of glucose on caspase 3 activation and lamin B degradation are
not due to osmotic effects of glucose since incubation of these cells with mannitol [20 mM], used
as an osmotic control, did not elicit any effects on caspase 3 activation and lamin B degradation
under these conditions [n = 2 experiments; additional data not shown].
40
Fo
ld C
han
ge
(Cle
ave
d C
asp
ase
3/A
ctin
)
0
1
2
3
4
LG 12 h 24 h 48 h
**
*
HGGlucose, mM 2.5 20
D
Fo
ld C
ha
ng
e (
Deg
rad
ed
La
min
B/A
cti
n)
0
1
2
3
LG 12 h 24 h 48 h
**
*
HG
E
Glucose, mM 2.5 20
Degraded Lamin B
β‐actin
Cleaved Caspase 3
Glucose, mM 2.5 20
A
Lamin B
B
Degraded Lamin B
β‐actin
Cleaved Caspase 3
Lamin B
24 hrs
Glucose, mM 2.5 20
Degraded Lamin B
β‐actin
Cleaved Caspase 3
C
Lamin B
48 hrs
Glucose, mM 2.5 20
12 hrs
41
Figure 3-1: Exposure of INS-1 832/13 cells to glucotoxic conditions results in caspase 3 activation and lamin B degradation. INS-1 832/13 cells were incubated in the presence of low [2.5 mM] or high [20 mM] glucose for 12 hrs [Panel A], 24 hrs [Panel B], and 48 hrs [Panel C], and protein lysates [~50 μg] were resolved by SDS-PAGE and transferred to a nitrocellulose membrane. Cleaved caspase 3 and lamin B antibodies were used to probe the membrane and immune complexes were identified using ECL. To ensure equal protein loading, the same membranes were reprobed with antisera against β-actin. Band-intensity of proteins was quantified by densitometry. T-test was used to measure the statistical significance of the differences in values between the control and experimental conditions. Data in Panel D and E represent mean ± SEM from three to four independent experiments and expressed as fold change in caspase 3 activation and lamin B degradation. *P < 0.05 vs. 2.5 mM glucose.
Caspase 6 activation and cleavage of lamin A in INS-1 832/13 cells treated with high
glucose
Further, we wanted to examine if exposure of INS-1 832/13 cells to glucotoxic conditions
would result in activation of caspase 6 and associated degradation of lamin A. Data in Figure 3-
2 [Panel A] represent a Western blot from one of these experiments, which indicates a
significant increase in caspase 6 activity in high glucose-treated cells as evidenced by
emergence of a cleaved 18 kDa biologically active peptide of caspase 6. Furthermore, we
noticed a corresponding increase in the abundance of a 28 kDa lamin A degradation product in
lysates derived from cells exposed to high glucose. Panels B and C depict data accumulated
from multiple experiments.

42
Figure 3-2: Caspase 6 activation and lamin A cleavage in INS-1 832/13 cells treated with high glucose. INS-1 832/13 cells were incubated in the presence of low or high glucose for 24 hrs. Caspase 6 activation and lamin A cleavage were determined by Western blotting. Protein lysates [~40 µg] were loaded onto SDS-Polyacrylamide gels and transferred onto a nitrocellulose membrane. Antibodies against cleaved caspase 6 and cleaved lamin A were utilized to probe the membrane and immune complexes were identified using ECL detection kit [Panel A]. After stripping the membranes, they were re-probed with β-actin antibody to ensure uniform loading of proteins. Band-intensity of proteins was evaluated by densitometry. Data represent mean ± SEM from three independent experiments and expressed as fold change in caspase 6 [Panel B] and lamin A cleavage [Panel C]. *P < 0.05 vs. 2.5 mM glucose.
Cleaved Lamin A
Cleaved Caspase 6
‐actin
A
Glucose, mM 2.5 20
B
Fo
ld C
ha
ng
e (
Cle
aved
Ca
spas
e 6/
Ac
tin
)
0
1
2
*
Glucose, mM 2.5 20
Fo
ld C
han
ge
(Cle
aved
Lam
in A
/Act
in)
0
1
2
3
*
C
Glucose, mM 2.5 20

43
Chronic glucose exposure significantly impairs GSIS in INS-1 832/13 cells
Several lines of evidence suggest that exposure of pancreatic beta cells to
hyperglycemic conditions leads to the onset of metabolic stress, loss in glucose-stimulated
insulin secretion [GSIS] and cell demise. Therefore, in the next set of studies, we quantified
effects of high glucose exposure [20 mM; 24 hrs] on GSIS using the INS-1 832/13 cell line. Data
in Figure 3-3 indicate a significant increase [~ 2 fold] in basal secretion from these cells
following exposure to glucotoxic conditions; [bar 1 vs. 3]. In addition, insulin secretion elicited by
stimulatory glucose concentrations decreased significantly in these cells exposed to glucotoxic
conditions [bar 2 vs. 4]. These data indicate significant impairment in GSIS in INS-1 832/13 cells
after 24 hrs of incubation in media containing high glucose.
Figure 3-3: Glucotoxic conditions attenuate GSIS in INS-1 832/13 beta cells. INS-1 832/13 cells were cultured in the presence of low and high [2.5 and 20 mM] glucose. After 24 hrs they were stimulated with low or high glucose for 45 min. Amount of Insulin released into the culture medium was evaluated by ELISA [see Methods-section 2.7 for additional details]. The data are expressed as insulin release [ng/ml] and are means ± SEM from three independent experiments. *P < 0.05 vs. 2.5 mM glucose under 24 hrs low glucose treatment; **P < 0.05 vs. 20 mM glucose under 24 hrs low glucose treatment.
Glucose, mM 2.5 20 2.5 20
2.5 mM, 24 hr 20 mM, 24 hr
Insu
lin r
elea
se,
ng
/ml
0
5
10
15
20
25
*
**
*

44
Glucotoxic conditions induce caspase 3 and 6 activation and subsequent degradation of
lamin A and B in normal rat islets
Based on the above observations and our findings on caspase 3 and 6 activation and
lamin A and B degradation under glucotoxic conditions, we repeated these studies in primary rat
islets to further validate the observed effects of glucotoxicity on caspase activation and lamin
degradation. Data depicted in Figure 3-4 indicate an increase in caspase 3 and 6 activation
followed by a corresponding increase in lamin A and B degradation under these conditions
[Figure 3-4; Panels A and D]. Panels B,C and E,F display data combined from multiple
experiments.
Degraded Lamin B
Cleaved Caspase 3
β‐actin
A
Lamin B
Glucose, mM 2.5 20
B
Fo
ld C
han
ge
(Cle
aved
Cas
pas
e 3/
Act
in)
0
1
2
3
4
*
Glucose, mM 2.5 20
Fo
ld C
han
ge
(Deg
rad
ed L
amin
B/A
ctin
)
0
1
2
*
C
Glucose, mM 2.5 20

45
Figure 3-4: Treatment of normal rat islets with high glucose results in caspase 3 and 6 activation and hydrolytic cleavage of downstream substrates: lamins A and B. Rat islets were incubated in the presence of low [2.5 mM] and high glucose [20 mM] for 24 hrs. Approximately 40 µg protein lysates from each condition were resolved by SDS-PAGE and the degree of abundance of cleaved caspase 3 and lamin B [Panel A] and cleaved caspase 6 and lamin A [Panel D] were determined by Western blot analysis. The loading control used was β-actin. Quantitation of caspase activation and lamin degradation were carried out by densitometry. Data represent mean ± SEM from three independent experiments and are expressed as fold change in cleaved caspase 3 [Panel B], degraded lamin B [Panel C], cleaved caspase 6 [Panel E] and cleaved lamin A [Panel F]. *P < 0.05 vs. 2.5 mM glucose.
Cleaved Lamin A
Cleaved Caspase 6
‐actin
D
Glucose, mM 2.5 20
E
Fo
ld C
han
ge
(Cle
aved
Cas
pas
e 6/
Act
in)
0
1
2
*
Glucose, mM 2.5 20
F
Fo
ld C
han
ge
(Cle
aved
Lam
in A
/Act
in)
0
1
2
*
Glucose, mM 2.5 20

46
Increased activation of caspases and associated degradation of lamins are also
demonstrable in human islets treated with high glucose
As a logical extension of the above studies, we quantified caspase activation and lamin
degradation in islets obtained from human donors. We noticed a 1.9-fold increase in caspase 3
activation and 2-fold increase in lamin B degradation; likewise we also observed a 2.17-fold and
a 1.69-fold increase in active caspase 6 and cleaved lamin A respectively in human islet
preparations incubated with high glucose [30 mM; 24 hrs; Figure 3-5; Panels A-D]. These data
further support our observations in INS-1 832/13 cells, suggesting that a similar mechanism of
beta cell death may be operable in primary islets [rat and human] [Figure 3-1 and 3-2].
Figure 3-5: Glucotoxic conditions promote caspase 3 and 6 activation and nuclear lamina breakdown in normal human islets treated with high glucose. Normal human islets were incubated in the presence of low [5.8 mM] and high glucose [30 mM] for 24 hrs as described in the text. 25 µg Lysate proteins were loaded onto SDS-Polyacrylamide gels and then transferred to nitrocellulose membranes. The membranes were probed for cleaved caspases 3 and 6, and lamin A and B and immune complexes were identified using ECL detection kit. To ensure equal protein loading, the same membrane was re-probed using antibody for β-actin. Human islet data were accrued from a single batch of islet preparation.
Human Islets
Fold Change(Cleaved
Caspase 3/Actin)
Fold Change (Degraded
Lamin B/Actin)
LG HG LG HG
1.0 1.9 1.0 2.0
A
Cleaved Caspase 3
Degraded Lamin B
β‐actin
Lamin B
Cleaved Lamin A
Cleaved Caspase 6
‐actin
C
Fold Change (Cleaved
Caspase 6/Actin)
Fold Change (Cleaved
Lamin A/Actin)
LG HG LG HG
1.0 2.17 1.0 1.69
B
D
Glucose, mM 5.8 30
Glucose, mM 5.8 30
47
Evidence for expression of ZMPSTE24 [a zinc metallopeptidase responsible for
endoproteolytic cleavage of pre-lamin A to mature lamin A] in INS-1 832/13 cells and
human islets
Mature lamin A is synthesized as prelamin A, the precursor form, which subsequently
undergoes post-translational modifications, including farnesylation and carboxylmethylation. The
modified form of prelamin A is subsequently cleaved by the enzyme ZMPSTE24, a zinc
metallopeptidase, which detaches 15 amino acids from the carboxyl end, thereby releasing
mature lamin A [39]. Earlier studies from our laboratory have demonstrated carboxylmethylation
of lamins in islet beta cells [45]. Therefore, in the last set of studies we asked if ZMPSTE24 is
expressed in the islet beta cells, and whether glucotoxic conditions affect the expression of this
peptidase. Data depicted in Figure 3-6 provide evidence for the expression of ZMPSTE24 in
INS-1 832/13 cells [Panel A] and human islets [Panel C]. Furthermore, we noticed no significant
effects of glucotoxic conditions on the expression of this protein in the two cell types studied
[Panel A–C], suggesting that proteolytic processing of lamin A may not be affected under
glucotoxic conditions.
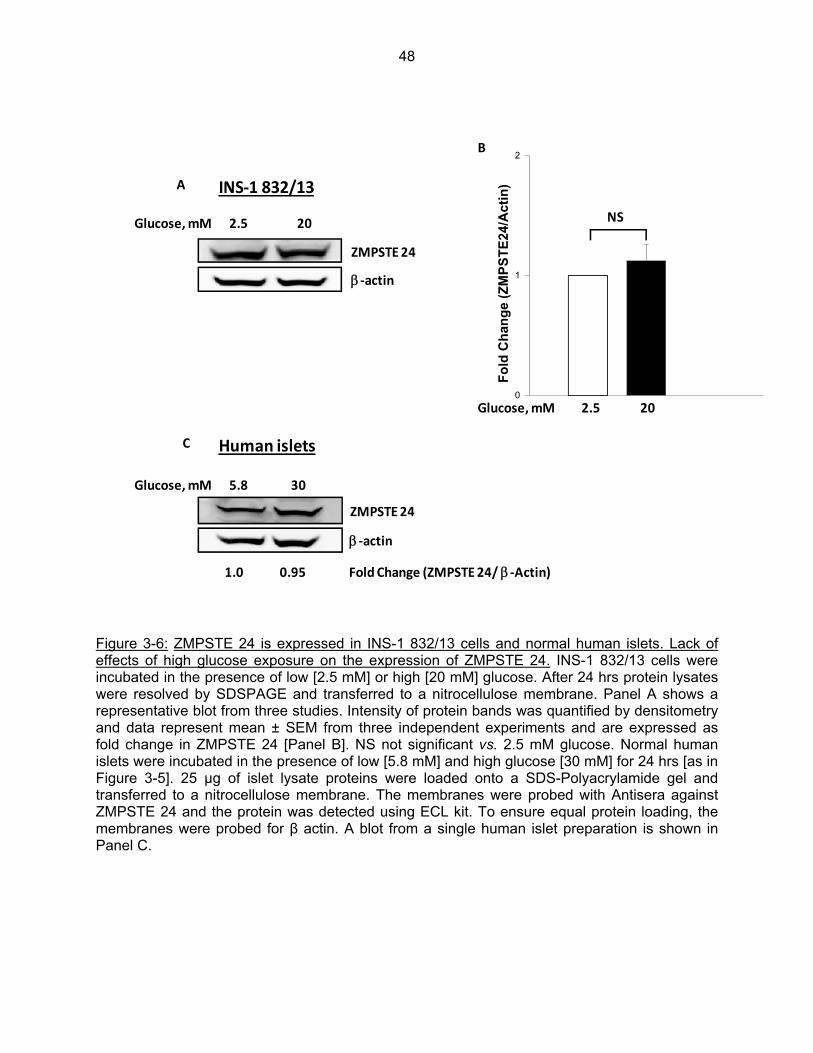
48
Figure 3-6: ZMPSTE 24 is expressed in INS-1 832/13 cells and normal human islets. Lack of effects of high glucose exposure on the expression of ZMPSTE 24. INS-1 832/13 cells were incubated in the presence of low [2.5 mM] or high [20 mM] glucose. After 24 hrs protein lysates were resolved by SDSPAGE and transferred to a nitrocellulose membrane. Panel A shows a representative blot from three studies. Intensity of protein bands was quantified by densitometry and data represent mean ± SEM from three independent experiments and are expressed as fold change in ZMPSTE 24 [Panel B]. NS not significant vs. 2.5 mM glucose. Normal human islets were incubated in the presence of low [5.8 mM] and high glucose [30 mM] for 24 hrs [as in Figure 3-5]. 25 µg of islet lysate proteins were loaded onto a SDS-Polyacrylamide gel and transferred to a nitrocellulose membrane. The membranes were probed with Antisera against ZMPSTE 24 and the protein was detected using ECL kit. To ensure equal protein loading, the membranes were probed for β actin. A blot from a single human islet preparation is shown in Panel C.
INS‐1 832/13
ZMPSTE 24
‐actin
A
Glucose, mM 2.5 20
Human islets
ZMPSTE 24
‐actin
C
1.0 0.95 Fold Change (ZMPSTE 24/ ‐Actin)
Glucose, mM 5.8 30F
old
Ch
ang
e (Z
MP
ST
E24
/Act
in)
0
1
2
NS
B
Glucose, mM 2.5 20

49
Alterations in the subcellular distribution of cleaved caspase 3 and lamin B in INS-1
832/13 cells exposed to glucotoxic conditions
In these studies, we determined potential alterations, if any, in the subcellular
localization of active caspase 3 fragment and lamin B degradation products in INS-1 832/13
cells following exposure to glucotoxic conditions. To determine this, INS-1 832/13 cells were
incubated for 24 hrs with low or high glucose [2.5 or 20 mM]. Individual subcellular fractions,
namely the cytosolic fraction [fraction F1], membrane/organelle protein fraction [fraction F2] and
the pure nucleic protein fraction [fraction F3] were isolated using a ProteoExtract subcellular
proteome extraction kit [Materials and Methods- Section 2.3]. At the outset, we determined
subcellular distribution of native caspase [pro-caspase] and lamin B in INS-1 832/13 lysates.
Data depicted in Figure 3-7 [Panel A], as expected, suggest that native lamin B and pro-
caspase are localized predominantly in the nuclear [F3] and cytosolic [F1] fractions,
respectively. However, glucotoxic conditions caused significant alterations in the subcellular
distribution of biologically active [cleaved] caspase 3 and degraded lamin B [Figure 3-7; Panel
B]. For example, we noticed significant accumulation of degraded lamin B in cytosolic [F1] and
membrane/ organelle protein [F2] fractions under high glucose-treatment conditions.
Interestingly, we also noticed significant accumulation of cleaved caspase 3 in these fractions.
Together, these observations demonstrate abnormal distribution of lamin B under glucotoxic
conditions further suggestive of disassembly of nuclear structure under these conditions.
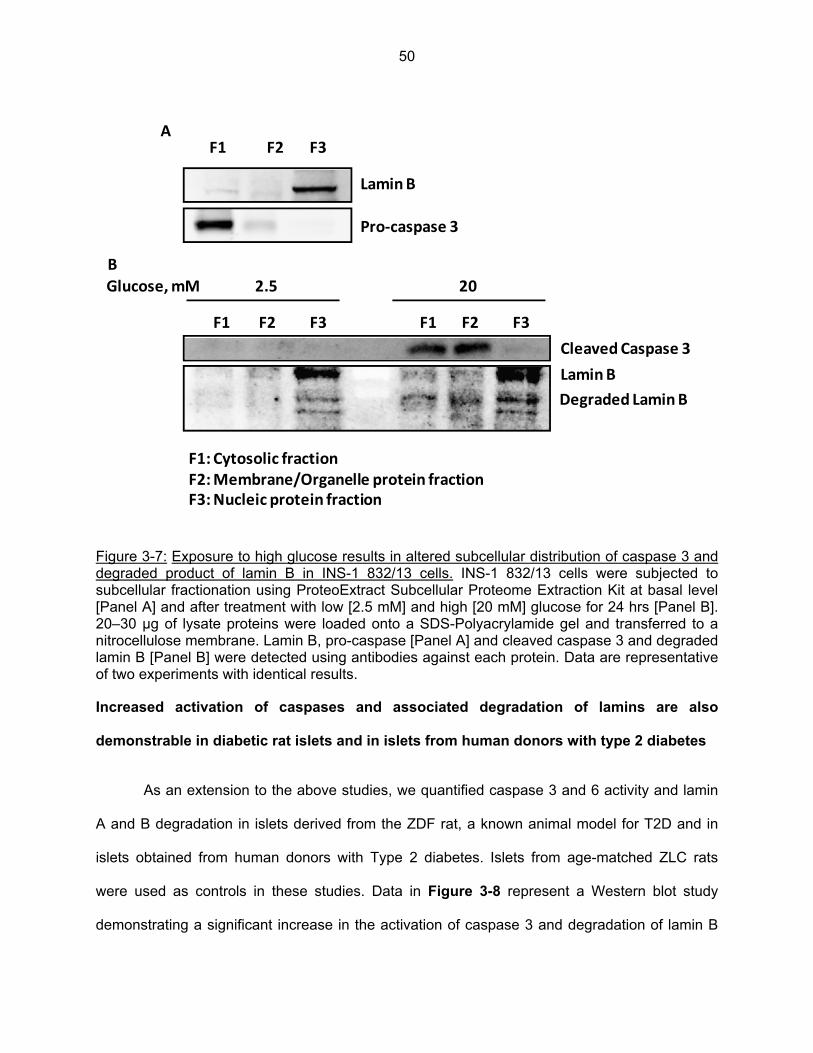
50
Figure 3-7: Exposure to high glucose results in altered subcellular distribution of caspase 3 and degraded product of lamin B in INS-1 832/13 cells. INS-1 832/13 cells were subjected to subcellular fractionation using ProteoExtract Subcellular Proteome Extraction Kit at basal level [Panel A] and after treatment with low [2.5 mM] and high [20 mM] glucose for 24 hrs [Panel B]. 20–30 μg of lysate proteins were loaded onto a SDS-Polyacrylamide gel and transferred to a nitrocellulose membrane. Lamin B, pro-caspase [Panel A] and cleaved caspase 3 and degraded lamin B [Panel B] were detected using antibodies against each protein. Data are representative of two experiments with identical results.
Increased activation of caspases and associated degradation of lamins are also
demonstrable in diabetic rat islets and in islets from human donors with type 2 diabetes
As an extension to the above studies, we quantified caspase 3 and 6 activity and lamin
A and B degradation in islets derived from the ZDF rat, a known animal model for T2D and in
islets obtained from human donors with Type 2 diabetes. Islets from age-matched ZLC rats
were used as controls in these studies. Data in Figure 3-8 represent a Western blot study
demonstrating a significant increase in the activation of caspase 3 and degradation of lamin B
F1: Cytosolic fractionF2: Membrane/Organelle protein fractionF3: Nucleic protein fraction
F1 F2 F3
Lamin B
Pro‐caspase 3
A
B
Degraded Lamin B
Cleaved Caspase 3
F1 F2 F3 F1 F2 F3
Lamin B
Glucose, mM 2.5 20

51
[Panel A] and activation of caspase 6 [Panel D] and cleavage of lamin A [Panel E] in islets from
the ZDF rat compared to the ZLC rat islets. Pooled data in islets from multiple ZLC and ZDF rats
are given in Panels B, C, F and G. Compatible with our findings above, we also noticed a
marked increase in lamin A and B degradation in islets from a human donor with T2DM along
with activation of caspases depicted in Figure 3-9 [Panel A and B]. T2D human islets studies
were performed using single islet preparation.
ZLC Mean ± SEM
ZDF Mean ± SEM
Body Weight [g] 275 ± 8 365 ± 7
Blood Glucose [mg/dl] 80 ± 12 276 ± 37
Table 3-1: Body weights and blood glucose levels of ZLC and ZDF rats measured at the time of sacrifice.

52
Figure 3-8: Activation of caspase and lamin degradation are observed in islets obtained from ZDF rats. Islets isolated from ZDF and ZLC rats by collagenase digestion method were lysed using RIPA buffer. Lysate proteins [40 µg] were resolved by SDS-PAGE and the abundance of cleaved caspase 3 and 6 and lamin A and B were determined by Western blotting. To assess equal protein loading, the membrane was probed for β-actin. Representative blots from three to four ZLC and ZDF islet preparations are shown in Panel A, D and E. Intensity of protein bands
Degraded Lamin B
Cleaved Caspase 3
‐actin
ZLC ZDFA
B C
0
1
2
*
ZLC ZD F
Fo
ld c
han
ge
(Cle
ave
d C
asp
ase
3/A
ctin
)
Fo
ld C
han
ge
(Deg
rad
ed
Lam
in B
/Act
in)
0
1
2
*
ZLC ZDF
Cleaved Caspase 6
‐actin
ZLC ZDF
Cleaved Lamin A
‐actin
ZLC ZDFD E
F G
0
1
2
ZLC ZDF
Fo
ld C
han
ge
(Cle
aved
Cas
pas
e 6/
Act
in)
*
Fo
ld C
han
ge
(Cle
aved
La
min
A/A
ctin
)
0
1
2
3
*
ZLC ZDF

53
was quantified by densitometry and data represent mean ± SEM from three to four islet preparations and are expressed as fold change in cleaved caspase 3 [Panel B], degraded lamin B [Panel C], cleaved caspase 6 [Panel F] and lamin A [Panel G]. *P < 0.05 vs. ZLC
Figure 3-9: Caspase 3 and 6 activation and lamin A and B degradation in diabetic human islets. Islets obtained from normal and diabetic individuals were lysed using RIPA buffer. Proteins from cell lysates were separated by gel electrophoresis and transferred to a nitrocellulose membrane. Cleaved caspase 3 and 6, and lamin A and B and β-actin antibodies were used to probe the same membrane after stripping. Human islet data from normal and diabetic individuals were accrued from a single batch of islet preparation. Collectively, data shown in Figures 3-1 to 3-9 can be summarized as follows:
Glucotoxic conditions promote the activation of executioner caspases 3 and 6, which
leads to the degradation of their downstream targets, the nuclear lamins A and B in INS-
1 832/13 cells, normal rodent and human islets.
Evidence of the expression of ZMPSTE24, a lamin A processing enzyme, was seen in
INS-1 832/13 cells and human islets.
Degraded Lamin B
Cleaved Caspase 3
Con T2D
‐actin
A
Con T2D
‐actin
Cleaved Caspase 6
Cleaved Lamin A
C
Fold Change(Cleaved
Caspase 3/Actin)
Fold Change (Degraded
Lamin B/Actin)
Control T2D Control T2D
1.0 1.41 1.0 1.71
Fold Change (Cleaved
Caspase 6/Actin)
Fold Change (Cleaved
Lamin A/Actin)
Control T2D Control T2D
1.0 1.43 1.0 1.36
B
D

54
Under conditions of high glucose exposure, a significant impairment in the insulin
secretion capacity of the beta cells was observed.
Significant alterations in the subcellular distribution of lamin B were observed under
glucotoxic conditions.
Islets obtained from the ZDF rat, a model for T2D and islets from T2D human donors
also exhibit similar effects on activation of caspases and proteolytic cleavage of lamins.

55
CHAPTER 4
IDENTIFICATION OF DOWNSTREAM SIGNALING EVENTS INVOLVED IN GLUCOTOXICITY INDUCED ENDOPLASMIC RETICULUM [ER] STRESS LEADING
TO DYSFUNCTION IN PANCREATIC BETA CELLS
Portions of this work have been published [copies of the published manuscripts are appended] Khadija S, Veluthakal R, Sidarala V, Kowluru A. Glucotoxic and diabetic conditions induce
caspase 6-mediated degradation of nuclear lamin A in human islets, rodent islets and INS-1
832/13 cells. Apoptosis. 2014; 19[12]:1691-701.
Syeda K, Mohammed AM, Arora DK, Kowluru A. Glucotoxic conditions induce endoplasmic
reticulum stress to cause caspase 3 mediated lamin B degradation in pancreatic β-cells:
protection by nifedipine. Biochem Pharmacol. 2013 1;86[9]:1338-46.
Thapsigargin, a known inducer of ER stress, markedly increases caspase 3 activation
and lamin B degradation in INS 1-832/13 cells
Figure 4-1: Chemical Structure of Thapsigargin
Several lines of experimental evidence implicate ER stress as one of intermediate steps
involved in glucotoxicity of the islet beta cell [93]. To determine if high glucose induces ER
stress in our current experimental model, we quantified CHOP expression, an ER stress marker,
in INS-1 832/13 cells exposed to low and high glucose conditions. Data depicted in Figure 4-2

56
[Panel A] demonstrate a significant increase in CHOP expression in cells exposed to glucotoxic
conditions and a similar result was obtained with thapsigargin [Panel B]. To further assess if ER
stress induces caspase 3 activation and lamin B degradation, we incubated INS-1 832/13 cells
with thapsigargin and then quantitated caspase 3 activation and lamin B degradation in these
cells. Data depicted in Figure 4-2, Panel E demonstrate significant increase in caspase 3
activation in cells treated with thapsigargin as early as 2 hrs of incubation [3.4- fold; Figure 4-2
Panels E and F]. Note that thapsigargin effects were maximal at 2 hrs since no further increase
in caspase 3 activation was seen at 4 hrs [3.1-fold activation] and 6 hrs [3-fold activation; Panels
E and F]. Under these conditions, we also noticed a significant increase in lamin B degradation
induced by thapsigargin within 2 hrs [1.9-fold], which remain plateaued at 4 hrs [1.8- fold] and 6
hrs [1.7-fold] as shown in Panels E and G. Together, our findings suggest ER stress as one of
the mechanisms underlying glucose-mediated effects on caspase 3 activation and lamin B
degradation. In the next set of studies, we further tested this hypothesis using a
pharmacological approach.
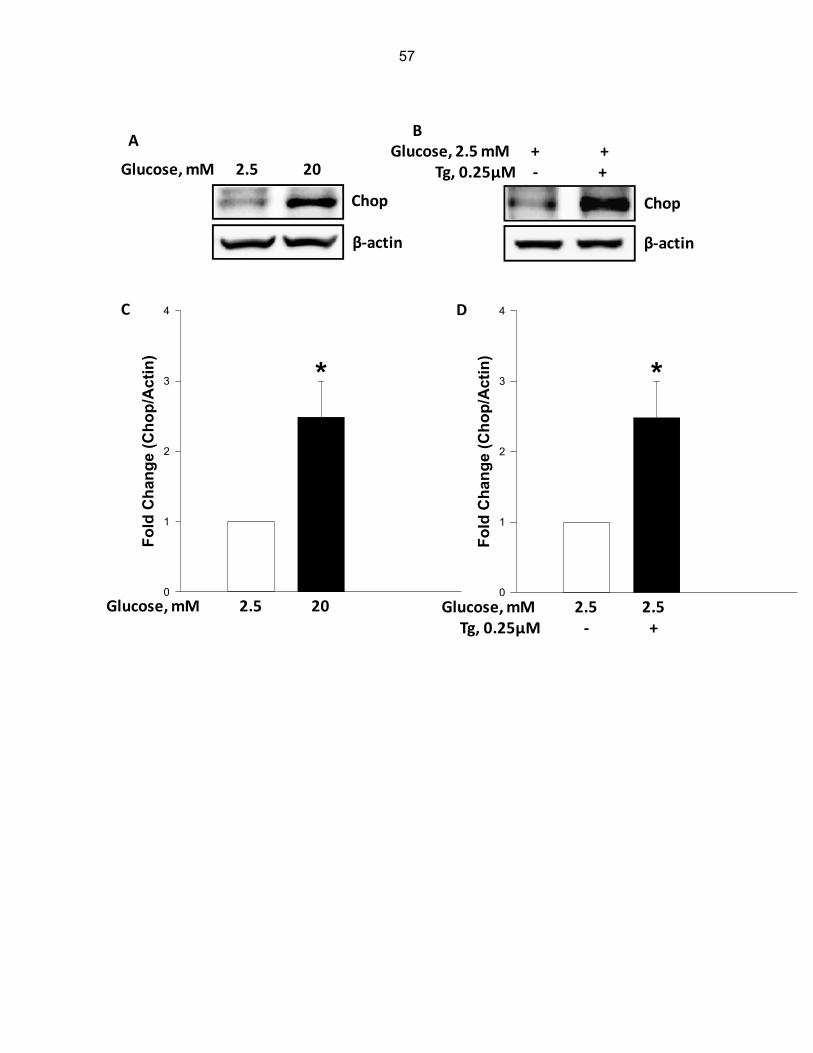
57
A
Chop
β‐actin
Glucose, mM 2.5 20
Chop
B
β‐actin
Glucose, 2.5 mM + +Tg, 0.25μM ‐ +
Fo
ld C
han
ge
(Ch
op
/Act
in)
0
1
2
3
4
*
C
Glucose, mM 2.5 20
D
Fo
ld C
han
ge
(Ch
op
/Act
in)
0
1
2
3
4
*
Glucose, mM 2.5 2.5Tg, 0.25μM ‐ +

58
Figure 4-2: Thapsigargin, a known inducer of ER stress, also promotes caspase 3 activation and lamin B degradation in INS-1 832/13 cells. Cells were incubated with low glucose [2.5 mM] or high glucose [20 mM] for 24 hrs. Expression of CHOP was determined in cell lysates by Western blotting [Panel A]. The same membranes were reprobed using antibody against β-actin. Densitometry was used to measure CHOP expression. The statistical significance of the differences between the control and the experimental groups was determined by t-test. Panel C represents data from three independent experiments. *P < 0.05 vs. 2.5 mM glucose. Panel B: INS-1 832/13 cells were incubated with low glucose [2.5 mM] or thapsigargin [Tg; 0.25 μM for 6 hrs]. Expression of CHOP was determined by Western blotting. Uniform protein loading was assessed by re-probing the same membrane with antiserum against β-actin. Quantification of CHOP expression was carried out by densitometry. The statistical significance of the differences in Mean ± SEM values between the control and the experimental groups was evaluated by student’s t-test. Data in panel D represent mean ± SEM from three independent experiments and expressed as fold change. *P < 0.05 vs. 2.5 mM glucose. Panel E: INS-1 832/13 cells were treated with low glucose [2.5 mM] or thapsigargin [Tg; 0.25 µM] for 2, 4 and 6 hrs as indicated in
2 h 4 h 6 h
Degraded Lamin B
Cleaved Caspase 3
β‐actin
Lamin B
D
Glucose, 2.5mM + + + +
Tg, 0.25μM ‐ + + +
E
Fo
ld C
han
ge
(Cle
aved
Cas
pas
e 3/
Act
in)
0
1
2
3
4 **
*
2 h 4 h 6 h
Glucose, 2.5mM + + + +
Tg, 0.25μM ‐ + + +
F
Fo
ld C
han
ge
(Deg
rad
ed L
amin
B/A
ctin
)
0
1
2
3
**
*
2 h 4 h 6 h
Glucose, 2.5mM + + + +
Tg, 0.25μM ‐ + + +
59
the figure. Lysate proteins were loaded onto a SDS-Polyacrylamide gel and electro-transferred onto a nitrocellulose membrane. The membrane was probed with antisera against cleaved caspase 3 and degraded lamin B. To ascertain uniform loading of proteins, the membrane was stripped and reprobed with antibody against β-actin. Quantification of caspase 3 activation and lamin B degradation were carried out by densitometry. Data in Panel E and F represent mean ± SEM from three independent experiments and expressed as fold change. *P < 0.05 vs. 2.5 mM glucose.
Caspase 3 activation and Lamin B degradation observed in Akita beta cells: an ER stress
mouse model
The Akita mouse model has a spontaneous mutation in the Ins2 gene, which causes
misfolding of the translated insulin in the endoplasmic reticulum. Therefore, Ins2Akita mice serve
as a suitable model for ER stress in the beta cell, seen in diabetic conditions. They develop
insulin dependent diabetes, including hyperglycemia, hypoinsulinemia, polydipsia, and polyuria.
We wanted to examine if the effects on caspase 3 and lamin B seen under glucotoxic conditions
could be mimicked in cells obtained from Akita mice in order to decipher the role of ER stress in
our model. Results acquired from a Western blot study, after running the lysates obtained from
wild type [WT] and Akita cells, are depicted in Figure 4-3. We observed a higher level of active
caspase 3 and degradation of lamin B in cells from the Akita mouse compared to the wild type.
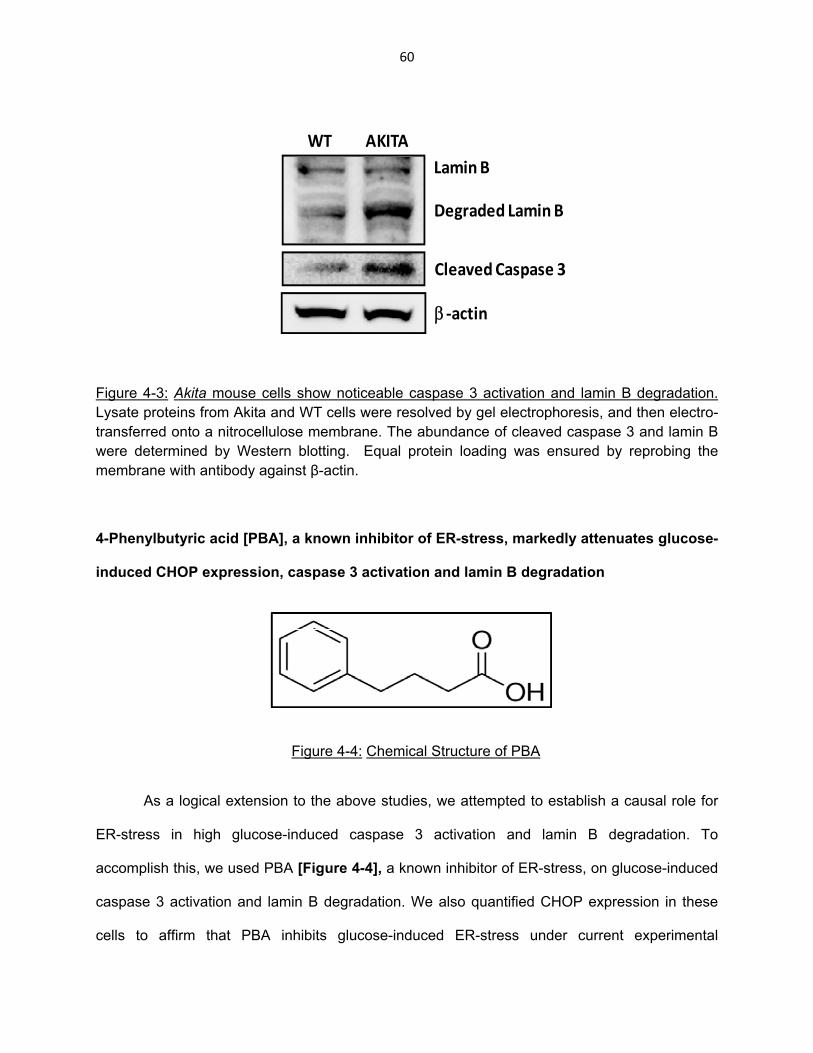
60
Figure 4-3: Akita mouse cells show noticeable caspase 3 activation and lamin B degradation. Lysate proteins from Akita and WT cells were resolved by gel electrophoresis, and then electro-transferred onto a nitrocellulose membrane. The abundance of cleaved caspase 3 and lamin B were determined by Western blotting. Equal protein loading was ensured by reprobing the membrane with antibody against β-actin.
4-Phenylbutyric acid [PBA], a known inhibitor of ER-stress, markedly attenuates glucose-
induced CHOP expression, caspase 3 activation and lamin B degradation
Figure 4-4: Chemical Structure of PBA
As a logical extension to the above studies, we attempted to establish a causal role for
ER-stress in high glucose-induced caspase 3 activation and lamin B degradation. To
accomplish this, we used PBA [Figure 4-4], a known inhibitor of ER-stress, on glucose-induced
caspase 3 activation and lamin B degradation. We also quantified CHOP expression in these
cells to affirm that PBA inhibits glucose-induced ER-stress under current experimental
WT AKITA
Lamin B
Degraded Lamin B
Cleaved Caspase 3
‐actin

61
conditions. Data depicted in Figure 4-5 demonstrate a significant increase in CHOP expression
in glucose-treated cells. We also observed complete inhibition of glucose-induced CHOP
expression by PBA [Figure 4-5, Panel A]. These data thus validate the use of PBA as an
inhibitor of ER-stress in INS-1 832/13 cells. More importantly, we also noticed a complete
inhibition of glucose-induced caspase 3 activation and lamin B degradation by PBA in these
cells [Figure 4-5; Panel B]. Taken together, these data provide the first evidence that
glucotoxicity promotes caspase 3 activation and lamin B degradation in an ER-stress sensitive
fashion.
Figure 4-5: PBA, a known inhibitor of ER-stress, markedly attenuates glucose-induced CHOP expression, caspase 3 activation and lamin B degradation in INS-1 832/13 cells. Cells were
Fo
ld C
han
ge
(Lam
in B
Deg
rad
atio
n/A
ctin
)
0
1
2
3
4
5
*
#
A A
C D E
β‐actin
CHOP
A
Glucose, mM 2.5 2.5 20 20
PBA, 0.5 mM ‐ + ‐ +
Cleaved Caspase 3
Degraded Lamin B
β‐actin
Caspase 3
Lamin B
B
Glucose, mM 2.5 2.5 20 20
PBA, 0.5 mM ‐ + ‐ +
Fo
ld C
han
ge
(Ch
op
/Act
in)
0
1
2
3
*
#
A A
Fo
ld C
han
ge
(Cle
aved
Cas
pas
e 3/
Act
in)
0
1
2
3
4
*
#
A AGlucose, mM 2.5 2.5 20 20
PBA, 0.5 mM ‐ + ‐ +Glucose, mM 2.5 2.5 20 20
PBA, 0.5 mM ‐ + ‐ +
Glucose, mM 2.5 2.5 20 20
PBA, 0.5 mM ‐ + ‐ +

62
incubated in the presence of low or high [2.5 or 20 mM] glucose for 24 hrs in the presence and absence of PBA [0.5 mM]. Approximately 40 μg protein lysates were loaded onto SDS-Polyacrylamide gels and electro-transferred onto nitrocellulose membranes. The membranes were probed with antibodies against CHOP [Panel A], active caspase 3 and degraded lamin B [Panel B]. Uniform protein loading was assessed by reprobing the membranes antibody against β-actin. Intensity of protein bands was quantified by densitometry [Panels C-E]. Data represent mean ± SEM from three independent experiments and expressed as fold change in CHOP expression, caspase 3 activation and lamin B degradation. *P < 0.05 vs. 2.5 mM glucose without inhibitor, #P < 0.05 vs. 20 mM glucose without inhibitor.
Nifedipine, a calcium channel blocker, inhibits glucose-induced caspase 3 activation and
lamin B degradation in INS-1 832/13 cells
Figure 4-6: Chemical Structure of Nifedipine
We recently reported that calcium overload may represent one of the signaling
mechanisms involved in caspase-3 activation under conditions of cellular apoptosis in isolated
beta cells. For example, using etoposide, a known inducer of loss in metabolic viability in beta
cells, we reported a marked increase in caspase 3 activity in INS-1 832/13 cells and normal rat
islets. More importantly, we have been able to prevent etoposide-induced metabolic dysfunction
in these cells by nifedipine [Figure 4-6], a known blocker of L-type calcium channel activation
and calcium entry [93]. Furthermore, recent findings from the laboratory of Wang and
associates [94] have also demonstrated significant protective effects of nifedipine against high
glucose-induced ER stress and apoptosis. Therefore, as a logical extension to findings that we
63
reported above, we undertook a study to see if glucose-induced caspase 3 activation and lamin
B degradation are prevented by nifedipine. Data presented in Figure 4-7, Panel A indicate a
modest, but insignificant [1.2-fold] increase in caspase 3 activation in INS-1 832/13 cells
incubated with nifedipine alone under basal conditions. No significant effects of nifedipine were
demonstrable on lamin B degradation under these conditions. As shown above, high glucose-
treatment markedly enhanced caspase 3 activation [2.5- fold] and lamin B degradation [1.9-fold;
Figure 4-7, Panels B and C]. Interestingly, co-provision of nifedipine with glucose markedly
reduced high glucose-induced effects on caspase 3 activation [2.5-fold vs. 1.2- fold in the
absence and presence of nifedipine, respectively]. In a manner akin to these findings, nifedipine
also attenuated lamin B degradation induced by glucose [1.9-fold in the absence of nifedipine
and 1.2-fold in its presence; Figure 4-7].

64
Figure 4-7: Nifedipine, a calcium channel blocker, inhibits glucose-induced caspase 3 activation and lamin B degradation in INS-1 832/13 cells. Panel A: INS-1 832/13 cells were incubated with low glucose or high glucose [2.5 or 20 mM] for 24 hrs in the absence [diluent] or presence of nifedipine [10 μM]. Proteins obtained after cell lysis were resolved by gel electrophoresis and electro-transferred onto a nitrocellulose membrane. The membrane was probed with antibodies against cleaved caspase 3 and lamin B. To ensure uniformity in protein loading, the same membranes were re-probed with β-actin antibody. Band densities of caspase 3 activation and lamin B degradation were measure. Data represent mean ± SEM from three independent experiments and expressed as fold change [Panel B and C]. *P < 0.05 vs. 2.5 mM glucose without nifedipine and #P < 0.05 vs. 20 mM without nifedipine.
Cleaved Caspase 3
Degraded Lamin B
β‐actin
A
Lamin B
Glucose, mM 2.5 2.5 20 20
Nifedipine, 10 μM ‐ + ‐ +
B
Fo
ld C
ha
ng
e (C
leav
ed C
asp
ase
3/A
ctin
)
0
1
2
3
G Nif HG Nif
*
Glucose, mM 2.5 2.5 20 20
Nifedipine, 10 μM ‐ + ‐ +
C
Fo
ld C
han
ge
(Deg
rad
ed L
amin
B/A
ctin
)
0
1
2
3
*
#
Glucose, mM 2.5 2.5 20 20
Nifedipine, 10 μM ‐ + ‐ +
65
Z-DEVD-FMK, a known inhibitor of caspase 3, markedly attenuates high glucose-induced
caspase 3 activation and lamin B degradation in INS-1 832/13 cells
In vitro studies on beta cell lines utilizing caspase inhibitors have demonstrated that the
caspase 2 inhibitor is effective in protecting the HIT-T15 beta cell line against an experimental
model of cell death [95]. Furthermore, murine TC-1 cell lines transfected with human Fas were
shown to be protected against Fas-induced beta cell apoptosis by the caspase 3 inhibitor Z-
Asp-Glu-Val-Asp-fluoromethyl ketone [96] and palmitate-induced beta cell apoptosis, could be
prevented by executioner caspase 6 inhibitors [97]. The preferential recognition of different
caspases for specific amino acid sequences on the substrate proteins has been taken
advantage of in the development of specific peptide inhibitors. These caspase inhibitors are cell
permeable and bind to the active site of the proteases and thereby obstruct the progression of
apoptotic pathway downstream of caspase activation. In an attempt to investigate the
dependency of lamin degradation on upstream caspase 3 activation, observed in glucotoxicity
induced apoptotic signaling, we used a cell permeable peptide inhibitor, specific for caspase 3
[Z-DEVD-FMK]. We measured lamin B degradation and caspase 3 activation in cells treated
with low and high glucose conditions in the absence and presence of Z-DEVD-FMK. Data in
Figure 4-8 Panel A show a marked inhibition of lamin B degradation and caspase 3 activation
after treatment with the inhibitor. Panels B and C represent data collected from three to four
experiments.

66
Figure 4-8: Z-DEVD-FMK, a known inhibitor of caspase 3, prevented high glucose induced caspase 3 activation and lamin B breakdown in INS-1 832/13 cells. INS-1 832/13 cells were preincubated with Z-DEVD-FMK [3μM] for 1 hr and further treated with low [2.5 mM; LG] or high [20 mM; HG] glucose in the presence and absence of Z-DEVD-FMK for 6 hrs. Caspase 3 activation and lamin B degradation [Panel A] were determined by Western blotting. To ensure equal protein loading, the membranes were probed with β-actin antiserum. Data represent mean ± SEM from three to four independent experiments and expressed as fold change in caspase 3 and lamin B degradation [Panel B and C]. *P < 0.05 vs. 2.5 mM glucose in the absence of the inhibitor; # P < 0.05 vs. 20 mM glucose without inhibitor. NS: Not significant vs. 2.5 mM glucose in the absence of the inhibitor.
Cleaved Caspase 3
Degraded Lamin B
β‐actin
Lamin B
AGlucose, mM 2.5 2.5 20 20
Z‐DEVD‐FMK, 3 μM ‐ + ‐ +
B
Fo
ld C
han
ge
(Cle
aved
Cas
pa
se 3
/Ac
tin
)
0
1
2
3
K K
*
#
NS
Glucose, mM 2.5 2.5 20 20
Z‐DEVD‐FMK, 3 μM ‐ + ‐ +
Fo
ld C
han
ge
(Deg
rad
ed L
amin
B/A
ctin
)
0
1
2
3
K G K
*
#
Glucose, mM 2.5 2.5 20 20
Z‐DEVD‐FMK, 3 μM ‐ + ‐ +
C
67
Z-DEVD-FMK significantly reduces high glucose-induced activation of executioner
caspase 6 and degradation of lamin A in INS-1 832/13 cells
Evidence in different cell types suggests that event of caspase 3 activation in the
caspase cascade is upstream to activation of caspase 6 [98], and/or both these executioner
caspases are cleaved and thereby activated under conditions induced by apoptotic stimuli [99].
Therefore, in the next set of experiments, we examined if caspase 3 activation precedes
caspase 6 activation in beta cells under the duress of glucotoxicity. To address this, we
quantified caspase 6 activation in INS-1 832/13 cells under high glucose treatment conditions in
the absence or presence of caspase 3 inhibitor [Z-DEVD-FMK]. Data shown in Figure 4-9
[Panel A], demonstrate significant inhibition of glucose-induced caspase 6 activation following
inhibition of caspase 3. Panel B includes data accumulated from multiple experiments. It should
be noted that caspase 3 inhibitor also activated caspase 6 under low glucose incubation
conditions. Furthermore, Z-DEVD-FMK significantly attenuated high glucose-induced lamin A
degradation [Figure 4-9; Panel C], further supporting the notion that glucose-induced caspase 3
activation might lie upstream to caspase 6 activation and lamin A degradation. Collectively, at
least, based on our current and recently published findings [100], we conclude that executioner
caspases [caspase 3 and 6] mediate nuclear lamin [A and B] degradation and chromatin
condensation and collapse of nuclear envelope under conditions of glucotoxicity.

68
Cleaved Caspase 6
‐actin
A
Glucose, mM 2.5 2.5 20 20
Z‐DEVD‐FMK, 3 μM ‐ + ‐ +
B
0
1
2
G K G KFo
ld C
han
ge
(Cle
aved
Cas
pas
e 6/
Ac
tin
)
*
#
*
Glucose, mM 2.5 2.5 20 20
Z‐DEVD‐FMK, 3 μM ‐ + ‐ +
Cleaved Lamin A
‐actin
CGlucose, mM 2.5 2.5 20 20
Z‐DEVD‐FMK, 3 μM ‐ + ‐ +
0
1
2
G K K
Fo
ld C
han
ge
(Cle
aved
Lam
in A
/Act
in)
*
#
D
NS
Glucose, mM 2.5 2.5 20 20
Z‐DEVD‐FMK, 3 μM ‐ + ‐ +
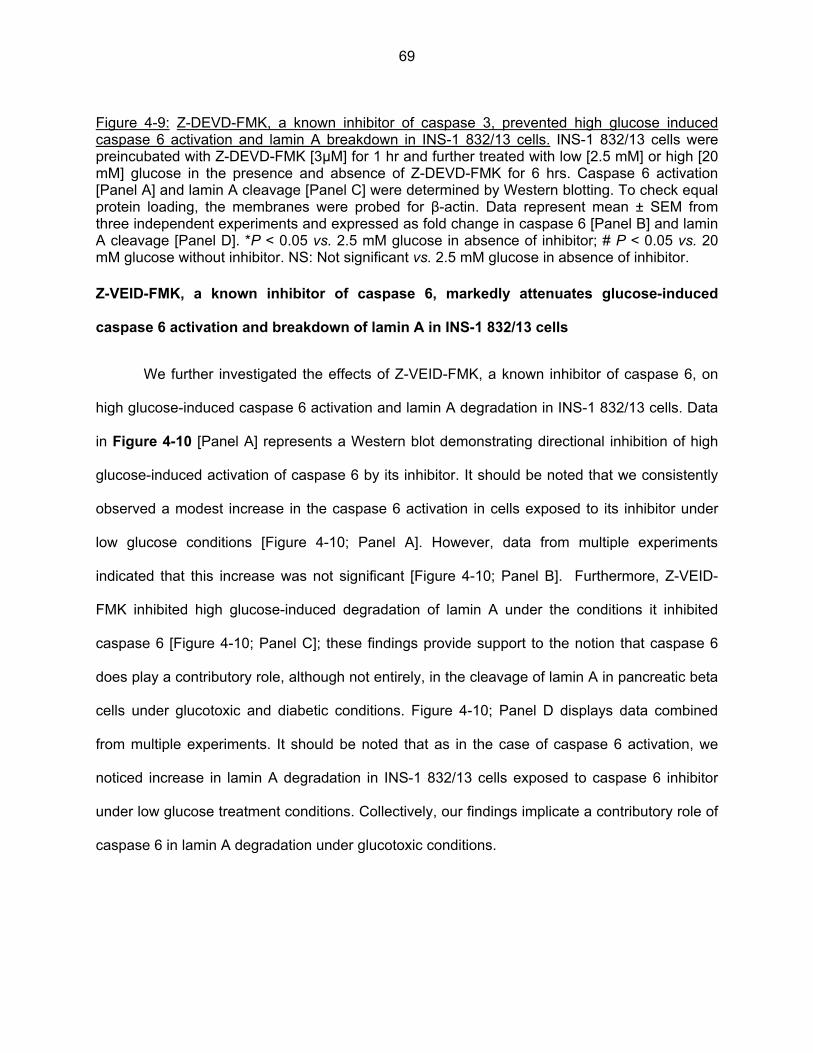
69
Figure 4-9: Z-DEVD-FMK, a known inhibitor of caspase 3, prevented high glucose induced caspase 6 activation and lamin A breakdown in INS-1 832/13 cells. INS-1 832/13 cells were preincubated with Z-DEVD-FMK [3μM] for 1 hr and further treated with low [2.5 mM] or high [20 mM] glucose in the presence and absence of Z-DEVD-FMK for 6 hrs. Caspase 6 activation [Panel A] and lamin A cleavage [Panel C] were determined by Western blotting. To check equal protein loading, the membranes were probed for β-actin. Data represent mean ± SEM from three independent experiments and expressed as fold change in caspase 6 [Panel B] and lamin A cleavage [Panel D]. *P < 0.05 vs. 2.5 mM glucose in absence of inhibitor; # P < 0.05 vs. 20 mM glucose without inhibitor. NS: Not significant vs. 2.5 mM glucose in absence of inhibitor. Z-VEID-FMK, a known inhibitor of caspase 6, markedly attenuates glucose-induced
caspase 6 activation and breakdown of lamin A in INS-1 832/13 cells
We further investigated the effects of Z-VEID-FMK, a known inhibitor of caspase 6, on
high glucose-induced caspase 6 activation and lamin A degradation in INS-1 832/13 cells. Data
in Figure 4-10 [Panel A] represents a Western blot demonstrating directional inhibition of high
glucose-induced activation of caspase 6 by its inhibitor. It should be noted that we consistently
observed a modest increase in the caspase 6 activation in cells exposed to its inhibitor under
low glucose conditions [Figure 4-10; Panel A]. However, data from multiple experiments
indicated that this increase was not significant [Figure 4-10; Panel B]. Furthermore, Z-VEID-
FMK inhibited high glucose-induced degradation of lamin A under the conditions it inhibited
caspase 6 [Figure 4-10; Panel C]; these findings provide support to the notion that caspase 6
does play a contributory role, although not entirely, in the cleavage of lamin A in pancreatic beta
cells under glucotoxic and diabetic conditions. Figure 4-10; Panel D displays data combined
from multiple experiments. It should be noted that as in the case of caspase 6 activation, we
noticed increase in lamin A degradation in INS-1 832/13 cells exposed to caspase 6 inhibitor
under low glucose treatment conditions. Collectively, our findings implicate a contributory role of
caspase 6 in lamin A degradation under glucotoxic conditions.
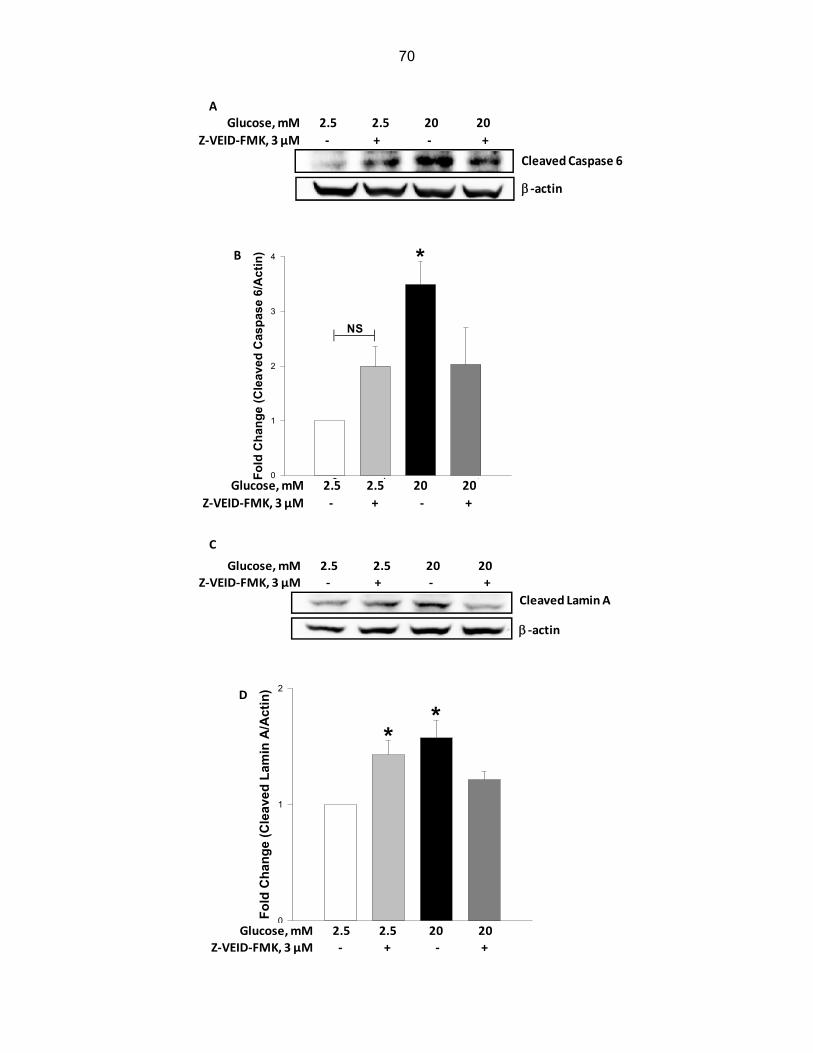
70
Cleaved Caspase 6
‐actin
AGlucose, mM 2.5 2.5 20 20
Z‐VEID‐FMK, 3 μM ‐ + ‐ +
Fo
ld C
han
ge
(Cle
ave
d C
asp
ase
6/A
cti
n)
0
1
2
3
4
G K G K
*B
NS
Glucose, mM 2.5 2.5 20 20
Z‐VEID‐FMK, 3 μM ‐ + ‐ +
Cleaved Lamin A
‐actin
C
Glucose, mM 2.5 2.5 20 20
Z‐VEID‐FMK, 3 μM ‐ + ‐ +
D
Fo
ld C
ha
ng
e (C
lea
ved
Lam
in A
/Act
in)
0
1
2
K G K
**
Glucose, mM 2.5 2.5 20 20
Z‐VEID‐FMK, 3 μM ‐ + ‐ +
71
Figure 4-10: High glucose-induced caspase 6 activation and breakdown of lamin A cleavage were attenuated by Z-VEID-FMK, a specific inhibitor of caspase 6, in INS-1 832/13 cells INS-1 832/13 cells were preincubated with Z-VEID-FMK [3μM] for 1 hr and further treated with low [2.5 mM] or high [20 mM] glucose in the presence and absence of Z-VEID-FMK for 6 hrs. Caspase 6 activation and lamin A cleavage were determined by Western blotting. The membrane was probed for cleaved caspase 6 [Panel A] and cleaved lamin A [Panel C], and immune complexes were identified using ECL detection kit. To ensure equal protein loading, the membranes were probed for β actin. Data represent mean ± SEM from three independent experiments and expressed as fold change in caspase 6 [Panel B] and lamin A cleavage [Panel D]. *P < 0.05 vs. 2.5 mM glucose without inhibitor. NS: Not significant vs. 2.5 mM glucose without inhibitor.
Studies using rottlerin, an inhibitor of PKC-δ, on the activation of caspase 3 and
degradation of lamin B
Several studies have shown that in order for caspases to target the nuclear lamins for
proteolytic degradation, phosphorylation of the lamin filaments by PKC-δ is required. In an
attempt to gain deeper insight into this mechanism we tested the effects of rottlerin [5 and 10
µM], an inhibitor of PKC-δ on lamin B under the duress of glucotoxicity. However we could not
see an inhibitory effect of this compound on the degradation of lamin B in our experiment in
INS-1 832/13 cells [Figure 4-11]. Further we also tested siRNA against PKC-δ but could not
attain sufficiently high transfection efficiency even at 200 nm concentration of the siRNA [data
not shown]. Since PKC-δ is one of 11 isoforms of the PKC family and has a number of splice
variants [PKC-δI, PKC-δII] which could be pro-apoptotic or anti-apoptotic [101], it would be
interesting to study each splice variant individually and identify the role of each distinct splice
variant in the processing of lamins.

72
Figure 4-11: Rottlerin had no effect on high glucose induced activation of caspase 3 and lamin B degradation. INS-1 832/13 cells were preincubated with rottlerin [5 and 10 μM] for 1 hr and further treated with low [2.5 mM] or high [20 mM] glucose in the presence and absence of rottlerin for 6 hrs. Activation of executioner caspase 3 and lamin B degradation were examined by Western blotting. To ensure equal protein loading, the membranes were probed for β-actin. Representative blots from 3 individual experiments are shown in the figure above.
Results obtained from these studies can be summarized as follows:
Effects of glucotoxicity on CHOP expression are comparable to those of thapsigargin, a
potent inducer of ER stress in many cell types. Thapsigargin treatment also induced
caspase 3 activation and lamin B degradation, as seen under high glucose treatment,
thereby implicating an ER stress mediated pathway.
PBA, an inhibitor of ER stress, markedly reduced glucose-induced CHOP expression,
caspase 3 activation and lamin B degradation.
Blocking of membrane associated L-type calcium ion channels, with nifedipine, markedly
attenuated high glucose-induced effects on the beta cell.
Z-DEVD-FMK, a specific inhibitor of caspase 3, inhibited high glucose-induced caspase
3, 6 activation and proteolysis of lamin A, B and Z-VEID-FMK, which specifically inhibits
caspase 6 activation blocked high glucose-induced caspase 6 activation and lamin A
degradation.
Glucose, mM 2.5 2.5 2.5 20 20 20
Rottlerin, µM 0 5 10 0 5 10
Lamin B
Degraded Lamin B
β‐actin
Cleaved Caspase 3
73
CHAPTER 5
CONSEQUENCES OF INHIBITION OF REQUISITE POST TRANSLATIONAL PRENYLATION OF LAMINS ON THE PANCREATIC BETA CELL
The nuclear lamins, in their original post transcription stage, are translated as native pre-
lamins, which further need to undergo a series of PTMs and are then processed into their
mature form for localization into the nuclear membrane, protein interactions and performing their
functions within the nucleus. Apart from other modifications [Figure 1-5], lamins undergo
farnesylation at the cysteine residue of the C-terminal CAAX motif [21]. How then, does
inhibition of prenylation of lamins affect nuclear envelope integrity? What would be the overall
effects of inhibition of lamin farnesylation on the pancreatic beta cell? To address these
questions, we made use of pharmacological inhibitors of protein prenylation. Firstly, we used
simvastatin, which blocks the biosynthesis of mevalonic acid [MVA] and other key intermediates
in the cholesterol biosynthesis pathway, namely: farnesyl pyrophosphate [FPP] and
geranylgeranyl pyrophosphate [GGPP], that are involved in post translational prenylation of
several proteins [Rho, Rab, Ras] [Figure 5-1]. Secondly, we used a farnesyl transferase
inhibitor, FTI-277, which inhibits the catalytic addition of 15 carbon farnesyl moiety to target
proteins [e.g., Ras, nuclear lamins]. In addition, we also tested the effects of GGTI-2147, which
inhibits the enzyme geranylgeranyl transferase [GGTase I]. We examined the effects of these
inhibitors on the activation of caspase 3, lamin B degradation and overall cell morphology and
viability in INS-1 832/13 cells and rat islets.
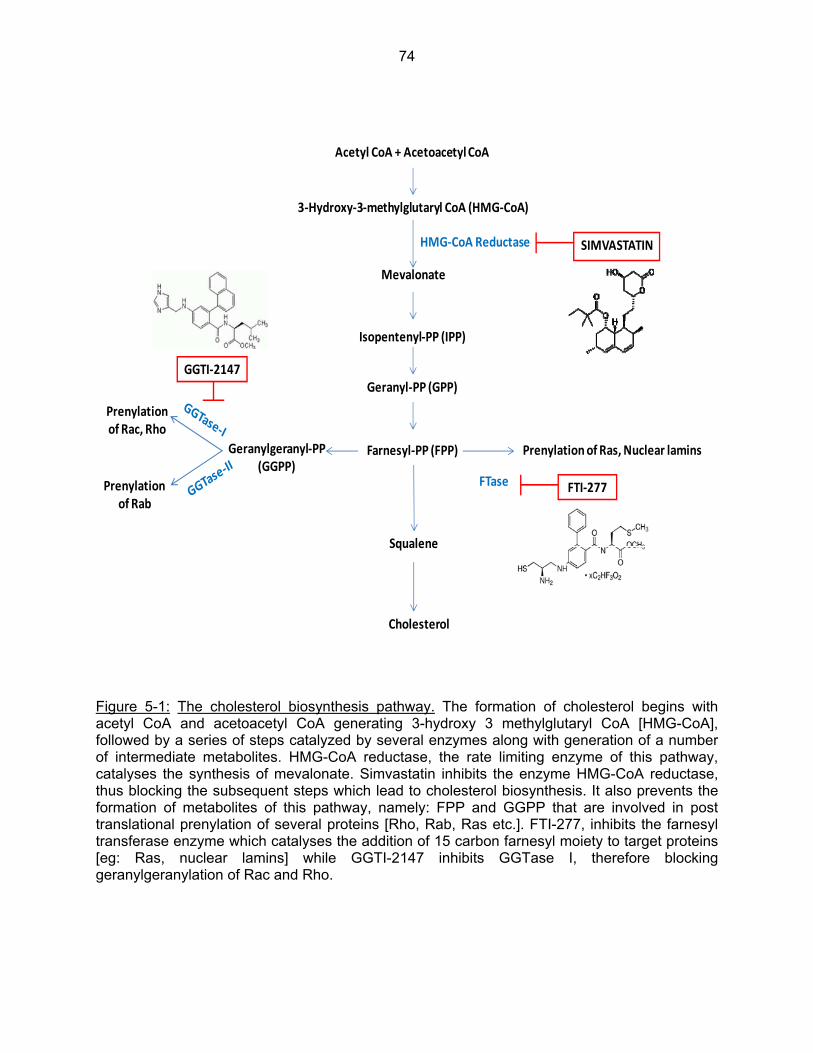
74
Figure 5-1: The cholesterol biosynthesis pathway. The formation of cholesterol begins with acetyl CoA and acetoacetyl CoA generating 3-hydroxy 3 methylglutaryl CoA [HMG-CoA], followed by a series of steps catalyzed by several enzymes along with generation of a number of intermediate metabolites. HMG-CoA reductase, the rate limiting enzyme of this pathway, catalyses the synthesis of mevalonate. Simvastatin inhibits the enzyme HMG-CoA reductase, thus blocking the subsequent steps which lead to cholesterol biosynthesis. It also prevents the formation of metabolites of this pathway, namely: FPP and GGPP that are involved in post translational prenylation of several proteins [Rho, Rab, Ras etc.]. FTI-277, inhibits the farnesyl transferase enzyme which catalyses the addition of 15 carbon farnesyl moiety to target proteins [eg: Ras, nuclear lamins] while GGTI-2147 inhibits GGTase I, therefore blocking geranylgeranylation of Rac and Rho.
Acetyl CoA + Acetoacetyl CoA
3‐Hydroxy‐3‐methylglutaryl CoA (HMG‐CoA)
Mevalonate
Isopentenyl‐PP (IPP)
Geranyl‐PP (GPP)
Farnesyl‐PP (FPP) Prenylation of Ras, Nuclear laminsGeranylgeranyl‐PP (GGPP)
Prenylation of Rac, Rho
HMG‐CoA Reductase
Squalene
Cholesterol
SIMVASTATIN
Prenylation of Rab
GGTI‐2147
FTase FTI‐277
75
A] Studies on effects of Statins:
INS-1 832/13 cells and rat islets treated with Simvastatin exhibit increased activation of
caspase 3 and subsequent degradation of lamin B along with changes in cell
morphology.
At the outset, we treated INS-1 832/13 cells, cultured in RPMI medium, with low glucose
[2.5 mM] as control and low glucose with Simvastatin [15 μM] for 24 hrs and examined the
effects of the treatment on caspase 3 and its downstream target lamin B. As shown in Figure 5-
2, Panel A, we observed an increase in cleaved caspase 3, which is an indicator of caspase 3
activation, and a corresponding increase in the degraded product of lamin B. Pooled data from 3
independent Western blotting studies, shown in Panels B and C, demonstrate a significant
increase in band densities of cleaved caspase 3 and degraded lamin B. Along with these
observations, we also noticed changes in morphology in cells incubated for 24 hrs with
Simvastatin. Microscopic images in Panel C demonstrate the rounding up of cells treated with
15 and 30 μM Simvastatin and no visible changes in morphology of cells incubated in media
containing low glucose alone or with diluent [DMSO].
As a logical extension of these experiments we performed the above studies in primary
cells from rat pancreatic islets. A representative blot from 2 such independent studies is
depicted in Panel E, wherein islets obtained from normal Sprague Dawley, rats were exposed to
low glucose in the absence and presence of Simvastatin [15 μM and 30 μM] for 24 hrs. We
observed a similar increase in caspase 3 activation and lamin B degradation which support our
observations in INS-1 832/13 cells.
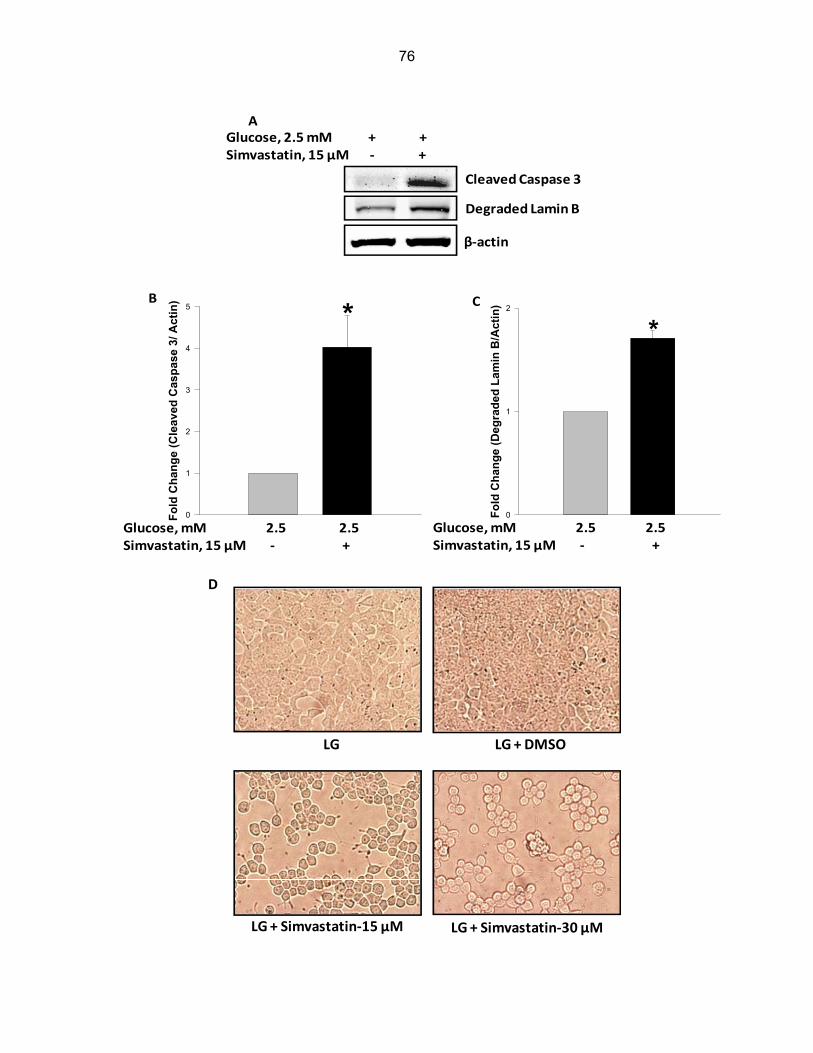
76
Degraded Lamin B
Cleaved Caspase 3
A
β‐actin
Glucose, 2.5 mM + + Simvastatin, 15 μM ‐ +
Fo
ld C
han
ge
(Cle
aved
Cas
pa
se 3
/ Act
in)
0
1
2
3
4
5 *B
Glucose, mM 2.5 2.5Simvastatin, 15 μM ‐ +
Fo
ld C
han
ge
(Deg
rad
ed L
amin
B/A
ctin
)
0
1
2
*C
Glucose, mM 2.5 2.5Simvastatin, 15 μM ‐ +
LG LG + DMSO
LG + Simvastatin‐15 µM LG + Simvastatin‐30 µM
D

77
Figure 5-2: Exposure of INS-1 832/13 cells, rat pancreatic islets to simvastatin results in caspase 3 activation and degradation of lamin B along with changes in cell morphology. (A) INS-1 832/13 cells were treated with RPMI media containing 2.5 mM glucose alone and with 15 μM Simvastatin for 24 hrs. Proteins obtained after cell lysis were resolved by SDS-PAGE and electro-transferred onto a nitrocellulose membrane. Antibodies against cleaved caspase 3 and lamin B were used to probe the membrane. Uniform protein loading was ensured by re-probing the blots with antibody against β-actin. Student’s t-test was utilized to measure the statistical significance of the differences in values between the control and experimental conditions. Panel B and C represent mean ± SEM values and are expressed as fold change in caspase 3 activation [Panel B] and lamin B degradation [Panel C]. *P < 0.05 vs. 2.5 mM glucose. [D] INS-1 832/13 cells, incubated overnight in RPMI medium containing 2.5 mM glucose and 2.5% FBS, were treated the following day with media containing low glucose [2.5 mM] alone and in the presence of diluent [DMSO] or simvastatin [15 μM and 30 μM] for 24 hrs. Changes in cell morphology were visualized by light microscopy. [E] Rat islets isolated by collagenase digestion method were incubated in media containing low glucose [2.5 mM] in the absence and presence of simvastatin [15 μM and 30 μM] for 24 hrs. Activation of executioner caspase 3 and lamin B degradation were evaluated by Western blotting. The membrane was re-blotted with anti β-actin to ensure equal protein loading.
Simvastatin promotes phosphorylation of p38 MAPK and reduces ERK1/2
phosphorylation in INS-1 832/13 cells
In the next set of experiments we examined the effects of Simvastatin treatment on two
mitogen activated protein kinases [MAPKs] namely, p38 and ERK1/2, both of which are
regulated by various extracellular stress stimuli and play a critical role in the cell stress
signaling/survival pathways. INS-1 832/13 cells were exposed to low glucose [2.5 mM] in the
Degraded Lamin B
Cleaved Caspase 3
β‐actin
ERat islets
Glucose, 2.5 mM + + +Simvastatin, μM ‐ 15 30

78
absence and presence of 15 μM simvastatin as described in the previous experiments. Under
these conditions, we looked for the phosphorylation status of p38 using an antibody specific for
phospho-p38 and observed a significant increase in the phosphorylated, active form of p38
MAPK in comparison to the total protein [Figure 5-3 Panel A]. Besides, we also noted a marked
decrease in ERK1/2 phosphorylation/activation using a monoclonal antibody, which recognizes
the dual phosphorylation at Thr202 and Tyr204 of ERK1 and Thr185 and Tyr187 of ERK2, as
shown in Figure 5-3 Panel C. Bar graphs in Panels B and D represents data pooled from 3
independent experiments and represent fold change in the intensities of the phosphorylated
protein bands vs. the intensity of total protein levels. Under the same treatment conditions we
assessed the metabolic cell viability and found a decrease [~12.4%] in viability with Simvastatin
treatment [Panel E].

79
Phospho‐p38
Total‐p38
A
Glucose, 2.5 mM + +Simvastatin, 15 μM ‐ +
Phospho‐ERK 1/2
Total‐ERK1/2
C
Glucose, 2.5 mM + +Simvastatin, 15 μM ‐ +
Fo
ld C
han
ge
(P
ho
sph
o-p
38/T
ota
l-p
38)
0.0
0.5
1.0
1.5
2.0
*
B
Glucose, mM 2.5 2.5Simvastatin, 15 μM ‐ +
Fo
ld C
han
ge
(Ph
osp
ho
-ER
K1/
2/T
ota
l-E
RK
1/2)
0.0
0.5
1.0
1.5
*
D
Glucose, mM 2.5 2.5Simvastatin, 15 μM ‐ +
Glucose, 2.5 mM + +Simvastatin, μM ‐ 15
E
Per
cen
t C
ell V
iab
ilit
y
0
20
40
60
80
100
120
*

80
Figure 5-3: Simvastatin treatment causes a marked increase in phosphorylation of p38 MAP Kinase and significantly decreases phosphorylation of phospho-p44/42 ERK1/2 and a reduction in cell viability. Lysates from INS-1 832/13 cells incubated in RPMI media containing 2.5 mM glucose alone and with 15 μM Simvastatin for 24 hrs were resolved by SDS-PAGE and transferred to nitrocellulose membranes by wet transfer. The blots were probed for phosphorylated p38MAPK and total p38MAPK, phospho-p44/42 ERK1/2 and total p44/42 ERK1/2. Band densities were calculated by densitometry. Data provided in Panel B and D represent mean ± SEM and are expressed as fold change in p38 MAPK phosphorylation [Panel B] and p44/42 ERK1/2 phosphorylation [Panel D]. *P < 0.05 vs. 2.5 mM glucose. Panel E; INS-1 832/13 cells were incubated in low glucose [2.5 mM] in the absence and presence of Simvastatin [15 µM]. After 24 hrs cell viability was assessed by the MTT assay. Data are represented as mean ± SEM values and are expressed as percent cell viability. *P < 0.05 vs. 2.5 mM glucose. B] Studies on effects of FTIs:
Inhibition of farnesylation with FTI-277 treatment of INS-1 832/13 cells has similar effects
on lamins as Simvastatin
The above effects of simvastatin on lamins and caspases [Figure 5-2], could be due to
the depletion of FPP and/or GGPP, thereby inhibiting requisite prenylation of key proteins. In
order to identify the distinct role of geranylgeranylation and farnesylation, we conducted a few
experiments using inhibitors of each post translational modification. FTI-277 is a specific
inhibitor of the enzyme FTase, which catalyses the addition of the 15 carbon farnesyl moiety
onto target proteins e.g., Ras, nuclear Lamins. Herein, we incubated INS-1 832/13 with low
glucose [2.5 mM] alone and with FTI-277 [10µM] for 24 hrs. Results obtained from these studies
demonstrated that reduction in the requisite farnesylation of lamin B by exposing cells to FTI-
277 promotes caspase 3 activation and degradation of lamin B [Fig 5-4 Panel A]. Panels B and
C represent data obtained from three Western blotting experiments. Under the same treatment
conditions with low glucose in the absence and presence of FTI-277, we performed phase
partitioning assay using Triton X-114. Here we observed the appearance of the degraded
fragment of lamin B in the hydrophobic fraction of the membrane component as well as in the
cytosolic fraction [Panel D]. In addition we assessed the metabolic cell viability by measuring,

81
colorimetrically, the reduction of tetrazolium salt to formazan crystals and found a decrease
[~12.4%] in viability under these treatment conditions [Panel F]. However these effects were not
accompanied by any significant changes in cell morphology [Panel E] after 24 hrs of FTI-277
treatment.
A
Cleaved Caspase 3
β‐actin
Degraded Lamin B
Glucose, mM 2.5 2.5
FTI‐277, 10 µM ‐ +
Glucose, mM 2.5 2.5
Fo
ld C
han
ge
(Cle
aved
Cas
pas
e 3/
Act
in)
0
1
2
3
*
B
FTI‐277, 10 µM ‐ +
Fo
ld C
han
ge
(Deg
rad
ed L
amin
B/A
ctin
)
0
1
2
3
4
*
C
Glucose, mM 2.5 2.5FTI‐277, 10 µM ‐ +

82
Figure 5-4: FTI-277 treatment results in caspase 3 mediated degradation of lamin B along with alterations in its subcellular distribution and reduction in cell viability. [A] INS-1 832/13 cells were incubated in media containing low glucose [2.5 mM] in the absence and presence of FTI-277 [10 μM] for 24 hrs. Caspase 3 activation and lamin B degradation for each condition was determined by Western blotting. Equal protein loading was ensured by re-probing the membrane with anti β-actin. Data represent mean ± SEM from three independent experiments and are expressed as fold change in caspase 3 activation [Panel B] and lamin B degradation
Glucose, 2.5 mM FTI‐277, 10 µM
Degraded Lamin B
Cleaved Caspase 3
Cyto
HPL HPB HPL HPB
Mem Cyto Mem
D
LG LG + DMSO LG + FTI‐277, 10 µM
EP
erce
nt
Cel
l V
iab
ility
0
20
40
60
80
100
120
*
F
100%87.6%
Glucose, mM 2.5 2.5FTI‐277, 10 µM ‐ +

83
[Panel C]. *P < 0.05 vs. 2.5 mM glucose. [D] Lysates from INS-1 832/13 cells treated with low glucose [2.5 mM] in the absence and presence of FTI-277 [10 µM] were subjected to a single-step centrifugation to separate the supernatant cytosolic [Cyto] and the membrane-pellet [Mem] fractions followed by hydrophobic [HPB] and hydrophilic [HPL] phase partitioning with Triton X-114 detergent. Proteins obtained after cell lysis were resolved by SDS-PAGE and electro-transferred onto a nitrocellulose membrane. The membrane was probed for cleaved caspase 3 and lamin B. [E] INS-1 832/13 cells were treated with media containing low glucose [2.5 mM; LG] alone and in the presence of diluent [LG+DMSO], FTI-277 [10 μM] for 24 hrs. Changes in cell morphology were visualized by light microscopy. [F] INS-1 832/13 cells were incubated in low glucose [2.5 mM] in the absence and presence of FTI-277 [10 µM]. After 24, hrs cell viability was assessed by the MTT assay. Data are represented as mean ± SEM values expressed as percent cell viability. *P < 0.05 vs. 2.5 mM glucose. C] Studies on effects of GGTIs:
GGTI-2147, a geranylgeranyl transferase inhibitor does not exhibit an increase in the
activation of caspases and degradation of lamins
As an extension of the above studies we wanted to study the effect of blocking
geranylgeranylation on the integrity of the nuclear lamins. To this end, we exposed INS-1
832/13 cells and primary rat pancreatic islets to GGTI-2147, a specific inhibitor of the enzyme
GGTase I. A representative blot from 2 such independent studies is depicted in Figure 5-5,
wherein islets obtained from normal Sprague Dawley rats were exposed to low glucose in the
absence and presence of GGTI-2147 [10µM] for 24 hrs. Interestingly, blocking of
geranylgeranylation had minimal effect on the integrity of lamin B and only a slight increase in
the activation of caspase 3 which point out the possibility that farnesylation of lamins is essential
for the stability and functioning of these nuclear proteins.

84
Figure 5-5: GGTI-2147 has minimal effects on the integrity of nuclear lamin B and caspase 3. INS-1 832/13 cells and rat islets [isolated by collagenase digestion method] were incubated in media containing low glucose [2.5 mM] in the absence and presence of GGTI-2147 [10 μM] for 24 hrs. Western blotting was used to evaluate caspase 3 activation and lamin B degradation. The membranes were re-blotted with anti β-actin to ensure equal protein loading. Data obtained from the above studies can be summarized as follows:
Inhibition of protein prenylation [farnesylation and geranylgeranylation] with simvastatin,
induced significant alterations in mitochondrial and nuclear stability in pancreatic beta-
cells, as evidenced by activation of executioner caspase-3 and degradation of nuclear
lamin B, which were also seen in primary rodent islets.
Simvastatin mediated blocking of prenylation also resulted in the activation of p38
MAPK, a stress kinase, which we have recently implicated in islet dysfunction under
conditions of glucotoxicity and diabetes [102]. In addition, we noticed a marked
reduction in the phosphorylation of ERK1/2 in simvastatin treated INS-1 832/13 cells, an
event necessary for G-protein activation, cytoskeletal organization and insulin secretion
along with loss in cell viability.
Results obtained after testing specific inhibitors of FTase [FTI-277] and GGTase-1
[GGTI-2147] suggest that simvastatin-mediated effects on degradation of lamin B are
Degraded Lamin B
Cleaved Caspase 3
Glucose, mM 2.5 2.5
GGTI‐2147, 10 µM ‐ +
β‐actin
Degraded Lamin B
Cleaved Caspase 3
β‐actin
Glucose, mM 2.5 2.5GGTI‐2147, 10 µM ‐ +
Rat isletsINS‐1 832/13 cells

85
more likely due to inhibition of farnesylation of lamins [a key step in the processing and
intracellular localization of lamins] rather than blocking of geranylgeranylation.
86
CHAPTER 6
DISCUSSION
Hyperglycemia in T2DM is a consequence of progressive increase in insulin resistance
in the peripheral tissues [adipose, muscle] along with decreasing pancreatic beta cell function.
Several studies indicate that pancreatic islet beta cells, when subjected to glucotoxic and
lipotoxic environment or when exposed to proinflammatory cytokines [e.g., IL-1β, TNFα and
IFNγ] exhibit metabolic dysfunction as a result of oxidative and endoplasmic reticulum stress
[84, 103-105]. A number of potential mechanisms underlying chronic hyperglycemia-induced
metabolic dysfunction have been put forward, among which oxidative stress as well as
endoplasmic reticulum stress induced mitochondrial defects and subsequent downstream
effects are most common [84, 106, 107]. Despite this existing evidence, the precise effects that
the elevated glucose levels have on the nuclear component of the cell are relatively lesser
known. Therefore, one of the primary objectives of my doctoral work was to gain mechanistic
insights into the role of ER-mitochondria axis in the activation of executioner caspases and their
downstream targets; the nuclear lamins [lamin A and B], in insulin-secreting cells under the
duress of glucotoxic conditions and diabetes.
The nuclear lamins are type V intermediate filament proteins, which assemble in a
mesh-like pattern, forming the lamina layer within the inner-nuclear membrane. Studies have
shown that the ER stress-induced effects may have an impact on the integrity of other
subcellular organelles, such as the mitochondria, resulting in loss of mitochondrial membrane
permeability transition [MPT] and leakage of cytochrome C into the cytosol [108-111]. Under
these conditions, executioner caspases [caspase 3 and 6] are activated which then cause the
hydrolysis of proteins such as PARP, PKC-δ and nuclear lamins. Earlier reports from our own
laboratory have exhibited a marked augmentation in the degraded product of lamin B as a result
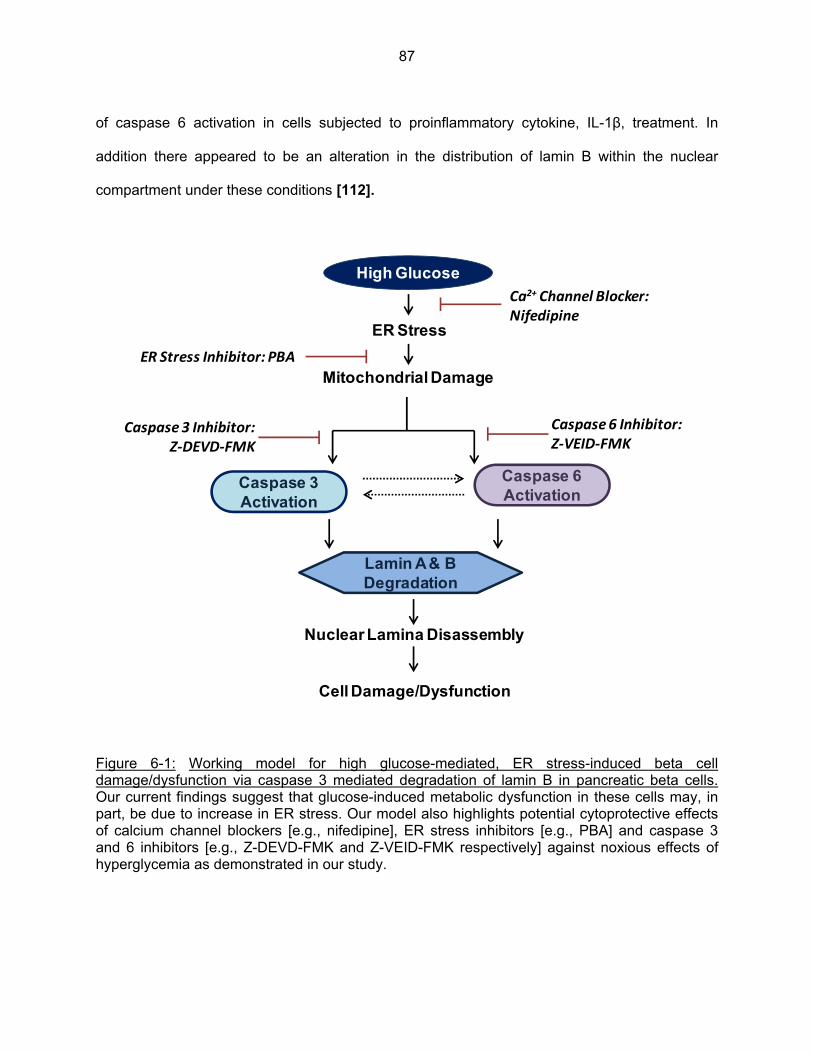
87
of caspase 6 activation in cells subjected to proinflammatory cytokine, IL-1β, treatment. In
addition there appeared to be an alteration in the distribution of lamin B within the nuclear
compartment under these conditions [112].
Figure 6-1: Working model for high glucose-mediated, ER stress-induced beta cell damage/dysfunction via caspase 3 mediated degradation of lamin B in pancreatic beta cells. Our current findings suggest that glucose-induced metabolic dysfunction in these cells may, in part, be due to increase in ER stress. Our model also highlights potential cytoprotective effects of calcium channel blockers [e.g., nifedipine], ER stress inhibitors [e.g., PBA] and caspase 3 and 6 inhibitors [e.g., Z-DEVD-FMK and Z-VEID-FMK respectively] against noxious effects of hyperglycemia as demonstrated in our study.
Caspase 6 Inhibitor: Z‐VEID‐FMK
Caspase 3 Inhibitor: Z‐DEVD‐FMK
Ca2+ Channel Blocker: Nifedipine
ER Stress Inhibitor: PBA
High Glucose
ER Stress
Mitochondrial Damage
Nuclear Lamina Disassembly
Cell Damage/Dysfunction
Caspase 3 Activation
Caspase 6 Activation
Lamin A & B Degradation

88
In this context, we explored the effects of glucotoxic conditions on the activation status of
executioner caspases and the integrity of the nuclear lamina in cells exposed to chronic
hyperglycemic conditions. Herein, we conducted experiments on insulin secreting INS-1 832/13
cells, normal rodent and human islets by incubating with high glucose concentrations [20 mM for
INS-1 832/13 and rat islets and 30 mM for human islets] for 24 hrs. Findings from our
experiments in INS-1 832/13 cells indicated that high glucose conditions lead to an increase in
the cleaved form of both caspases 3 and caspase 6, indicating the activation of these
executioner caspases, which resulted in a corresponding increase in the degraded product of
lamin A as well as lamin B. Similarly, studies by Kivinen and associates have implicated the
involvement of caspase 3 in the proteolysis of Nuclear Mitotic apparatus [NuMA] protein and the
nuclear lamins in MCF-7:WS8 human breast cancer cell line [91]. Another in vitro study
demonstrates that PC12 cells exposed to palmitic acid [PA/BSA 2:1 molar ratio] showed a
significant increase in caspase activity measured fluorimetrically which could be co-related to an
increase in PARP and lamin B cleavage as seen by Western blotting [92]. In the context of
lamin A, Mintzer et al. have demonstrated that active caspase 6 has specificity for lamin A. The
study shows that proteolytic cleavage of recombinant lamin A [GST-lamin A] increases with an
increasing concentrations of human active caspase 6. They also state that a modest increase in
GST-lamin A cleavage does occur at higher concentrations of caspase 3 [113]. In order to
validate our preliminary findings in INS-1 832/13 cells, we conducted experiments under similar
incubation conditions in primary rodent islets and islets obtained from human donors.
Interestingly, we observed an increase in the activation of caspases 3 and 6 accompanied by
the proteolytic cleavage of the nuclear lamins in the islet cells in a manner akin to our
observations in INS-1 832/13 cells. In the above experiments, our findings indicated no
significant effect of high glucose treatment on the expression of ZMPSTE24, the metallo-
89
proteolytic enzyme involved in post translational processing of lamin A, in INS-1 832/13 cells
and human islets. However, prenylation of these proteins, under conditions of glucolipotoxicity,
needs to be studied in islet cells in a systematic manner.
Having examined the effects of glucotoxicity on caspases and lamins in INS-1 832/13
cells and islets, we next tested our hypothesis in islets derived from animal models of type 2
diabetes, namely the Zucker diabetic fatty rats. ZDF rats exhibit obesity along with diabetes and
are widely used for research on type 2 diabetes [T2D]. These rats develop obesity and insulin
resistance at a young age, and then with aging, progressively develop hyperglycemia. This
hyperglycemia is associated with impaired pancreatic beta cell function and loss of pancreatic
beta cell mass. Earlier reports from our own laboratory have shown an increase in the
generation of NOX-2 induced reactive oxygen species [ROS] in the ZDF model [103]. This
study also demonstrated an increase phosphorylation of JNK 1/2, a type of mitogen activated
protein kinases [MAPK] which respond to stress stimuli and a significant decrease in the
phosphorylated form of ERK1/2, another MAPK which plays a role in the cell survival pathway.
Finding an increase in the activated caspases and cleaved lamins in islets obtained from the
ZDF rat model and type 2 diabetic humans, further affirmed our hypothesis.
Our next aim was to elucidate the effect of chronic high glucose exposure on beta cell
function. Insulin release is one of the direct measures of beta cell function and any impairment
in either phase of insulin secretion, chiefly first phase, may be the earliest evidence of an
individual’s progression towards type 2 diabetes. Numerous lines of evidence indicate that
metabolic stress due to hyperglycemic conditions leads to a decline in glucose stimulated insulin
secretion in the pancreatic beta cells. Hence, in the next set of studies, we assessed the insulin
secretion capacity of INS-1 832/13 cells under high glucose exposure. The amount of insulin
released into the culture medium under static incubation conditions was assessed by ELISA and

90
measured spectrophotometrically. Herein, we detected an increase in insulin secretion by the
beta cells on short term glucose stimulus. However, cells that were chronically exposed to high
glucose concentrations exhibited a significant impairment in insulin secretion, indicating that
chronic hyperglycemia has a detrimental effect on beta cell function and contributes to the
progression of type 2 diabetes.
Our findings also revealed considerable modifications in the subcellular distribution of
lamin B in INS-1 832/13 cells under conditions of exposure to high glucose. What then might be
the mechanisms underlying abnormal distribution of lamin B that we observed in beta cells
exposed to high glucose conditions? To address this question, we made use of pharmacological
inhibitors of the ER stress-mediated mitochondrial damage pathway in order to establish the
causal role of ER stress in the release of cytochrome c into the cytoplasm, the subsequent
activation of caspases and loss of integrity of the nuclear lamina. Thapsigargin, a known inducer
of ER stress in many cell types inhibits the sarcoplasmic/ ER calcium ATPase [SERCA] pump,
which regulates the influx of calcium ions from the cytoplasm of the cell into the ER lumen.
Induction of ER stress by thapsigargin as evidenced by the upregulation of CHOP expression
also induced activation of caspases in the islet beta cell, along with an increase in lamin B
degradation. Extant studies and data obtained in our study suggest that increased oxidative and
ER stress leading to mitochondrial dysfunction could be a result of hyperglycemic conditions. As
a consequence, executioner caspases in the cytoplasm are activated by cytochrome C released
from the dysregulated mitochondria. Moreover, the significant inhibition by PBA of CHOP
expression, caspase 3 activation and lamin B degradation, that were augmented under high
glucose exposure, further strengthens the notion of the involvement of an ER mediated pathway
in the beta cell under glucotoxic conditions. Lastly, our observations also support reports by

91
Tang et al. establishing clear roles for the oxidative stress-ER stress signaling axis in glucose-
induced beta cell dysfunction in vivo in rats [114]
Investigation of the association of intracellular calcium levels in this pathway, led to the
suggestion that accumulation of cytosolic calcium plays a contributory role in regulation of
glucose-induced effects on caspase 3 activation and lamin B degradation. Studies conducted by
Wang et al. demonstrate the participation of intracellular calcium in ER stress pathway in the
pancreatic beta cell. To this end they have uncovered the cytoprotective effects of nifedipine, a
dihydropyridine calcium channel blocker via a decrease in the phosphorylation of eukaryotic
initiation factor 2α [eIF2α], expression of CHOP and active caspase 3 [94]. Another
phenylalkylamine calcium channel blocker, verapamil, has been utilized by Xu and colleagues,
wherein they demonstrated the inhibitory effect of verapamil on increased expression of
thioredoxin-interacting protein [TXNIP], which is upregulated in diabetic conditions and
reestablished insulin secretion in vivo in 8 week old, leptin-deficient, type 2 diabetic BTBRob/ob
mice. This background and our current findings further reinforce the idea that accumulation of
calcium in the cytoplasm due to increased influx via the L-type calcium channels located on the
cell membrane would eventually lead to mitochondrial damage due to calcium overload and
further cause disruption of cellular function. Inhibitors of long lasting calcium channels [e.g.,
verapamil and nifedipine] seem to support the beta cells in defense against stress stimuli and
enhance beta cell survival and function [93, 94, and 115]. Moreover, a recent study by Zhou et
al. has demonstrated the protective effects of nifedipine-mediated inhibition of calcium channels
in pancreatic beta [MIN6] cells and mouse islets treated with palmitic acid. Further they have
also suggested the involvement of ER stress in lipotoxicity, evidenced by an increase in
phosphorylation of eukaryotic initiation factor 2α [eIF2α] and expression of CHOP which were
reversed by nifedipine [116]. Along these lines we put forward a working model that implicates

92
excessive influx and build up of cytosolic calcium as one of the causal factors leading to
hyperglycemia-induced activation of caspase 3 and 6 and proteolytic degradation of lamins A
and B.
The preferential detection of certain amino acid chain arrangements on the substrate
proteins by individual caspases has been utilized in building up specific peptide inhibitors of
these proteases. These peptide inhibitors of caspases readily permeate the cell membrane and
bind to the catalytic sites on the caspases based on preferential sequence specificity and in
doing so, impede the events downstream of caspase activation. In vitro studies by Huo et al. in
the HIT-T15 beta cell line have shown that Z-VDVAD-FMK, a specific inhibitor of caspase 2 has
a protective effect on the cells against detrimental effects of mycophenolic acid [MPA], thereby
aiding their survival [95]. Furthermore, another study which utilized human Fas cDNA for
transfection into murine βTC-1 cell lines demonstrated the involvement of caspase 3 in Fas-
mediated death signaling pathway. In addition, on using Z-Asp-Glu-Val-Asp fluoromethyl ketone
[Z-DEVD-FMK] a specific inhibitor of caspase 3, protected against Fas-induced cell death [96].
In a similar mouse model transfected with human Fas, a caspase 6 inhibitor was observed to
exert protective effects against palmitic acid-induced effects on the cells [97]. Our own data
obtained from studies using Z-DEVD-FMK and Z-VEID-FMK specific inhibitors of caspase 3 and
caspase 6 activation respectively, in INS-1 832/13 cells points out the involvement of both these
executioner caspases in the disassembly of the nuclear lamina via proteolytic cleavage and the
reversal of these effects by the peptide inhibitors [117]. We recognize potential caveats in our
studies involving the use of inhibitors of caspase 3 and caspase 6. While we were able to
demonstrate their inhibitory effects on caspase activity and lamin degradation under high
glucose conditions, thus confirming our hypothesis, we also observed that they exerted
untoward effects on beta cells under low glucose conditions. Additional studies to test the
93
possibility that the addition of the chemical or peptide inhibitors to cells under basal conditions
may trigger such a response would help in gaining further understanding of this observed
phenomenon.
Further to elucidate the role of post translational prenylation of nuclear lamins towards
cell stability and function in our studies we utilized pharmacological inhibitors of prenylation such
as, statins [simvastatin], FTIs and GGTIs. Statins belong to the cholesterol lowering class of
drugs and are one of the most widely used drugs in the treatment of cardiovascular diseases.
The first ever statins isolated from the Penicillium species were compactin and mevastatin in the
year 1976, followed by lovastatin in 1980. Subsequent studies revealed their property of
inhibition of the HMG-CoA reductase enzyme and the associated blocking of cholesterol
biosynthesis. However the most important benchmark in the discovery of statin molecules was
in the year 1987; when Simvastatin, a semi-synthetic compound derived using the lovastatin
parent structure was approved for use in humans. In the following years several purely
synthetic statin moieties were derived, namely; fluvastatin, atorvastatin, cerivastatin, with
rosuvastatin and pitavastatin being the most recently developed in 2003 and 2009 respectively
[118-121]. In 2001, cerivastatin was withdrawn from the market due to renal malfunction
associated deaths that were reported in the post marketing surveys [122]. The basic
mechanism of action is by inhibition of HMG-coA reductase in the cholesterol biosynthesis
pathway [123]. The inhibition of the reductase enzyme blocks the production of mevalonic acid
MVA which is a precursor to cholesterol. The primary effects of statins are inhibition of
cholesterol synthesis and increasing LDL uptake [124, 125]. However, based on recent
evidence from a number of studies, trials and meta analysis, the U.S. Food and Drug
Administration [FDA] has approved important safety label changes for statins that indicate the
association of statins with an increase in hemoglobin A1C and fasting glucose levels. Despite

94
these reports, the underlying molecular mechanisms of these effects of statins need to be
further explored in the context of pancreatic beta cells and type 2 Diabetes. In addition to
blocking cholesterol synthesis, statins also prevent the formation of intermediate metabolites of
this pathway, namely: farnesyl pyrophosphate [FPP] and geranylgeranyl pyrophosphate [GGPP]
that are involved in post translational prenylation of several proteins [Rho, Rab, Ras, lamins],
thereby preventing post translational prenylation of these proteins. In this context, a variety of
pharmacological inhibitors that interfere with the activities of the enzymes farnesyl transferase
[FTase] and geranylgeranyltransferase [GGTase] have been developed. Figure 6-2 depicts the
structures of a few inhibitors of prenylation, namely; simvastatin, farnesyl transferase inhibitor
[FTI-277] and geranylgeranyltransferase inhibitor [GGTI-2147].
Figure 6-2: Chemical structures of inhibitors of protein prenylation
A recent study carried out by Ishikawa and associates reported that different statin
molecules have differential effects on the insulin release by the beta cell. In this study they
SIMVASTATIN
FTI‐277 GGTI‐2147
95
utilized MIN6 cells to study beta cell function by measuring glucose stimulated insulin secretion
in the cells post treatment with various statin drugs and demonstrated that decreasing
hydrophobicity of the molecules enhances their capacity to impair insulin secretion in the cells.
Therefore, the more lipophilic statins such as lovastain and simvastatin demonstrated a more
pronounced effect [126]. Based on their studies with lovastatin in MIN6 beta cells, Tsuchiya et
al. propose that statin-mediated inhibition of cholesterol biosynthesis pathway and thereby
depletion of the intermediate metabolites such as mevalonate, squalene and geranylgeranyl
pyrophosphate is a contributory factor towards the reduction in insulin content of the cell, as well
as its capacity to efficiently secrete insulin [127]. Early studies by Metz et al. demonstrated that
inhibition of PTM of GTP binding proteins brought about a decrease in the insulin secretion in
intact rat islets. In this study, they also showed that lovastatin treatment of the islets caused a
hindrance in their association with the membrane and markedly diminished glucose stimulated
insulin secretion, which could be precluded by supplementing the culture media with mevalonic
acid [128]. Several lines of evidence in other cell types implicates that inhibition of requisite
post-translational modifications of lamins [A and B], including farnesylation and
geranylgeranylation results in alterations in cell metabolism and can have detrimental effects on
the cell. For example, using TAD-2 thyroid cell line Matola and associates reported that
lovastatin, an inhibitor of protein farnesylation and geranylgeranylation, induces cell death by
inducing mitochondrial dysfunction, cytochrome C release, caspase 3 activation and lamin B
degradation [129]. Likewise, more recent studies by Chang et al. have demonstrated
abnormalities in lamin A processing following inhibition of its farnesylation using FTIs and also
GGTIs. They reported significant accumulation of unprocessed lamin A intracellularly [130].
In order to study the regulatory role of farnesylation in lamins, several studies utilizing
farnesyltransferase inhibitors have been conducted. In one such study Adam et al. reported an
96
increase in unprocessed lamin B2 and lamin A and a decrease in mature lamin B1 in human
fibroblasts treated with FTIs [131]. Hutchinson-Gilford Progeria Syndrome [HGPS] is a rare
premature aging disorder caused by point mutation G608G [GGC>GGT] within exon 11 of
LMNA gene encoding A-type nuclear lamins. This mutation results in the expression of a
truncated protein, progerin, deficient in 50 amino acids in the carboxyl-terminus of prelamin A,
which still retains a farnesylated cysteine at its carboxyl terminus, a modification involved in
HGPS pathogenesis. Previous studies in cellular and animal models of HGPS have
demonstrated that FTI treatment improves abnormal nuclear morphology and phenotype [132].
Mallampalli et al. also demonstrated that FTI [rac-R115777] significantly improved abnormal
nuclear morphology in HeLa cells [133] and also FTI-276 improved nuclear shape abnormalities
in keratinocytes of transgenic mice expressing progerin in epidermis or a combination therapy of
pravastatin and zoledronate by immunofluorescence microscopy [134]. In HGPS mouse model
dose-dependent administration of the FTI tipifarnib [R115777, Zarnestra] significantly prevented
loss of vascular smooth muscle cells in the large arteries and also delayed progression of
cardiovascular disease [135]. In another study along these lines, R115777 a potent, orally
active FTI, was recently investigated in a phase I dose-ranging study in patients with acute
leukemias. R115777 dose dependently inhibited farnesylation of lamin A and HDJ-2 [136]
suggesting further evaluation of this compound in clinical studies. In a recent clinical trial study
in children prone to HGPS, 25 patients were subjected to a 2 year treatment with lonafarnib
[FTI]. All subjects improved in one or more of the following: gaining additional weight, better
hearing, improved bone structure and/or, most importantly increased flexibility of blood vessels.
This study presented preliminary evidence that lonafarnib may improve the detrimental
phenotypical changes associated with this disorder [137].
97
Interestingly, significant effects on mitochondrial and nuclear stability indicated by
increased activation of caspase 3 and degradation of lamin B were observed in our studies with
simvastatin, which demonstrate the consequences of inhibition of post-translational prenylation
in INS-1 832/13 cells as well as rat islets. In addition, we observed clear alterations in cell
morphology [rounding], and a marked decrease in cell survival and GSIS. Moreover, a
significant increase in the activation of p38 MAP Kinase, which has been implicated in
hyperglycemia associated beta cell dysfunction, was observed along with a marked decrease in
the phosphorylation of ERK 1/2 which plays a crucial role in cell survival and function. The
effects of this lipophilic statin on caspase 3 and lamin B were mimicked by a specific inhibitor of
farnesyl transferase, FTI-277. However GGTI-2147, which specifically inhibits
geranylgeranyltransferase-I, could not produce the same effects as seen in INS-1 cells and rat
islets. These observations point out the possibility that the caspase 3 activation and lamin B
degradation effects are farnesylation dependent. However, whether this is a result of depletion
of the substrate farnesyl pyrophosphate [FPP] or if it is due the inhibition of the enzyme FTase
or a combination of the two needs to be further investigated. In this context, recent reports from
our laboratory in insulin secreting cells have shown that the degradation of the regulatory
subunit of FTase was caspase 3 mediated [93]. Also, evidence in other cell types indicated a
caspase 3 dependent mechanism involved in the degradation of the common α subunit of
FTase and GGTase [138].
In an attempt to identify the patho-mechanism of inhibition of prenylation using statins or
farnesylation inhibitors Pelaia et al. have demonstrated in 2 lung cancer cell lines, namely
CALU-1 [squamous cell line] and GLC-82 [adenocarcinoma cell line] that inhibition of
prenylation with these agents caused a decrease in the phosphorylation of ERK 1/2 and showed
detrimental effects on cell morphology, thereby implicating the Ras/Raf/MEK/ERK pathway

98
[139]. This observation was confirmed in glioma cell lines by Afshordel and associates wherein
they inhibited prenylation with lovastatin and perillyl alcohol [140]. Bonifacio and colleagues
have identified the AKT/mTOR pathway as a target for statin mediated detrimental effects in
myotubes. 24 hr incubations of C2C12 myotubes with 10 – 50 µM concentrations of simvastatin
and atorvastatin caused a decrease in AKT phosphorylation thereby inhibiting its activation. In
addition they observed a parallel increase in the activation of caspases and the downstream
cleavage of PARP. Comparable effects observed in mice skeletal muscles indicate that probing
further into statin-mediated effects on the AKT/mTOR pathway would provide important leads in
the identification of prospective therapeutic targets [141]. Collectively, these observations point
out the significance of post translational modifications, specifically farnesylation in maintaining
the function and integrity of the nuclear lamins.

99
CHAPTER 7
CONCLUSION AND FUTURE DIRECTIONS
The overall goal of my Ph.D. project is to understand the cellular mechanisms involved
in the pathology of islet beta cell dysfunction under conditions of chronic exposure to high
glucose [glucotoxicity]. Salient features of my research work are:
Exposure of insulin-secreting pure beta cells [INS-1 832/13 cells], normal rodent islets
and human islets to glucotoxic conditions results in the activation of executioner
caspases 3 and 6, and subsequent degradation of their downstream target proteins,
such as nuclear lamins A and B. I also observed a significant inhibition of glucose-
stimulated insulin secretion under these conditions.
Glucotoxic conditions promoted significant alterations in the subcellular distribution of
nuclear lamins [e.g., increased abundance in cytosol] suggesting the collapse of nuclear
compartment under these conditions.
Specific inhibitors of caspase 3 and caspase 6 attenuated high glucose-induced caspase
activation and lamin degradation.
Similar increases in the activation of executioner caspases and degradation of nuclear
lamins A and B were seen in islets derived from the ZDF rat, a model for T2DM and
islets from T2DM human donors.
In a manner akin to thapsigargin, a known inducer of ER stress, glucotoxic conditions
also significantly increased ER stress as evidenced by increased expression of CHOP, a
marker for ER stress. Moreover, exposure of beta cells to thapsigargin resulted in the

100
activation of executioner caspases and lamin degradation, thus suggesting that caspase
activation and lamin degradation seen under the duress of high glucose may, in part, be
due to increased ER stress. This is further confirmed by my observations that PBA, a
known inhibitor of ER stress, markedly attenuated CHOP expression, caspase activation
and lamin degradation in beta cells exposed to glucotoxic conditions.
Nifedipine, a known inhibitor of membrane-associated L-type calcium channels, also
inhibited high glucose-induced caspase activation and lamin degradation; these findings
suggest that increased levels of intracellular calcium in beta cells exposed to glucotoxic
conditions could contribute to the mitochondrial [caspase activation] and nuclear [lamin
degradation] defects.
Inhibition of protein [lamin] prenylation with simvastatin, a known inhibitor of
farnesylation and geranylgeranylation, promoted mitochondrial and nuclear defects as
evidenced by caspase activation and lamin degradation in INS-1 832/13 cells and
normal rodent islets. More site-specific inhibitors of protein farnesylation [FTI-277] also
caused caspase activation and lamin degradation suggesting potential involvement of a
farnesylated protein in the induction of mitochondrial defects. It is also likely that
inhibition of farnesylation of lamins by FTI-277 and simvastatin make lamins more
vulnerable for degradation and nuclear collapse. My findings also suggested that
inhibition of protein prenylation leads to increase in stress kinase [p38 kinase] and
inhibition of ERK1/2, known for its cell survival roles. Collectively, these alterations in cell
signaling pathways could promote intracellular stress and demise.
Based on the above findings, I conclude that chronic exposure of beta cells to
hyperglycemic conditions leads to increased intracellular calcium levels [calcium overload] and

101
ER stress leading to loss in mitochondrial dysregulation, including loss in mitochondrial
permeability pore transition, leakage of cytochrome C into cytosol and activation of executioner
caspases. These events, in turn, lead to degradation of key cellular proteins, such as nuclear
lamins, resulting in the collapse of nuclear compartment and accumulation of lamin degradation
products in cytosolic compartment. Collectively, alterations in these cellular events lead to a loss
in functional beta cell mass and onset of diabetes. I believe that my studies not only provided
mechanistic insights into mitochondrial and nuclear dysfunction in beta cells under the duress of
glucotoxic conditions, but they also provided fresh insights into potential beneficial
[cytoprotective] effects of calcium channel blockers in the treatment of T2DM in humans.
Future directions:
While my research work provided novel insights into islet dysfunction in diabetes, I
believe that there are several knowledge gaps that need to be filled. Some of those are listed
below.
First, we need to quantify the intracellular calcium levels in the beta cell following
exposure to glucotoxic conditions. Data from calcium channel blockers are encouraging, but it is
important to quantify the levels of calcium in cells treated without or with glucose and calcium
channel blockers and correlate those with cellular indices of apoptosis. Further, we need to
verify these in vitro findings in animal models of T2DM to see if administration of calcium
channel blockers prevents/halts islet dysfunction and diabetes in these model systems.
Second, we need to investigate metabolic alterations in beta cells exposed to saturated
fatty acids, such as palmitate [lipotoxic conditions] and, ideally, glucolipotoxic conditions. These
102
studies would provide additional insights into combined effects of glucose and lipids in inducing
mitochondrial and nuclear defects.
Third, additional studies are needed to further asses the roles of post-translational
farnesylation of lamins in maintaining the integrity of the nuclear envelop. This can be
addressed first by in vitro approaches involving use of inhibitors of protein prenylation and
siRNA-mediated knockdown of prenyltransferases. My studies have identified the lamin
processing enzyme in the islet, and therefore, it is likely that lamins might undergo additional
PTMs [carboxylmethylation] that might be requisite for maintaining the integrity of nuclear
envelop. Very little is known with regard to alterations in these modification signaling events in
the diabetic islet.
Lastly, LMNA mutations have been shown in human subjects with severe metabolic
syndrome. More needs to be understood with regard to potential alterations in post-translational
prenylation and phosphorylation of lamins as cause for pathology of metabolic disorders
including obesity and T2DM.

103
APPENDIX A
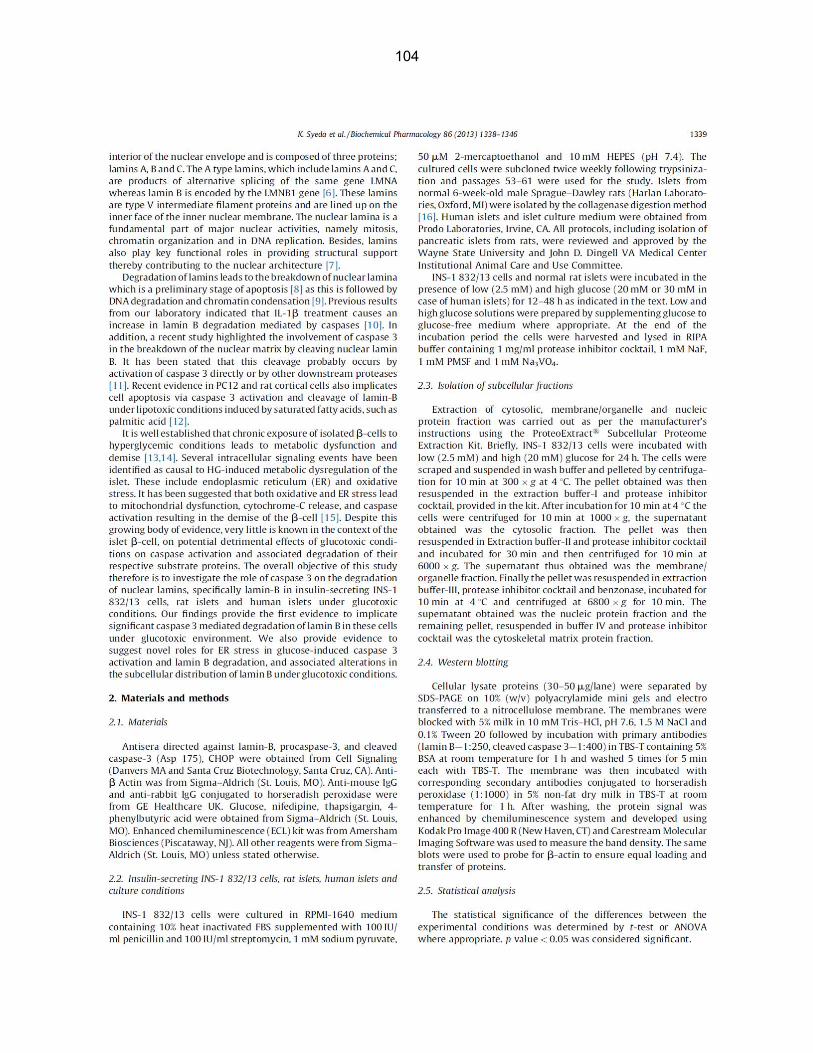
104

105

106
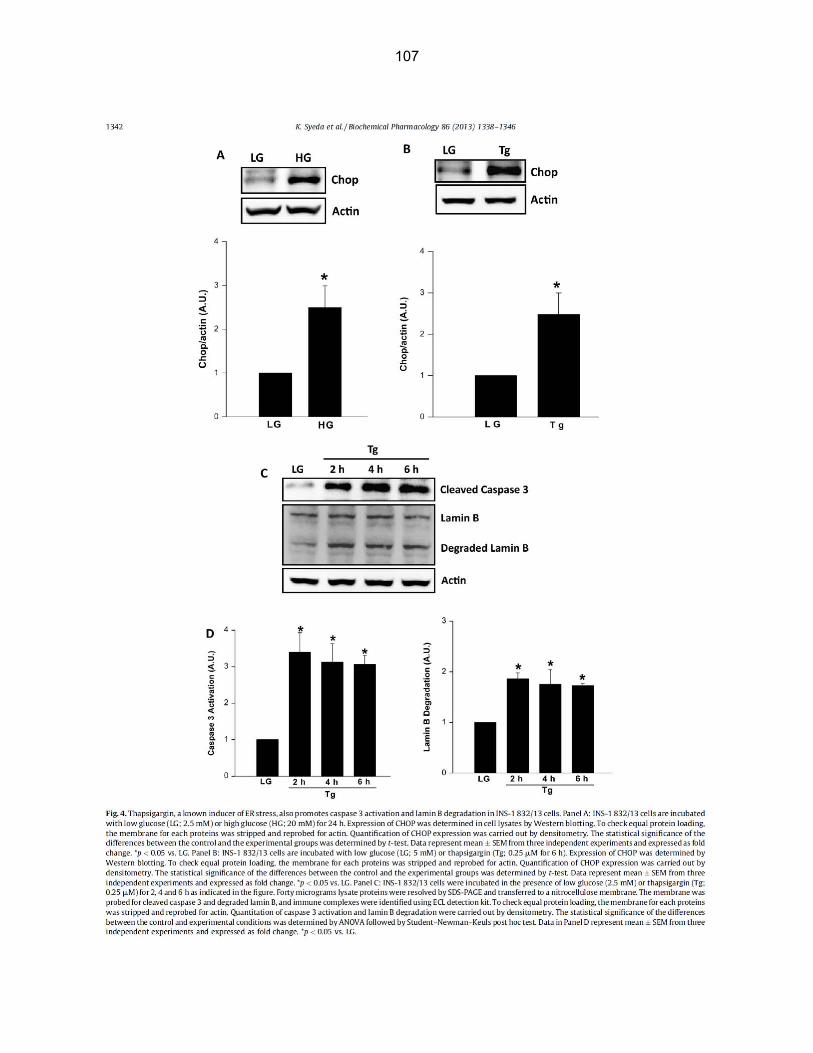
107

108

109

110

111

112
APPENDIX B
113

114

115
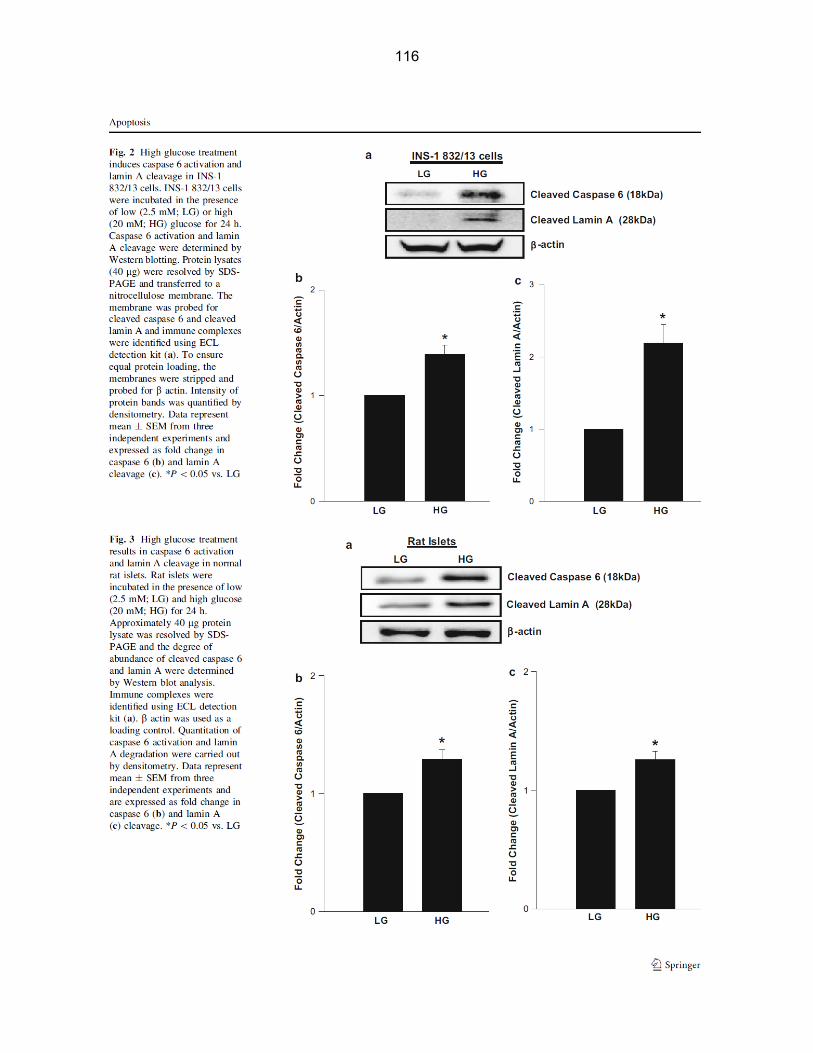
116
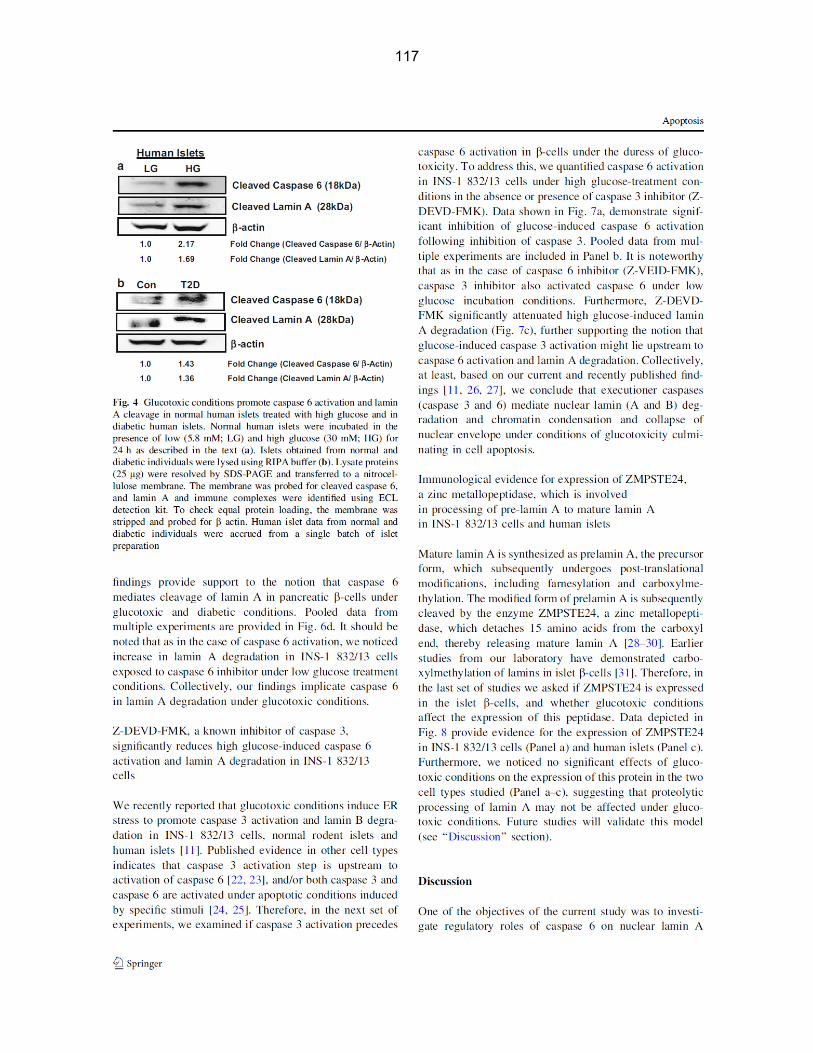
117
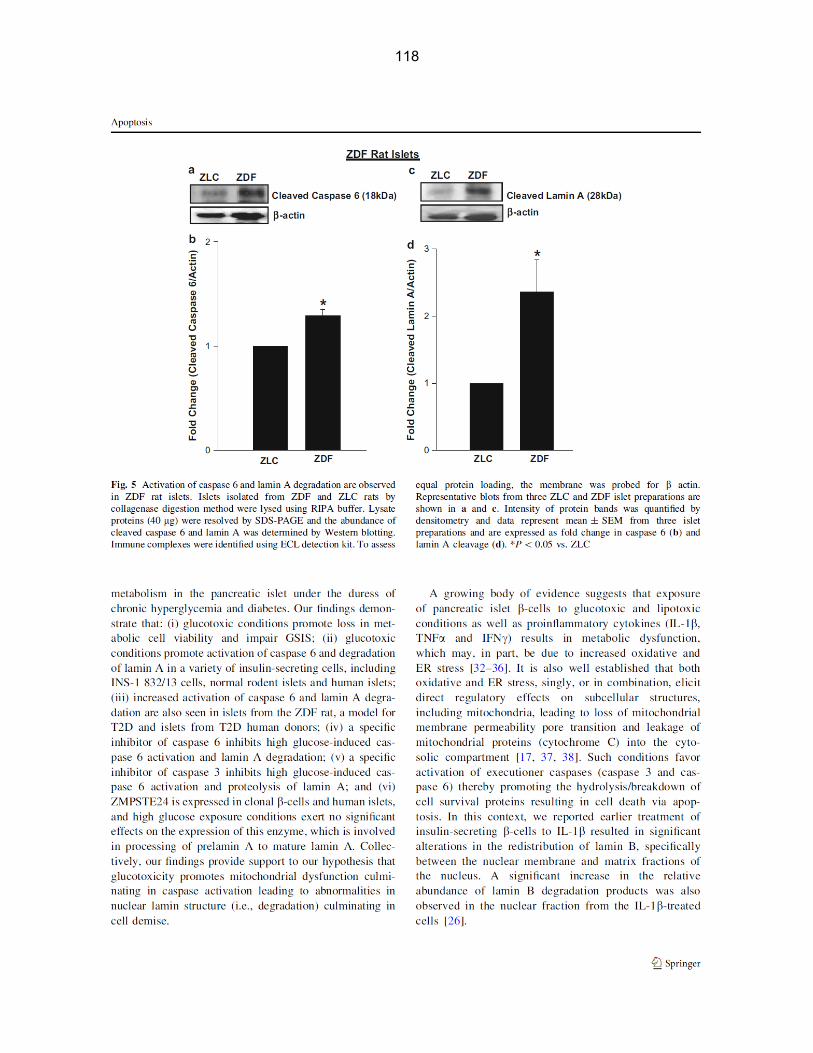
118
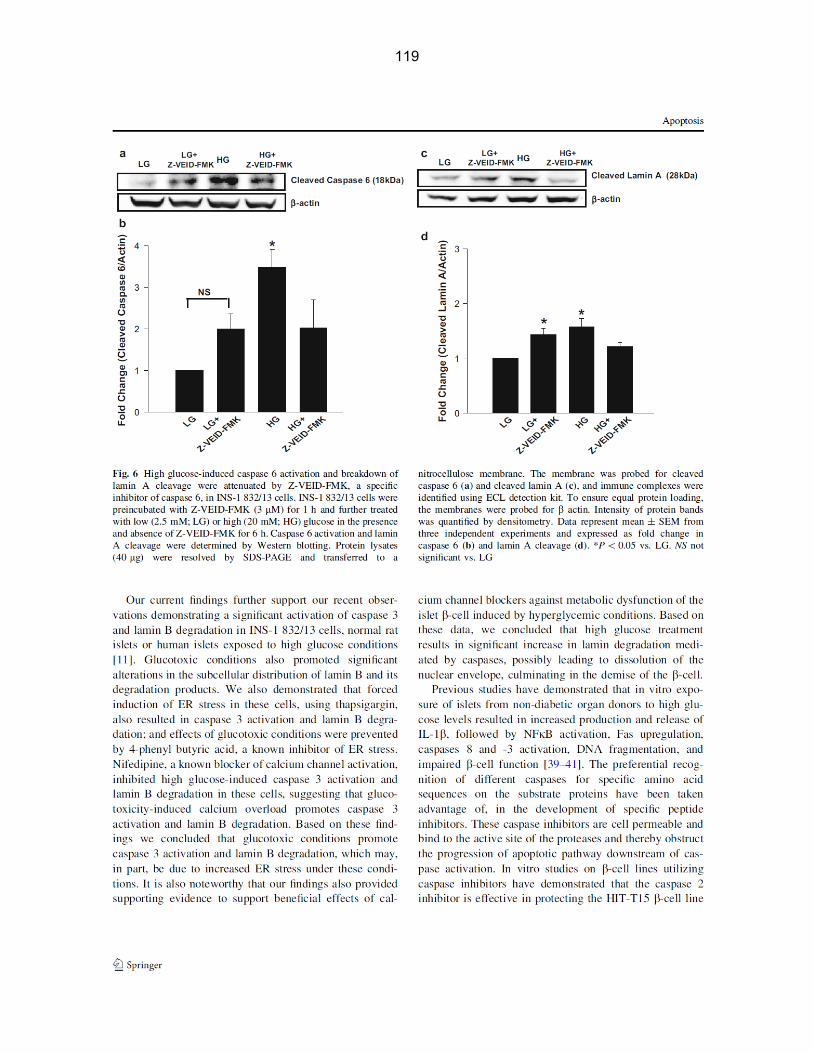
119
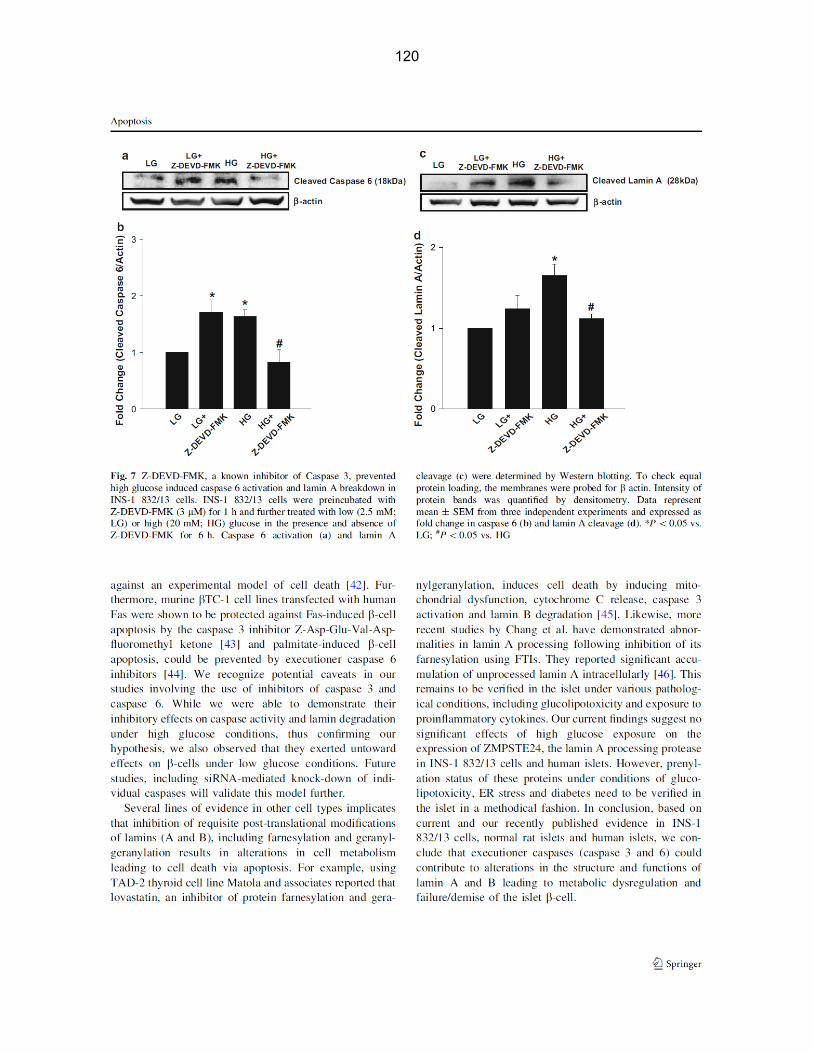
120
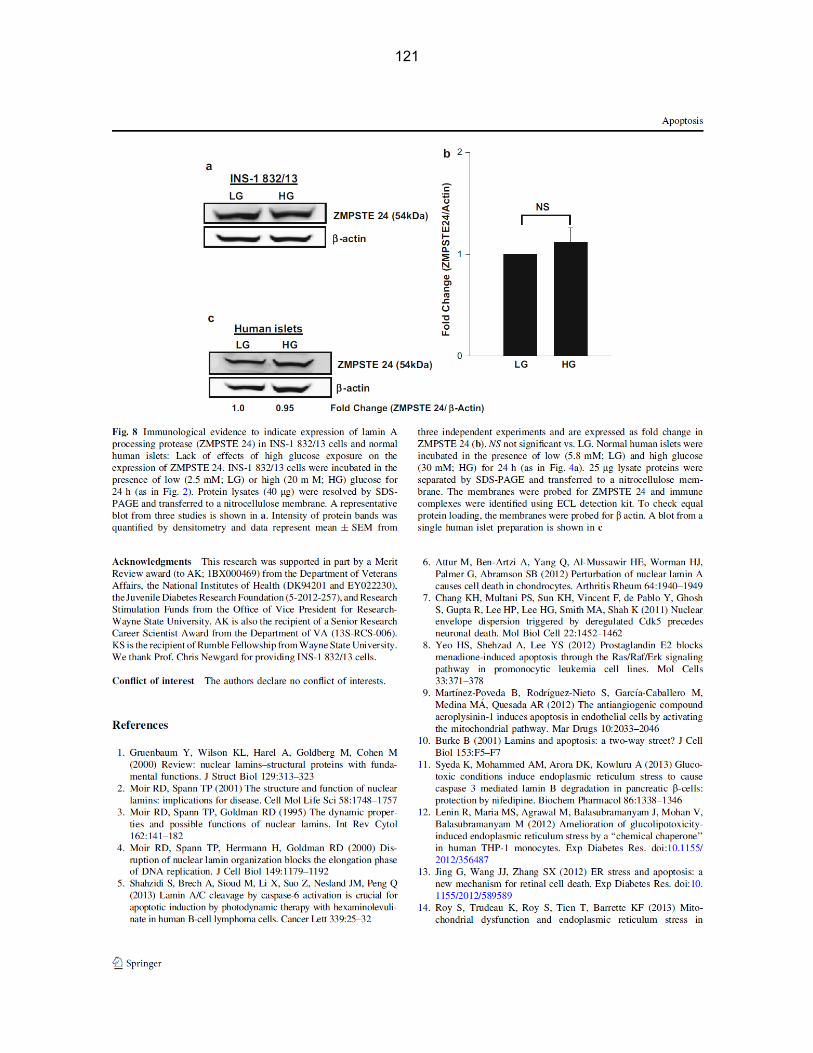
121

122
123
REFERENCES
1. Lin Y, Sun Z. Current views on type 2 diabetes. J Endocrinol. 2010;204(1):1-11.
2. Kulkarni RN. The islet beta-cell. The Interrnational Journal of Biochemistry and Cell
Biology. 2004;36(3):365-71.
3. Brissova M, Fowler MJ, Nicholson WE, Chu A, Hirshberg B, Harlan DM, Powers AC.
Assessment of human pancreatic islet architecture and composition by laser scanning
confocal microscopy. Journal of Histochemistry and Cytochemistry. 2005; 53(9):1087-
97.
4. Zhuo Fu, Elizabeth R. Gilbert, and Dongmin Liu. Regulation of Insulin Synthesis and
Secretion and Pancreatic Beta-Cell Dysfunction in Diabetes. Curr Diabetes Rev. 2013;
9(1): 25–53.
5. Layden, B. T., Durai, V. and Lowe, Jr., W. L. G-Protein-Coupled Receptors, Pancreatic
Islets, and Diabetes. Nature Education. 2010; 3(9):13.
6. Seino S, Shibasaki T, Minami K. Dynamics of insulin secretion and the clinical
implications for obesity and diabetes. The Journal of Clinical Investigation.
2011;121(6):2118-2125.
7. Ferrannini E, Mari A. β-Cell function in type 2 diabetes. Metabolism. 2014;63(10):1217-
27.
8. Cersosimo E, Solis-Herrera C, Trautmann ME, Malloy J, Triplitt CL. Assessment of
pancreatic β-cell function: review of methods and clinical applications. Curr Diabetes
Rev. 2014;10(1):2-42.
9. Wang YW, Sun GD, Sun J, Liu SJ, Wang J, Xu XH, Miao LN.
Spontaneous type 2 diabetic rodent models. J Diabetes Res. 2013;2013:401723.
124
10. Srinivasan K, Ramarao P. Animal models in type 2 diabetes research: an overview.
Indian J Med Res. 2007;125(3):451-72.
11. King AJ. The use of animal models in diabetes research. Br J
Pharmacol. 2012;166(3):877-94.
12. Burke B, Stewart CL. Life at the edge: the nuclear envelope and human disease. Nat.
Rev. Mol. Cell. Biol 2002; 3: 575–85
13. Polychronidou M1, Grobhans J. Determining nuclear shape: the role of
farnesylated nuclear membrane proteins. Nucleus 2011; 2(1): 17-23.
14. Harr JC, Luperchio TR, Wong X, Cohen E, Wheelan SJ, Reddy KL. Directed targeting
of chromatin to the nuclear lamina is mediated by chromatin state and A-type lamins. J
Cell Biol 2015; 208(1): 33-52.
15. Butin-Israeli V, Adam SA, Jain N, Otte GL, Neems D, Wiesmüller L, et al.. Role
of lamin b1 in chromatin instability. Mol Cell Biol 2015; 35(5): 884-98.
16. Butin-Israeli V, Adam SA, Goldman RD. Regulation of nucleotide excision repair
by nuclear lamin b1. PLoS One 2013; 8(7): e69169.
17. Ho CY, Lammerding J. Lamins at a glance. J Cell Sci 2012; 125(Pt 9): 2087-93.
18. Furukawa K, Hotta Y. cDNA cloning of a germ cell specific lamin B3 from mouse
spermatocytes and analysis of its function by ectopic expression in somatic cells. EMBO
J 1993; 12(1): 97-106.
19. Stuurman N, Heins S, Aebi U. Nuclear lamins: their structure, assembly, and
interactions. J Struct Biol 1998; 122(1-2): 42-66.
20. Dechat T, Adam SA, Taimen P, Shimi T, Goldman RD. Nuclear lamins. Cold Spring
Harb Perspect Biol 2010; 2(11): a000547.
125
21. Burke B, Stewart CL. The nuclear lamins: flexibility in function. Nat Rev Mol Cell
Biol 2013; 14(1): 13-24.
22. Aebi U, Cohn J, Buhle L, Gerace L. The nuclear lamina is a meshwork of intermediate-
type filaments. Nature 1986; 323(6088): 560-4.
23. Goldman AE, Maul G, Steinert PM, Yang HY, Goldman RD. Keratin-like proteins that
coisolate with intermediate filaments of BHK-21 cells are nuclear lamins. Proc Natl Acad
Sci U S A 1986; 83(11): 3839-43.
24. Gerace L, Burke B. Functional organization of the nuclear envelope. Annu Rev Cell Biol
1988; 4: 335-74.
25. Lammerding J, Fong LG, Ji JY, Reue K, Stewart CL, Young SG, Lee RT. Lamins A and
C but not lamin B1 regulate nuclear mechanics. J Biol Chem. 2006;281(35):25768-80.
26. Panorchan P, Schafer BW, Wirtz D, Tseng Y. Nuclear
envelope breakdown requires overcoming the mechanical integrity of the nuclear lamina.
J Biol Chem 2004; 279(42): 43462-7.
27. Taniura H, Glass C, Gerace L. A chromatin binding site in
the tail domain of nuclear lamins that interacts with core histones. J Cell Biol 1995;
131(1): 33-44.
28. Sullivan T, Escalante-Alcalde D, Bhatt H, Anver M, Bhat N, Nagashima K, et al.. Loss of
A-type lamin expression compromises nuclear envelope integrity leading to muscular
dystrophy. J Cell Biol 1999; 147(5): 913-20.
29. Nikolova V, Leimena C, McMahon AC, Tan JC, Chandar S, Jogia D, et al.. Defects in
nuclear structure and function promote dilated cardiomyopathy in lamin A/C-deficient
mice. Clin Invest 2004; 113(3): 357-69.
126
30. Goldman RD, Shumaker DK, Erdos MR, Eriksson M, Goldman AE, Gordon LB, et al..
Accumulation of mutant lamin A causes progressive changes in nuclear architecture in
Hutchinson-Gilford progeria syndrome. Proc Natl Acad Sci U S A 2004; 101(24): 8963-8.
31. Moir RD, Montag-Lowy M, Goldman RD. Dynamic properties of nuclear lamins: lamin B
is associated with sites of DNA replication.J Cell Biol 1994; 125(6): 1201-12.
32. Forbes DJ, Kirschner MW, Newport JW. Spontaneous formation of nucleus-like
structures around bacteriophage DNA microinjected into Xenopus eggs. Cell 1983;
34(1): 13-23.
33. Meier J, Campbell KH, Ford CC, Stick R, Hutchison CJ. The role of lamin LIII in nuclear
assembly and DNA replication, in cell-free extracts of Xenopus eggs. J Cell Sci 1991; 98
( Pt 3): 271-9.
34. Ellis DJ, Jenkins H, Whitfield WG, Hutchison CJ. GST-lamin fusion proteins act as
dominant negative mutants in Xenopus egg extract and reveal the function of the lamina
in DNA replication. J Cell Sci 1997; 110 ( Pt 20): 2507-18.
35. Spann TP, Goldman AE, Wang C, Huang S, Goldman RD. Alteration of nuclear lamin
organization inhibits RNA polymerase II-dependent transcription. J Cell Biol 2002;
156(4):603-8.
36. Kowluru A. Protein prenylation in glucose-induced insulin secretion from the pancreatic
islet beta cell: a perspective. J Cell Mol Med 2008; 12(1): 164-73.
37. Amaya M, Baranova A, van Hoek ML. Protein prenylation: a new mode of host-pathogen
interaction. Biochem Biophys Res Commun 2011; 416(1-2): 1-6.
38. Manolaridis I, Kulkarni K, Dodd RB, Ogasawara S, Zhang Z, Bineva G, et al..
Mechanism of farnesylated CAAX protein processing by
the intramembrane protease Rce1. Nature 2013; 504(7479): 301-5.

127
39. Barrowman J, Hamblet C, Kane MS, Michaelis S. Requirements for efficient proteolytic
cleavage of prelamin A by ZMPSTE24. PLoS One. 2012;7(2):e32120.
40. Reddy S, Comai L. Lamin A, farnesylation and aging. Exp Cell Res 2012; 318(1): 1-7.
41. Jung HJ, Nobumori C, Goulbourne CN, Tu Y, Lee JM, Tatar A, et al.. Farnesylation
of lamin B1 is important for retention of nuclear chromatin during neuronal migration.
Proc Natl Acad Sci U S A 2013; 110(21): E1923-32.
42. Corrigan DP, Kuszczak D, Rusinol AE, Thewke DP, Hrycyna CA, Michaelis S, et al..
Prelamin A endoproteolytic processing in vitro by recombinant Zmpste24. Biochem
J 2005; 387(Pt 1): 129-38.
43. Boyartchuk V.L, Ashby MN, Rine J. Modulation of Ras and a-factor function by carboxyl-
terminal proteolysis. Science 1997; 275(5307): 1796-800.
44. Young SG, Fong LG, Michaelis S. Prelamin A, Zmpste24, misshapen cell nuclei, and
progeria--new evidence suggesting that protein farnesylation could be important for
disease pathogenesis. J Lipid Res 2005; 46(12): 2531-58.
45. Kowluru A. Evidence for the carboxyl methylation of nuclear lamin-B in the pancreatic
beta cell. Biochem Biophys Res Commun 2000; 268(2): 249-54.
46. Maske CP, Hollinshead MS, Higbee NC, Bergo MO, Young SG, Vaux DJ. A carboxyl-
terminal interaction of lamin B1 is dependent on
the CAAX endoprotease Rce1 andcarboxymethylation. J Cell Biol 2003; 162(7): 1223-
32.
47. Jayaram B, Syed I, Singh A, Subasinghe W, Kyathanahalli CN, Kowluru A.
Isoprenylcysteine carboxyl methyltransferase facilitates glucose-induced Rac1
activation, ROS generation and insulin secretion in INS 832/13 β-cells.
Islets. 2011;3(2):48-57.

128
48. Moir RD, Yoon M, Khuon S, Goldman RD. Nuclear lamins A
and B1: different pathways of assembly during nuclear envelope formation in living cells.
J Cell Biol. 2000;151(6):1155-68.
49. Dechat T, Pfleghaar K, Sengupta K, Shimi T, Shumaker DK, Solimando L, Goldman RD.
Nuclear lamins: major factors in the structural organization and function of
the nucleus and chromatin. Genes Dev. 2008;22(7):832-53.
50. Davidson PM, Lammerding J. Broken nuclei--lamins, nuclear mechanics, and disease.
Trends Cell Biol. 2014;24(4):247-56.
51. THE CELL, Third Edition, Fig. 8.4 ASM Press and Sinauer Associates, 2003
52. Gerace L, Huber MD. Nuclear lamina at the crossroads of the cytoplasm and nucleus. J
Struct Biol. 2012;177(1):24-31.
53. Broers JL, Ramaekers FC. Dynamics of nuclear lamina assembly and disassembly.
Symp Soc Exp Biol. 2004;(56):177-92.
54. Margalit A, Vlcek S, Gruenbaum Y, Foisner R. Breaking and making of the nuclear
envelope. J Cell Biochem. 2005;95(3):454-65.
55. Moir RD, Goldman RD. Lamin dynamics. Curr Opin Cell Biol. 1993;5(3):408-11.
56. Cohen S, Marr AK, Garcin P, Panté N. Nuclear envelope disruption involving host
caspases plays a role in the parvovirus replication cycle. J Virol. 2011;85(10):4863-74.
57. Reyland ME. Protein kinase Cdelta and apoptosis. Biochem Soc Trans. 2007;35(Pt
5):1001-4.
58. Zhao M, Xia L, Chen GQ. Protein kinase cδ in apoptosis: a brief overview. Arch Immunol
Ther Exp (Warsz). 2012;60(5):361-72.
59. Cross T, Griffiths G, Deacon E, Sallis R, Gough M, Watters D, Lord JM. PKC-delta is an
apoptotic lamin kinase. Oncogene. 2000;19(19):2331-7.

129
60. Eitel K, Staiger H, Rieger J, Mischak H, Brandhorst H, Brendel MD, Bretzel RG, Häring
HU, Kellerer M. Protein kinase C delta activation and translocation to the nucleus are
required for fatty acid-induced apoptosis of insulin-secreting cells.
Diabetes. 2003;52(4):991-7.
61. Goldman RD, Goldman AE, Shumaker DK.
Nuclear lamins: building blocks of nuclear structure and function. Novartis Found
Symp. 2005;264:3-16.
62. Rao L, Perez D, White E. Lamin proteolysis facilitates nuclear events during apoptosis. J
Cell Biol. 1996 Dec;135(6 Pt 1):1441-55.
63. Worman HJ, Ostlund C, Wang Y. Diseases of the nuclear envelope. Cold Spring Harb
Perspect Biol. 2010 Feb;2(2):a000760.
64. Emery-Dreifuss muscular dystrophy. Available at: http://ghr.nlm.nih.gov/condition/emery-
dreifuss-muscular-dystrophy (Accessed on February 11, 2015).
65. Bonne G, Di Barletta MR, Varnous S, Bécane HM, Hammouda EH, Merlini L, et al..
Mutations in the gene encoding lamin A/C cause autosomal dominant Emery-Dreifuss
muscular dystrophy. Nat Genet 1999; 21(3): 285-8.
66. Puckelwartz M, McNally EM. Emery-Dreifuss muscular dystrophy. Handb Clin
Neurol 2011; 101: 155-66.
67. Khanna P, Opitz JM, Gilbert-Barness E. Restrictive dermopathy: report and review. Fetal
Pediatr Pathol 2008; 27(2): 105-18.
68. Morais P, Magina S, Ribeiro Mdo C, Rodrigues M, Lopes JM, Thanh Hle T, et al..
Restrictive dermopathy--a lethal congenital laminopathy. Case report and review of the
literature. Eur J Pediatr 2009; 68(8): 1007-12.

130
69. Thill M, Nguyen TD, Wehnert M, Fischer D, Hausser I, Braun S, et al.
Restrictive dermopathy: a rare laminopathy. Arch Gynecol Obstet 2008; 278(3): 201-8.
70. Hutchinson-Gilford Progeria Syndrome. Available at:
http://ghr.nlm.nih.gov/condition/hutchinson-gilford-progeria-syndrome (Accessed on
February 27, 2015).
71. Gonzalez JM, Pla D, Perez-Sala D, Andres V. A-type lamins and Hutchinson-Gilford
progeria syndrome: pathogenesis and therapy. Front Biosci (Schol Ed) 2011; 3: 1133-
46.
72. Hegele RA. Familial partial lipodystrophy: a monogenic form of the insulin resistance
syndrome. Mol Genet Metab 2000; 71(4): 539-44.
73. LIPODYSTROPHY, FAMILIAL PARTIAL, TYPE 2; FPLD2. Available at:
http://www.omim.org/entry/151660 (Accessed on February 27, 2015).
74. Hegele RA. Insulin resistance in human partial lipodystrophy. Curr Atheroscler
Rep. 2000; 2(5): 397-404.
75. Lin ST, Ptácek LJ, Fu YH. Adult-onset autosomal dominant leukodystrophy: linking
nuclear envelope to myelin. J Neurosci. 2011;31(4):1163-6.
76. Bombelli F, Stojkovic T, Dubourg O, Echaniz-Laguna A, Tardieu S, Larcher K, Amati-
Bonneau P, Latour P, Vignal O, Cazeneuve C, Brice A,Leguern E. Charcot-Marie-Tooth
disease type 2A: from typical to rare phenotypic and genotypic features. JAMA
Neurol. 2014;71(8):1036-42.
77. Pareyson D, Marchesi C. Diagnosis, natural history, and management of Charcot-Marie-
Tooth disease. Lancet Neurol. 2009;8(7):654-67.
78. Colella R, Hollensead SC. Understanding and recognizing the Pelger-Huët anomaly. Am
J Clin Pathol. 2012;137(3):358-66.

131
79. Rankin J, Ellard S. The laminopathies: a clinical review. Clin Genet. 2006;70(4):261-74.
80. Neamati N, Fernandez A, Wright S, Kiefer J, McConkey DJ. Degradation of Lamin B,
Precedes Oligonucleosomal DNA Fragmentation in Apoptotic Thymocytes and Isolated
Thymocyte Nuclei. J Immunol 1995;154:3788-95.
81. Hegele RA. Familial partial lipodystrophy: a monogenic form of the insulin resistance
syndrome. Mol Genet Metab. 2000;71(4):539-44.
82. Bantel H, Schulze-Osthoff K. Mechanisms of cell death in acute liver failure. Front
Physiol 2012;3:79.
83. Hengartner MO. The biochemistry of apoptosis. Nature 2000;407:770–6.
84. Bensellam M, Laybutt DR, Jonas JC. The molecular mechanisms of pancreatic β-
cell glucotoxicity: recent findings and future research directions. Mol Cell
Endocrinol. 2012;364(1-2):1-27.
85. Poitout V, Robertson RP. Glucolipotoxicity: fuel excess and beta-cell dysfunction.
Endocr Rev 2008;29:351–66.
86. Malhotra JD, Kaufman RJ. ER stress and its functional link to mitochondria: role in cell
survival and death. Cold Spring Harb Perspect Biol. 2011;3(9):a004424.
87. Simmen T, Aslan JE, Blagoveshchenskaya AD, Thomas L, Wan L, Xiang Y, Feliciangeli
SF, Hung CH, Crump CM, Thomas G. PACS-2 controls endoplasmic reticulum-
mitochondria communication and Bid-mediated apoptosis. EMBO J. 2005 Feb
23;24(4):717-29.
88. Bordier C. Phase separation of integral membrane proteins in Triton X-114 solution. J
Biol Chem. 1981;256(4):1604-7.
89. Gruenbaum Y, Wilson KL, Harel A, Goldberg M, Cohen M. Review: nuclear lamins—
structural proteins with fundamental functions. J Struct Biol 2000;129: 313–23.
132
90. Veluthakal R, Amin R, Kowluru A. Interleukin-1 induces posttranslational
carboxymethylation and alterations in subnuclear distribution of lamin B in insulin-
secreting RINm5F cells. Am J Physiol Cell Physiol 2004;287:C1152–62.
91. Kivinen K, Kallajoki M, Taimen P. Caspase-3 is required in the apoptotic disintegration of
the nuclear matrix. Exp Cell Res 2005;311:62–73.
92. Almaguel FG, Liu JW, Pacheco FJ, Casiano CA, De Leon M. Activation and reversal of
lipotoxicity in PC12 and rat cortical cells following exposure to palmitic acid. J Neurosci
Res 2009;87:1207–18.
93. Arora DK, Mohammed AM, Kowluru A. Nifedipine prevents etoposide-induced caspase-
3 activation, prenyltransferase degradation and loss in cell viability in pancreatic b-cells.
Apoptosis 2013;18:1–8.
94. Wang Y, Gao L, Li Y, Chen H, Sun Z. Nifedipine protects INS-1 b-cell from high glucose-
induced ER stress and apoptosis. Int J Mol Sci 2011;12:7569–80.
95. Huo J, Luo RH, Metz SA, Li G. Activation of caspase-2 mediates the apoptosis induced
by GTP-depletion in insulinsecreting (HIT-T15) cells. Endocrinology 2002;143:1695–
1704.
96. Yamada K, Ichikawa F, Ishiyama-Shigemoto S, Yuan X, Nonaka K. Essential role of
caspase-3 in apoptosis of mouse betacells transfected with human Fas. Diabetes 1999;
48:478–483.
97. Hirota N, Otabe S, Nakayama H, Yuan X, Yamada K. Sequential activation of caspases
and synergistic beta-cell cytotoxicity by palmitate and anti-Fas antibodies. Life Sci
2006;79:1312–1316.

133
98. Slee EA, Adrain C, Martin SJ. Executioner caspase-3, -6, and -7 perform distinct, non-
redundant roles during the demolition phase of apoptosis. J Biol Chem2001; 276:7320
7326.
99. Zhao H, Zhao W, Lok K, Wang Z, Yin M. A synergic role of caspase-6 and caspase-3 in
Tau truncation at D421 induced by H2O2. Cell Mol Neurobiol 2014;34:369–378
100. Syeda K, Mohammed AM, Arora DK, Kowluru A. Glucotoxic conditions induce
endoplasmic reticulum stress to cause caspase 3 mediated lamin B degradation in
pancreatic b-cells: protection by nifedipine. Biochem Pharmacol. 2013; 86:1338–1346.
101. Patel NA, Song SS, Cooper DR.
PKCdelta alternatively spliced isoforms modulate cellular apoptosis in retinoic acid-
induced differentiation ofhuman NT2 cells and mouse embryonic stem cells. Gene
Expr. 2006;13(2):73-84.
102. Sidarala V, Veluthakal R, Syeda K, Vlaar C, Newsholme P, Kowluru A. Phagocyte-like
NADPH oxidase (Nox2) promotes activation of p38MAPK in pancreatic β-cells under
glucotoxic conditions: Evidence for a requisite role of Ras-related C3 botulinum toxin
substrate 1 (Rac1). Biochem Pharmacol. 2015;95(4):301-10.
103. Syed I, Kyathanahalli CN, Jayaram B, Govind S, Rhodes CJ, Kowluru RA, Kowluru A.
Increased phagocyte-like NADPH oxidase and ROS generation in type 2 diabetic ZDF
rat and human islets: role of Rac1-JNK1/2 signaling pathway in mitochondrial
dysregulation in the diabetic islet. Diabetes. 2011; 60:2843–2852.
104. Mohammed AM, Syeda K, Hadden T, Kowluru A. Upregulation of phagocyte-like
NADPH oxidase by cytokines in pancreatic beta-cells: attenuation of oxidative and
nitrosative stress by 2-bromopalmitate. Biochem Pharmacol. 2013 85:109–114.

134
105. Eizirik DL, Miani M, Cardozo AK. Signalling danger: endoplasmic reticulum stress and
the unfolded protein response in pancreatic islet inflammation. Diabetologia. 2013;
56:234–241.
106. Wang H, Kouri G, Wollheim CB. ER stress and SREBP-1 activation are implicated in
beta-cell glucolipotoxicity. J Cell Sci. 2005; 118:3905–3915.
107. Leem J, Koh EH. Interaction between mitochondria and the endoplasmic reticulum:
implications for the pathogenesis of type 2 diabetes mellitus. Exp Diabetes Res
2012;2012:242984.
108. Supale S, Li N, Brun T, Maechler P. Mitochondrial dysfunction in pancreatic b cells.
Trends Endocrinol Metab 2012;23:477–87.
109. Veluthakal R, Palanivel R, Zhao Y, McDonald P, Gruber S, Kowluru A. Ceramide
induces mitochondrial abnormalities in insulin-secreting INS-1 cells: potential
mechanisms underlying ceramide-mediated metabolic dysfunction of the beta cell.
Apoptosis. 2005; 10:841–850.
110. Jonas JC, Bensellam M, Duprez J, Elouil H, Guiot Y, Pascal S. Glucose regulation of
islet stress responses and beta-cell failure in type 2 diabetes. Diabetes Obes Metab.
2009;11:65–81.
111. Lei X, Zhang S, Bohrer A, Barbour SE, Ramanadham S. Role of calcium-independent
phospholipase A(2)b in human pancreatic islet b-cell apoptosis. Am J Physiol Endocrinol
Metab. 2012;303:1386–1395.
112. Veluthakal R, Amin R, Kowluru A. Interleukin-1 induces posttranslational
carboxymethylation and alterations in subnuclear distribution of lamin B in insulin
secreting RINm5F cells. Am J Physiol Cell Physiol. 2004 287:1152–1162.
135
113. Mintzer R, Ramaswamy S, Shah K, Hannoush RN, Pozniak CD, Cohen F, Zhao X, Plise
E, Lewcock JW, Heise CE. A whole cell assay to measure caspase-6 activity by
detecting cleavage of lamin A/C. PLoS One. 2012;7(1):e30376.
114. Tang C, Koulajian K, Schuiki I, Zhang L, Desai T, Ivovic A, et al. Glucose-induced beta
cell dysfunction in in vivo in rats: link between oxidative stress and endoplasmic
reticulum stress. Diabetologia 2012;55:1366–79.
115. Xu G, Chen J, Jing G, Shalev A. Preventing b-cell loss and diabetes with calcium
channel blockers. Diabetes 2012;6:848–56.
116. Zhou Y, Sun P, Wang T, Chen K, Zhu W, Wang H.
Inhibition of Calcium Influx Reduces Dysfunction and Apoptosis in Lipotoxic Pancreatic β
-Cells via Regulation ofEndoplasmic Reticulum Stress. PLoS
One. 2015;10(7):e0132411.
117. Khadija S, Veluthakal R, Sidarala V, Kowluru A. Glucotoxic and diabetic conditions
induce caspase 6-mediated degradation of nuclear lamin A in human islets, rodent islets
and INS-1 832/13 cells. Apoptosis. 2014;19(12):1691-701.
118. Endo A, Kuroda M, Tsujita Y. ML-236A, ML-236B, and ML-236C, new inhibitors of
cholesterogenesis produced by Penicillium citrinium. J Antibiot
(Tokyo). 1976;29(12):1346-8.
119. Brown AG, Smale TC, King TJ, Hasenkamp R, Thompson RH. Crystal and molecular
structure of compactin, a new antifungal metabolite from Penicillium brevicompactum. J
Chem Soc Perkin 1. 1976;(11):1165-70.
120. Alberts AW, Chen J, Kuron G, Hunt V, Huff J, Hoffman C, Rothrock J, Lopez M, Joshua
H, Harris E, Patchett A, Monaghan R, Currie S, Stapley E, Albers-Schonberg
G, Hensens O, Hirshfield J, Hoogsteen K, Liesch J, Springer J. Mevinolin:

136
a highly potent competitive inhibitor of hydroxymethylglutaryl-coenzyme A reductase and
acholesterol-lowering agent. Proc Natl Acad Sci U S A. 1980;77(7):3957-61.
121. Hajar R. Statins: past and present. Heart Views. 2011;12(3):121-7.
122. Furberg CD, Pitt B. Withdrawal of cerivastatin from the world market. Curr Control Trials
Cardiovasc Med. 2001;2(5):205-207.
123. Corsini A, Maggi FM, Catapano AL. Pharmacology of competitive inhibitors of HMG-CoA
reductase. Pharmacol Res. 1995;31(1):9-27.
124. Chao YS, Kroon PA, Yamin TT, Thompson GM, Alberts AW.
Regulation of hepatic receptor-
dependent degradation of LDL by mevinolin in rabbits with hypercholesterolemia
induced by a wheat starch-casein diet. Biochim Biophys Acta. 1983;29;754(2):134-41.
125. Bilheimer DW, Grundy SM, Brown MS, Goldstein JL. Mevinolin and colestipol stimulate
receptor-mediated clearance of low density lipoprotein from plasma in familial
hypercholesterolemia heterozygotes. Proc Natl Acad Sci U S A. 1983;80(13):4124-8.
126. Ishikawa M, Okajima F, Inoue N, Motomura K, Kato T, Takahashi A, Oikawa S, Yamada
N, Shimano H. Distinct effects of pravastatin, atorvastatin, and simvastatin on insulin
secretion from a beta-cell line, MIN6 cells. J Atheroscler Thromb. 2006;13(6):329-35.
127. Tsuchiya M, Hosaka M, Moriguchi T, Zhang S, Suda M, Yokota-Hashimoto
H, Shinozuka K, Takeuchi T. Cholesterol biosynthesis pathway intermediates and
inhibitors regulate glucose-stimulated insulin secretion and secretory granule formation
in pancreatic beta-cells. Endocrinology. 2010;151(10):4705-16.
128. Metz SA, Rabaglia ME, Stock JB, Kowluru A. Modulation of insulin secretion from
normal rat islets by inhibitors of the post-translational modifications of GTP-binding
proteins. Biochem J. 1993;295 ( Pt 1):31-40.
137
129. Di Matola T, D’Ascoli F, Luongo C, Bifulco M, Rossi G, FenziG, Vitale M. Lovastatin-
induced apoptosis in thyroid cells: involvement of cytochrome c and lamin B. Eur J
Endocrinol 2001;145:645–650.
130. Chang SY, Hudon-Miller SE, Yang SH, Jung HJ, Lee JM, Farber E, Subramanianb T,
Andres DA, Spielmann HP, Hrycyna CA, Young SG, Fong LG. Inhibitors of protein
geranylgeranyltransferase- I lead to prelamin A accumulation in cells by inhibiting
ZMPSTE24. J Lipid Res 2012;53:1176–1182.
131. Adam SA, Butin-Israeli V, Cleland MM, Shimi T, Goldman RD. Disruption of lamin B1
and lamin B2 processing and localization by farnesyltransferase inhibitors.
Nucleus. 2013;4(2):142-50.
132. Capell BC, Erdos MR, Madigan JP, Fiordalisi JJ, Varga R, Conneely KN, Gordon
LB, Der CJ, Cox AD, Collins FS. Inhibiting farnesylation of progerin prevents the
characteristic nuclear blebbing of Hutchinson-Gilford progeria syndrome. Proc Natl Acad
Sci U S A. 2005;102(36):12879-84.
133. Mallampalli MP, Huyer G, Bendale P, Gelb MH, Michaelis S. Inhibiting farnesylation
reverses the nuclear morphology defect in a HeLa cell model for Hutchinson-Gilford
progeria syndrome. Proc Natl Acad Sci U S A. 2005;102(40):14416-21.
134. Wang Y, Ostlund C, Worman HJ. Blocking protein farnesylation improves nuclear shape
abnormalities in keratinocytes of mice expressing the prelamin A variant in Hutchinson-
Gilford progeria syndrome. Nucleus. 2010;1(5):432-9.
135. Capell BC, Olive M, Erdos MR, Cao K, Faddah DA, Tavarez UL, Conneely KN, Qu
X, San H, Ganesh SK, Chen X, Avallone H, Kolodgie FD, Virmani R, Nabel EG, Collins
FS. A farnesyltransferase inhibitor prevents both the onset and late progression of
138
cardiovascular disease in a progeria mouse model. Proc Natl Acad Sci U S
A. 2008;105(41):15902-7.
136. Karp JE. Farnesyl protein transferase inhibitors as targeted therapies for hematologic
malignancies. Semin Hematol. 2001;38(3 Suppl 7):16-23.
137. Gordon LB, Kleinman ME, Miller DT, Neuberg DS, Giobbie-Hurder A, Gerhard-Herman
M, Smoot LB, Gordon CM, Cleveland R, Snyder BD, Fligor B, Bishop WR, Statkevich
P, Regen A, Sonis A, Riley S, Ploski C, Correia A, Quinn N, Ullrich NJ, Nazarian
A, Liang MG, Huh SY, Schwartzman A, Kieran MW. Clinical trial of a farnesyltransferase
inhibitor in children with Hutchinson-Gilford progeria syndrome. Proc Natl Acad Sci U S
A. 2012;109(41):16666-71.
138. Kim KW, Chung HH, Chung CW, Kim IK, Miura M, Wang S, et al. Inactivation of
farnesyltransferase and geranylgeranyltransferase I by caspase-3: cleavage of the
common alpha subunit during apoptosis. Oncogene 2001;20: 358–66.
139. Pelaia G, Gallelli L, Renda T, Fratto D, Falcone D, Caraglia M, Busceti MT, Terracciano
R, Vatrella A, Maselli R, Savino R. Effects of statins and farnesyl transferase inhibitors
on ERK phosphorylation, apoptosis and cell viability in non-small lung cancer cells. Cell
Prolif. 2012;45(6):557-65.
140. Afshordel S, Kern B, Clasohm J, König H, Priester M, Weissenberger J, Kögel D, Eckert
GP. Lovastatin and perillyl alcohol inhibit glioma cell invasion, migration, and
proliferation--impact of Ras-/Rho-prenylation. Pharmacol Res. 2015;91:69-77.
141. Bonifacio A, Sanvee GM, Bouitbir J, Krähenbühl S. The AKT/mTOR signaling pathway
plays a key role in statin-induced myotoxicity. Biochim Biophys
Acta. 2015;1850(8):1841-9.
139
ABSTRACT
ISLET DYSFUNCTION IN DIABETES
by
KHADIJA G. SYEDA
August 2015
Advisor: Dr. Anjan Kowluru
Major: Pharmaceutical Sciences
Degree: Doctor of Philosophy
Type 2 Diabetes [T2DM] is a chronic condition resulting from gradual failure of
pancreatic beta cells to synthesize and secrete sufficient insulin to meet the metabolic demands
and the inability of tissues [muscle, adipose and liver] to efficiently utilize the secreted insulin
leading to an overall increase in blood glucose levels [hyperglycemia]. As indicated by recent
estimates from the International Diabetes Federation, the prevalence of the disease in the year
2014 has risen to a record 387 million worldwide. The main objective of my project was to study
the mechanisms involved in pancreatic beta cell dysfunction in diabetes, specifically in
elucidating the role of endoplasmic reticulum [ER] - mitochondria axis, executioner caspases
and their target substrates; specifically nuclear lamins.
Results obtained from our studies in pure beta cells [INS-1 832/13], primary rodent and
human islets strongly suggest that glucotoxicity induced pancreatic beta cell damage involves
the degradation of nuclear lamins A and B, via ER stress-mediated activation of executioner
caspases 3 and 6. We confirmed this by employing pharmacological approaches [inhibitors of -
ER stress, -caspase activation and calcium channel activation] to gain mechanistic insights into

140
beta cell dysfunction under the duress of chronic hyperglycemia. Further, we were able to
corroborate these findings in the ZDF rat, an animal model for T2DM and in islets obtained from
human donors with T2DM. Also, our findings revealed significant attenuation of glucose-
stimulated insulin secretion [GSIS] in beta cells exposed to glucotoxic conditions suggesting
cellular dysfunction under these conditions. Post-translational prenylation of lamins is important
for their localization into the nuclear membrane, and subsequent interaction with other proteins.
Our results indicate that inhibition of prenylation by simvastatin and a site-specific inhibitor of
protein farnesylation [FTI-277], promoted mitochondrial and nuclear defects as evidenced by
caspase activation and lamin degradation in INS-1 832/13 cells and normal rodent islets. Our
findings also suggest that inhibition of protein prenylation leads to increase in stress kinase [p38
kinase] and inhibition of ERK1/2, known for its cell survival roles. Collectively, these alterations
in cell signaling pathways could promote intracellular stress and demise.
We hope that data accrued in these studies will provide fresh insights into the
identification of the intracellular mechanisms involved in beta cell malfunction in nutrient
overload and metabolic stress. These studies will also aid in the identification of potential drug
targets for the management and/or prevention of diabetes.

141
AUTOBIOGRAPHICAL STATEMENT
EDUCATION:
Masters in Pharmacy, (2011), University of Pune, Pune, India
Bachelors in Pharmacy, (2009), University of Pune, Pune, India
AWARDS:
George C. Fuller Endowed Scholarship, Department of Pharmaceutical Sciences, Wayne State University, 2015.
Thomas C. Rumble - Graduate Fellowship, Department of Pharmaceutical Sciences, Wayne State University, 2011, 2013.
PUBLICATIONS:
1. Phagocyte-like NADPH oxidase (Nox2) promotes activation of p38MAPK in pancreatic β-cells under glucotoxic conditions: Evidence for a requisite role of Ras-related C3 botulinum toxin substrate 1 (Rac1). Sidarala V, Veluthakal R, Syeda K, Vlaar C, Newsholme P, Kowluru A. Biochem Pharmacol. 2015.;95(4):301-10.
2. EHT 1864, a small molecule inhibitor of Ras-related C3 botulinum toxin substrate1 (Rac1), attenuates glucose-stimulated insulin secretion in pancreatic β-cells. Sidarala V, Veluthakal R, Syeda K, Kowluru A. Cellular Signalling. 2015; 1159-1167.
3. Glucotoxic and diabetic conditions induce caspase 6-mediated degradation of nuclear lamin A in human islets, rodent islets and INS-1 832/13 cells. Khadija S, Veluthakal R, Sidarala V, Kowluru A. Apoptosis. 2014;19(12):1691-701.
4. Glucotoxic conditions induce endoplasmic reticulum stress to cause caspase 3 mediated lamin B degradation in pancreatic β-cells: protection by nifedipine. Syeda K, Mohammed AM, Arora DK, Kowluru A. Glucotoxic conditions induce endoplasmic reticulum stress to cause caspase 3 mediated lamin B degradation in pancreatic β-cells: protection by nifedipine. Biochem Pharmacol. 2013;86[9]:1338-46.
5. Upregulation of phagocyte-like NADPH oxidase by cytokines in pancreatic beta-cells: attenuation of oxidative and nitrosative stress by 2-bromopalmitate. Mohammed AM, Syeda K, Hadden T, Kowluru A. Biochem Pharmacol. 2013;85(1):109-14.
6. VAV2, a guanine nucleotide exchange factor for Rac1, regulates glucose-stimulated insulin secretion in pancreatic beta cells. Veluthakal R, Tunduguru R, Arora DK, Sidarala V, Syeda K, Vlaar CP, Thurmond DC, Kowluru A. Diabetologia 2015 [In Press]


![[OS 202C] 20120102 Pancreatic Islet Physiology (Insulin)](https://img.pdfslide.us/doc/110x75/577cd5451a28ab9e789a55e6/os-202c-20120102-pancreatic-islet-physiology-insulin.jpg)