Embed Size (px)
Citation preview
Isle of Man
Passenger Survey
Survey 2017
Economic Affairs
Cabinet Office
February 2018
GD 2018/0006

1
Contents
Summary of Results – Isle of Man Passenger Survey 2017 ............................... 2
Scheduled Passenger Departures ....................................................................... 4
Figure 1 Scheduled Passenger Departures, by Mode of Travel ('000) ........................................ 4
Table 1 Scheduled Passenger Departures, by Quarter ('000) .................................................... 4
Table 2 Scheduled Air Passenger Departures, by Quarter ('000) ............................................... 4
Table 3 Scheduled Sea Passenger Departures, by Quarter ('000) ............................................. 5
Figure 2 Scheduled Passenger Departures, by type of Passenger ('000) .................................... 5
Table 4 Scheduled Air Departures, by type of Passenger ('000) ................................................ 5
Table 5 Scheduled Sea Departures, by type of Passenger ('000) .............................................. 5
Visitors ................................................................................................................ 6
Figure 3 Number of Visitors by Mode of Travel ('000) .............................................................. 6
Table 6 Number of Visitors, by Quarter ('000) ........................................................................ 6
Table 7 Number of Visitors by Air, by Quarter ('000) ............................................................... 6
Table 8 Number of Visitors by Sea, by Quarter ('000) .............................................................. 6
Figure 4 Number of Visitors, by Type of Visitor ('000).............................................................. 7
Table 9 Number of Visitors by Air, by Type of Visitor ('000) ..................................................... 7
Table 10 Number of Visitors by Sea, by Type of Visitor ('000) .................................................. 7
Figure 5 Total Visitor Expenditure at Constant Prices (£million) ................................................ 8
Table 11 Total Visitor Expenditure, by Type of Expenditure (£million) 2017 ............................... 9
Table 12 Average Expenditure, by Type of Expenditure (£) 2017.............................................. 9
Table 13 Number of Bed Nights 2017 .................................................................................. 10
Figure 6 Area of Residence (All Visitors) (%) 2017 ................................................................ 10
Table 14 Area of Residence (Visitors by Air) (%) 2017 .......................................................... 11
Table 15 Area of Residence (Visitors by Sea) (%) 2017 ......................................................... 11
Isle of Man Residents ....................................................................................... 12
Table 16 Number of Trips by Residents, by Type 2017 .......................................................... 12
Table 17 Number of Nights Off-Island, by Type 2017 ............................................................ 12
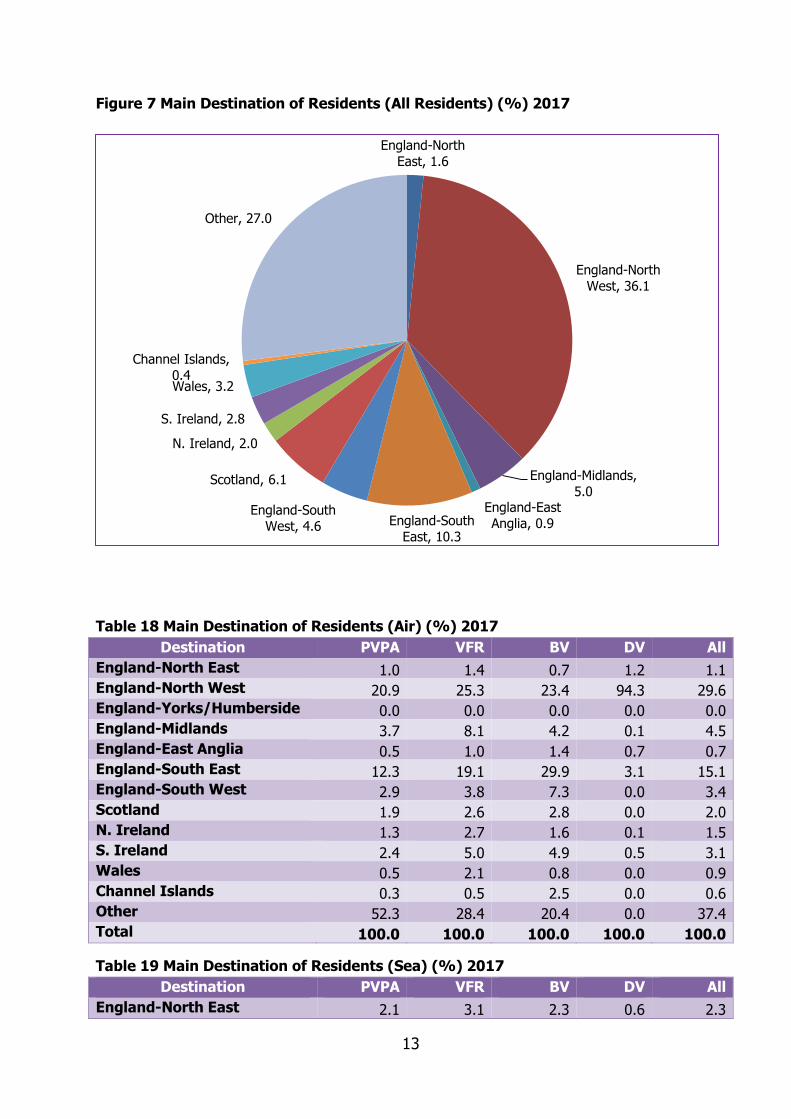
Figure 7 Main Destination of Residents (All Residents) (%) 2017 ............................................ 13
Table 18 Main Destination of Residents (Air) (%) 2017 ......................................................... 13
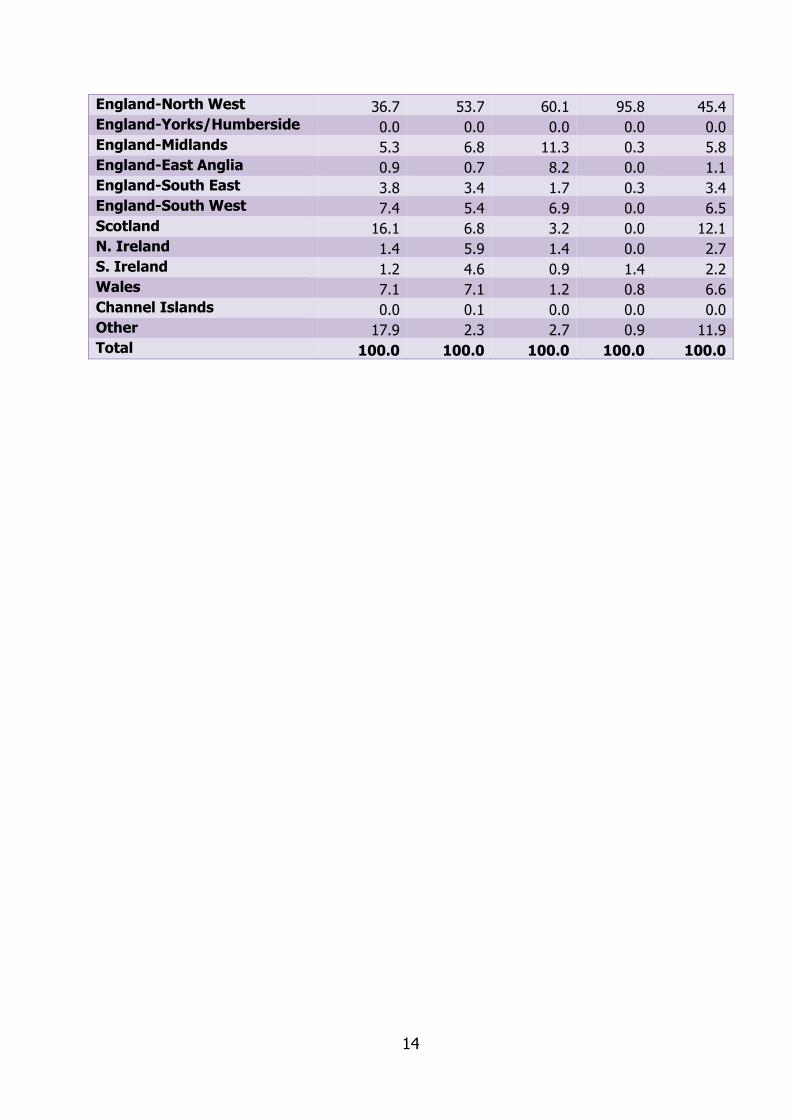
Table 19 Main Destination of Residents (Sea) (%) 2017 ........................................................ 13
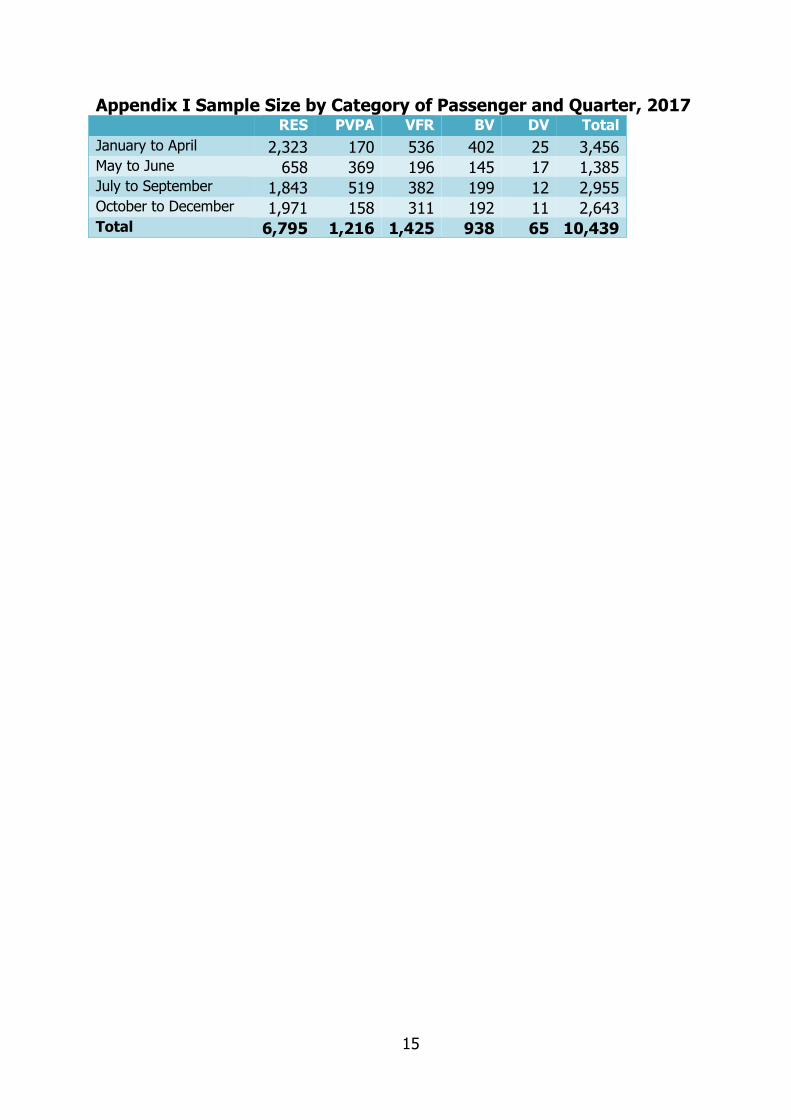
Appendix I Sample Size by Category of Passenger and Quarter, 2017 ..................................... 15
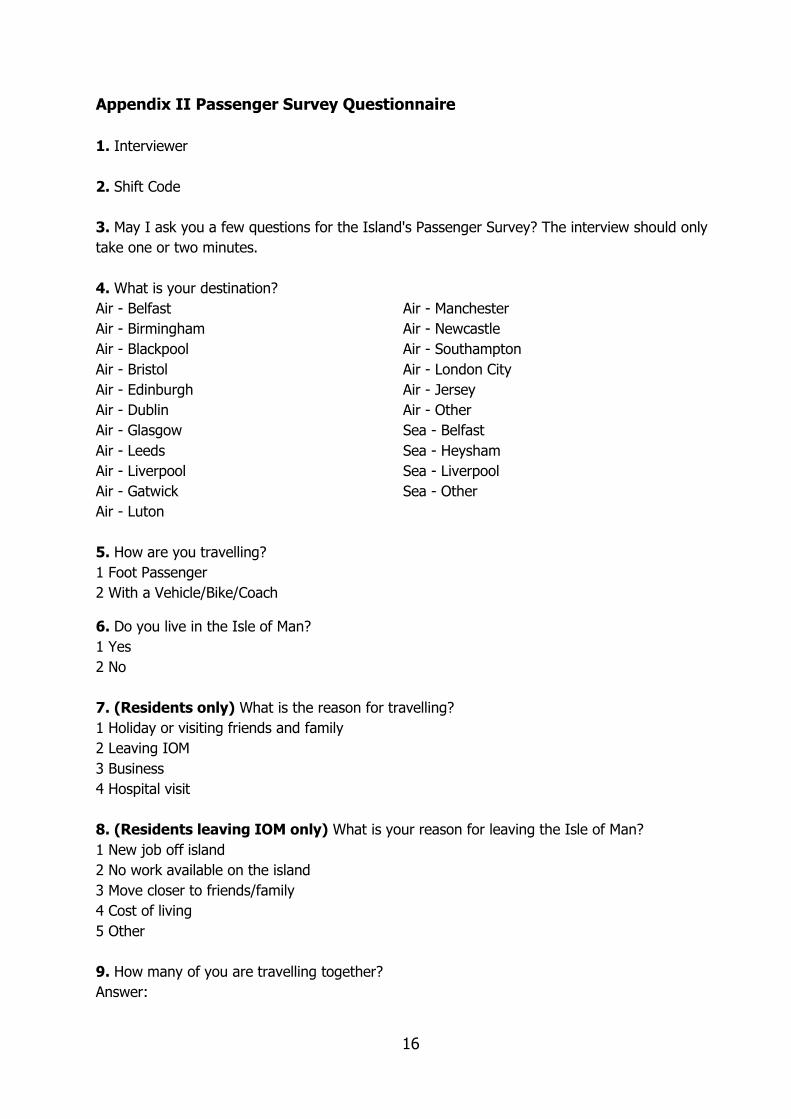
Appendix II Passenger Survey Questionnaire ................................................. 16
2
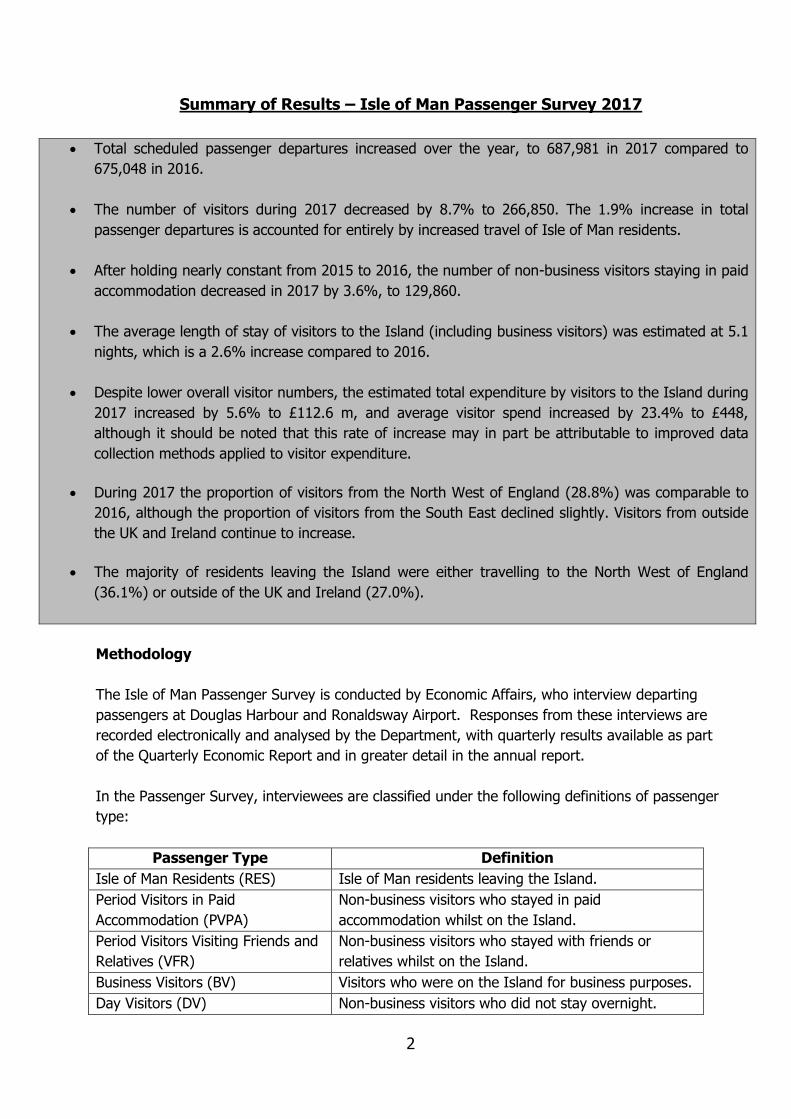
Summary of Results – Isle of Man Passenger Survey 2017
Total scheduled passenger departures increased over the year, to 687,981 in 2017 compared to
675,048 in 2016.
The number of visitors during 2017 decreased by 8.7% to 266,850. The 1.9% increase in total
passenger departures is accounted for entirely by increased travel of Isle of Man residents.
After holding nearly constant from 2015 to 2016, the number of non-business visitors staying in paid
accommodation decreased in 2017 by 3.6%, to 129,860.
The average length of stay of visitors to the Island (including business visitors) was estimated at 5.1
nights, which is a 2.6% increase compared to 2016.
Despite lower overall visitor numbers, the estimated total expenditure by visitors to the Island during
2017 increased by 5.6% to £112.6 m, and average visitor spend increased by 23.4% to £448,
although it should be noted that this rate of increase may in part be attributable to improved data
collection methods applied to visitor expenditure.
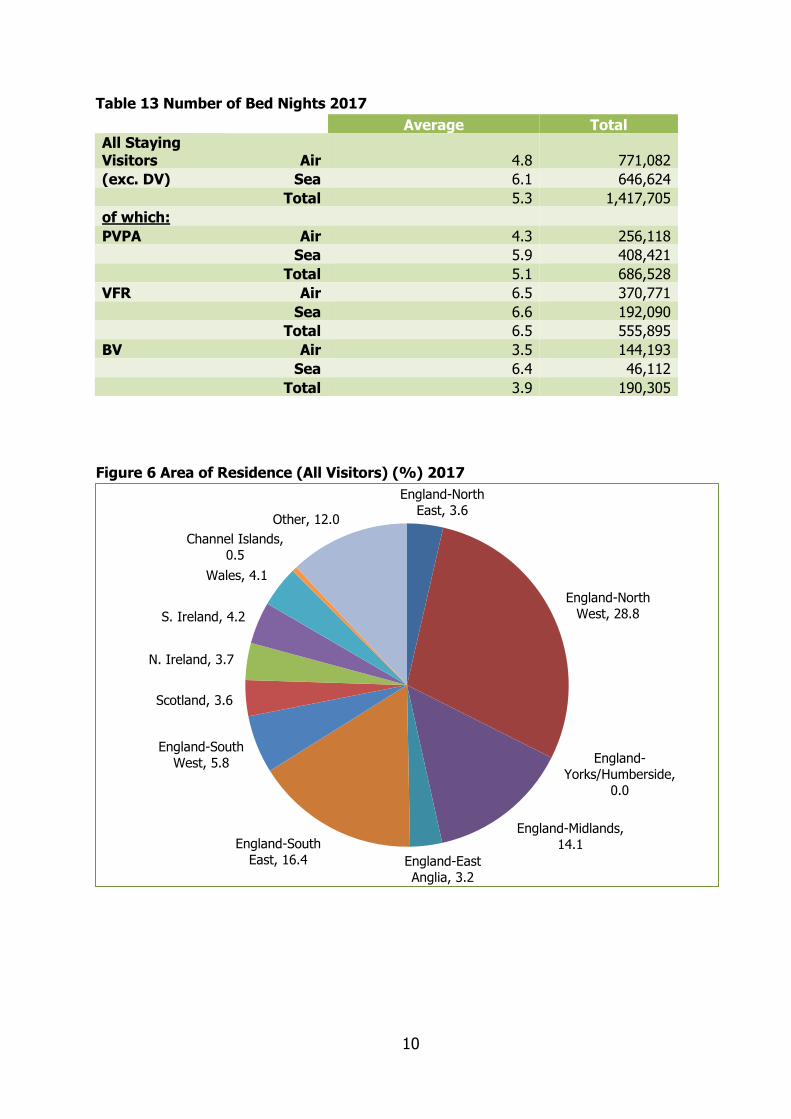
During 2017 the proportion of visitors from the North West of England (28.8%) was comparable to
2016, although the proportion of visitors from the South East declined slightly. Visitors from outside
the UK and Ireland continue to increase.
The majority of residents leaving the Island were either travelling to the North West of England
(36.1%) or outside of the UK and Ireland (27.0%).
Methodology
The Isle of Man Passenger Survey is conducted by Economic Affairs, who interview departing
passengers at Douglas Harbour and Ronaldsway Airport. Responses from these interviews are
recorded electronically and analysed by the Department, with quarterly results available as part
of the Quarterly Economic Report and in greater detail in the annual report.
In the Passenger Survey, interviewees are classified under the following definitions of passenger
type:
Passenger Type Definition
Isle of Man Residents (RES) Isle of Man residents leaving the Island.
Period Visitors in Paid
Accommodation (PVPA)
Non-business visitors who stayed in paid
accommodation whilst on the Island.
Period Visitors Visiting Friends and
Relatives (VFR)
Non-business visitors who stayed with friends or
relatives whilst on the Island.
Business Visitors (BV) Visitors who were on the Island for business purposes.
Day Visitors (DV) Non-business visitors who did not stay overnight.
3
Throughout the Report, “quarterly” figures are presented in which “Q1” refers to January to April
and “Q2” consists of those for May and June. This is to ensure that quarterly comparisons are
not distorted by the timing of the Easter break.
Cases are selected using a complex sampling design. All results are re-weighted to account for
the different numbers of passengers travelling by each route and mode of travel from the Island.
As with any survey of this type, results are subject to random error variation.
The information contained in this report relates only to scheduled departures and does not
include unscheduled departures such as some charter flights, cruise ship passengers and
pleasure craft.
Throughout this report individual entries have been rounded independently and as a result
columns may not appear to sum to column totals. This is simply a result of rounding and the un-
rounded entries do sum correctly.
This Report is intended to meet the general information requirements of regular users of the
Passenger Survey, but additional statistics, including historical data may be made available on
request. Further comments and enquiries should be addressed to:
Economic Affairs
Cabinet Office
Government Office
Bucks Road
Douglas
Isle of Man
IM1 1PN
Email: [email protected]
4
Scheduled Passenger Departures
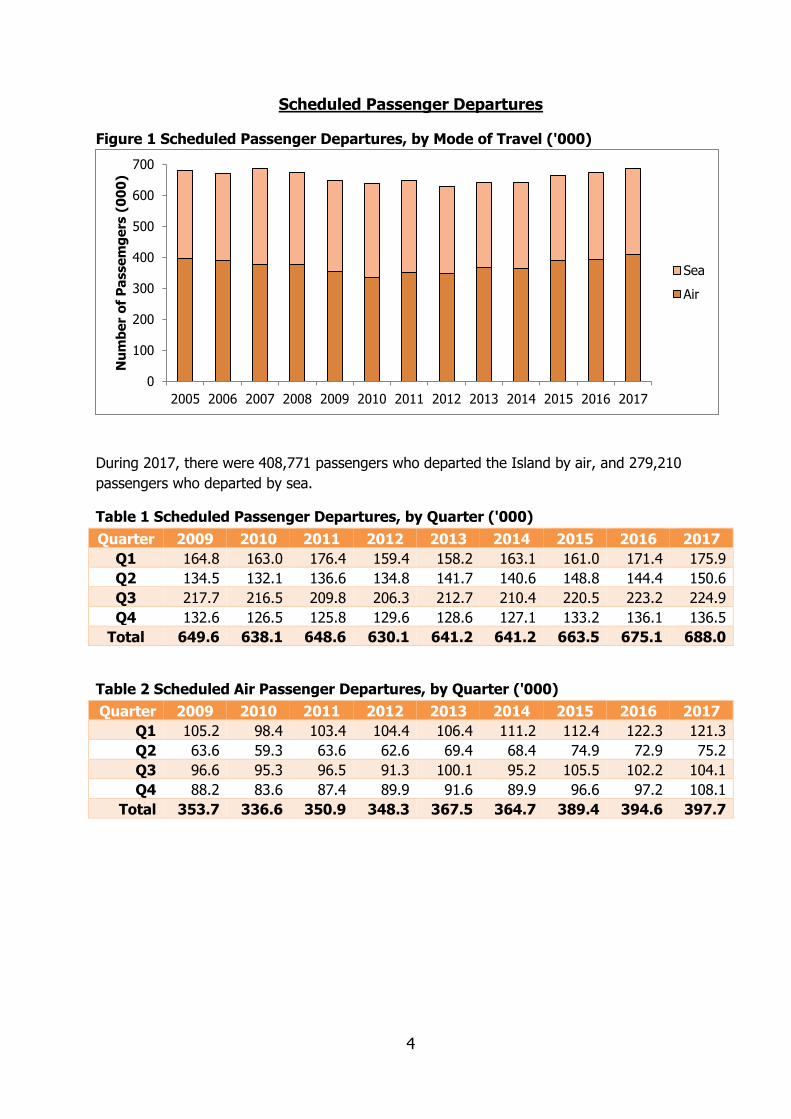
Figure 1 Scheduled Passenger Departures, by Mode of Travel ('000)
During 2017, there were 408,771 passengers who departed the Island by air, and 279,210
passengers who departed by sea.
Table 1 Scheduled Passenger Departures, by Quarter ('000)
Quarter 2009 2010 2011 2012 2013 2014 2015 2016 2017
Q1 164.8 163.0 176.4 159.4 158.2 163.1 161.0 171.4 175.9
Q2 134.5 132.1 136.6 134.8 141.7 140.6 148.8 144.4 150.6
Q3 217.7 216.5 209.8 206.3 212.7 210.4 220.5 223.2 224.9
Q4 132.6 126.5 125.8 129.6 128.6 127.1 133.2 136.1 136.5
Total 649.6 638.1 648.6 630.1 641.2 641.2 663.5 675.1 688.0
Table 2 Scheduled Air Passenger Departures, by Quarter ('000)
Quarter 2009 2010 2011 2012 2013 2014 2015 2016 2017
Q1 105.2 98.4 103.4 104.4 106.4 111.2 112.4 122.3 121.3
Q2 63.6 59.3 63.6 62.6 69.4 68.4 74.9 72.9 75.2
Q3 96.6 95.3 96.5 91.3 100.1 95.2 105.5 102.2 104.1
Q4 88.2 83.6 87.4 89.9 91.6 89.9 96.6 97.2 108.1
Total 353.7 336.6 350.9 348.3 367.5 364.7 389.4 394.6 397.7
0
100
200
300
400
500
600
700
2005 2006 2007 2008 2009 2010 2011 2012 2013 2014 2015 2016 2017
Nu
mb
er
of
Pa
sse
mg
ers
(0
00
)
Sea
Air
5
Table 3 Scheduled Sea Passenger Departures, by Quarter ('000)
Quarter 2009 2010 2011 2012 2013 2014 2015 2016 2017
Q1 59.6 64.6 73.0 55.0 51.8 51.9 48.6 49.2 54.6
Q2 70.9 72.8 73.0 72.1 72.3 72.2 73.9 71.5 75.4
Q3 121.1 121.2 113.3 115.0 112.6 115.2 115.0 121.0 120.8
Q4 44.4 42.9 38.4 39.7 37.0 37.2 36.6 38.8 28.4
Total 295.9 301.5 297.7 281.8 273.7 276.5 274.1 280.5 279.2
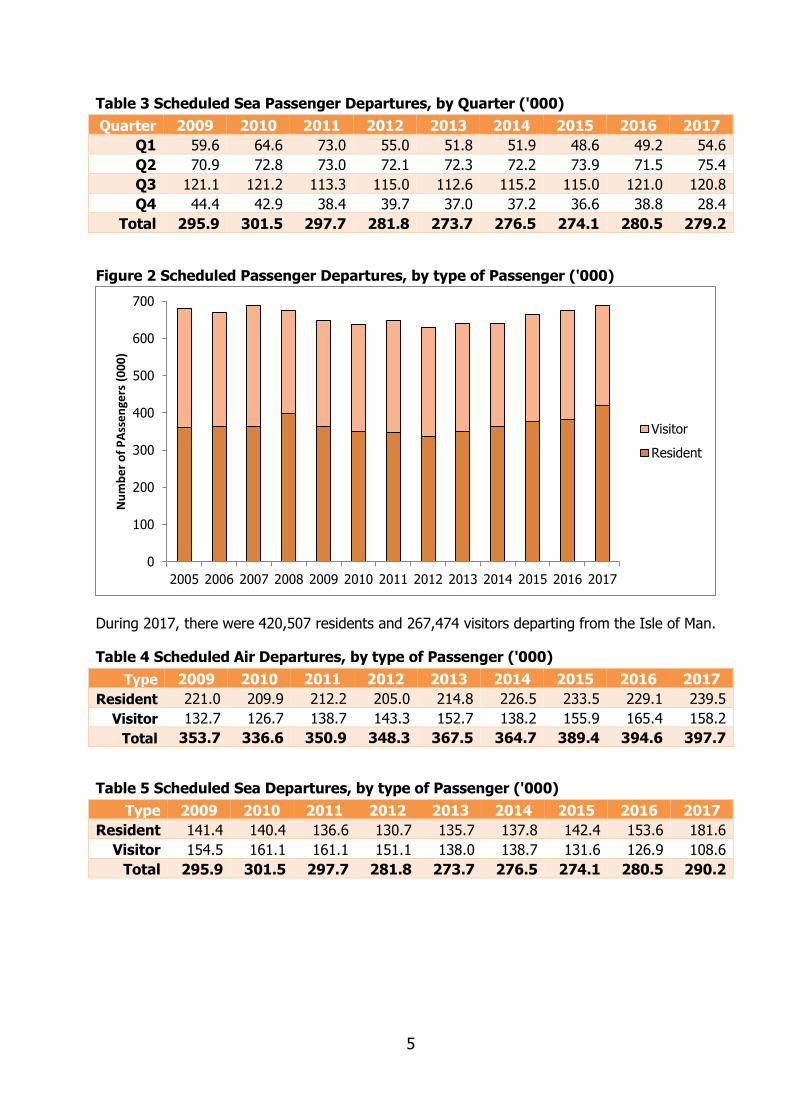
Figure 2 Scheduled Passenger Departures, by type of Passenger ('000)
During 2017, there were 420,507 residents and 267,474 visitors departing from the Isle of Man.
Table 4 Scheduled Air Departures, by type of Passenger ('000)
Type 2009 2010 2011 2012 2013 2014 2015 2016 2017
Resident 221.0 209.9 212.2 205.0 214.8 226.5 233.5 229.1 239.5
Visitor 132.7 126.7 138.7 143.3 152.7 138.2 155.9 165.4 158.2
Total 353.7 336.6 350.9 348.3 367.5 364.7 389.4 394.6 397.7
Table 5 Scheduled Sea Departures, by type of Passenger ('000)
Type 2009 2010 2011 2012 2013 2014 2015 2016 2017
Resident 141.4 140.4 136.6 130.7 135.7 137.8 142.4 153.6 181.6
Visitor 154.5 161.1 161.1 151.1 138.0 138.7 131.6 126.9 108.6
Total 295.9 301.5 297.7 281.8 273.7 276.5 274.1 280.5 290.2
0
100
200
300
400
500
600
700
2005 2006 2007 2008 2009 2010 2011 2012 2013 2014 2015 2016 2017
Nu
mb
er
of
PA
sse
nge
rs (
00
0)
Visitor
Resident
6
Visitors
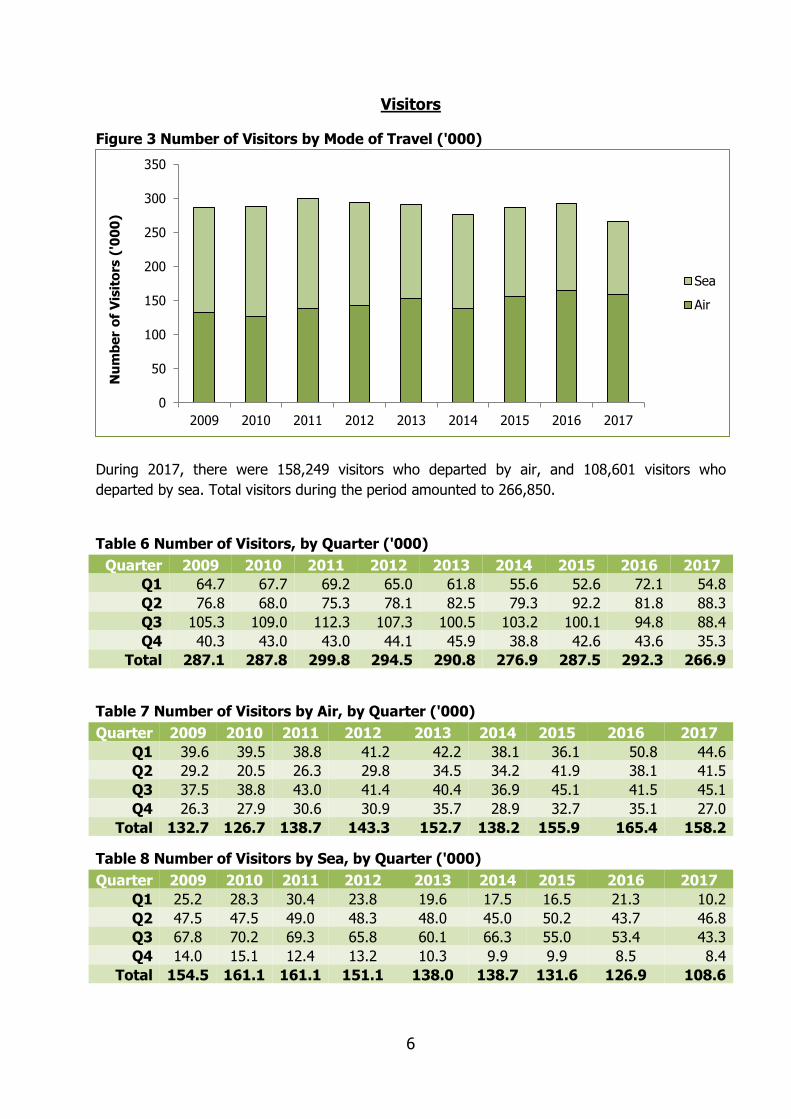
Figure 3 Number of Visitors by Mode of Travel ('000)
During 2017, there were 158,249 visitors who departed by air, and 108,601 visitors who
departed by sea. Total visitors during the period amounted to 266,850.
Table 6 Number of Visitors, by Quarter ('000)
Quarter 2009 2010 2011 2012 2013 2014 2015 2016 2017
Q1 64.7 67.7 69.2 65.0 61.8 55.6 52.6 72.1 54.8
Q2 76.8 68.0 75.3 78.1 82.5 79.3 92.2 81.8 88.3
Q3 105.3 109.0 112.3 107.3 100.5 103.2 100.1 94.8 88.4
Q4 40.3 43.0 43.0 44.1 45.9 38.8 42.6 43.6 35.3
Total 287.1 287.8 299.8 294.5 290.8 276.9 287.5 292.3 266.9
Table 7 Number of Visitors by Air, by Quarter ('000)
Quarter 2009 2010 2011 2012 2013 2014 2015 2016 2017
Q1 39.6 39.5 38.8 41.2 42.2 38.1 36.1 50.8 44.6
Q2 29.2 20.5 26.3 29.8 34.5 34.2 41.9 38.1 41.5
Q3 37.5 38.8 43.0 41.4 40.4 36.9 45.1 41.5 45.1
Q4 26.3 27.9 30.6 30.9 35.7 28.9 32.7 35.1 27.0
Total 132.7 126.7 138.7 143.3 152.7 138.2 155.9 165.4 158.2
Table 8 Number of Visitors by Sea, by Quarter ('000)
Quarter 2009 2010 2011 2012 2013 2014 2015 2016 2017
Q1 25.2 28.3 30.4 23.8 19.6 17.5 16.5 21.3 10.2
Q2 47.5 47.5 49.0 48.3 48.0 45.0 50.2 43.7 46.8
Q3 67.8 70.2 69.3 65.8 60.1 66.3 55.0 53.4 43.3
Q4 14.0 15.1 12.4 13.2 10.3 9.9 9.9 8.5 8.4
Total 154.5 161.1 161.1 151.1 138.0 138.7 131.6 126.9 108.6
0
50
100
150
200
250
300
350
2009 2010 2011 2012 2013 2014 2015 2016 2017
Nu
mb
er
of
Vis
ito
rs (
'00
0)
Sea
Air
7
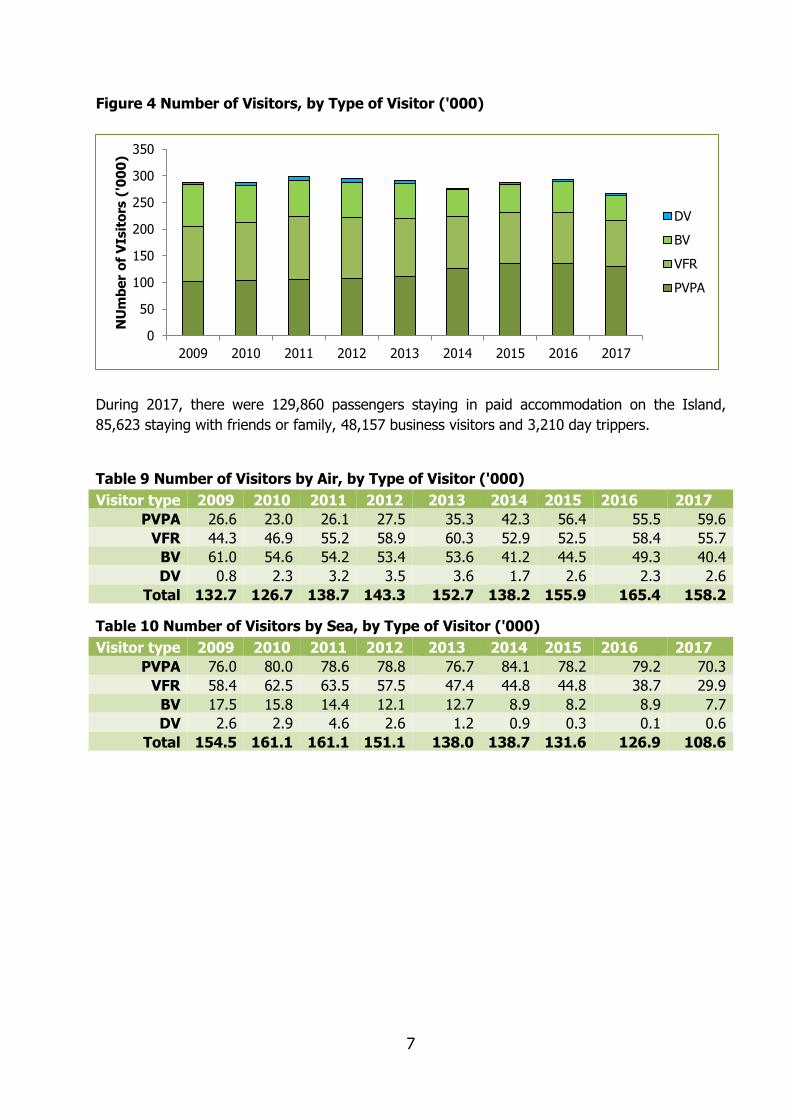
Figure 4 Number of Visitors, by Type of Visitor ('000)
During 2017, there were 129,860 passengers staying in paid accommodation on the Island,
85,623 staying with friends or family, 48,157 business visitors and 3,210 day trippers.
Table 9 Number of Visitors by Air, by Type of Visitor ('000)
Visitor type 2009 2010 2011 2012 2013 2014 2015 2016 2017
PVPA 26.6 23.0 26.1 27.5 35.3 42.3 56.4 55.5 59.6
VFR 44.3 46.9 55.2 58.9 60.3 52.9 52.5 58.4 55.7
BV 61.0 54.6 54.2 53.4 53.6 41.2 44.5 49.3 40.4
DV 0.8 2.3 3.2 3.5 3.6 1.7 2.6 2.3 2.6
Total 132.7 126.7 138.7 143.3 152.7 138.2 155.9 165.4 158.2
Table 10 Number of Visitors by Sea, by Type of Visitor ('000)
Visitor type 2009 2010 2011 2012 2013 2014 2015 2016 2017
PVPA 76.0 80.0 78.6 78.8 76.7 84.1 78.2 79.2 70.3
VFR 58.4 62.5 63.5 57.5 47.4 44.8 44.8 38.7 29.9
BV 17.5 15.8 14.4 12.1 12.7 8.9 8.2 8.9 7.7
DV 2.6 2.9 4.6 2.6 1.2 0.9 0.3 0.1 0.6
Total 154.5 161.1 161.1 151.1 138.0 138.7 131.6 126.9 108.6
0
50
100
150
200
250
300
350
2009 2010 2011 2012 2013 2014 2015 2016 2017
NU
mb
er
of
VIs
ito
rs (
'00
0)
DV
BV
VFR
PVPA
8
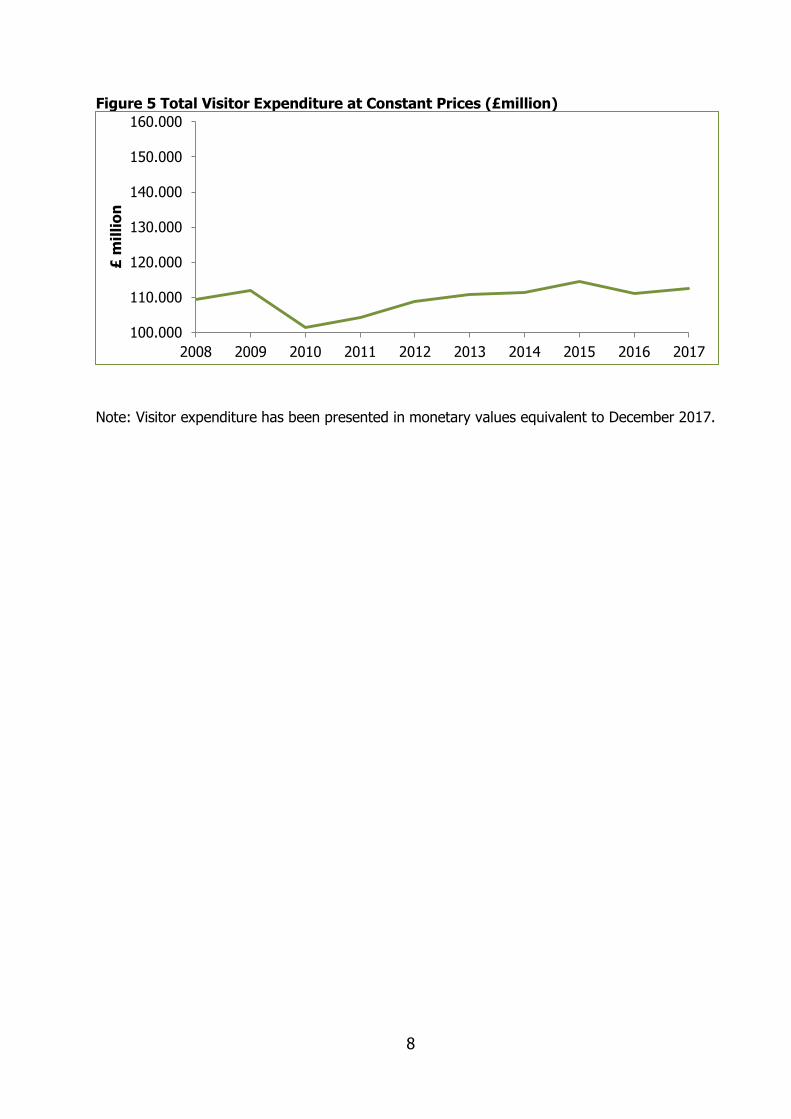
Figure 5 Total Visitor Expenditure at Constant Prices (£million)
Note: Visitor expenditure has been presented in monetary values equivalent to December 2017.
100.000
110.000
120.000
130.000
140.000
150.000
160.000
2008 2009 2010 2011 2012 2013 2014 2015 2016 2017
£ m
illi
on
9
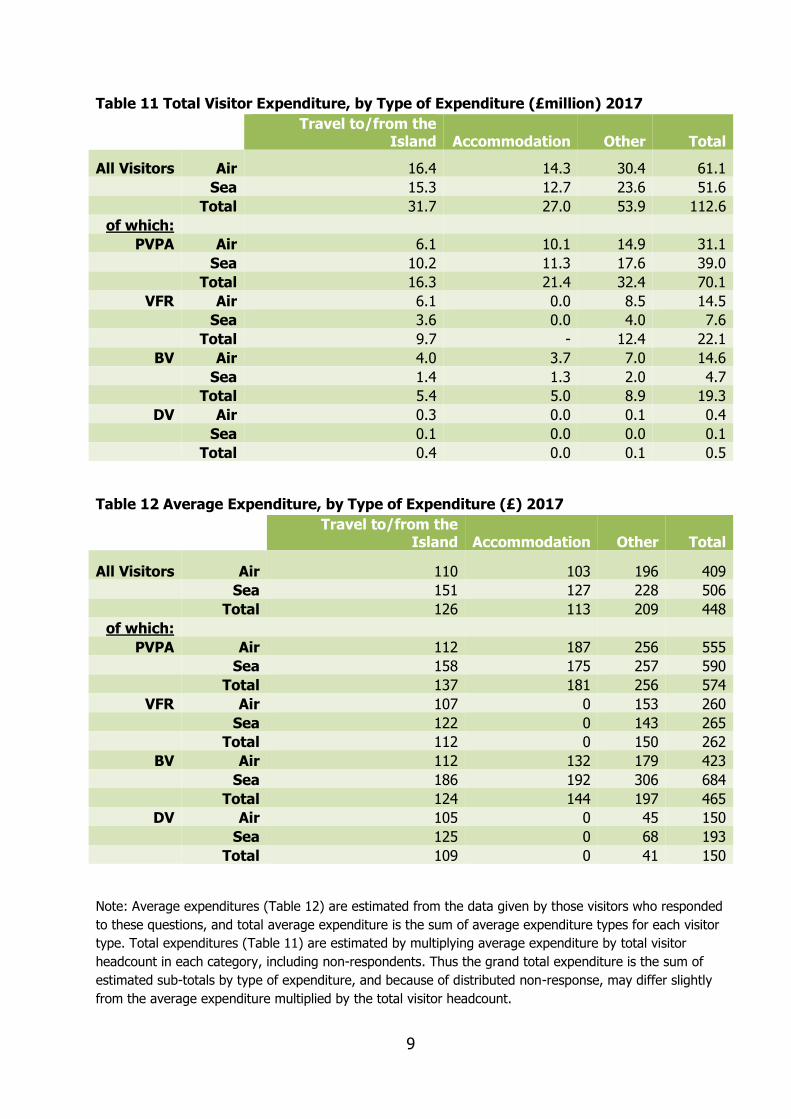
Table 11 Total Visitor Expenditure, by Type of Expenditure (£million) 2017
Travel to/from the Island Accommodation Other Total
All Visitors Air 16.4 14.3 30.4 61.1
Sea 15.3 12.7 23.6 51.6
Total 31.7 27.0 53.9 112.6
of which: PVPA Air 6.1 10.1 14.9 31.1
Sea 10.2 11.3 17.6 39.0
Total 16.3 21.4 32.4 70.1
VFR Air 6.1 0.0 8.5 14.5
Sea 3.6 0.0 4.0 7.6
Total 9.7 - 12.4 22.1
BV Air 4.0 3.7 7.0 14.6
Sea 1.4 1.3 2.0 4.7
Total 5.4 5.0 8.9 19.3
DV Air 0.3 0.0 0.1 0.4
Sea 0.1 0.0 0.0 0.1
Total 0.4 0.0 0.1 0.5
Table 12 Average Expenditure, by Type of Expenditure (£) 2017
Travel to/from the
Island Accommodation Other Total
All Visitors Air 110 103 196 409
Sea 151 127 228 506
Total 126 113 209 448
of which: PVPA Air 112 187 256 555
Sea 158 175 257 590
Total 137 181 256 574
VFR Air 107 0 153 260
Sea 122 0 143 265
Total 112 0 150 262
BV Air 112 132 179 423
Sea 186 192 306 684
Total 124 144 197 465
DV Air 105 0 45 150
Sea 125 0 68 193
Total 109 0 41 150
Note: Average expenditures (Table 12) are estimated from the data given by those visitors who responded
to these questions, and total average expenditure is the sum of average expenditure types for each visitor
type. Total expenditures (Table 11) are estimated by multiplying average expenditure by total visitor
headcount in each category, including non-respondents. Thus the grand total expenditure is the sum of
estimated sub-totals by type of expenditure, and because of distributed non-response, may differ slightly
from the average expenditure multiplied by the total visitor headcount.
10
Table 13 Number of Bed Nights 2017
Average Total
All Staying Visitors Air 4.8 771,082
(exc. DV) Sea 6.1 646,624
Total 5.3 1,417,705
of which: PVPA Air 4.3 256,118
Sea 5.9 408,421
Total 5.1 686,528
VFR Air 6.5 370,771
Sea 6.6 192,090
Total 6.5 555,895
BV Air 3.5 144,193
Sea 6.4 46,112
Total 3.9 190,305
Figure 6 Area of Residence (All Visitors) (%) 2017
England-North
East, 3.6
England-North
West, 28.8
England-
Yorks/Humberside,
0.0
England-Midlands,
14.1
England-East
Anglia, 3.2
England-South
East, 16.4
England-South
West, 5.8
Scotland, 3.6
N. Ireland, 3.7
S. Ireland, 4.2
Wales, 4.1
Channel Islands,
0.5
Other, 12.0
11
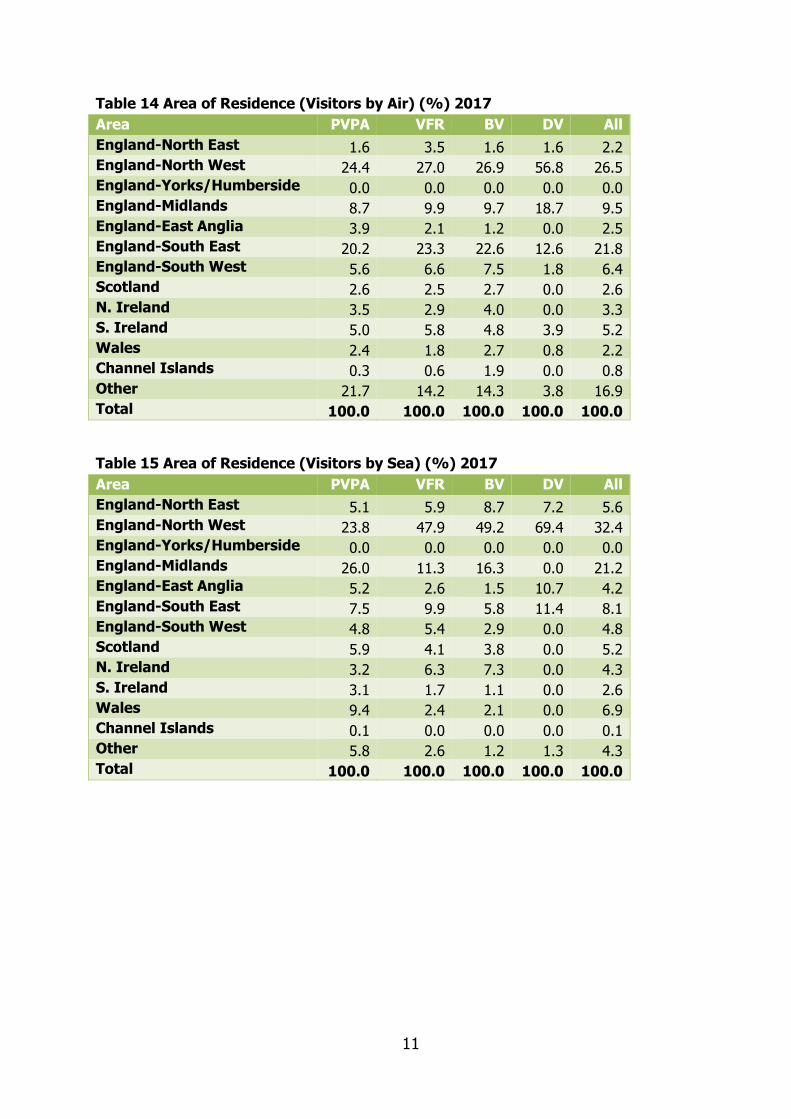
Table 14 Area of Residence (Visitors by Air) (%) 2017
Area PVPA VFR BV DV All
England-North East 1.6 3.5 1.6 1.6 2.2 England-North West 24.4 27.0 26.9 56.8 26.5 England-Yorks/Humberside 0.0 0.0 0.0 0.0 0.0 England-Midlands 8.7 9.9 9.7 18.7 9.5 England-East Anglia 3.9 2.1 1.2 0.0 2.5 England-South East 20.2 23.3 22.6 12.6 21.8 England-South West 5.6 6.6 7.5 1.8 6.4 Scotland 2.6 2.5 2.7 0.0 2.6 N. Ireland 3.5 2.9 4.0 0.0 3.3 S. Ireland 5.0 5.8 4.8 3.9 5.2 Wales 2.4 1.8 2.7 0.8 2.2 Channel Islands 0.3 0.6 1.9 0.0 0.8 Other 21.7 14.2 14.3 3.8 16.9 Total 100.0 100.0 100.0 100.0 100.0
Table 15 Area of Residence (Visitors by Sea) (%) 2017
Area PVPA VFR BV DV All
England-North East 5.1 5.9 8.7 7.2 5.6 England-North West 23.8 47.9 49.2 69.4 32.4 England-Yorks/Humberside 0.0 0.0 0.0 0.0 0.0 England-Midlands 26.0 11.3 16.3 0.0 21.2 England-East Anglia 5.2 2.6 1.5 10.7 4.2 England-South East 7.5 9.9 5.8 11.4 8.1 England-South West 4.8 5.4 2.9 0.0 4.8 Scotland 5.9 4.1 3.8 0.0 5.2 N. Ireland 3.2 6.3 7.3 0.0 4.3 S. Ireland 3.1 1.7 1.1 0.0 2.6 Wales 9.4 2.4 2.1 0.0 6.9 Channel Islands 0.1 0.0 0.0 0.0 0.1 Other 5.8 2.6 1.2 1.3 4.3 Total 100.0 100.0 100.0 100.0 100.0
12
Isle of Man Residents
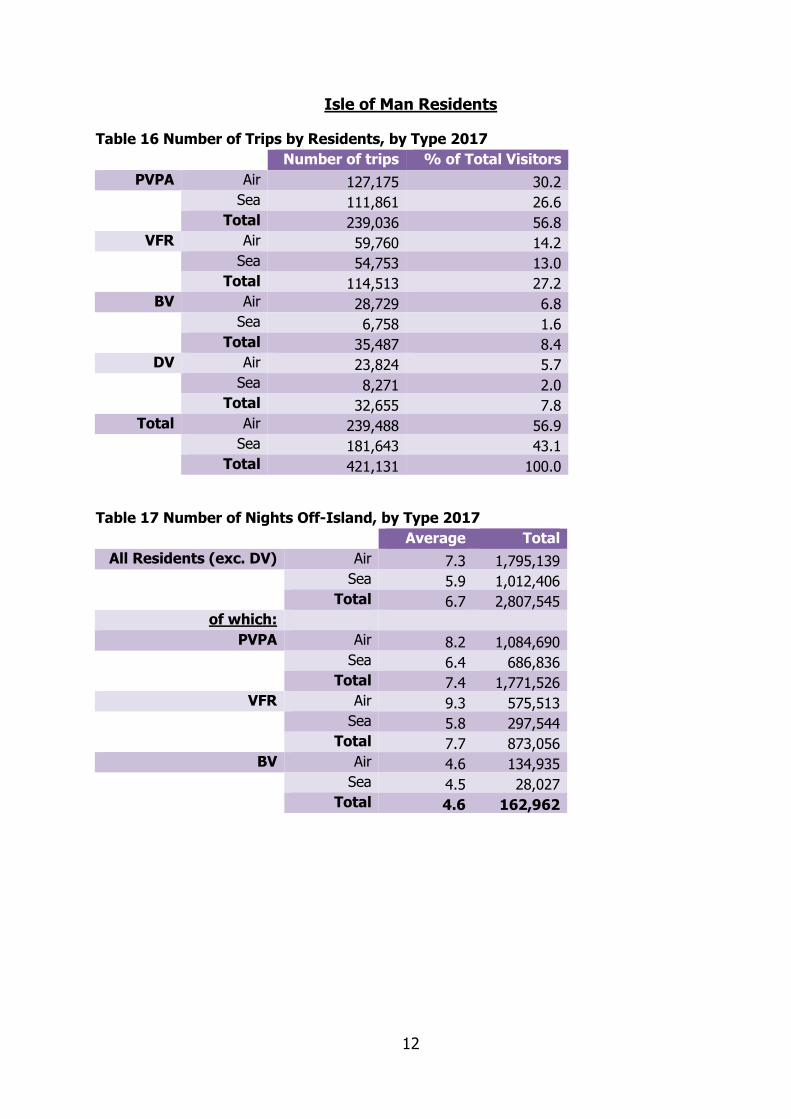
Table 16 Number of Trips by Residents, by Type 2017
Number of trips % of Total Visitors
PVPA Air 127,175 30.2
Sea 111,861 26.6
Total 239,036 56.8 VFR Air 59,760 14.2
Sea 54,753 13.0
Total 114,513 27.2 BV Air 28,729 6.8
Sea 6,758 1.6
Total 35,487 8.4 DV Air 23,824 5.7
Sea 8,271 2.0
Total 32,655 7.8 Total Air 239,488 56.9
Sea 181,643 43.1
Total 421,131 100.0
Table 17 Number of Nights Off-Island, by Type 2017
Average Total
All Residents (exc. DV) Air 7.3 1,795,139
Sea 5.9 1,012,406
Total 6.7 2,807,545 of which:
PVPA Air 8.2 1,084,690
Sea 6.4 686,836
Total 7.4 1,771,526 VFR Air 9.3 575,513
Sea 5.8 297,544
Total 7.7 873,056 BV Air 4.6 134,935
Sea 4.5 28,027
Total 4.6 162,962
13
Figure 7 Main Destination of Residents (All Residents) (%) 2017
Table 18 Main Destination of Residents (Air) (%) 2017
Destination PVPA VFR BV DV All
England-North East 1.0 1.4 0.7 1.2 1.1 England-North West 20.9 25.3 23.4 94.3 29.6 England-Yorks/Humberside 0.0 0.0 0.0 0.0 0.0 England-Midlands 3.7 8.1 4.2 0.1 4.5 England-East Anglia 0.5 1.0 1.4 0.7 0.7 England-South East 12.3 19.1 29.9 3.1 15.1 England-South West 2.9 3.8 7.3 0.0 3.4 Scotland 1.9 2.6 2.8 0.0 2.0 N. Ireland 1.3 2.7 1.6 0.1 1.5 S. Ireland 2.4 5.0 4.9 0.5 3.1 Wales 0.5 2.1 0.8 0.0 0.9 Channel Islands 0.3 0.5 2.5 0.0 0.6 Other 52.3 28.4 20.4 0.0 37.4 Total 100.0 100.0 100.0 100.0 100.0
Table 19 Main Destination of Residents (Sea) (%) 2017
Destination PVPA VFR BV DV All
England-North East 2.1 3.1 2.3 0.6 2.3
England-North
East, 1.6
England-North
West, 36.1
England-Midlands,
5.0 England-East
Anglia, 0.9 England-South
East, 10.3
England-South
West, 4.6
Scotland, 6.1
N. Ireland, 2.0
S. Ireland, 2.8
Wales, 3.2
Channel Islands,
0.4
Other, 27.0
14
England-North West 36.7 53.7 60.1 95.8 45.4 England-Yorks/Humberside 0.0 0.0 0.0 0.0 0.0 England-Midlands 5.3 6.8 11.3 0.3 5.8 England-East Anglia 0.9 0.7 8.2 0.0 1.1 England-South East 3.8 3.4 1.7 0.3 3.4 England-South West 7.4 5.4 6.9 0.0 6.5 Scotland 16.1 6.8 3.2 0.0 12.1 N. Ireland 1.4 5.9 1.4 0.0 2.7 S. Ireland 1.2 4.6 0.9 1.4 2.2 Wales 7.1 7.1 1.2 0.8 6.6 Channel Islands 0.0 0.1 0.0 0.0 0.0 Other 17.9 2.3 2.7 0.9 11.9 Total 100.0 100.0 100.0 100.0 100.0
15
Appendix I Sample Size by Category of Passenger and Quarter, 2017
RES PVPA VFR BV DV Total
January to April 2,323 170 536 402 25 3,456 May to June 658 369 196 145 17 1,385 July to September 1,843 519 382 199 12 2,955 October to December 1,971 158 311 192 11 2,643 Total 6,795 1,216 1,425 938 65 10,439
16
Appendix II Passenger Survey Questionnaire
1. Interviewer
2. Shift Code
3. May I ask you a few questions for the Island's Passenger Survey? The interview should only
take one or two minutes.
4. What is your destination?
Air - Belfast Air - Manchester
Air - Birmingham Air - Newcastle
Air - Blackpool Air - Southampton
Air - Bristol Air - London City
Air - Edinburgh Air - Jersey
Air - Dublin Air - Other
Air - Glasgow Sea - Belfast
Air - Leeds Sea - Heysham
Air - Liverpool Sea - Liverpool
Air - Gatwick Sea - Other
Air - Luton
5. How are you travelling?
1 Foot Passenger
2 With a Vehicle/Bike/Coach
6. Do you live in the Isle of Man?
1 Yes
2 No
7. (Residents only) What is the reason for travelling?
1 Holiday or visiting friends and family
2 Leaving IOM
3 Business
4 Hospital visit
8. (Residents leaving IOM only) What is your reason for leaving the Isle of Man?
1 New job off island
2 No work available on the island
3 Move closer to friends/family
4 Cost of living
5 Other
9. How many of you are travelling together?
Answer:
17
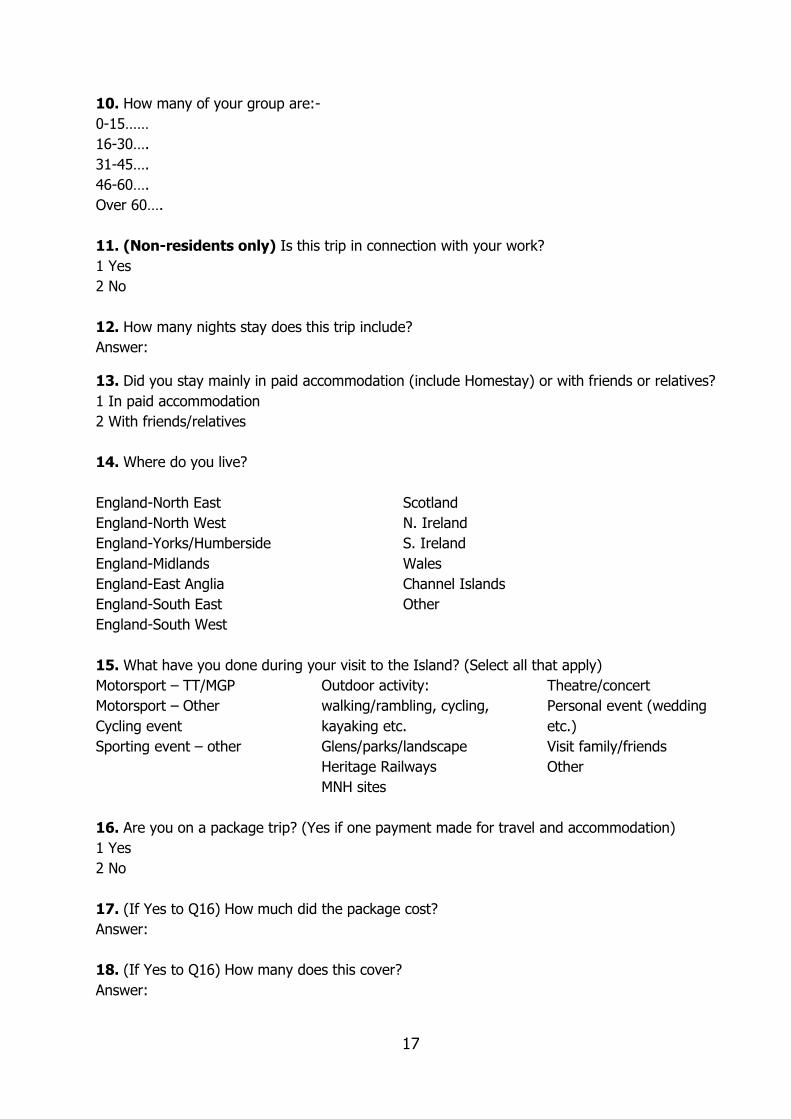
10. How many of your group are:-
0-15……
16-30….
31-45….
46-60….
Over 60….
11. (Non-residents only) Is this trip in connection with your work?
1 Yes
2 No
12. How many nights stay does this trip include?
Answer:
13. Did you stay mainly in paid accommodation (include Homestay) or with friends or relatives?
1 In paid accommodation
2 With friends/relatives
14. Where do you live?
England-North East Scotland
England-North West N. Ireland
England-Yorks/Humberside S. Ireland
England-Midlands Wales
England-East Anglia Channel Islands
England-South East Other
England-South West
15. What have you done during your visit to the Island? (Select all that apply)
Motorsport – TT/MGP
Motorsport – Other
Cycling event
Sporting event – other
Outdoor activity:
walking/rambling, cycling,
kayaking etc.
Glens/parks/landscape
Heritage Railways
MNH sites
Theatre/concert
Personal event (wedding
etc.)
Visit family/friends
Other
16. Are you on a package trip? (Yes if one payment made for travel and accommodation)
1 Yes
2 No
17. (If Yes to Q16) How much did the package cost?
Answer:
18. (If Yes to Q16) How many does this cover?
Answer:
1
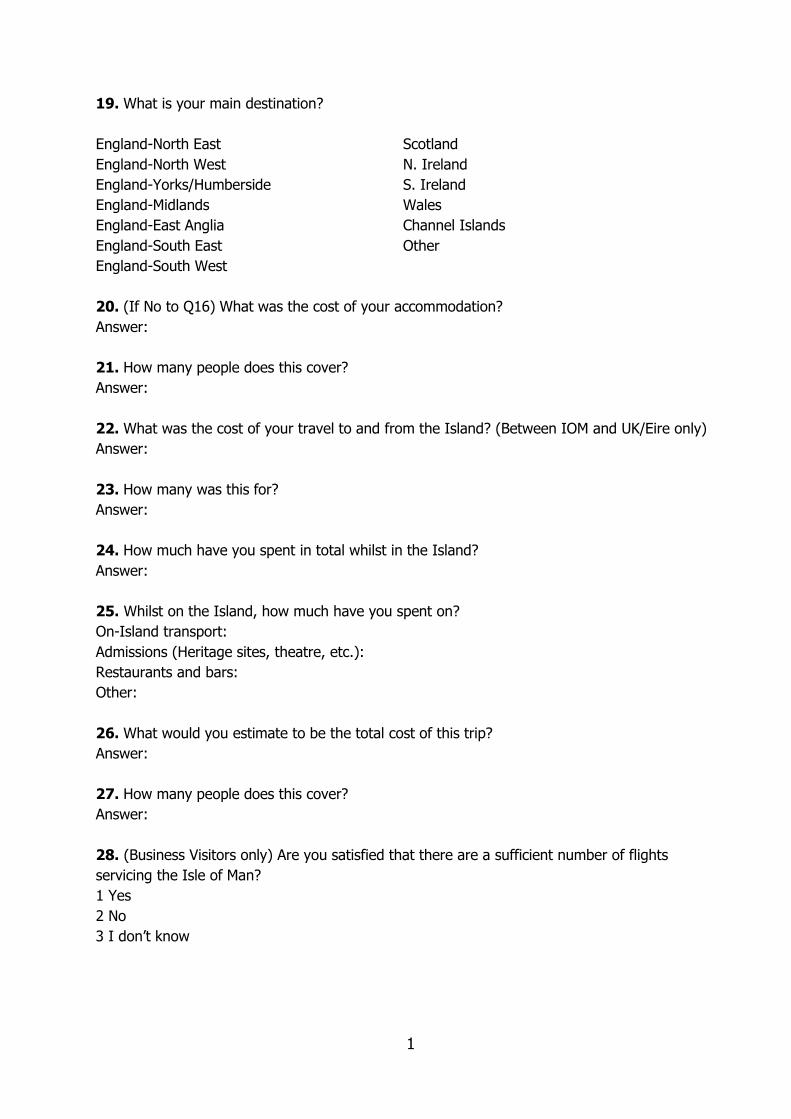
19. What is your main destination?
England-North East Scotland
England-North West N. Ireland
England-Yorks/Humberside S. Ireland
England-Midlands Wales
England-East Anglia Channel Islands
England-South East Other
England-South West
20. (If No to Q16) What was the cost of your accommodation?
Answer:
21. How many people does this cover?
Answer:
22. What was the cost of your travel to and from the Island? (Between IOM and UK/Eire only)
Answer:
23. How many was this for?
Answer:
24. How much have you spent in total whilst in the Island?
Answer:
25. Whilst on the Island, how much have you spent on?
On-Island transport:
Admissions (Heritage sites, theatre, etc.):
Restaurants and bars:
Other:
26. What would you estimate to be the total cost of this trip?
Answer:
27. How many people does this cover?
Answer:
28. (Business Visitors only) Are you satisfied that there are a sufficient number of flights
servicing the Isle of Man?
1 Yes
2 No
3 I don’t know
2
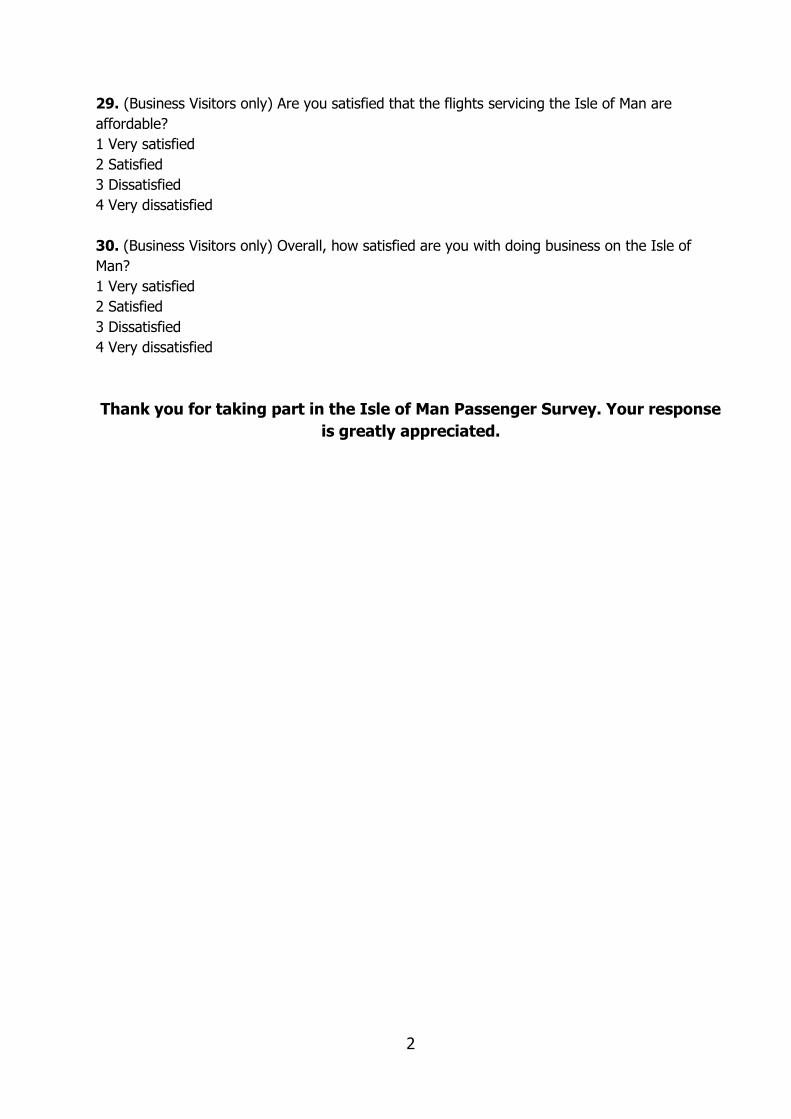
29. (Business Visitors only) Are you satisfied that the flights servicing the Isle of Man are
affordable?
1 Very satisfied
2 Satisfied
3 Dissatisfied
4 Very dissatisfied
30. (Business Visitors only) Overall, how satisfied are you with doing business on the Isle of
Man?
1 Very satisfied
2 Satisfied
3 Dissatisfied
4 Very dissatisfied
Thank you for taking part in the Isle of Man Passenger Survey. Your response
is greatly appreciated.

This document can be provided in large print and audio tape on request
Copyright
Isle of Man Government