Embed Size (px)
Citation preview
High-Arctic SurveyingLiDAR for geomorphology
Oil & Gas InfrastructurePipeline data and safety
Flood OpeningsCertifications are key
MAY 2018
ISlAnD
Using the latest technology to advance geomorphology research
LiDAR IN THE HIGH-ARCTIC
Displayed with permission • The American Surveyor • May 2018 • Copyright 2018 Cheves Media • www.Amerisurv.com
T he newest generation of tripod and mobile LiDAR scanning systems offer the ability to measure surface topography in unprecedented detail. Although LiDAR has been used for decades in geomorphology studies (primarily airborne and tripod systems), mobile LiDAR systems are only just beginning
to be used. In the summers of 2016 and 2017 researchers from the University of Western Ontario and the Finnish Geospatial Research Institute, together with industry support from Teledyne Optech, set out to the Canadian High Arctic to map and survey a wide-range of geomorphologic features unique to permafrost terrains. These geologic features offer analytical challenges not commonly encountered in mobile mapping surveys.
Over the course of 3 expeditions in the extreme Canadian High Arctic environment on Devon Island and Axel Heiberg Island we field tested 3 different LiDAR systems and evaluated their use for different geomorphologic measurements. We used the Optech Polaris Terrestrial Laser Scanner (TLS), the Optech Maverick Mobile Mapping System (MMS), and the AkHkA-R3 Kinematic LiDAR System (KLS) prototype scanner developed at the Finnish Geospatial Research Institute. Each instrument produced high-quality data, yielding more than 400Gb of mobile and TLS LiDAR data, but highlighted the importance of choosing the right tool for the job.
Our efforts have produced the highest-ever resolution digital terrain models of enigmatic patterned ground, ice-wedge polygons, and erosional gully systems. Mobile mapping of this terrain also means that DEMs of ultra-high resolution have been created over huge surface areas, facilitating new approaches to scientific research in geomorphology.
The aim of the expeditions was to advance our fundamental understand-ing of permafrost processes over large areas. As the Arctic climate warms, our understanding of changes within permafrost systems needs to be more complete, and the rapid data-acquisition and ever-higher point density and precision from mobile LiDAR systems can help monitor these changes over time. This has implications for understanding how to build better buildings and roads in the Canadian North as climate warms and ground ice melts. Understanding how these systems change over time will also address challenges with building permanent structures in permafrost terrain.
» MICHAEL ZANETTI, ANTERO KUKKO, CATHERINE NEISH, & GORDON OSINSKI
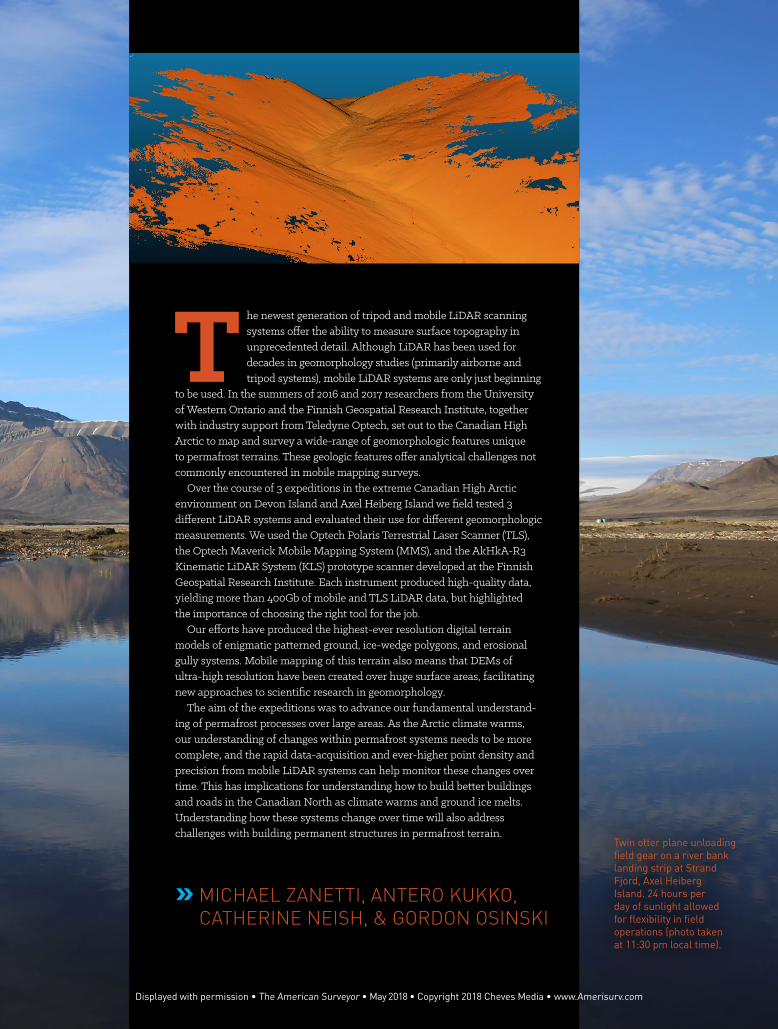
Twin otter plane unloading field gear on a river bank landing strip at Strand Fjord, Axel Heiberg Island. 24 hours per day of sunlight allowed for flexibility in field operations (photo taken at 11:30 pm local time).
Displayed with permission • The American Surveyor • May 2018 • Copyright 2018 Cheves Media • www.Amerisurv.com
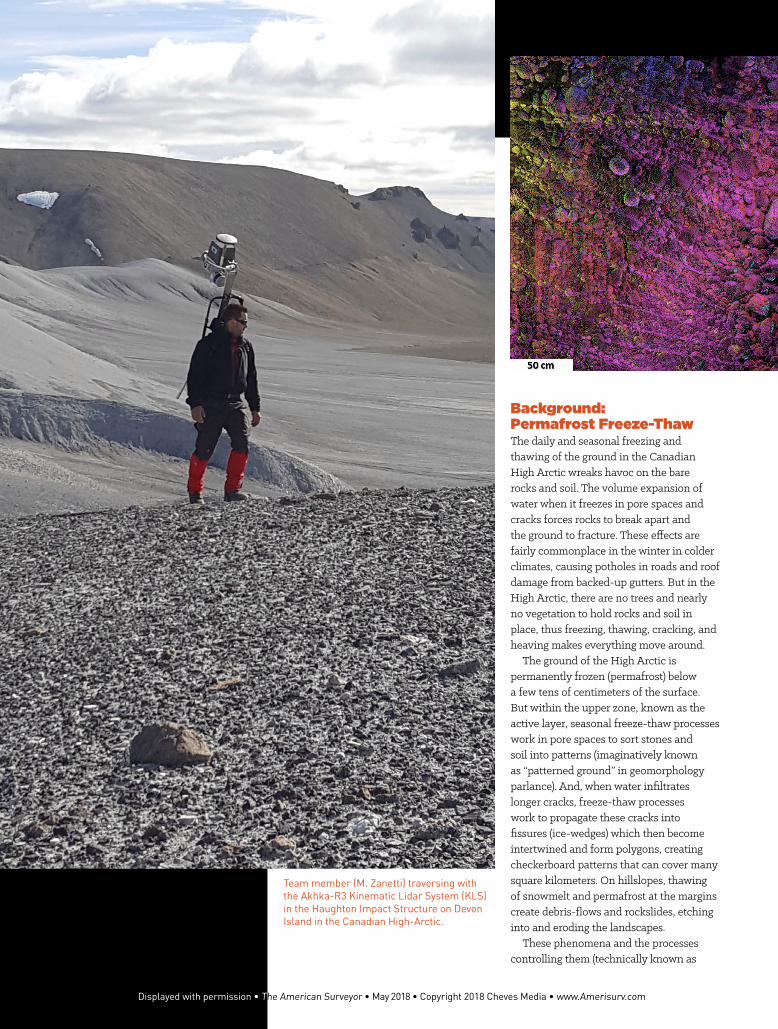
Background: Permafrost Freeze-ThawThe daily and seasonal freezing and thawing of the ground in the Canadian High Arctic wreaks havoc on the bare rocks and soil. The volume expansion of water when it freezes in pore spaces and cracks forces rocks to break apart and the ground to fracture. These effects are fairly commonplace in the winter in colder climates, causing potholes in roads and roof damage from backed-up gutters. But in the High Arctic, there are no trees and nearly no vegetation to hold rocks and soil in place, thus freezing, thawing, cracking, and heaving makes everything move around.
The ground of the High Arctic is permanently frozen (permafrost) below a few tens of centimeters of the surface. But within the upper zone, known as the active layer, seasonal freeze-thaw processes work in pore spaces to sort stones and soil into patterns (imaginatively known as “patterned ground” in geomorphology parlance). And, when water infiltrates longer cracks, freeze-thaw processes work to propagate these cracks into fissures (ice-wedges) which then become intertwined and form polygons, creating checkerboard patterns that can cover many square kilometers. On hillslopes, thawing of snowmelt and permafrost at the margins create debris-flows and rockslides, etching into and eroding the landscapes.
These phenomena and the processes controlling them (technically known as
Team member (M. Zanetti) traversing with the Akhka-R3 Kinematic Lidar System (KLS) in the Haughton Impact Structure on Devon Island in the Canadian High-Arctic.
Displayed with permission • The American Surveyor • May 2018 • Copyright 2018 Cheves Media • www.Amerisurv.com
periglacial features and processes) have been known and described since the early 1900’s, with pioneering work detailing patterned ground coming in the 1950’s – 1970’s. But the characterization of these phenomena
(measuring diameter, spacing, trough-depth, and other morphometric parameters) were done with painstaking and unsophisticated manual measurements. For example, year-on-year and decadal changes were measured using marked sticks shoved into the ground. The time-intensive nature of the measurements meant that only small areas could be investigated, mostly in isolation from nearby features.
Now, using ground-based LiDAR scan-ning, and in particular ultra-high resolution mobile LiDAR scanning techniques, it is possible to study these systems in unprece-dented detail and over areas that would have been unimaginable a few decades ago. The speed and repeatability of LiDAR scanning means: 1) more area is covered, which allows
for study of the interplay between different morphologic features and processes, 2) less time is required, which allows for researchers to do different experiments or measure-ments, and 3) inter-season or year-on-year change detection is possible, which allows for the determination of rates-of-change and the effects of small perturbations not captured in long-duration investigations.
Science Investigations LiDAR data is being used by our team for a wide range of science investigations. Our main projects involved surveying and map-ping patterned ground, ice-wedge polygons,
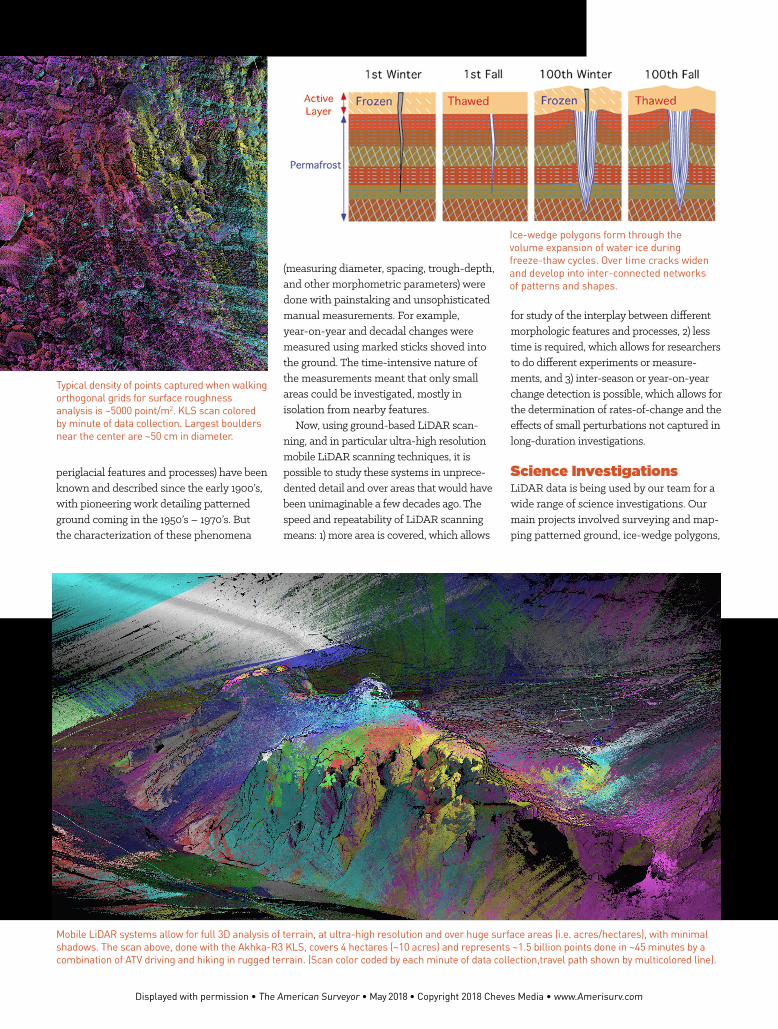
Mobile LiDAR systems allow for full 3D analysis of terrain, at ultra-high resolution and over huge surface areas (i.e. acres/hectares), with minimal shadows. The scan above, done with the Akhka-R3 KLS, covers 4 hectares (~10 acres) and represents ~1.5 billion points done in ~45 minutes by a combination of ATV driving and hiking in rugged terrain. (Scan color coded by each minute of data collection,travel path shown by multicolored line).
Typical density of points captured when walking orthogonal grids for surface roughness analysis is ~5000 point/m2. KLS scan colored by minute of data collection. Largest boulders near the center are ~50 cm in diameter.
Ice-wedge polygons form through the volume expansion of water ice during freeze-thaw cycles. Over time cracks widen and develop into inter-connected networks of patterns and shapes.
Displayed with permission • The American Surveyor • May 2018 • Copyright 2018 Cheves Media • www.Amerisurv.com

debris flows and channeled slopes, and sub-glacial drainage channels in order to measure various morphometric parameters (length, width, diameter, depth, etc.). These data are used in concert with ground probe data, geologic mapping, and remote-sensing datasets to interpret the underlying geologic processes acting to shape the landscape. Looking forward to future expeditions planned in 2018 and 2019 (and with other LiDAR data collected over the past decade), we will measure small scale year-on-year changes to establish rates of change for these systems.
The individual scanning sites are also part of an overarching project aimed at using remote predictive mapping techniques to explore the geology of the Canadian High Arctic. The prohibitive cost and logistical challenges of geologic mapping with field geologists in remote areas means that many areas have never been studied. We are using integrated remote-sensing datasets (e.g. LANDSAT-8, ASTER, RADARSAT-2, Quickbird, etc.) to identify sites of interest for ground-truth field campaigns. The characteristics of these sites (e.g., composition, roughness, topog-
raphy) allow for educated interpolation of geology over large regions, with particular interest in economically viable ores. The high-resolution LiDAR topography helps us understand and interpret the satellite radar backscattering signals because we can now accurately measure the surface roughness at length scales below the radar wavelength, and over areas on the ground large enough to cover multiple radar image pixels.
Our Field Sites We mapped more than 50 sites of interest on two of the largest islands in the Canadian Arctic Archipelago: Devon Island and Axel Heiberg Island. On Devon Island, the largest uninhabited island in the world, our primary field site was located within the Haughton Impact Structure, a well-preserved 24 million year old, ~23 km diameter impact crater. On Axel Heiberg Island we were based out of Strand Fiord, a glacier carved valley known for salt tectonics and mineral springs. The two islands offer stark contrast to one another, with Axel Heiberg
dominated by mountain peaks and temperate glaciers and Devon Island dominated by desolate, unvegetated plateaus.
To get to our respec-tive basecamps on the islands we flew in with
Axel Heiberg team members (G. Osinski, M. Zanetti, E. Harrington). A custom backpack rig was made for the Teledyne Optech Maverick mobile scanner.
Above: Ice-wedge polygons on a hillslope on Axel Heiberg Island scanned using an Optech Maverick mounted in a custom backpack frame. Right: Gullies carved into a hillslope on Devon Island scanned with the Optech Polaris TLS. All LiDARs survived the environment and their fair-share of abuse during field transport.
Displayed with permission • The American Surveyor • May 2018 • Copyright 2018 Cheves Media • www.Amerisurv.com
all of our gear on Twin Otter aircraft from Resolute Bay, a community of ~200 people and home to the Polar Continental Shelf Program logistics facility. This included a few Kawasaki Bayou 200 ATVs (on Devon) and two mountain bikes equipped with fat tires (on Axel Heiberg). The provided means for getting to local sites, but we also had ~6 total days of helicopter time to shuttle us to more distant sites. We bunked in individual tents and shared a common “Space-dome” tent and a separate cooking tent. On these large scientific expeditions we had some amenities, including a proper touch-screen desktop computer (for planning, uploading data each night, and discussion, plus a movie when the weather turned awful). Equipment was stored in a separate tent.
The weather at this high latitude is variable, but surprisingly not as frigid as one thinks when they hear “polar” research. Temperatures hovered around 1-5°C (32-41°F), with some days above 10°C (50°F). Drizzle and cloud cover were frequent, slowing data collection, but fresh snowfall was rare. The greatest benefit to Arctic research in the
summer is the 24-hour sunlight, allowing for scanning at all times. If poor weather affected some part of the day we could always pick up the time later. My partner and I would often head out for several hours of scanning at midnight, since this seemed to be the time of day when the sun liked to shine.
Because we were in such remote and rugged terrain, the instruments were subjected to the cold nearly constantly. This affected battery life a bit, but not too much. The cold did, however, impact our daily routine when loading up the scanners for field surveys. Cold sinking the instruments overnight meant that we needed to bring them into the communal tent after breakfast to “get some heat in them”. We would hook them up to direct power while we loaded our ATVs and got water for the day. This typically let us hit the ground running when we got to our first site, but on more than one occasion we lost data collection opportunities. Embarrassingly, more than one site was lost when the lens-cap was left on for a scan. Normally this could be laughed off, but it’s less funny when you’ve
just hiked 2 km traversing a 100 m x 100 m grid carrying a 20 kg (45 lbs) pack. One team member earned the nickname “Lens-cap” for repeated absent-mindedness.
Data Collection and ProcessingData collection methods varied by instru-ment and the features of interest. Flat ground sites, like those used for morphology of patterned ground and surface roughness analyses were most often done with the mobile systems (Optech Maverick and Akhka-R3), although some multi-look tripod scans were done in areas when the mobile systems were already deployed. To collect the mobile data we built a custom backpack mount for the Maverick instru-ment; the Akhka-R3 is designed to be a permanent backpack-mounted instrument. Ground scans took about 15 mins each and were done by mapping out and flagging a 50 m x 50 m (or larger) box and traversing back and forth in a grid to saturate the point clouds and minimize shadows. It is from these scans that we achieved the
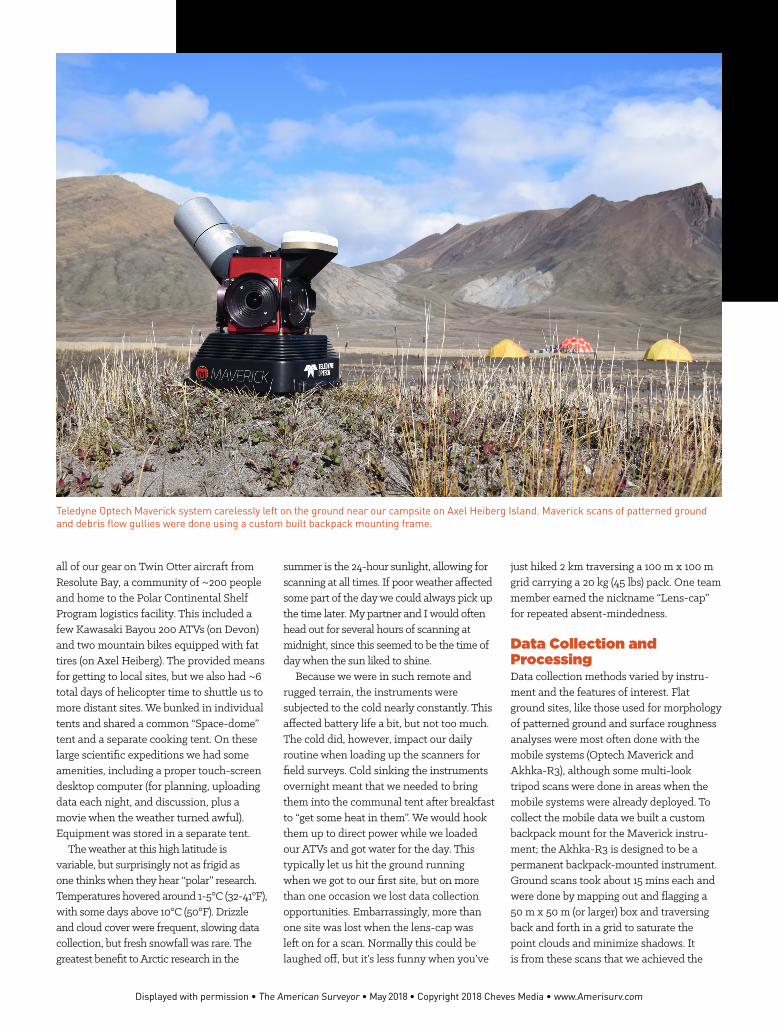
Teledyne Optech Maverick system carelessly left on the ground near our campsite on Axel Heiberg Island. Maverick scans of patterned ground and debris flow gullies were done using a custom built backpack mounting frame.
Displayed with permission • The American Surveyor • May 2018 • Copyright 2018 Cheves Media • www.Amerisurv.com
1 – 2 cm/pixel highest resolution DEMS. Mobile processing was done using the Distillery software for the Maverick, or by a combination of Novatel Inertial Explorer, Riegl proprietary software, and TerraSolid programs (for processing operator and laser trajectories and point cloud matching for the Akhka-R3). Although some analysis for our purposes could be done directly with the point clouds, georeferenced DEMs were created from .LAS files in ESRI’s ArcMap (10.4.1) for integration with other remote-sensing datasets. The major
difference between the Maverick and Akhka-R3 instruments was found to be with the laser scanner (Velodyne HDL-32E vs Riegl VUX-1HA, respectively), affecting the corresponding point cloud density, scanning range (~75 m) , and final DEM resolution. For mapping grade (~20 cm/pixel) requirements the Maverick produced excellent ground data. Higher resolution (<2 cm/pixel) near-survey grade measurements were made with the Akhka-R3 (which is a similar system to the commercial ROBIN-precision system from 3D Laser Mapping).
Debris slopes and large rock outcrops were best analyzed by the tripod-mounted TLS sys-tems (e.g., Optech Polaris TLS), where we scanned kilometers long plateau faces with multiple scans. As part of a multi-year study of gully erosion, many of the TLS scans taken during these expeditions were also of areas where we had existing
Photo caption to go here. Photo caption to go here. Photo caption to go here. Photo caption to go here. Photo caption to go here. Photo caption to go here. Photo caption to go here.
Polar bear footprints preserved in fresh mud near our Devon Island campsite. Although bear encounters are rare, all expedition members have firearms training and carry rifles on sorties. Note the operators footprints to the right of the bear tracks.
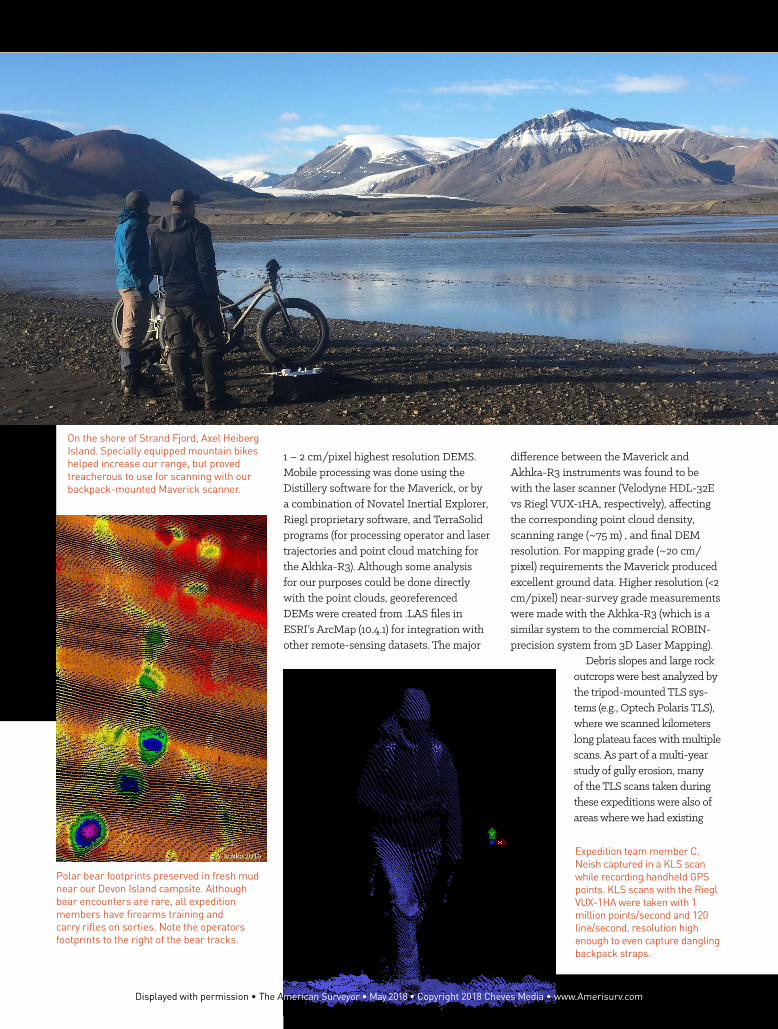
Expedition team member C. Neish captured in a KLS scan while recording handheld GPS points. KLS scans with the Riegl VUX-1HA were taken with 1 million points/second and 120 line/second, resolution high enough to even capture dangling backpack straps.
On the shore of Strand Fjord, Axel Heiberg Island. Specially equipped mountain bikes helped increase our range, but proved treacherous to use for scanning with our backpack-mounted Maverick scanner.
Displayed with permission • The American Surveyor • May 2018 • Copyright 2018 Cheves Media • www.Amerisurv.com
Optech Ilris TLS scans. Polaris TLS scans were processed using ATLAScan software for point cloud merging and georeferencing, and exported to ArcMap for DEMs.
Owing to the longer range of the Riegl VUX-1HA scanner on the Akhka – R3 mobile system, we had great success mapping the same gully systems as the Polaris, with reduced shadowing. This increased coverage came at the expense of increased time and energy (from strenuous hiking) to do these scans, but did provide more uniform resolution. We also tested using the backpack scanners while driving on ATVs (Akhka-R3) and while biking (Maverick). Since the backpack scanners are top-heavy, this made for very uncomfortable scanning, but the results proved reasonable. The terrain was very rough, so the final point clouds were a bit noisier for the vehicle traverses.
Most areas were also photographed with UAV drones or cameras integrated with the systems. However, we have found that integrated imagery is less useful for analyses than anticipated and are best suited for general context use.
ConclusionThe ultra-high resolution of the newest generation LiDAR is critical to advancing geomorphologic studies. Because the technol-ogy is so new, and the data returned orders of magnitude higher in resolution than anything previous, we (scientists) are just now devising ways to analyze and interpret the data, and use it to its fullest potential. ◾
Dr. Michael Zanetti is a post-doctoral associate at the University of Western Ontario specializing comparative planetary geomor-phology and the integration of ground-based LiDAR with satellite remote-sensing data.
Dr. Antero Kukko works for the Finnish Geospatial Research Institute as a research manager and is an adjunct professor in the Department of Built Environment, Aalto University, Finland. His research is focused on the development and application of mobile/ kinematic laser scanning.
Dr. Catherine Neish is an Assistant Professor of Earth Sciences at the University of Western Ontario. She is an expert in the use of orbital radar observations to study the geology of planetary surfaces, with a particular focus on processes related to impact cratering and volcanism.
Dr. Gordon “Oz” Osinski is an Associate Professor and the NSERC/MDA/CSA/ CEMI Industrial Research Chair in Earth and Space Exploration in the Departments of Earth Sciences and Physics and Astronomy at the University of Western Ontario, Canada. He holds a PhD and BSc (Hons) in geology and has spent the past 20 years conducting fieldwork on several continents with a focus on understand-ing the processes that shape the surface of the Earth and other terrestrial planets.
Acknowledgements: The authors wish to acknowledge funding and support from: The University of Western Ontario, Finnish Geospatial Research Institute and the Academy of Finland (CoE-LaSR and 300066), NSERC Discovery Accelerator Supplement (C. Neish), NSERC Engage Grants for Universities (C. Neish), NSERC Discovery Grant Northern Supplement (G. Osinski), The Polar Continental Shelf Program (PCSP) for logistical support in the Arctic, and our colleagues in the field.
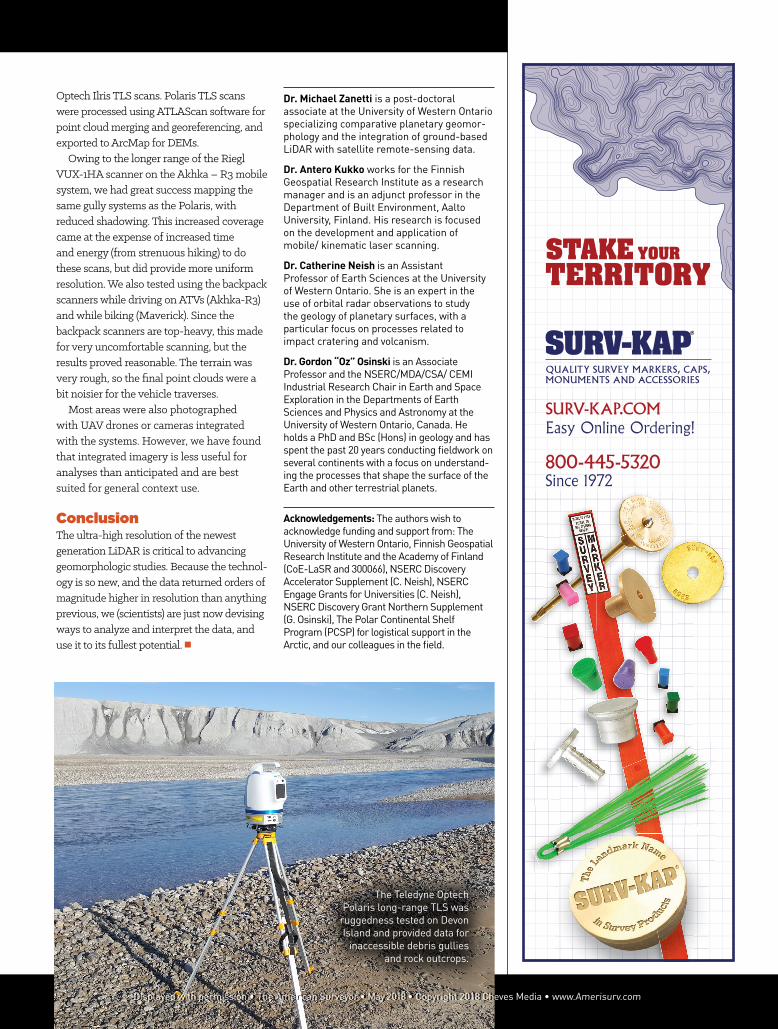
The Teledyne Optech Polaris long-range TLS was
ruggedness tested on Devon Island and provided data for
inaccessible debris gullies and rock outcrops.
STAKE YOUR
TERRITORY
SURV-KAP.COMEasy Online Ordering!
800-445-5320Since 1972
QUALITY SURVEY MARKERS, CAPS,MONUMENTS AND ACCESSORIES
Displayed with permission • The American Surveyor • May 2018 • Copyright 2018 Cheves Media • www.Amerisurv.comDisplayed with permission • The American Surveyor • May 2018 • Copyright 2018 Cheves Media • www.Amerisurv.com
![FieldNotes Contemplating Cooley - The American Surveyorarchive.amerisurv.com/PDF/TheAmericanSurveyor... · FieldNotes Contemplating Cooley he surveyor should inquire when [occupa-tion]](https://img.pdfslide.us/doc/110x75/5f62fd2b62d5395cbe79d64a/fieldnotes-contemplating-cooley-the-american-fieldnotes-contemplating-cooley-he.jpg)