Embed Size (px)
Citation preview
1
Adventure for All
Produced For: Copeland Associates Managers
College of BusinessOhio University
Prepared By:Team 7Mid 101
Cameron Huey
David Young
Nick Winnenberg
Jack Summers
Christopher Laux
2
Overview................................................................................................ 3
Environmental Analysis ..........................................................................5
Macro-environment..........................................................5
Local Environment.............................................................6
Key Success Factors .......................................................... 7
Competition……………………………………………………………………8
Strategy………………………………………………………………………………………………9
Mission / Vision………………………………………………………………9
S.M.A.R.T. Goals………………………………………………………………9
Objectives……………………………………………………………………….9
Marketing…………………………………………………………………………………………..10
Timeline………………………………………………………………………….11
STP………………………………………………………………………………….12
4 P’s…………………………………………………………………………………13
Information Software …………………………………………………………………………14
Demand Scenarios………………………………………………………………………………15
Secondary……………………………………………………………………….15
Primary…………………………………………………………………………..16
Financial Projection…………………………………………………………………………….18
Table of Contents
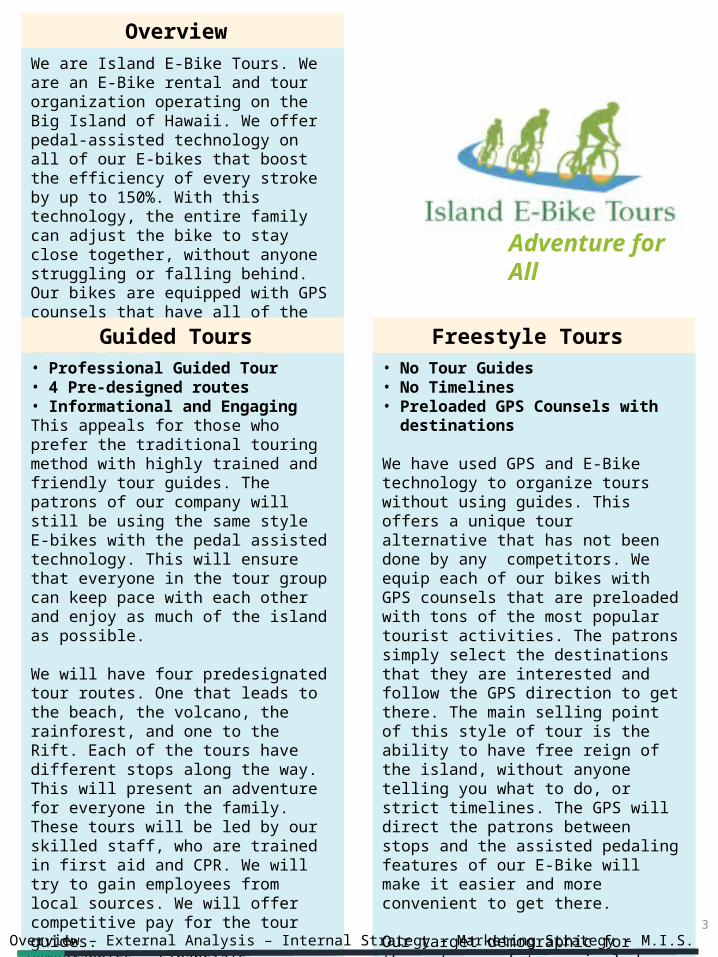
We are Island E-Bike Tours. We are an E-Bike rental and tour organization operating on the Big Island of Hawaii. We offer pedal-assisted technology on all of our E-bikes that boost the efficiency of every stroke by up to 150%. With this technology, the entire family can adjust the bike to stay close together, without anyone struggling or falling behind. Our bikes are equipped with GPS counsels that have all of the wonderful tourist destinations already pre-loaded on the machine, ensuring that you will have the best adventure possible!
Overview
• No Tour Guides• No Timelines• Preloaded GPS Counsels with destinations
We have used GPS and E-Bike technology to organize tours without using guides. This offers a unique tour alternative that has not been done by any competitors. We equip each of our bikes with GPS counsels that are preloaded with tons of the most popular tourist activities. The patrons simply select the destinations that they are interested and follow the GPS direction to get there. The main selling point of this style of tour is the ability to have free reign of the island, without anyone telling you what to do, or strict timelines. The GPS will direct the patrons between stops and the assisted pedaling features of our E-Bike will make it easier and more convenient to get there.
Our target demographic for these types of tours include young travelers and those who want to have some privacy. (Young newlyweds and college vacationers.)
Freestyle Tours Guided Tours • Professional Guided Tour • 4 Pre-designed routes• Informational and EngagingThis appeals for those who prefer the traditional touring method with highly trained and friendly tour guides. The patrons of our company will still be using the same style E-bikes with the pedal assisted technology. This will ensure that everyone in the tour group can keep pace with each other and enjoy as much of the island as possible.
We will have four predesignated tour routes. One that leads to the beach, the volcano, the rainforest, and one to the Rift. Each of the tours have different stops along the way. This will present an adventure for everyone in the family. These tours will be led by our skilled staff, who are trained in first aid and CPR. We will try to gain employees from local sources. We will offer competitive pay for the tour guides.
Our target demographic for this operation is families. Typically adults who travel to Hawaii with kids want to experience the island, and what better way to do this then on one of our E-Bikes to ensure that no one gets left behind.
3
Adventure for All
Overview – External Analysis – Internal Strategy – Marketing Strategy – M.I.S. – Demographics – Financials
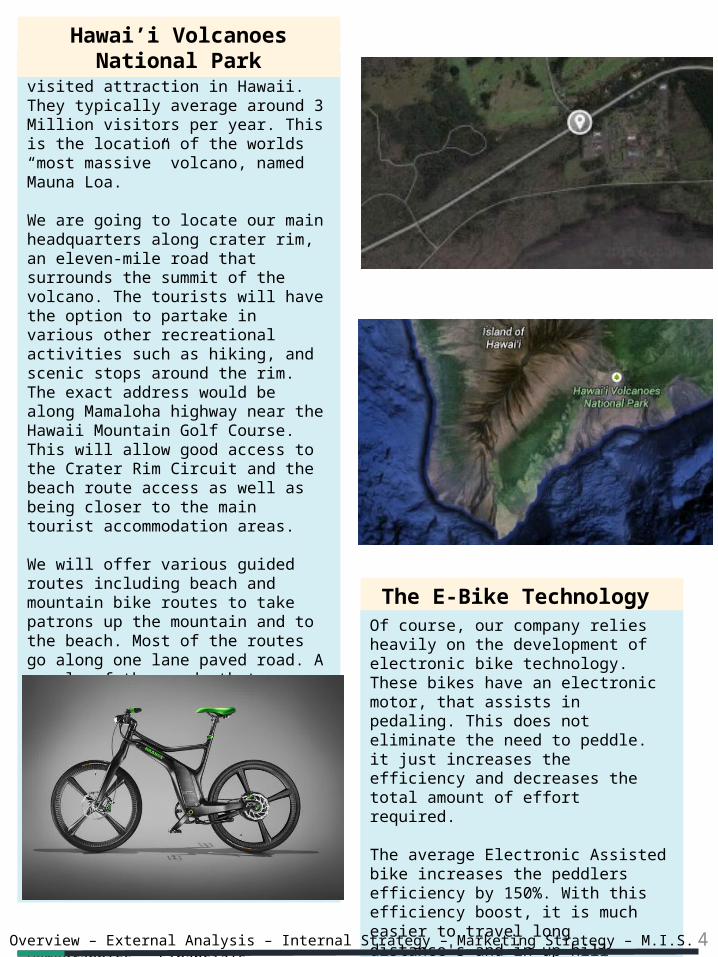
This National Park is the most visited attraction in Hawaii. They typically average around 3 Million visitors per year. This is the location of the worlds “most massive” volcano, named Mauna Loa.
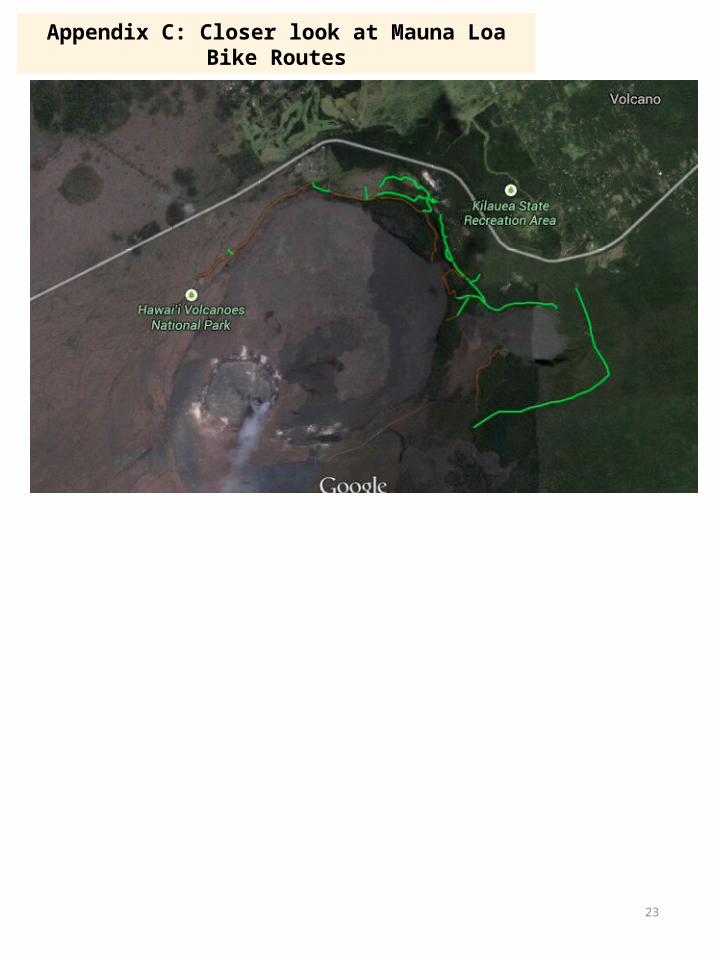
We are going to locate our main headquarters along crater rim, an eleven-mile road that surrounds the summit of the volcano. The tourists will have the option to partake in various other recreational activities such as hiking, and scenic stops around the rim. The exact address would be along Mamaloha highway near the Hawaii Mountain Golf Course. This will allow good access to the Crater Rim Circuit and the beach route access as well as being closer to the main tourist accommodation areas.
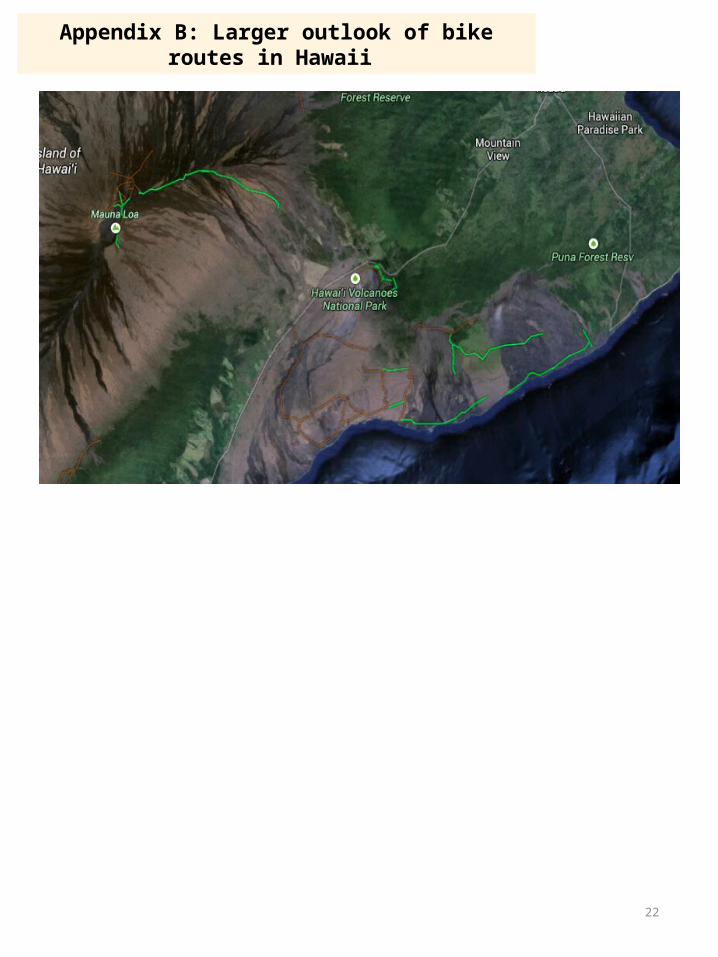
We will offer various guided routes including beach and mountain bike routes to take patrons up the mountain and to the beach. Most of the routes go along one lane paved road. A couple of the roads that we will be using include Saddle Road, Route 11, and Route 130.
While the big island it fourth in terms of total daily expenditure at $169 per person; they are the second highest in entertainment and tour spending at $17 per day per patron.
Hawai’i Volcanoes National Park
The E-Bike Technology Of course, our company relies heavily on the development of electronic bike technology. These bikes have an electronic motor, that assists in pedaling. This does not eliminate the need to peddle. it just increases the efficiency and decreases the total amount of effort required.
The average Electronic Assisted bike increases the peddlers efficiency by 150%. With this efficiency boost, it is much easier to travel long distance's and in up-hill settings. The Electronic Assisted motor kicks on at a flip of a switch, to help conserve power during flat and down hill sections.
4Overview – External Analysis – Internal Strategy – Marketing Strategy – M.I.S. – Demographics – Financials
Political • State Park Permits • Regulations regarding safety• Bike laws • CFC- Brake times, reflectors, helmet
standards.• Transport Classification – Under the
same bike laws in Hawaii (Mintel, 2015) (NBDA, 2014) (SD Fly Rides, 2014)
Economic• 13% of recreation trips are spent on
bike trips• Low Start-Up Costs• 48.1% Growth in E-Bike Sales• $6.8B Industry projected with 3.5%
growth annually • E-Bike is the most sold Electric Vehicle (Ebikes, 2014) (IBIS, 2015)
Social• Baby-boomers are riding more often. • Older people can use E-bike easier then
traditional bikes. (55+) • 75+ - 87 days a year• 2.4% growth in Disposable Income• 3% growth for International Tourism• >2% growth in domestic tourism • Health and Leisure Tours Increasing • Climate allows us to operate all year
around. (Hawaii Tourism, 2013) (IBIS, 2015)
Technological• “Green Branding” • Easier to use for entry level
participants.• Development of E-Bike technology
within the industry• Audio-GPS systems growing at 2.5%
annually (Garmin) (Needs research) (Garmin 10-K, 2014)
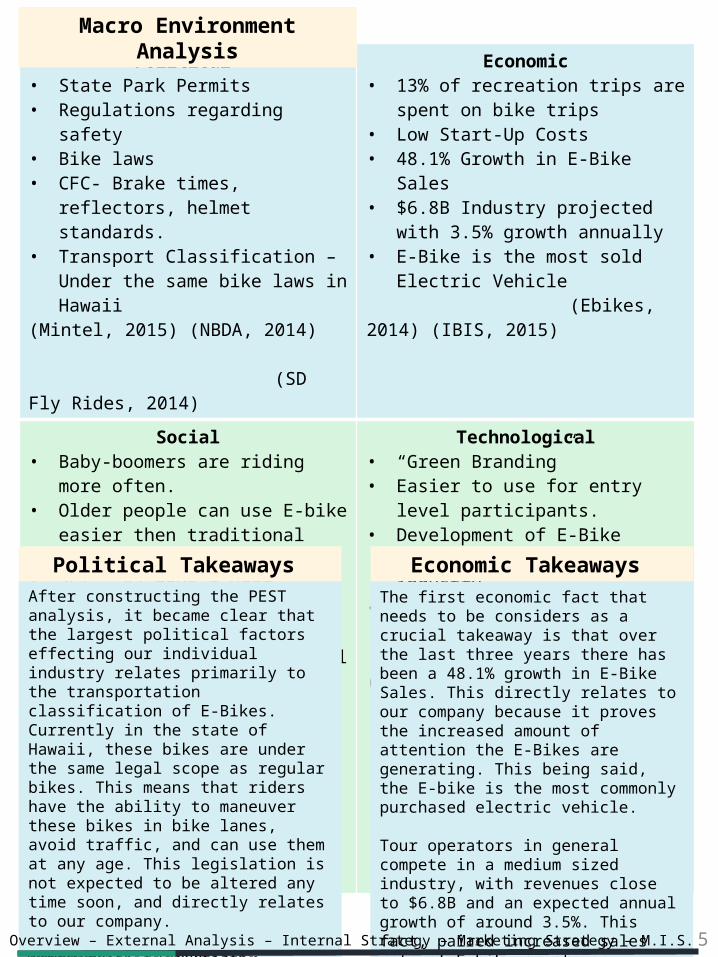
After constructing the PEST analysis, it became clear that the largest political factors effecting our individual industry relates primarily to the transportation classification of E-Bikes. Currently in the state of Hawaii, these bikes are under the same legal scope as regular bikes. This means that riders have the ability to maneuver these bikes in bike lanes, avoid traffic, and can use them at any age. This legislation is not expected to be altered any time soon, and directly relates to our company.
Another political factor incorporated with our company is the restrictions that the Cycling Federal Committee puts on safety laws. They incorporate laws requiring reflectors, brake times and helmets.
Political Takeaways Economic Takeaways The first economic fact that needs to be considers as a crucial takeaway is that over the last three years there has been a 48.1% growth in E-Bike Sales. This directly relates to our company because it proves the increased amount of attention the E-Bikes are generating. This being said, the E-bike is the most commonly purchased electric vehicle.
Tour operators in general compete in a medium sized industry, with revenues close to $6.8B and an expected annual growth of around 3.5%. This fact, paired increased sales rate of E-bike create an equation that will lead us towards success.
Macro Environment Analysis
5Overview – External Analysis – Internal Strategy – Marketing Strategy – M.I.S. – Demographics – Financials
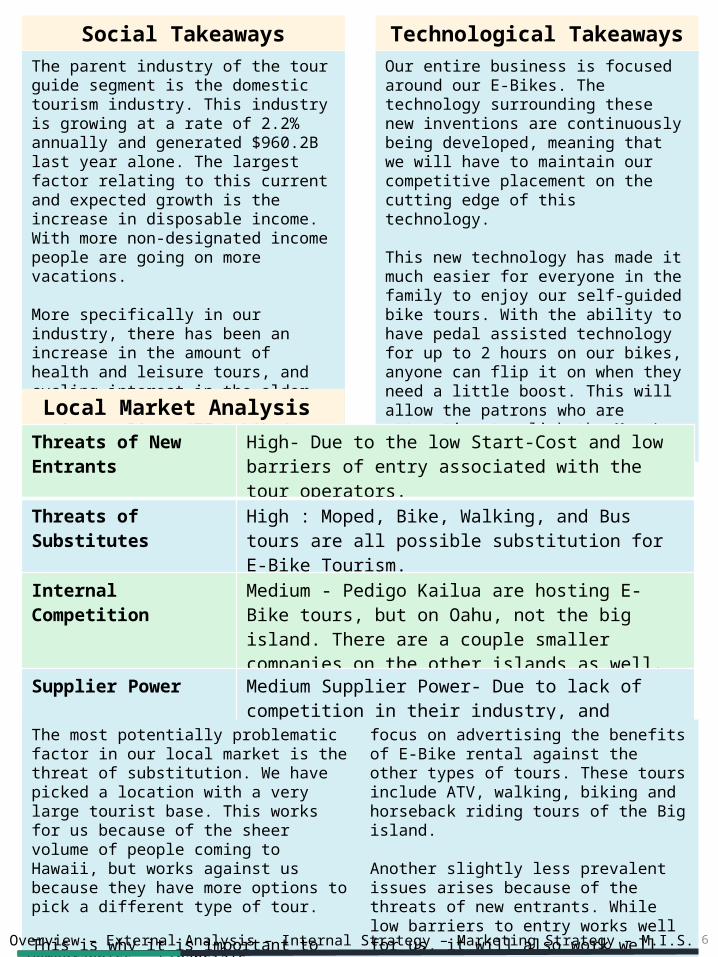
The parent industry of the tour guide segment is the domestic tourism industry. This industry is growing at a rate of 2.2% annually and generated $960.2B last year alone. The largest factor relating to this current and expected growth is the increase in disposable income. With more non-designated income people are going on more vacations.
More specifically in our industry, there has been an increase in the amount of health and leisure tours, and cycling interest in the older generations. Last year alone, senior cyclists (75+) biked an average of 85 days a year. Our bike rental service on Hawaii will include that group, to maximize profits.
Social TakeawaysOur entire business is focused around our E-Bikes. The technology surrounding these new inventions are continuously being developed, meaning that we will have to maintain our competitive placement on the cutting edge of this technology.
This new technology has made it much easier for everyone in the family to enjoy our self-guided bike tours. With the ability to have pedal assisted technology for up to 2 hours on our bikes, anyone can flip it on when they need a little boost. This will allow the patrons who are attempting to climb the Mau Lau Volcanos, an easier journey.
Technological Takeaways
Threats of New Entrants High- Due to the low Start-Cost and low barriers of entry associated with the tour operators.
Threats of Substitutes High : Moped, Bike, Walking, and Bus tours are all possible substitution for E-Bike Tourism.
Internal Competition Medium - Pedigo Kailua are hosting E-Bike tours, but on Oahu, not the big island. There are a couple smaller companies on the other islands as well.
Supplier Power Medium Supplier Power- Due to lack of competition in their industry, and medium competition in ours.
Buyer Power Medium- High due to substitution, low due to internal competition.
Local Market Analysis
The most potentially problematic factor in our local market is the threat of substitution. We have picked a location with a very large tourist base. This works for us because of the sheer volume of people coming to Hawaii, but works against us because they have more options to pick a different type of tour.
This is why it is important to differentiate ourselves from the external completion. We need to focus on advertising the benefits of E-
Bike rental against the other types of tours. These tours include ATV, walking, biking and horseback riding tours of the Big island.
Another slightly less prevalent issues arises because of the threats of new entrants. While low barriers to entry works well for us, it will also work well for our future competition.
6Overview – External Analysis – Internal Strategy – Marketing Strategy – M.I.S. – Demographics – Financials
After looking at the external factors working with and against us, the development of Key Success Factors, or objectives was the logical next step. Our factors include the creation of external agreements, user friendly and exciting GPS audio tours, and the adventure vacation orientation of our company as a whole. If we follow these Key Success Factors we will offer a much more competitive tour agency, and maximize the potential of our company.
Key Success Factors• Partnerships with hotels and agents • Competitive discounts• E-Bike racks at restaurants and hotels
Our next key success factor / objective is to establish external agreements with hotels, restaurants, taxi services, rental car companies and travel agents. These practical partnerships will benefit us in terms of marketing and by offering value towards our customer base.
One thing we can offer is competitive discounts with theses agencies. The coupons can go both ways. We will offer coupons and discounts for restaurants, to encourage our patrons to go and visit the businesses and hotels will offer coupons for our services.
Another portion of our external agreements relates with the storage and security of our bikes, while visiting these establishments. We need to ensure that all of the facilities have bike racks and have nearby outlets to charge the bikes.
KSF #2: External Agreements
• Safe route guidance • Tracking and information software • Location and emergency services
We need to work closely with GPS providers to ensure that our patrons have access to a powerful, yet user-friendly GPS device. This device can lead the patrons on self guided tours through the mountain and around town. All of the devices come pre-loaded with routes for the patrons to enjoy.
Using the location information gathered from devices, we will be better able to market our products based off of routes and popular destinations. For example, if the majority of people prefer the beach trail, rather than the mountain trail, we can more accurately target that demographic.
Lastly, these devices provide a safety tool, in case the patrons of our service get lost, or encounter an emergency. These devices will have direct communication with our headquarters and the emergency stations located around the island. This will help limit our liability and offer a package that appeals to family. Even though the patrons are not touring with a guide, they will still feel safe, only being one button away from help.
KSF #1: User Friendly GPS Audio Tours
• Adventure branding • Display all of the benefits of E-bikes
As discussed in the environmental analysis, we need to differentiate ourselves from the substitute companies on the island. The first way we can do this is by ensuring that we have a strong brand that is associated with the idea of having a relaxing and adventurous experience on the island.
Secondly, we need to effectively convey all of the advantages of renting an E-bike as opposed to any other type of tour. We can do this by offering demos, elaborate brochures and allowing easy access to information relating to E-Bikes and our company.
KSF #3: Adventure Vacation Orientation
7Overview – External Analysis – Internal Strategy – Marketing Strategy – M.I.S. – Demographics – Financials
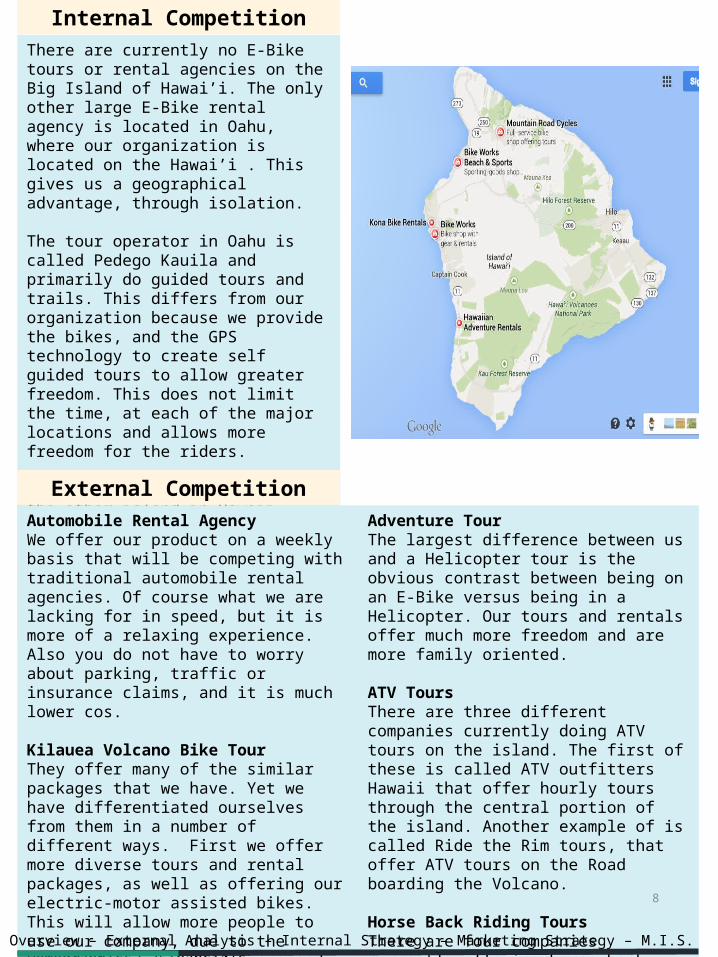
There are currently no E-Bike tours or rental agencies on the Big Island of Hawai’i. The only other large E-Bike rental agency is located in Oahu, where our organization is located on the Hawai’i . This gives us a geographical advantage, through isolation.
The tour operator in Oahu is called Pedego Kauila and primarily do guided tours and trails. This differs from our organization because we provide the bikes, and the GPS technology to create self guided tours to allow greater freedom. This does not limit the time, at each of the major locations and allows more freedom for the riders.
Yet the presence of E-Bike in the other island in Hawaii suggests that there is a market for our company. We can also use these organizations as a benchmarking tool and to help create more accurate projections for our company.
Internal Competition
Automobile Rental AgencyWe offer our product on a weekly basis that will be competing with traditional automobile rental agencies. Of course what we are lacking for in speed, but it is more of a relaxing experience. Also you do not have to worry about parking, traffic or insurance claims, and it is much lower cos.
Kilauea Volcano Bike Tour They offer many of the similar packages that we have. Yet we have differentiated ourselves from them in a number of different ways. First we offer more diverse tours and rental packages, as well as offering our electric-motor assisted bikes. This will allow more people to use our company, due to the assisted pedaling and increased efficiency of the bikes.
Fire and Falls Helicopter Adventure Tour
The largest difference between us and a Helicopter tour is the obvious contrast between being on an E-Bike versus being in a Helicopter. Our tours and rentals offer much more freedom and are more family oriented.
ATV ToursThere are three different companies currently doing ATV tours on the island. The first of these is called ATV outfitters Hawaii that offer hourly tours through the central portion of the island. Another example of is called Ride the Rim tours, that offer ATV tours on the Road boarding the Volcano.
Horse Back Riding Tours There are four companies currently offering horse back tours on the Big Island. These are Dahana Ranch, Kings Trail Rides ,Naalapa Stables, Paniola Adventures.
External Competition
8
Overview – External Analysis – Internal Strategy – Marketing Strategy – M.I.S. – Demographics – Financials
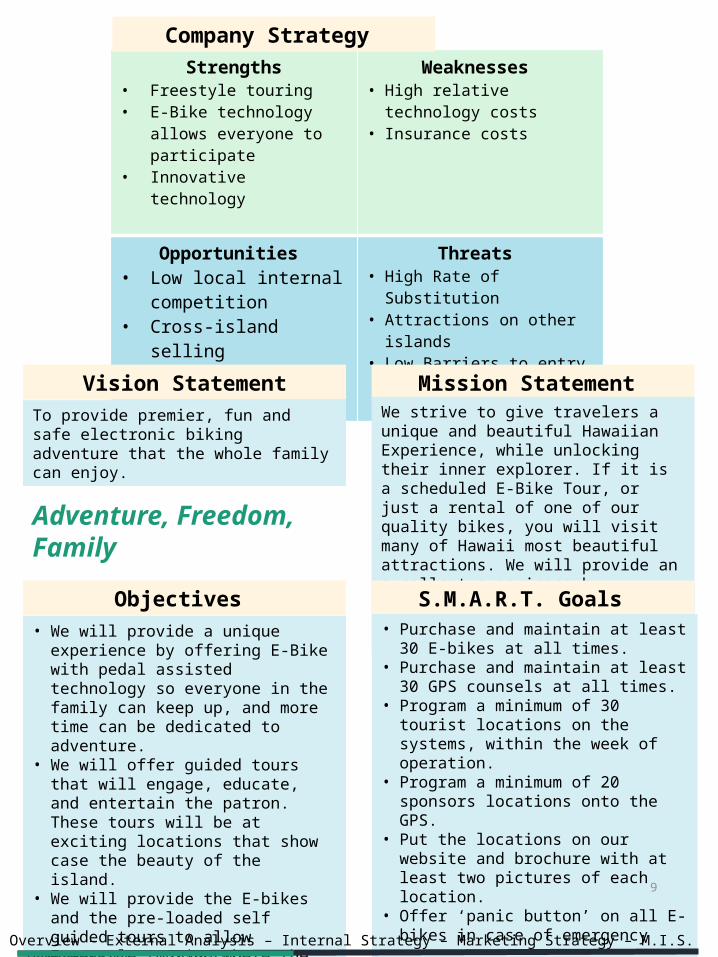
Strengths• Freestyle touring • E-Bike technology allows
everyone to participate • Innovative technology
Weaknesses • High relative technology costs • Insurance costs
Opportunities • Low local internal
competition • Cross-island selling • Low Start-up
Threats • High Rate of Substitution• Attractions on other islands • Low Barriers to entry
Company Strategy
Mission Statement Vision StatementWe strive to give travelers a unique and beautiful Hawaiian Experience, while unlocking their inner explorer. If it is a scheduled E-Bike Tour, or just a rental of one of our quality bikes, you will visit many of Hawaii most beautiful attractions. We will provide an excellent experience by providing high quality gear and by offering a large variety of exciting and safe expeditions.
To provide premier, fun and safe electronic biking adventure that the whole family can enjoy.
Objectives • We will provide a unique experience by
offering E-Bike with pedal assisted technology so everyone in the family can keep up, and more time can be dedicated to adventure.
• We will offer guided tours that will engage, educate, and entertain the patron. These tours will be at exciting locations that show case the beauty of the island.
• We will provide the E-bikes and the pre-loaded self guided tours to allow Freestyle touring where the patrons can design their own routes and take there time
S.M.A.R.T. Goals • Purchase and maintain at least 30 E-bikes at
all times. • Purchase and maintain at least 30 GPS
counsels at all times.• Program a minimum of 30 tourist locations
on the systems, within the week of operation.
• Program a minimum of 20 sponsors locations onto the GPS.
• Put the locations on our website and brochure with at least two pictures of each location.
• Offer ‘panic button’ on all E-bikes in case of emergency
Adventure, Freedom, Family
9
Overview – External Analysis – Internal Strategy – Marketing Strategy – M.I.S. – Demographics – Financials
10
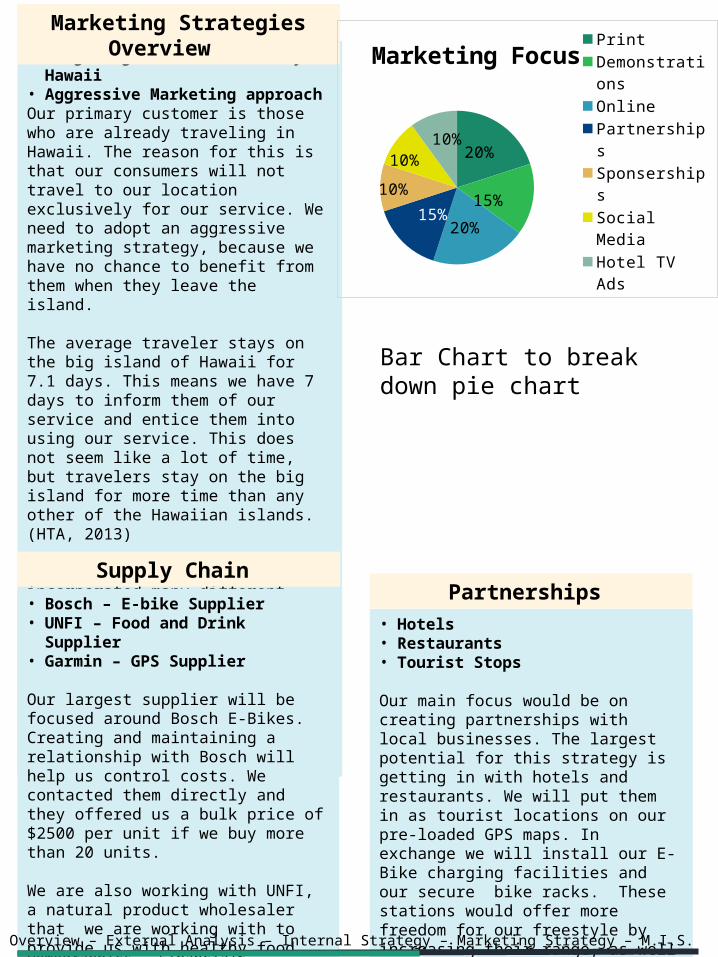
• Targeting Travelers already in Hawaii • Aggressive Marketing approach Our primary customer is those who are already traveling in Hawaii. The reason for this is that our consumers will not travel to our location exclusively for our service. We need to adopt an aggressive marketing strategy, because we have no chance to benefit from them when they leave the island.
The average traveler stays on the big island of Hawaii for 7.1 days. This means we have 7 days to inform them of our service and entice them into using our service. This does not seem like a lot of time, but travelers stay on the big island for more time than any other of the Hawaiian islands. (HTA, 2013)
This is why we have incorporated many different advertising techniques into our model. These techniques include, online advertising, print advertisements, partnerships, sponsorships of healthy snacks at bars, demonstrations, and Hotel TV advertisements. See the next page for more details
Marketing Strategies Overview
• Bosch – E-bike Supplier • UNFI – Food and Drink Supplier• Garmin – GPS Supplier
Our largest supplier will be focused around Bosch E-Bikes. Creating and maintaining a relationship with Bosch will help us control costs. We contacted them directly and they offered us a bulk price of $2500 per unit if we buy more than 20 units.
We are also working with UNFI, a natural product wholesaler that we are working with to provide us with healthy food items. We are also working with Garmin who quoted us with a bulk price of for $250 per unit if we buy more than 20 Bike GPS Systems.
Supply Chain
• Hotels • Restaurants • Tourist Stops
Our main focus would be on creating partnerships with local businesses. The largest potential for this strategy is getting in with hotels and restaurants. We will put them in as tourist locations on our pre-loaded GPS maps. In exchange we will install our E-Bike charging facilities and our secure bike racks. These stations would offer more freedom for our freestyle by increasing their range, as well as an advertising tool to attract new customers.
Partnerships
20%
15%
20%15%
10%
10%10%
Marketing Focus Print
Demonstrations
Online
Partnerships
Sponserships
Social Media
Hotel TV Ads
Overview – External Analysis – Internal Strategy – Marketing Strategy – M.I.S. – Demographics – Financials
Bar Chart to break down pie chart
11
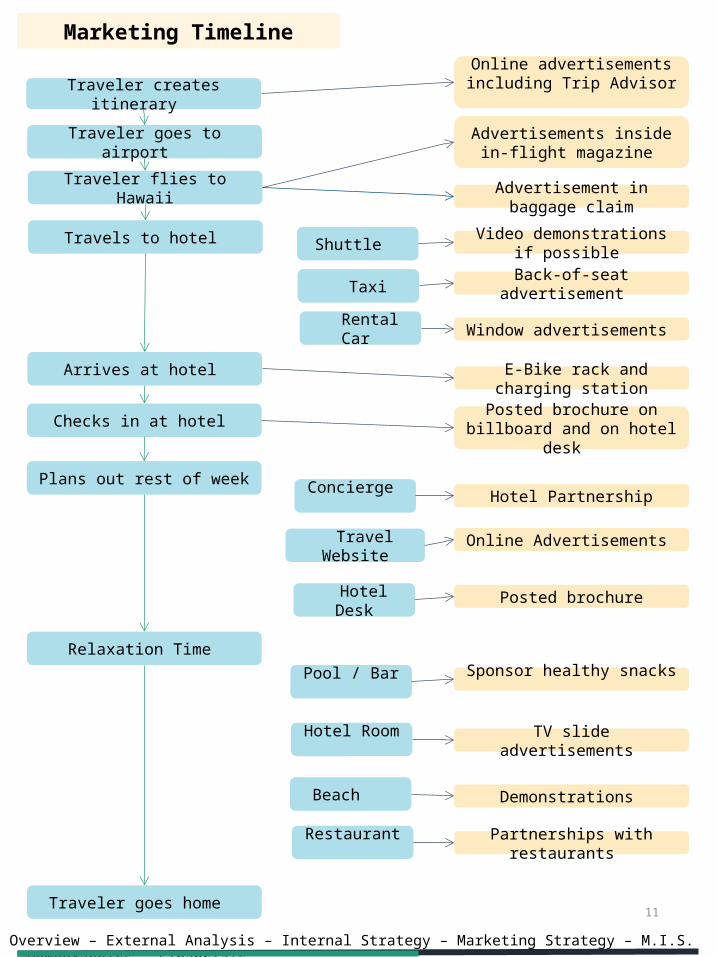
Marketing Timeline
Traveler creates itinerary
Traveler goes to airport
Traveler flies to Hawaii
Travels to hotel Shuttle
Taxi
Rental Car
Arrives at hotel
Checks in at hotel
Plans out rest of week Concierge
Travel Website
Hotel Desk
Relaxation Time
Pool / Bar
Hotel Room
Beach
Traveler goes home
Restaurant
Online advertisements including Trip Advisor
Advertisements inside in-flight magazine
Video demonstrations if possible
Back-of-seat advertisement
Window advertisements
Advertisement in baggage claim
Posted brochure on billboard and on hotel desk
E-Bike rack and charging station
Hotel Partnership
Online Advertisements
Posted brochure
Sponsor healthy snacks
TV slide advertisements
Demonstrations
Partnerships with restaurants
Overview – External Analysis – Internal Strategy – Marketing Strategy – M.I.S. – Demographics – Financials
12
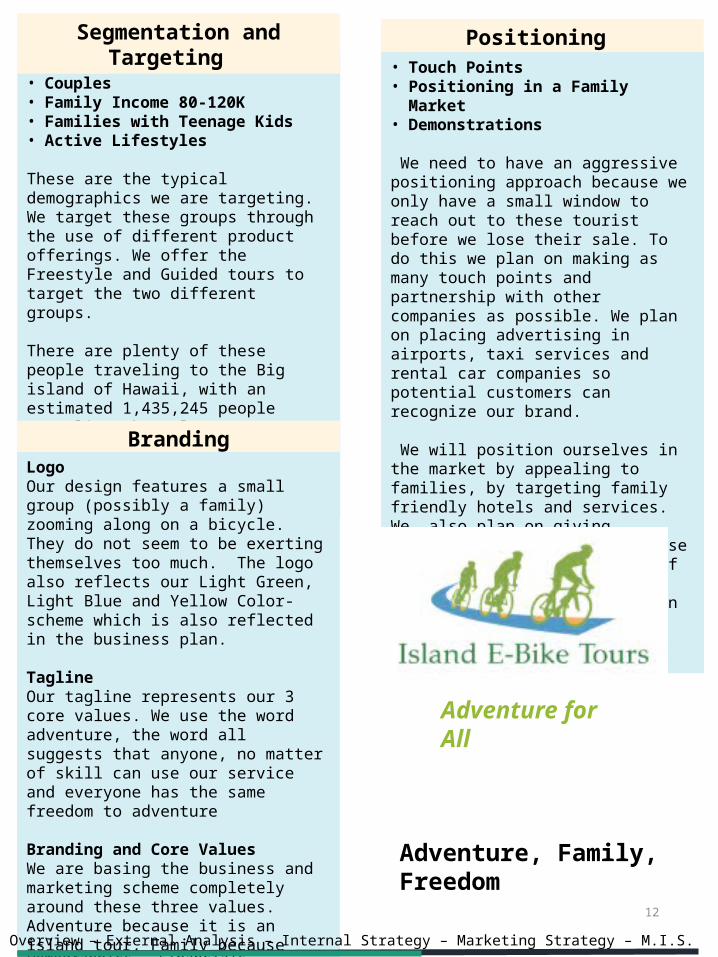
• Families • Couples • Family Income 80-120K• Families with Teenage Kids• Active Lifestyles
These are the typical demographics we are targeting. We target these groups through the use of different product offerings. We offer the Freestyle and Guided tours to target the two different groups.
There are plenty of these people traveling to the Big island of Hawaii, with an estimated 1,435,245 people traveling there last year alone. Of those people 70% went on individually booked tours, and 18% of those went on bike tours. (HTA, 2014)
Segmentation and Targeting
Branding
Adventure for All
Adventure, Family, Freedom
LogoOur design features a small group (possibly a family) zooming along on a bicycle. They do not seem to be exerting themselves too much. The logo also reflects our Light Green, Light Blue and Yellow Color-scheme which is also reflected in the business plan.
TaglineOur tagline represents our 3 core values. We use the word adventure, the word all suggests that anyone, no matter of skill can use our service and everyone has the same freedom to adventure
Branding and Core ValuesWe are basing the business and marketing scheme completely around these three values. Adventure because it is an island tour, Family because that is our audience and freedom because our freestyle touring is a major differentiating factor.
Positioning • Touch Points• Positioning in a Family Market• Demonstrations
We need to have an aggressive positioning approach because we only have a small window to reach out to these tourist before we lose their sale. To do this we plan on making as many touch points and partnership with other companies as possible. We plan on placing advertising in airports, taxi services and rental car companies so potential customers can recognize our brand.
We will position ourselves in the market by appealing to families, by targeting family friendly hotels and services. We also plan on giving demonstrations outside of these hotels to show the benefits of our E-bikes. Particularly we plan on targeting the decision makers of the family, specifically the mothers and fathers.
Overview – External Analysis – Internal Strategy – Marketing Strategy – M.I.S. – Demographics – Financials
13
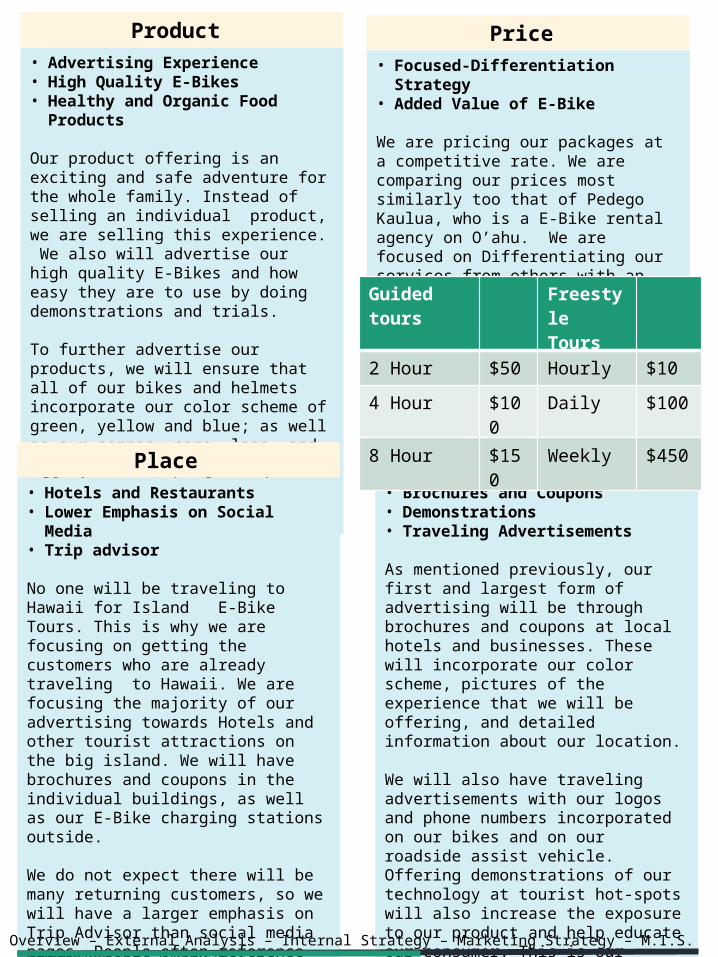
Price • Advertising Experience• High Quality E-Bikes • Healthy and Organic Food Products
Our product offering is an exciting and safe adventure for the whole family. Instead of selling an individual product, we are selling this experience. We also will advertise our high quality E-Bikes and how easy they are to use by doing demonstrations and trials.
To further advertise our products, we will ensure that all of our bikes and helmets incorporate our color scheme of green, yellow and blue; as well as our company name, logo, and phone number. All of our offerings must be focused around Adventure, Family, and Freedom.
Product
• Hotels and Restaurants• Lower Emphasis on Social Media• Trip advisor
No one will be traveling to Hawaii for Island E-Bike Tours. This is why we are focusing on getting the customers who are already traveling to Hawaii. We are focusing the majority of our advertising towards Hotels and other tourist attractions on the big island. We will have brochures and coupons in the individual buildings, as well as our E-Bike charging stations outside.
We do not expect there will be many returning customers, so we will have a larger emphasis on Trip Advisor than social media pages. People often reference Trip Advisor to plan out their vacation, and trust the logo when they see it on buildings.
Place • Brochures and Coupons • Demonstrations • Traveling Advertisements
As mentioned previously, our first and largest form of advertising will be through brochures and coupons at local hotels and businesses. These will incorporate our color scheme, pictures of the experience that we will be offering, and detailed information about our location.
We will also have traveling advertisements with our logos and phone numbers incorporated on our bikes and on our roadside assist vehicle. Offering demonstrations of our technology at tourist hot-spots will also increase the exposure to our product and help educate our consumer. This is our primary strategy because of the new E-Bike technology.
Promotion
• Focused-Differentiation Strategy• Added Value of E-Bike
We are pricing our packages at a competitive rate. We are comparing our prices most similarly too that of Pedego Kaulua, who is a E-Bike rental agency on O’ahu. We are focused on Differentiating our services from others with an emphasis on quality over price. We will accomplish this by offering packages and products that are not available elsewhere.
Guided tours Freestyle Tours
2 Hour $50 Hourly $10
4 Hour $100 Daily $100
8 Hour $150 Weekly $450
Overview – External Analysis – Internal Strategy – Marketing Strategy – M.I.S. – Demographics – Financials
14
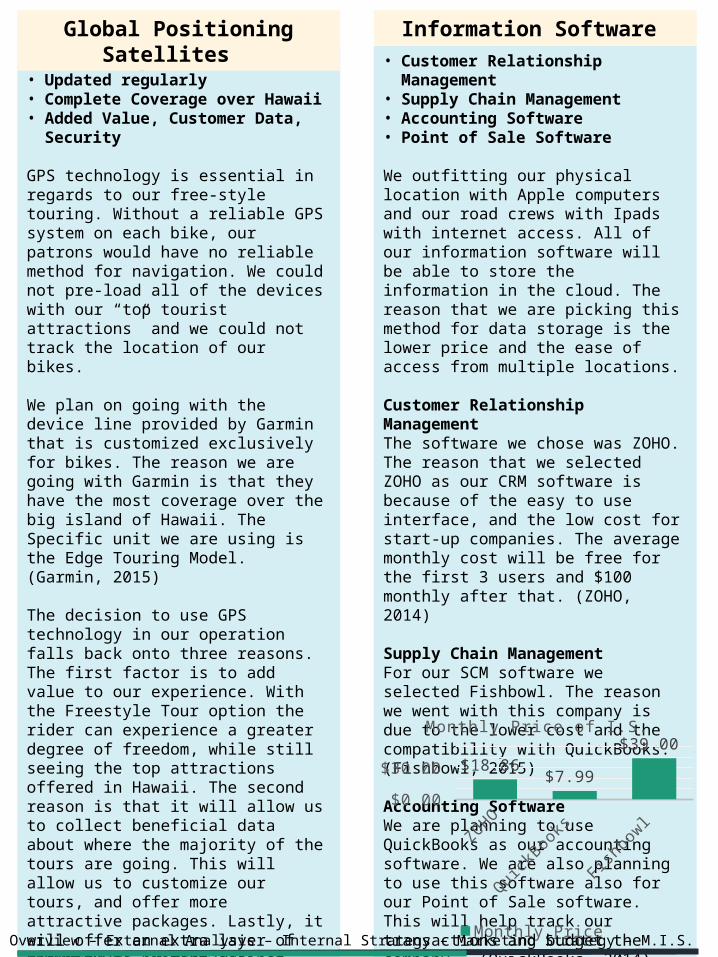
• Provided by Garmin • Updated regularly• Complete Coverage over Hawaii • Added Value, Customer Data, Security
GPS technology is essential in regards to our free-style touring. Without a reliable GPS system on each bike, our patrons would have no reliable method for navigation. We could not pre-load all of the devices with our “top tourist attractions” and we could not track the location of our bikes.
We plan on going with the device line provided by Garmin that is customized exclusively for bikes. The reason we are going with Garmin is that they have the most coverage over the big island of Hawaii. The Specific unit we are using is the Edge Touring Model. (Garmin, 2015)
The decision to use GPS technology in our operation falls back onto three reasons. The first factor is to add value to our experience. With the Freestyle Tour option the rider can experience a greater degree of freedom, while still seeing the top attractions offered in Hawaii. The second reason is that it will allow us to collect beneficial data about where the majority of the tours are going. This will allow us to customize our tours, and offer more attractive packages. Lastly, it will offer an extra layer of security to protect against thieves. Our bikes can costs several thousand dollars per bike. (Bosch, 2014)
The estimated cost for each individual system is roughly $249.99 and the software to track and support the devices is called Basecamp and it is free. This software allows the creation of customized locations and routes, as well as tracking for registered units. (Garmin, 2015)
Global Positioning Satellites • Customer Relationship Management• Supply Chain Management • Accounting Software• Point of Sale Software
We outfitting our physical location with Apple computers and our road crews with Ipads with internet access. All of our information software will be able to store the information in the cloud. The reason that we are picking this method for data storage is the lower price and the ease of access from multiple locations.
Customer Relationship ManagementThe software we chose was ZOHO. The reason that we selected ZOHO as our CRM software is because of the easy to use interface, and the low cost for start-up companies. The average monthly cost will be free for the first 3 users and $100 monthly after that. (ZOHO, 2014)
Supply Chain Management For our SCM software we selected Fishbowl. The reason we went with this company is due to the lower cost and the compatibility with QuickBooks. (Fishbowl, 2015)
Accounting Software We are planning to use QuickBooks as our accounting software. We are also planning to use this software also for our Point of Sale software. This will help track our transactions and budget the company. (QuickBooks, 2014)
Information Software
ZOHO QuickBooks Fishbowl $0.00
$10.00
$20.00
$30.00
$40.00
$18.86
$7.99
$39.00
Monthly Price of I.S.
Monthly Price Overview – External Analysis – Internal Strategy – Marketing Strategy – M.I.S. – Demographics – Financials
15
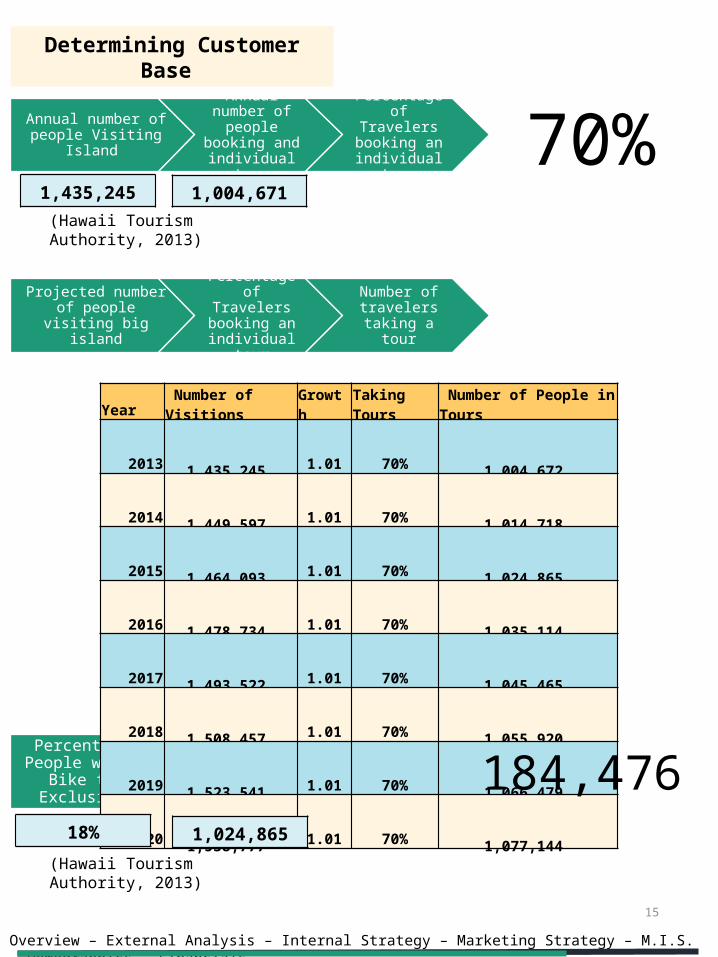
Determining Customer Base
Annual number of people Visiting Island
Annual number of people
booking and individual tour
Percentage of Travelers
booking an individual tour
Projected number of people visiting big island
Percentage of Travelers
booking an individual tour
Number of travelers taking a
tour
Percentage of People who want Bike tours
Exclusively
Number of people going
on tours (2015)
Number of People going on Bike Tours
1,435,245 1,004,671
70%
Year Number of Visitions Growth Taking Tours Number of People in Tours
2013 1,435,245 1.01 70%
1,004,672
2014 1,449,597 1.01 70%
1,014,718
2015 1,464,093 1.01 70%
1,024,865
2016 1,478,734 1.01 70%
1,035,114
2017 1,493,522 1.01 70%
1,045,465
2018 1,508,457 1.01 70%
1,055,920
2019 1,523,541 1.01 70%
1,066,479
2020 1,538,777 1.01 70%
1,077,144
18% 1,024,865
184,476
(Hawaii Tourism Authority, 2013)
(Hawaii Tourism Authority, 2013)
Overview – External Analysis – Internal Strategy – Marketing Strategy – M.I.S. – Demographics – Financials
16
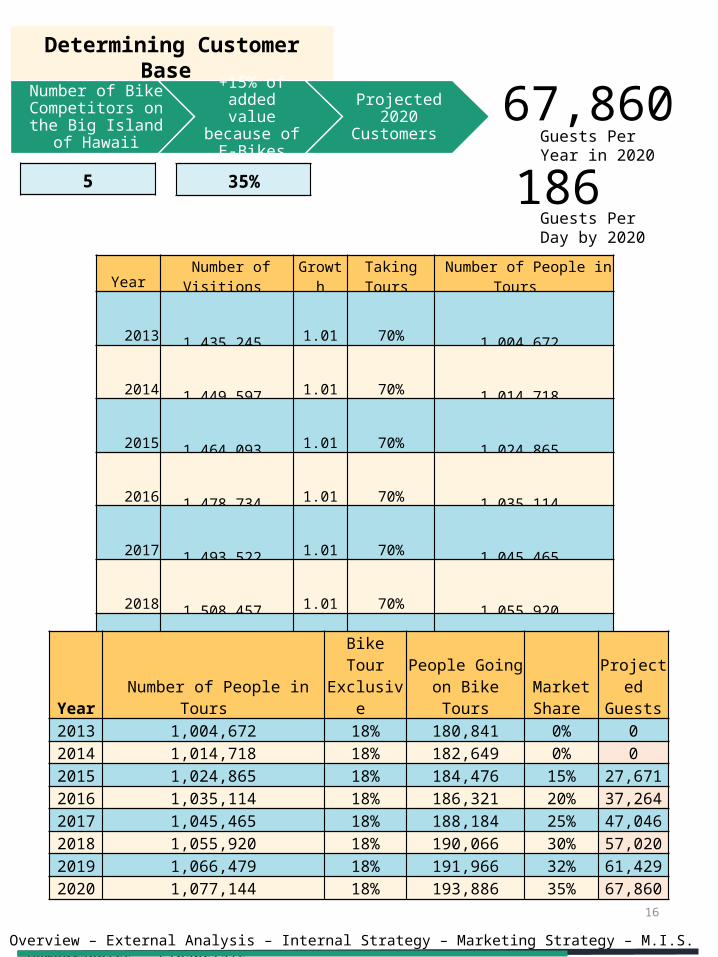
Determining Customer Base
Number of Bike Competitors on the Big
Island of Hawaii
+15% of added value because
of E-Bikes
Projected 2020 Customers
5 35%
67,860
Year Number of Visitions Growth Taking Tours Number of People in Tours
2013 1,435,245 1.01 70%
1,004,672
2014 1,449,597 1.01 70%
1,014,718
2015 1,464,093 1.01 70%
1,024,865
2016 1,478,734 1.01 70%
1,035,114
2017 1,493,522 1.01 70%
1,045,465
2018 1,508,457 1.01 70%
1,055,920
2019 1,523,541 1.01 70%
1,066,479
2020 1,538,777 1.01 70%
1,077,144
Guests Per Year in 2020
186Guests Per Day by 2020
Year Number of People in Tours Bike Tour Exclusive
People Going on Bike Tours
Market Share
Projected Guests
2013 1,004,672 18% 180,841 0% 02014 1,014,718 18% 182,649 0% 02015 1,024,865 18% 184,476 15% 27,6712016 1,035,114 18% 186,321 20% 37,2642017 1,045,465 18% 188,184 25% 47,0462018 1,055,920 18% 190,066 30% 57,0202019 1,066,479 18% 191,966 32% 61,4292020 1,077,144 18% 193,886 35% 67,860
Overview – External Analysis – Internal Strategy – Marketing Strategy – M.I.S. – Demographics – Financials
17
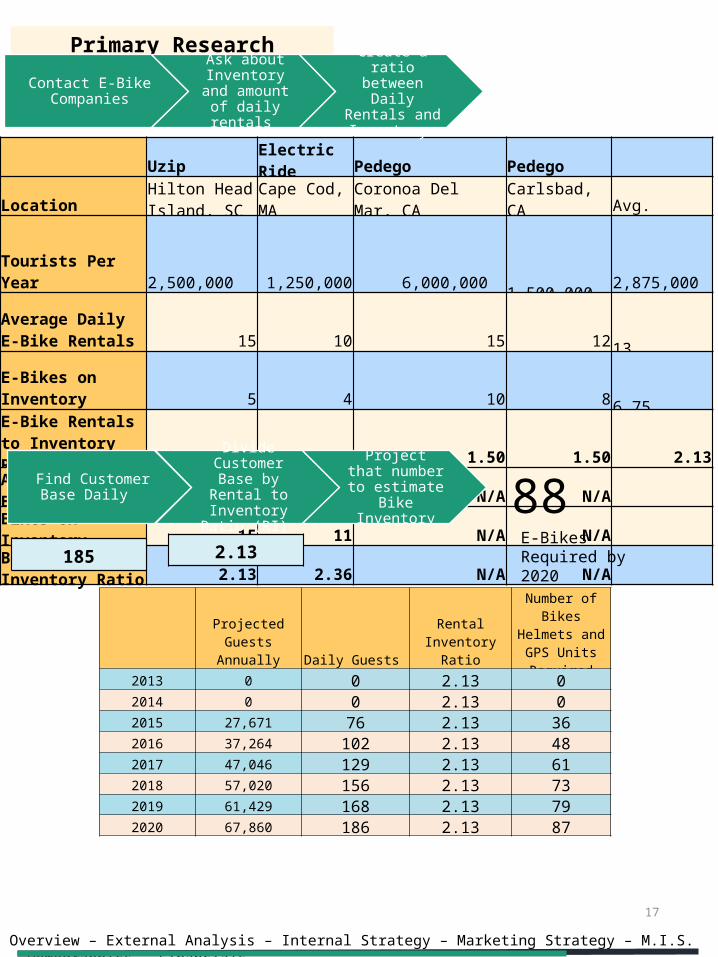
Primary Research
Uzip Electric Ride Pedego Pedego
Location Hilton Head Island, SC Cape Cod, MA Coronoa Del Mar, CA Carlsbad, CA Avg.
Tourists Per Year 2,500,000 1,250,000 6,000,000
1,500,000 2,875,000
Average Daily E-Bike Rentals 15 10 15 12 13E-Bikes on Inventory 5 4 10 8 6.75 E-Bike Rentals to Inventory Ratio 3.00 2.50 1.50 1.50 2.13Average Daily Bike Rentals 32 26 N/A N/ABikes on Inventory 15 11 N/A N/ABike Rentals to Inventory Ratio 2.13 2.36 N/A N/A
Contact E-Bike Companies
Ask about Inventory and
amount of daily rentals
Create a ratio between Daily
Rentals and Inventory
Find Customer Base Daily
Divide Customer Base by Rental to Inventory Ratio
(RI)
Project that number to
estimate Bike Inventory
185 2.13
88E-Bikes Required by 2020
Projected Guests Annually Daily Guests
Rental Inventory Ratio
Number of Bikes Helmets and GPS
Units Required
2013 0 0 2.13 02014 0 0 2.13 02015 27,671 76 2.13 362016 37,264 102 2.13 482017 47,046 129 2.13 612018 57,020 156 2.13 732019 61,429 168 2.13 792020 67,860 186 2.13 87
Overview – External Analysis – Internal Strategy – Marketing Strategy – M.I.S. – Demographics – Financials
18
Financial Projections
2015 2016 2017 2018 2019 $-
$1,000,000.00
$2,000,000.00
$3,000,000.00
$4,000,000.00
$5,000,000.00
$6,000,000.00
$7,000,000.00
Expected Income Growth
Yearly Revenue Operating ExpensesNet Income
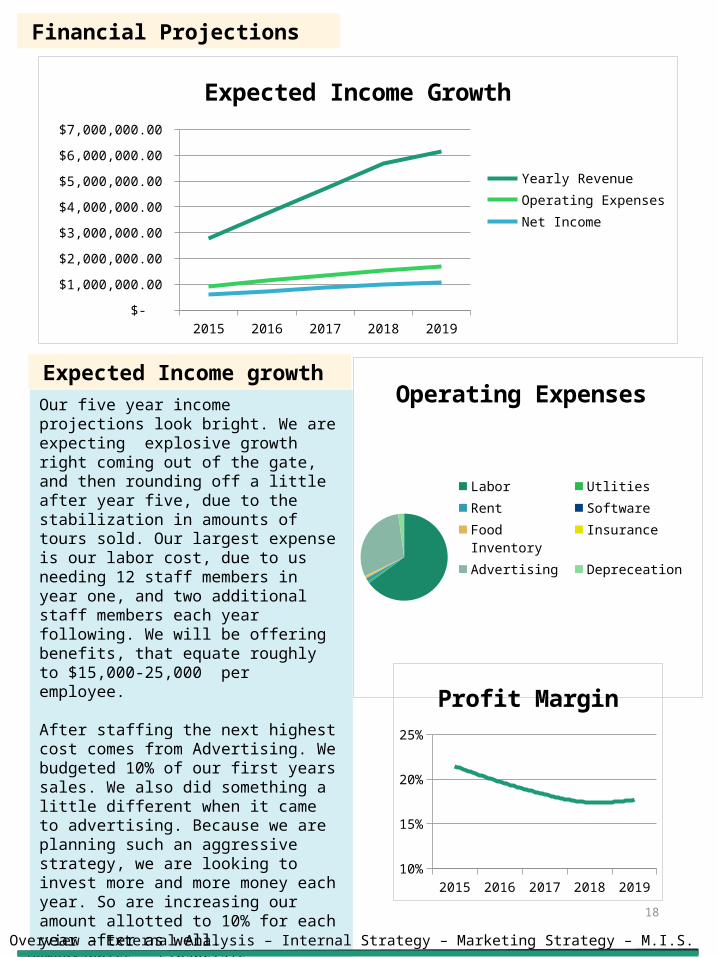
Our five year income projections look bright. We are expecting explosive growth right coming out of the gate, and then rounding off a little after year five, due to the stabilization in amounts of tours sold. Our largest expense is our labor cost, due to us needing 12 staff members in year one, and two additional staff members each year following. We will be offering benefits, that equate roughly to $15,000-25,000 per employee.
After staffing the next highest cost comes from Advertising. We budgeted 10% of our first years sales. We also did something a little different when it came to advertising. Because we are planning such an aggressive strategy, we are looking to invest more and more money each year. So are increasing our amount allotted to 10% for each year after as well.
As for our income based essential ratios, our profit margin should be between 17% and 21%. Due to the same stabilization as mentioned above, the profit margin is going to decrease and then stabilize.
Expected Income growth Operating Expenses
Labor Utlities Rent Software Food Inventory Insurance Advertising Depreceation
2015 2016 2017 2018 201910%
12%
14%
16%
18%
20%
22%
24%
Profit Margin
Overview – External Analysis – Internal Strategy – Marketing Strategy – M.I.S. – Demographics – Financials
19
Relevant Cash flows
2015 2016 2017 2018 2019 $-
$200,000.00
$400,000.00
$600,000.00
$800,000.00
$1,000,000.00
$1,200,000.00
Relevent Cashflows
Relevent Cashflows
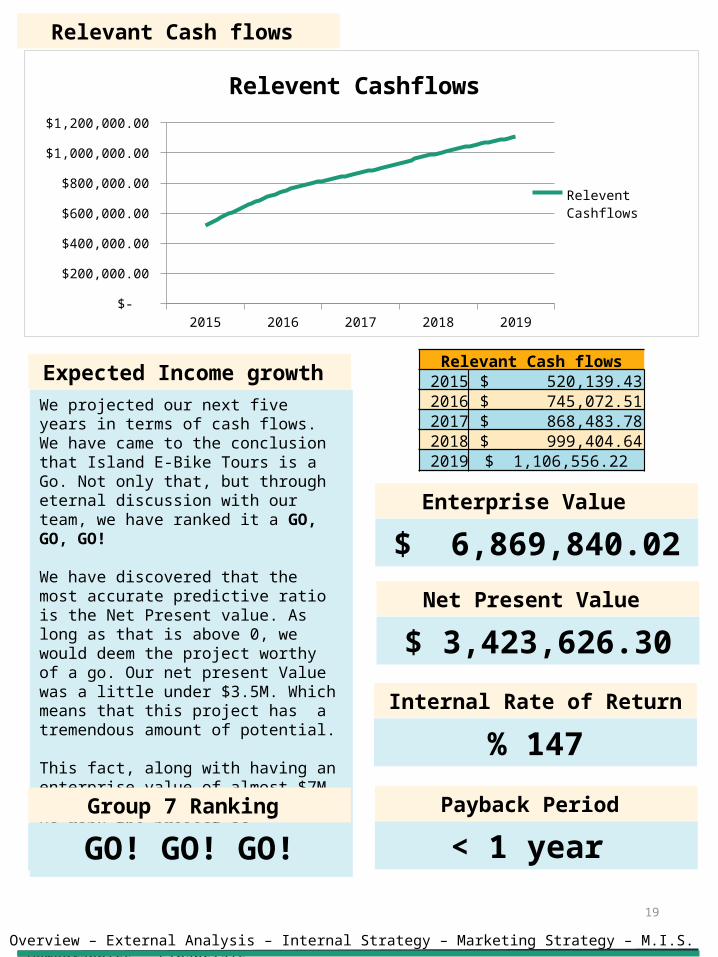
Relevant Cash flows2015 $ 520,139.43 2016 $ 745,072.51 2017 $ 868,483.78 2018 $ 999,404.64 2019 $ 1,106,556.22
$ 6,869,840.02Enterprise Value
$ 3,423,626.30Net Present Value
We projected our next five years in terms of cash flows. We have came to the conclusion that Island E-Bike Tours is a Go. Not only that, but through eternal discussion with our team, we have ranked it a GO, GO, GO!
We have discovered that the most accurate predictive ratio is the Net Present value. As long as that is above 0, we would deem the project worthy of a go. Our net present Value was a little under $3.5M. Which means that this project has a tremendous amount of potential.
This fact, along with having an enterprise value of almost $7M at the end of year five helps us rank the project as extremely viable.
Expected Income growth
GO! GO! GO!Group 7 Ranking
% 147Internal Rate of Return
< 1 year Payback Period
Overview – External Analysis – Internal Strategy – Marketing Strategy – M.I.S. – Demographics – Financials
20
Works CitedAdvisor, T. (2015). Top things to do in Hawaii Volcanoes National Park. Retrieved 2 24, 2015, from Trip Advisor : http://www.tripadvisor.com/Attractions-g143034-Activities-
Hawaii_Volcanoes_National_Park_Island_of_Hawaii_Hawaii.htmlGov, H. (2015). 101 Things to do . Retrieved 3 10, 2015, from Hawaii.com: http://www.101thingstodo.com/big-island/
Gov, H. (2013). Hawaii Tourism Authority. Hawaii Government , Department of Tourism , Honolulu .
NPS. (2015, 3 23). Bike The Volcano. Retrieved 3 10, 2015, from National Park Service : http://www.nps.gov/havo/planyourvisit/bike.htmTanaka, C. (2013, 8 29). Electric Bicycles: The Next Big Thing? Retrieved from Hawaii New Now: http://www.hawaiinewsnow.com/story/23284232/electric-bicycles-the-next-big-thing
Viator. (2015). Viator. Retrieved from Kilauea Volcano Bike Tour: http://www.viator.com/tours/Big-Island-of-Hawaii/Kilauea-Volcano-Bike-Tour/d669-5005BIKE
Zax, D. (2011, 9 27). The Rise of E-bikes. Retrieved 3 10, 2015, from Technology Review: http://www.technologyreview.com/view/425559/the-rise-of-the-e-bike/
Bosch ebike Systems. (2014, January 1). Retrieved March 23, 2015, from http://www.bosch-ebike.de/en/home/home.html
NBDA Industry Overview. (n.d.). Retrieved March 23, 2015, from http://nbda.com/articles/industry-overview-2013-pg34.html
Dealers. (2013, January 1). Retrieved March 23, 2015, from http://www.ebikes.ca/dealers.html
E-bikes - U.S. sales forecast 2016 | Statistic. (2014, March 8). Retrieved March 23, 2015, from http://www.statista.com/statistics/326124/us-sales-of-electric-bicycles/
E-bikes - U.S. sales 2014 | Statistic. (2015, January 8). Retrieved March 23, 2015, from http://www.statista.com/statistics/328871/sales-of-electric-bicycles-in-the…
Shop. (2013, January 1). Retrieved March 23, 2015, from http://www.pedegokailua.com/shop/
What are the running costs of owning an electric bike? - E-bikeshop News. (2013, October 23). Retrieved March 23, 2015, from https://www.e-bikeshop.co.uk/blog/post/electric-bike-running-costs/
SD FLY RIDES – Service. (2013, January 1). Retrieved March 23, 2015, from http://sandiegoflyrides.com/service/
Cycling Standards. (n.d.). Retrieved March 23, 2015, from http://academic.mintel.com.proxy.library.ohiou.edu/display/699737/?highligh…
21
Appendix A: Contact Email
Dear (Company Name), Hello I am a junior business student at Ohio University. We were assigned a group project, to develop a business feasibility project and we have decided to look into a e bike tours in Hawaii. In this project we have to conduct an Interview with an existing company and after much research we found that (Company name) is one of the top electric bike tours in (Location). We had a couple of questions that we would like to ask you, that would give us a better understanding of the industry. I am willing to agree to a nondisclosure agreement necessary. We would love to set up an over the phone interview with you at your convenience. Below are a few questions we were interested in. How many customers do you get daily? What are you peak months of business? Does your company appeal to more of a local audience or tourism based? Does your organization partner with any of the local companies? What are the average sales per customers?
Kind Regards,Jack Summers
22
Appendix B: Larger outlook of bike routes in Hawaii
23
Appendix C: Closer look at Mauna Loa Bike Routes
24
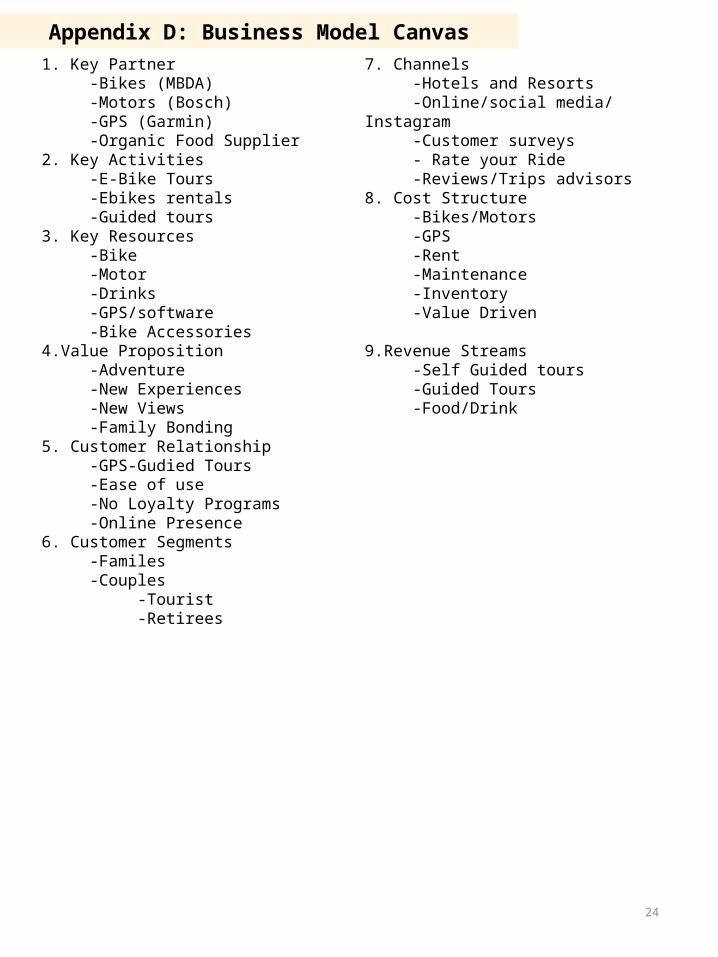
Appendix D: Business Model Canvas1. Key Partner
-Bikes (MBDA)-Motors (Bosch)-GPS (Garmin)-Organic Food Supplier
2. Key Activities -E-Bike Tours-Ebikes rentals -Guided tours
3. Key Resources -Bike-Motor-Drinks-GPS/software-Bike Accessories
4.Value Proposition -Adventure -New Experiences -New Views -Family Bonding
5. Customer Relationship-GPS-Gudied Tours -Ease of use -No Loyalty Programs -Online Presence
6. Customer Segments -Familes
-Couples -Tourist -Retirees
7. Channels -Hotels and Resorts-Online/social media/ Instagram-Customer surveys - Rate your Ride-Reviews/Trips advisors
8. Cost Structure -Bikes/Motors-GPS-Rent-Maintenance -Inventory -Value Driven
9.Revenue Streams
-Self Guided tours-Guided Tours -Food/Drink
25
Appendix E: Instagram Page

26
Appendix F: Twitter Page
27
Appendix G: Facebook Page
28
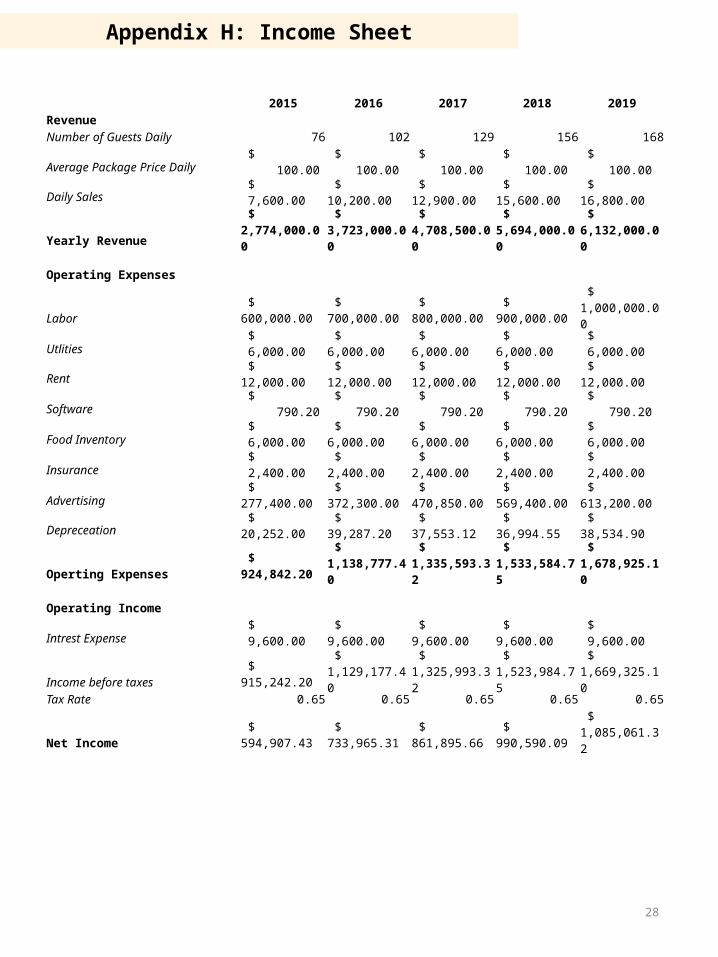
Appendix H: Income Sheet
2015 2016 2017 2018 2019Revenue Number of Guests Daily 76 102 129 156 168
Average Package Price Daily $ 100.00 $ 100.00 $ 100.00 $ 100.00 $ 100.00 Daily Sales $ 7,600.00 $ 10,200.00 $ 12,900.00 $ 15,600.00 $ 16,800.00 Yearly Revenue $ 2,774,000.00 $ 3,723,000.00 $ 4,708,500.00 $ 5,694,000.00 $ 6,132,000.00
Operating Expenses
Labor $ 600,000.00 $ 700,000.00 $ 800,000.00 $ 900,000.00 $ 1,000,000.00
Utlities $ 6,000.00 $ 6,000.00 $ 6,000.00 $ 6,000.00 $ 6,000.00 Rent $ 12,000.00 $ 12,000.00 $ 12,000.00 $ 12,000.00 $ 12,000.00
Software $ 790.20 $ 790.20 $ 790.20 $ 790.20 $ 790.20
Food Inventory $ 6,000.00 $ 6,000.00 $ 6,000.00 $ 6,000.00 $ 6,000.00
Insurance $ 2,400.00 $ 2,400.00 $ 2,400.00 $ 2,400.00 $ 2,400.00
Advertising $ 277,400.00 $ 372,300.00 $ 470,850.00 $ 569,400.00 $ 613,200.00 Depreceation $ 20,252.00 $ 39,287.20 $ 37,553.12 $ 36,994.55 $ 38,534.90 Operting Expenses $ 924,842.20 $ 1,138,777.40 $ 1,335,593.32 $ 1,533,584.75 $ 1,678,925.10
Operating Income
Intrest Expense $ 9,600.00 $ 9,600.00 $ 9,600.00 $ 9,600.00 $ 9,600.00 Income before taxes $ 915,242.20 $ 1,129,177.40 $ 1,325,993.32 $ 1,523,984.75 $ 1,669,325.10 Tax Rate 0.65 0.65 0.65 0.65 0.65
Net Income $ 594,907.43 $ 733,965.31 $ 861,895.66 $ 990,590.09 $ 1,085,061.32
29
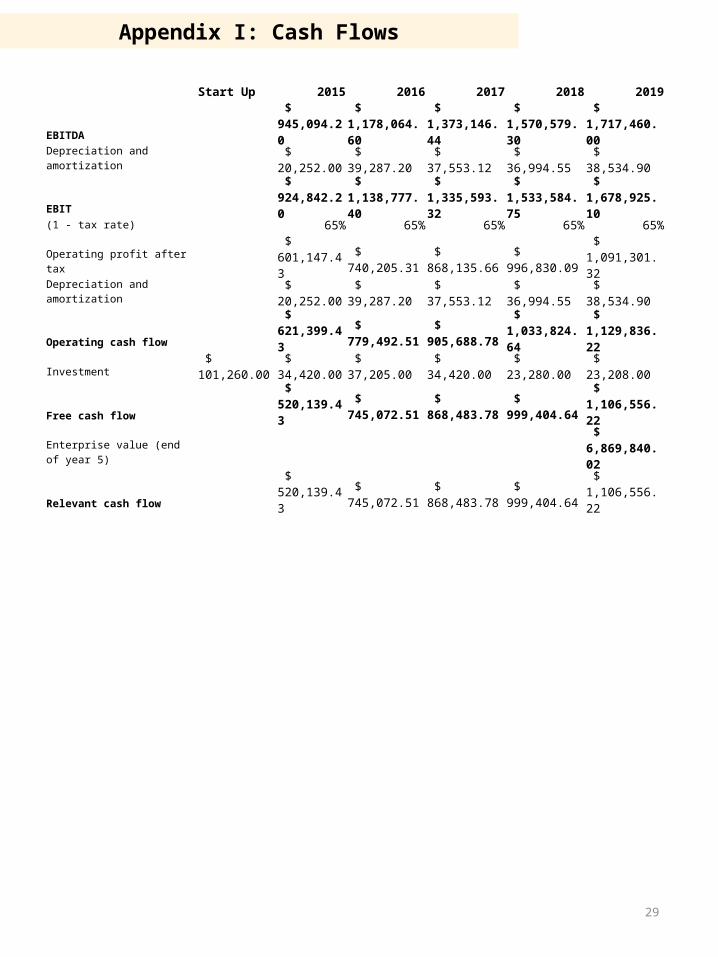
Appendix I: Cash Flows
Start Up 2015 2016 2017 2018 2019
EBITDA $ 945,094.20
$ 1,178,064.60
$ 1,373,146.44
$ 1,570,579.30
$ 1,717,460.00
Depreciation and amortization $ 20,252.00 $ 39,287.20
$ 37,553.12
$ 36,994.55
$ 38,534.90
EBIT $ 924,842.20
$ 1,138,777.40
$ 1,335,593.32
$ 1,533,584.75
$ 1,678,925.10
(1 - tax rate) 65% 65% 65% 65% 65%
Operating profit after tax $ 601,147.43
$ 740,205.31
$ 868,135.66
$ 996,830.09 $ 1,091,301.32
Depreciation and amortization $ 20,252.00 $ 39,287.20
$ 37,553.12
$ 36,994.55
$ 38,534.90
Operating cash flow $ 621,399.43
$ 779,492.51
$ 905,688.78
$ 1,033,824.64
$ 1,129,836.22
Investment $ 101,260.00 $ 34,420.00
$ 37,205.00
$ 34,420.00
$ 23,280.00
$ 23,208.00
Free cash flow $ 520,139.43
$ 745,072.51
$ 868,483.78
$ 999,404.64
$ 1,106,556.22
Enterprise value (end of year 5) $ 6,869,840.02
Relevant cash flow $ 520,139.43
$ 745,072.51
$ 868,483.78
$ 999,404.64 $ 1,106,556.22
30
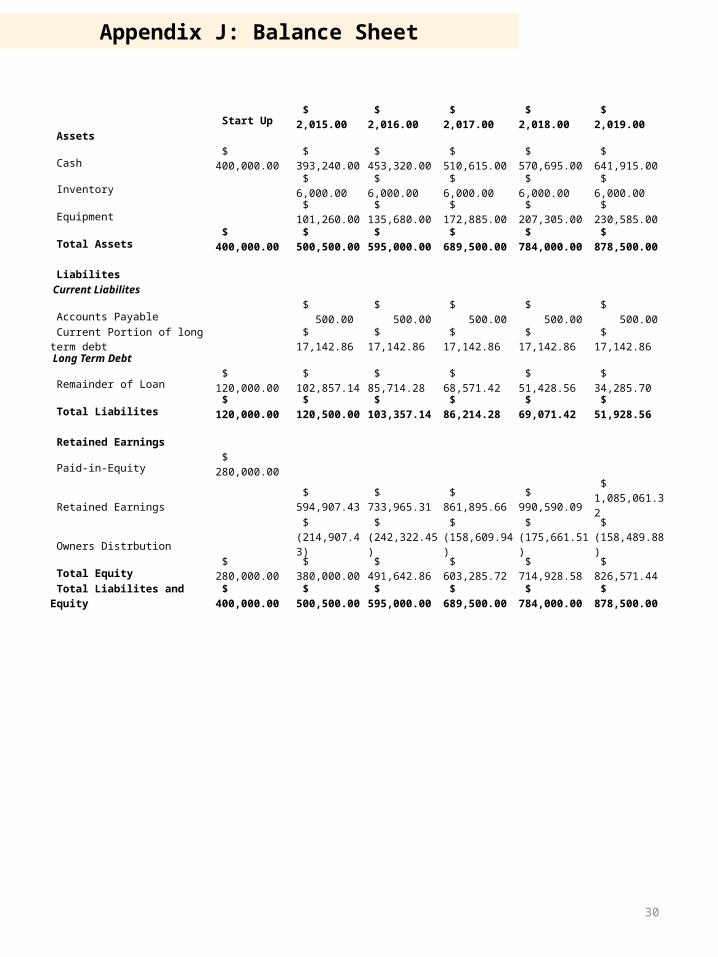
Appendix J: Balance Sheet
Start Up $ 2,015.00 $ 2,016.00 $ 2,017.00 $ 2,018.00 $ 2,019.00 Assets
Cash $ 400,000.00 $ 393,240.00 $ 453,320.00 $ 510,615.00 $ 570,695.00 $ 641,915.00 Inventory $ 6,000.00 $ 6,000.00 $ 6,000.00 $ 6,000.00 $ 6,000.00
Equipment $ 101,260.00 $ 135,680.00 $ 172,885.00 $ 207,305.00 $ 230,585.00
Total Assets $ 400,000.00 $ 500,500.00 $ 595,000.00 $ 689,500.00 $ 784,000.00 $ 878,500.00
Liabilites Current Liabilites
Accounts Payable $ 500.00 $ 500.00 $ 500.00 $ 500.00 $ 500.00 Current Portion of long term debt $ 17,142.86 $ 17,142.86 $ 17,142.86 $ 17,142.86 $ 17,142.86 Long Term Debt Remainder of Loan $ 120,000.00 $ 102,857.14 $ 85,714.28 $ 68,571.42 $ 51,428.56 $ 34,285.70
Total Liabilites $ 120,000.00 $ 120,500.00 $ 103,357.14 $ 86,214.28 $ 69,071.42 $ 51,928.56
Retained Earnings Paid-in-Equity $ 280,000.00
Retained Earnings $ 594,907.43 $ 733,965.31 $ 861,895.66 $ 990,590.09 $ 1,085,061.32 Owners Distrbution $ (214,907.43) $ (242,322.45) $ (158,609.94) $ (175,661.51) $ (158,489.88)
Total Equity $ 280,000.00 $ 380,000.00 $ 491,642.86 $ 603,285.72 $ 714,928.58 $ 826,571.44
Total Liabilites and Equity $ 400,000.00 $ 500,500.00 $ 595,000.00 $ 689,500.00 $ 784,000.00 $ 878,500.00
31
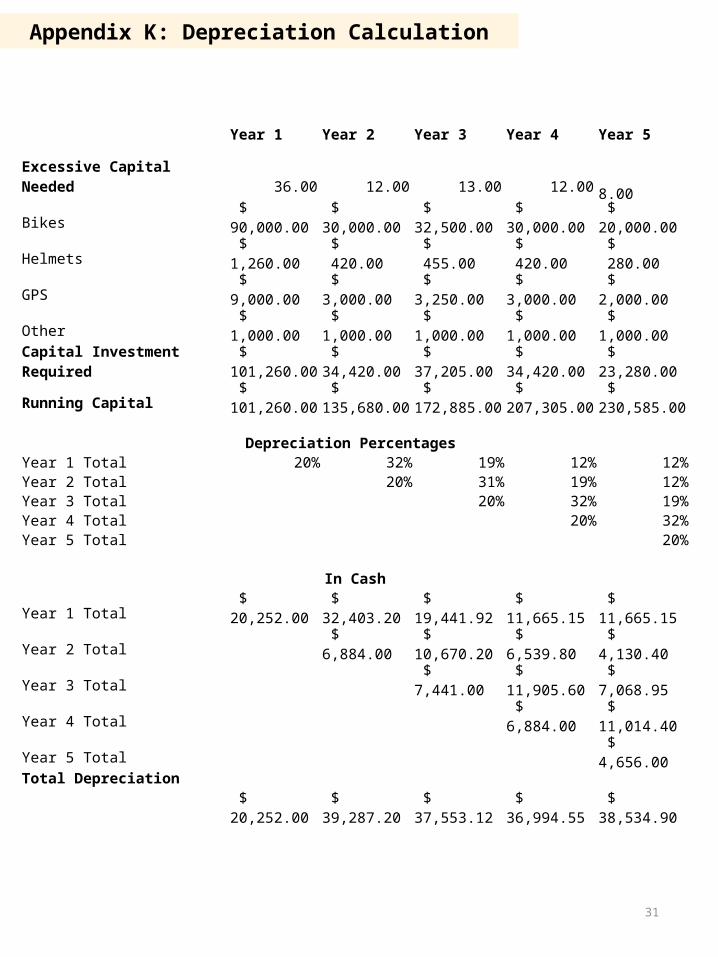
Appendix K: Depreciation Calculation
Year 1 Year 2 Year 3 Year 4 Year 5
Excessive Capital Needed 36.00 12.00 13.00 12.00 8.00 Bikes $ 90,000.00 $ 30,000.00 $ 32,500.00 $ 30,000.00 $ 20,000.00 Helmets $ 1,260.00 $ 420.00 $ 455.00 $ 420.00 $ 280.00 GPS $ 9,000.00 $ 3,000.00 $ 3,250.00 $ 3,000.00 $ 2,000.00 Other $ 1,000.00 $ 1,000.00 $ 1,000.00 $ 1,000.00 $ 1,000.00 Capital Investment Required $ 101,260.00 $ 34,420.00 $ 37,205.00 $ 34,420.00 $ 23,280.00 Running Capital $ 101,260.00 $ 135,680.00 $ 172,885.00 $ 207,305.00 $ 230,585.00
Depreciation Percentages Year 1 Total 20% 32% 19% 12% 12%Year 2 Total 20% 31% 19% 12%Year 3 Total 20% 32% 19%Year 4 Total 20% 32%Year 5 Total 20%
In CashYear 1 Total $ 20,252.00 $ 32,403.20 $ 19,441.92 $ 11,665.15 $ 11,665.15 Year 2 Total $ 6,884.00 $ 10,670.20 $ 6,539.80 $ 4,130.40 Year 3 Total $ 7,441.00 $ 11,905.60 $ 7,068.95 Year 4 Total $ 6,884.00 $ 11,014.40 Year 5 Total $ 4,656.00 Total Depreciation
$ 20,252.00 $ 39,287.20 $ 37,553.12 $ 36,994.55 $ 38,534.90