Embed Size (px)
Citation preview
MONTHLY REPORTISIN: LU1341746177CLASS E/C - USDAPRIL 2016EMERGING SUSTAINABLE AFRICA FUND
SYMBIOTICS SICAV - SIVMANAGER'S COMMENT
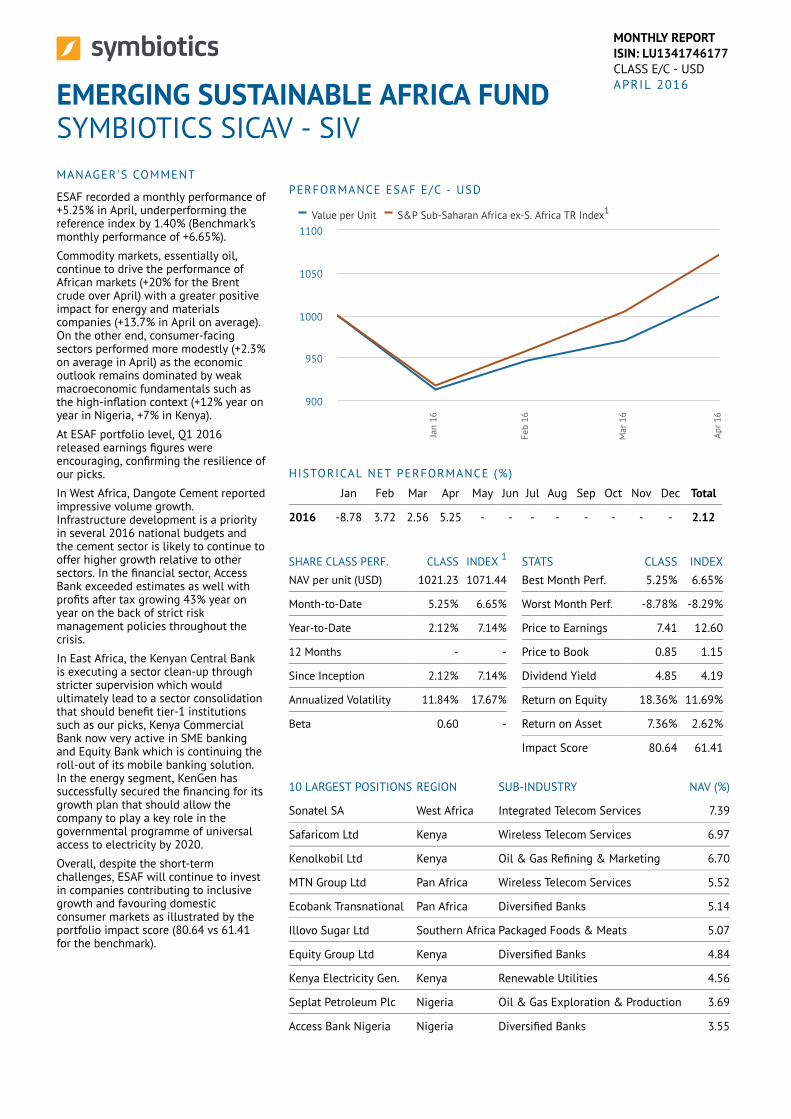
ESAF recorded a monthly performance of+5.25% in April, underperforming thereference index by 1.40% (Benchmark’smonthly performance of +6.65%).
Commodity markets, essentially oil,continue to drive the performance ofAfrican markets (+20% for the Brentcrude over April) with a greater positiveimpact for energy and materialscompanies (+13.7% in April on average).On the other end, consumer-facingsectors performed more modestly (+2.3%on average in April) as the economicoutlook remains dominated by weakmacroeconomic fundamentals such asthe high-inflation context (+12% year onyear in Nigeria, +7% in Kenya).
At ESAF portfolio level, Q1 2016released earnings figures wereencouraging, confirming the resilience ofour picks.
In West Africa, Dangote Cement reportedimpressive volume growth.Infrastructure development is a priorityin several 2016 national budgets andthe cement sector is likely to continue tooffer higher growth relative to othersectors. In the financial sector, AccessBank exceeded estimates as well withprofits after tax growing 43% year onyear on the back of strict riskmanagement policies throughout thecrisis.
In East Africa, the Kenyan Central Bankis executing a sector clean-up throughstricter supervision which wouldultimately lead to a sector consolidationthat should benefit tier-1 institutionssuch as our picks, Kenya CommercialBank now very active in SME bankingand Equity Bank which is continuing theroll-out of its mobile banking solution.In the energy segment, KenGen hassuccessfully secured the financing for itsgrowth plan that should allow thecompany to play a key role in thegovernmental programme of universalaccess to electricity by 2020.
Overall, despite the short-termchallenges, ESAF will continue to investin companies contributing to inclusivegrowth and favouring domesticconsumer markets as illustrated by theportfolio impact score (80.64 vs 61.41for the benchmark).
PERFORMANCE ESAF E/C - USD
HISTORICAL NET PERFORMANCE (%)
Jan Feb Mar Apr May Jun Jul Aug Sep Oct Nov Dec Total
2016 -8.78 3.72 2.56 5.25 - - - - - - - - 2.12
SHARE CLASS PERF. CLASS INDEX 1
NAV per unit (USD) 1021.23 1071.44
Month-to-Date 5.25% 6.65%
Year-to-Date 2.12% 7.14%
12 Months - -
Since Inception 2.12% 7.14%
Annualized Volatility 11.84% 17.67%
Beta 0.60 -
STATS CLASS INDEXBest Month Perf. 5.25% 6.65%
Worst Month Perf. -8.78% -8.29%
Price to Earnings 7.41 12.60
Price to Book 0.85 1.15
Dividend Yield 4.85 4.19
Return on Equity 18.36% 11.69%
Return on Asset 7.36% 2.62%
Impact Score 80.64 61.41
10 LARGEST POSITIONS REGION SUB-INDUSTRY NAV (%)
Sonatel SA West Africa Integrated Telecom Services 7.39
Safaricom Ltd Kenya Wireless Telecom Services 6.97
Kenolkobil Ltd Kenya Oil & Gas Refining & Marketing 6.70
MTN Group Ltd Pan Africa Wireless Telecom Services 5.52
Ecobank Transnational Pan Africa Diversified Banks 5.14
Illovo Sugar Ltd Southern Africa Packaged Foods & Meats 5.07
Equity Group Ltd Kenya Diversified Banks 4.84
Kenya Electricity Gen. Kenya Renewable Utilities 4.56
Seplat Petroleum Plc Nigeria Oil & Gas Exploration & Production 3.69
Access Bank Nigeria Nigeria Diversified Banks 3.55
Jan
16
Feb
16
Mar
16
Apr 1
6
900
950
1000
1050
1100Value per Unit S&P Sub-Saharan Africa ex-S. Africa TR Index1
FinancialsDiversified BanksTelecom ServicesIntegrated Telecom ServicesWireless Telecom ServicesConsumer StaplesBrewersFood RetailPackaged Foods & MeatsEnergyOil & Gas Exploration & ProductionOil & Gas Refining & MarketingMaterialsConstruction MaterialsUtilitiesElectric UtilitiesRenewable UtilitiesIndustrialsMarineHealthcarePharmaceuticals
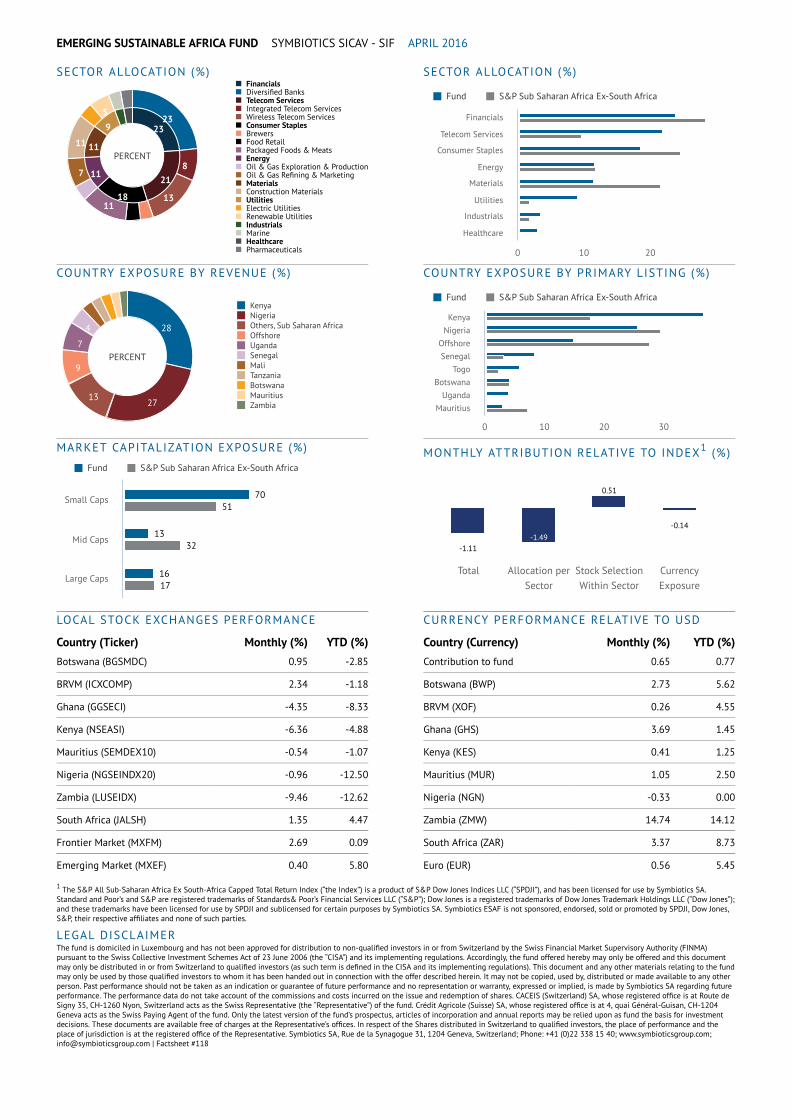
SECTOR ALLOCATION (%) SECTOR ALLOCATION (%)
COUNTRY EXPOSURE BY REVENUE (%) COUNTRY EXPOSURE BY PRIMARY LISTING (%)
MARKET CAPITALIZATION EXPOSURE (%) MONTHLY ATTRIBUTION RELATIVE TO INDEX1 (%)
LOCAL STOCK EXCHANGES PERFORMANCE
Country (Ticker) Monthly (%) YTD (%)Botswana (BGSMDC) 0.95 -2.85
BRVM (ICXCOMP) 2.34 -1.18
Ghana (GGSECI) -4.35 -8.33
Kenya (NSEASI) -6.36 -4.88
Mauritius (SEMDEX10) -0.54 -1.07
Nigeria (NGSEINDX20) -0.96 -12.50
Zambia (LUSEIDX) -9.46 -12.62
South Africa (JALSH) 1.35 4.47
Frontier Market (MXFM) 2.69 0.09
Emerging Market (MXEF) 0.40 5.80
CURRENCY PERFORMANCE RELATIVE TO USD
Country (Currency) Monthly (%) YTD (%)Contribution to fund 0.65 0.77
Botswana (BWP) 2.73 5.62
BRVM (XOF) 0.26 4.55
Ghana (GHS) 3.69 1.45
Kenya (KES) 0.41 1.25
Mauritius (MUR) 1.05 2.50
Nigeria (NGN) -0.33 0.00
Zambia (ZMW) 14.74 14.12
South Africa (ZAR) 3.37 8.73
Euro (EUR) 0.56 5.45
1 The S&P All Sub-Saharan Africa Ex South-Africa Capped Total Return Index (“the Index”) is a product of S&P Dow Jones Indices LLC (“SPDJI”), and has been licensed for use by Symbiotics SA.Standard and Poor’s and S&P are registered trademarks of Standards& Poor’s Financial Services LLC (“S&P”); Dow Jones is a registered trademarks of Dow Jones Trademark Holdings LLC (“Dow Jones”);and these trademarks have been licensed for use by SPDJI and sublicensed for certain purposes by Symbiotics SA. Symbiotics ESAF is not sponsored, endorsed, sold or promoted by SPDJI, Dow Jones,S&P, their respective affiliates and none of such parties.
LEGAL DISCLAIMERThe fund is domiciled in Luxembourg and has not been approved for distribution to non-qualified investors in or from Switzerland by the Swiss Financial Market Supervisory Authority (FINMA)pursuant to the Swiss Collective Investment Schemes Act of 23 June 2006 (the “CISA”) and its implementing regulations. Accordingly, the fund offered hereby may only be offered and this documentmay only be distributed in or from Switzerland to qualified investors (as such term is defined in the CISA and its implementing regulations). This document and any other materials relating to the fundmay only be used by those qualified investors to whom it has been handed out in connection with the offer described herein. It may not be copied, used by, distributed or made available to any otherperson. Past performance should not be taken as an indication or guarantee of future performance and no representation or warranty, expressed or implied, is made by Symbiotics SA regarding futureperformance. The performance data do not take account of the commissions and costs incurred on the issue and redemption of shares. CACEIS (Switzerland) SA, whose registered office is at Route deSigny 35, CH-1260 Nyon, Switzerland acts as the Swiss Representative (the “Representative”) of the fund. Crédit Agricole (Suisse) SA, whose registered office is at 4, quai Général-Guisan, CH-1204Geneva acts as the Swiss Paying Agent of the fund. Only the latest version of the fund’s prospectus, articles of incorporation and annual reports may be relied upon as fund the basis for investmentdecisions. These documents are available free of charges at the Representative’s offices. In respect of the Shares distributed in Switzerland to qualified investors, the place of performance and theplace of jurisdiction is at the registered office of the Representative. Symbiotics SA, Rue de la Synagogue 31, 1204 Geneva, Switzerland; Phone: +41 (0)22 338 15 40; www.symbioticsgroup.com;[email protected] | Factsheet #118
PERCENT
23
21
18
11
11
923
8
1311
7
11
5
Fund S&P Sub Saharan Africa Ex-South Africa
Financials
Telecom Services
Consumer Staples
Energy
Materials
Utilities
Industrials
Healthcare
0 10 20
PERCENT
28
2713
9
7
4
KenyaNigeriaOthers, Sub Saharan AfricaOffshoreUgandaSenegalMaliTanzaniaBotswanaMauritiusZambia
Fund S&P Sub Saharan Africa Ex-South Africa
KenyaNigeria
OffshoreSenegal
TogoBotswana
UgandaMauritius
0 10 20 30
70
13
16
51
32
17
Fund S&P Sub Saharan Africa Ex-South Africa
Small Caps
Mid Caps
Large Caps
-1.11-1.49
0.51
-0.14
Total Allocation perSector
Stock SelectionWithin Sector
CurrencyExposure
EMERGING SUSTAINABLE AFRICA FUND SYMBIOTICS SICAV - SIF APRIL 2016