Embed Size (px)
Citation preview

1
ISE 5984
Tutorial on Subscript
By
Stephen Lisse & Thanujan Ratnarajah
05/02/2007

2
Table of Contents
1. Introduction ................................................................................................................. 3
2. Creating Subscripts ..................................................................................................... 3
2.1. Single Dimensional Subscripts: .......................................................................... 3
2.2. Multi Dimensional Subscripts: ......................................................................... 10
3. Subscript Functions ................................................................................................... 14
3.1. Five main Vensim functions: ............................................................................ 14
3.2. Mapping the subscript ranges: .......................................................................... 15
4. Appendix ................................................................................................................... 16
4.1. Appendix 1 ........................................................................................................ 16
4.2. Appendix 2 ........................................................................................................ 19
5. References ................................................................................................................. 20

3
1. Introduction
Subscripts are useful in complex models when certain loops need to be replicated.
Through out this tutorial we use Electronics Inc as our example to demonstrate the use of
subscripts. When is it appropriate to use subscripts in a model? Electronics Inc, an
organization specializing in producing and selling electronics items (such as DVD player,
VCR, TV and PC) hope to identify the customer adoption dynamics in different countries
(US, UK, China, Canada, and India). They could create a single customer diffusion
model and replicate it 20 times (5 countries * 4 Products) for the analysis purposes. But
this would increase the size of the model increasing CPU usage and complexity of the
model. It will hard to keep track of the model variables where there are 20 different
representations. In such cases we could se subscripts to create 20 different copies without
actually replicating it 20 times.
2. Creating Subscripts
2.1. Single Dimensional Subscripts:
For the purpose of demonstrating the use of one-dimensional subscript within the model
we use the customer base diffusion model [1]. In this particular example the modeler
hopes to understand the dynamics of a particular organization (Electronics Inc) which
produces four different products in the US market. These four products have different
market size and price.
Product Market Size Price
DVD player (P1) 100000000 50
VCR (P2) 120000000 70
PC (P3) 80000000 100
TV (P4) 250000000 150
Instead of creating four different diffusion models it is effective to use subscript within
the model to understand the dynamics.
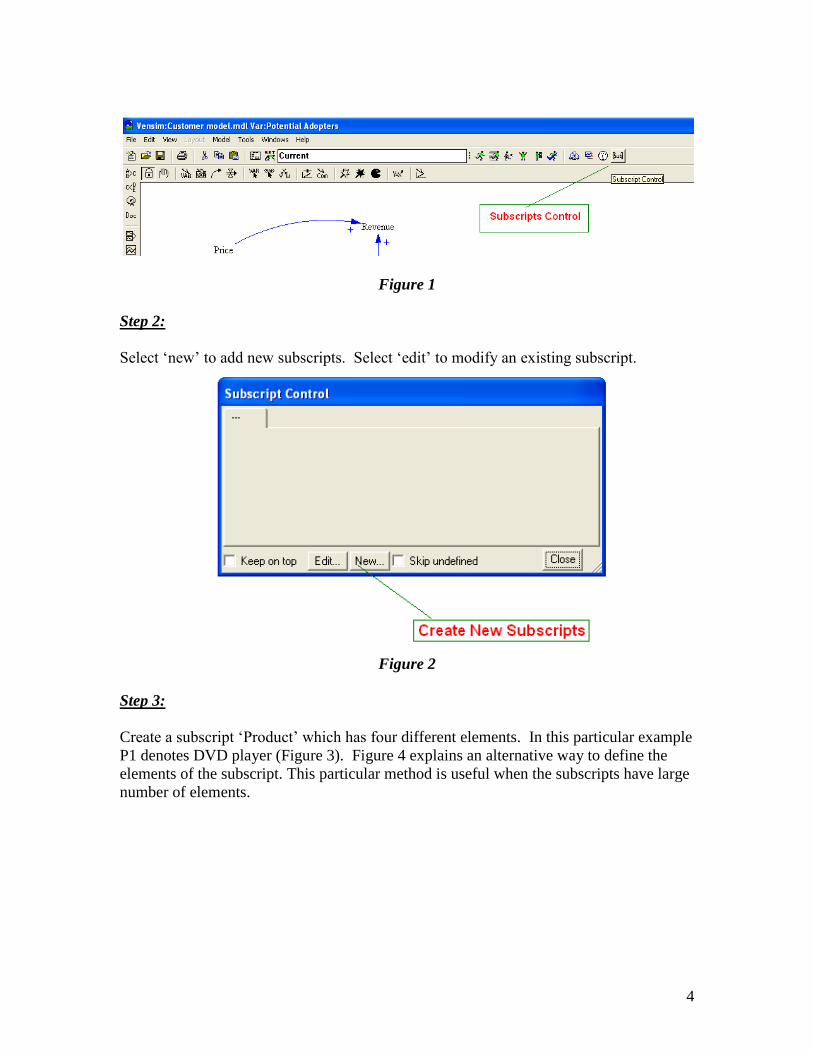
Step 1:
Setting Subscripts: Select the ‘sub’ button located on the right hand side of the toolbar
4
Figure 1
Step 2:
Select ‘new’ to add new subscripts. Select ‘edit’ to modify an existing subscript.
Figure 2
Step 3:
Create a subscript ‘Product’ which has four different elements. In this particular example
P1 denotes DVD player (Figure 3). Figure 4 explains an alternative way to define the
elements of the subscript. This particular method is useful when the subscripts have large
number of elements.

5
Figure 3
Figure 4
When the elements are defined in this particular format (Figure 4), Vensim understands
that the elements are defined from P1 to P4.

6
Step 4:
Apply this subscript to the cusomter.mdl. In this particular example the modeler wishes
to apply subscript to all the variables of the model.
Figure 5
After adding the subscript to the model each variable will have the name of the subscript
inside parenthesis next to them (Figure 6)

7
Figure 6
Step 5:
The four different products have different market size and price. This could be defined by
adding those values specifically under Total Market Size and Price (Figure 7 and Figure
8).
If only one value is defined under Total Market size, Vensim would assume that the
market size is same for all products and would apply that value for all four elements. But
if the number values defined for these variables are greater than one but less than four or
greater than 4, Vensim would display an error message. Hence for a four element
subscript you can have one value or four separate values defined for each variable.
Anything other than that would display an error message.

8
Figure 7
Figure 8

9
Step 6:
Before simulating the model the modeler can decide which elements he/she would like to
see in a variable graph. You can do this by selecting the subscript control button (‘sub’-
Figure 1).
Then select which product needs to be added to the graph and adding them to the right
hand side panel (Selected elements)
Figure 9
Step 7:
Simulate the model. Figure 10 shows the dynamics of the potential adopters for the four
different products.

10
Potential Adopters
400 M
300 M
200 M
100 M
0
0 1 2 3 4 5 6 7 8 9 10
Time (Year)
house
hold
s
Potential Adopters[P1] : Current
Potential Adopters[P2] : Current
Potential Adopters[P3] : Current
Potential Adopters[P4] : Current
Figure 10
2.2. Multi Dimensional Subscripts:
In the previous example we concentrated on Electronics Inc’s customer diffusion models
for their four products sold in the US market. But if Electronics Inc had branches in
Canada, India, China and UK we will have to replicate the previous example model five
times to understand the dynamics in each country. But the efficient way to do this is to
use multi dimensional subscripts method. One of the dimensions we created was called
Product. We will create a second dimension called Location to capture the diffusion
models in the 5 countries where they have branches.
US Market (L1)
Product Market Size Price (US $)
DVD player (P1) 100000000 50
VCR (P2) 120000000 70
PC (P3) 80000000 100
TV (P4) 250000000 150

11
Canada Market (L2)
Product Market Size Price (US $)
DVD player (P1) 80000000 75
VCR (P2) 90000000 80
PC (P3) 80000000 110
TV (P4) 50000000 170
UK Market (L3)
Product Market Size Price (US $)
DVD player (P1) 90000000 100
VCR (P2) 110000000 140
PC (P3) 70000000 120
TV (P4) 220000000 300
India Market (L4)
Product Market Size Price (US $)
DVD player (P1) 200000000 25
VCR (P2) 180000000 35
PC (P3) 90000000 50
TV (P4) 300000000 75
China Market (L5)
Product Market Size Price (US $)
DVD player (P1) 400000000 25
VCR (P2) 190000000 30
PC (P3) 100000000 30
TV (P4) 400000000 20
Step 1: Please follow the same procedure explained in section 2.1 in step 1
Step 2: Please follow the same procedure explained in section 2.1 in step 2
Step 3: Please follow the same procedure explained in section 2.1 in step 3
Step 4: Please follow the same procedure explained in section 2.1 in step 4
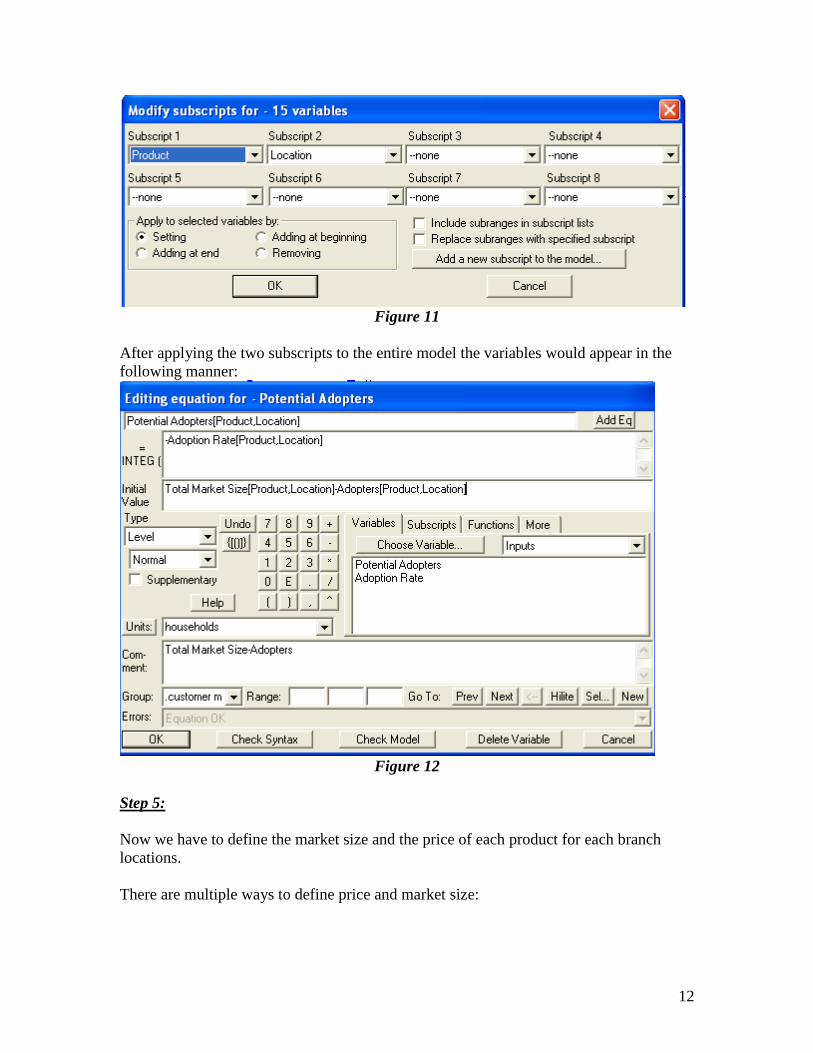
Here pick ‘Location’ from the scroll down menu under Subscripts 2. Similarly if you
have more than two subscripts you can chose them individually.
12
Figure 11
After applying the two subscripts to the entire model the variables would appear in the
following manner:
Figure 12
Step 5:
Now we have to define the market size and the price of each product for each branch
locations.
There are multiple ways to define price and market size:

13
Method 1: This particular method could only be used for one or two dimensional
subscripts method.
Figure 13
Price[Product,Location] =
50,75,100,25,25;70,80,140,35,30;100,110,120,50,30;150,170,300,75.20;
The semicolons separate the prices for each product. The commas separate the price at
each location for a given product.
Method 2: This could be used for any number of dimensions.
Price[Product,Location] = TABBED ARRAY(
50 75 100 25 25
70 80 140 35 30
100 110 120 50 30
150 170 300 75 20)
Method 3: You can use excel files to import data from outside sources:
Price[Product,Location] = GET XLS DATA(
'data.xls','Test Tab','A1')

14
Vensim will open the excel file named ‘data.xls’ and read the data from Test Tab.
Location data will be read across starting from A1 (A,B,C,D,E). Product will be read
down from G8 (1,2,3,4).
Step 6: Please follow the same procedure explained in section 2.1 in step 6
Step 7: Please follow the same procedure explained in section 2.1 in step 7
3. Subscript Functions
3.1. Five main Vensim functions:
SUM: Gives the sum of the subscript values
PROD: Gives the product of the subscript values
VMIN: Gives the minimum value of the subscript values
VMAX: Gives the maximum value of the subscript values
ELMCOUNT: Gives the total number of elements within the subscripts
Sum:
The variable ‘Revenue’ in the model (customer model_multiple.mdl) is defined as:
Revenue[Product,Location] = Purchase
Rate[Product,Location]*Price[Product,Location]
This would produce the revenue for each product at each location individually. In order
to calculate the total revenue of this organization (at all locations) we create a variable
‘Total Revenue’, such that:
Total Revenue = SUM(Revenue[Product!,Location!])
Vensim will total the revenue created by each product (indicated by ‘!’) at all locations.
There are is no subscript notation in the naming convention. It is because the ‘Total
Revenue’ variable creates a single value and not a matrix.
To know how much each branch (location) of the Electronic INC makes through the
entire product as revenue we created a variable ‘Revenue by Location’:
Revenue by Location[Location] = SUM(Revenue[Product!,Location])
Prod:
If a variable is defined as:
15
Probability = Success rate [type 1] * Success rate [type 2]* Success rate [type 3]…….
Success rate [type n]
This could be defined by:
Probability = PROD(Success rate [type 1!])
VMIN:
Min Revenue= VMIN(Revenue by Location[Location!])
This function will return the minimum variable presented in the ‘Revenue by Location’
matrix.
VMAX:
MAX Revenue= VMAX(Revenue by Location[Location!])
This function will return the minimum variable presented in the ‘Revenue by Location’
matrix.
ELMCOUNT:
Number of products = ELMCOUNT(Product)
This function will count the total number of elements within the subscript ‘Product’. This
function can only take a single subscript dimension.
3.2. Mapping the subscript ranges:
It is sometimes necessary to map one subscript range to another. For example assume
Electronics Inc specializes in producing and selling certain products in certain locations.
Electronics Inc produces and sells only DVD players in China
Electronics Inc produces and sells only TV in US
Electronics Inc produces and sells only PC in UK
Price at Location [Location] = Price of Product [Product]
This equation will generate an error in Vensim since the subscript range in the right hand
side and the left hand side is different. We can eliminate the error by mapping the
subscript ranges.
During the definition of subscripts (Step 3) we need to define it in the following manner:
Product: DVD, TV,PC -> Location
Location: China, US, Canada
‘->’ notation maps the Product subscript to Location subscript.

16
4. Appendix
4.1. Appendix 1
1. Introduction to Subscripts
From Reference a., it is known that subscripting enables construction of very advanced
arrayed Vensim Models. Subscripting is used when a piece of model structure will need
to be repeated over and over again and a subscript allows one variable and equation to
represent a number of different distinct concepts.
a. What are subscripts
Also, as discussed in Reference b., subscripts allow a single variable to represent more
than one thing, and subscripts are only available in Vensim Professional and DSS. All
variable types except Groups, Units, String Constants, Subscript Ranges, Subscript
Elements, and Time Bases can have subscripts. Subscripts are enclosed in square brackets
[ ] directly following the variable name.
b. What are the uses of subscripts
Referring again to Reference b., a variable can have up to eight subscripts separated by
commas. Vensim will return error messages if you do not use subscript values for a
variable consistently throughout the model. Subscript elements are also sometimes
referred to as subscript constants.
One can repeat structure by creating and debugging one structure, then copying and
replicating
that structure as many times as needed. However, this may lead to complex diagrams and
hard-wiring of constant values and number of structures. Subscripting is a better way to
repeat structure. A subscript can be created and added to the one original structure,
creating as many structures as there are subscript elements. So numbers of structures and
numerical values for all structures can easily be changed. Diagrams will also be neater.
Subscripts can also allow construction of a single stock that represents many different
segments of the same physical process. This same structure can be built using subscripts
to represent each age category. By using subscripts, you can easily change the number or
characteristics of age categories by changing subscript names and values. Thus you do
not have to change the physical structure by removing or adding stocks.
Additionally, subscripts have several special functions designed to manipulate equations.
The
SUM function sums all values of a subscript marked with an exclamation mark (!). Other
functions include products, maximums, and minimums.

17
Further, it should be noted that subscripts should not appear in sketches. Sketches
represent structure, and subscripts are a convenient way of replicating structure. A sketch
maintains a simpler and less cluttered view of a model by not distinguishing subscripted
and unsubscripted variables.
c. Examples of subscript usage related to modeling
Some examples of subscript use from Reference b. are discussed in the following
paragraphs.
A retail outlet such as a shoe retailer might have stores in three locations. A
model can be built for one store with structure for staff, inventory, sales, etc.
Once that model simulates properly, a subscript is created called Location, with
the subscript elements Boston, New York, and San Francisco. The subscript
Location is added to the one store structure, constants are modified to reflect the
value for each location, and now the one model contains three structures.
Each subscripted structure can be individually customized, with different
constants, multiple equations, even multiple subscripts.
Also, in a company containing a workforce, the subscript [worktype] might represent the
types of workers in the company, and the subscript [location] might represent the
physical location of the office or plant. So the equation subscript hires[worktype,
location] = desired hires[worktype, location] / time to hire worker [worktype] allows one
equation to represent the hiring of workers for all types of work and for all location
(using only two subscripts). Note that the time to hire a worker in the above equation is
considered to be different depending on worktype, but not location (therefore the
subscript is only for worktype).
Additionally, an example of the SUM function is shown below:
total workers[worktype] = SUM ( Workers[worktype, location!])
The above equation describes the summing of workers of each particular worktype (e.g.,
office staff, plant operators) over all locations. That is, total office staff summed over all
locations, total plant operators summed over all locations. The SUM function works on
the subscript location because location is marked with the exclamation mark.

18
2. Creating Subscripts Within A Model
a. How to create subscripts in a simple model
The following discussion is taken from the Edit Manual of Reference b.
The Set Subscripts command lets you set subscripts on the selected variables. This is a
convenient way to add subscripts to the model variables without having to modify
individual equations. It is, of course, still possible to modify individual equations and this
is often necessary when you have multiple equations for a variable or want to use a vector
function.
When you choose the Set Subscripts command the Subscript Modification dialog will
appear:
The title bar indicates that name of the variable being changed or, if you have selected
more than one variable, the number of variables being changed.
Subscript 1 through Subscript 8 allow you to set the subscripts. Normally you will only
use one or to of these but it is possible to use all 8 so they are included for completeness.
Click on the dropdown box to select a Subscript Range. When you open this dialog with
a single variable selected the subscripts showing will be those for the variable. If you
open it with more than one variable selected and each selected variable has the same
subscripts (in the same order) these will be shown. If the subscripts are not the same for
the existing variables the dialog will appear as it does above, with --none showing for
each subscript.
Apply to selected variables by lets you specify how you want to modify the equations for
the selected variables.
Setting causes the selected variables to take on the new set of subscripts. The subscripts
for these variables are changed to be the ones specified in the order specified. If a
variable already has any of these subscripts the usage will not be changed. For example if
Pop was subscripted by age and there was an equation with SUM(Pop[age!]), then
changing the subscripts to [country,age] would change the expression to
SUM(Pop[country,age!]). Similarly if you have multiple equations with Subscript
Constants these will be retained. If a variable has additional subscripts not in the list these
will be removed.
Adding at end causes the selected subscripts to be added at the end of the existing
subscripts for a variable. Thus existing subscripts will not be removed. If the variable

19
already has one of the chosen subscripts it will be moved, if necessary so that it appears
at the end. For example adding age to a variable subscripted [age,sex,country] will
change the subscripts to [sex,country,age]. Just as for setting any existing occurrences of
the subscript will be maintained in their current form. You can add one or more
subscripts with this option.
Adding at beginning is the same as adding at end except the chosen subscripts appear
first, instead of last.
Removing will remove the chosen subscripts from the selected variables. If the variables
do not have any of the subscripts nothing will happen. Include subranges in subscript
lists, when checked, allows you to add subranges to variables. This can sometimes be
handy if some variables will only be computed and used on a Subrange.
Replace subranges with the specified subscript allows you to override the default
behavior for setting and adding subscripts. When this is checked if Vensim finds a
subrange for one of the chosen subscripts it will replace it with the chosen subscript,
rather than leaving it alone. Note that Vensim will still leave Subscript Elements alone. If
you want to change these first remove them, then add the subscript range.
Add a new subscript to the model allows you to add subscripts. This can also be done
from the Subscript Control or from the Equation Editor and this button is just a
convenient alternative to those techniques.
4.2. Appendix 2
Subscript Errors
Using an equation with a Subscript Range is like using a "for" or "do" loop. Although
you do not need to specify this loop explicitly, the loop concept determines what you can
and cannot do. For example, consider the following equation:
births[country,income] =frac_birth_rat[country,income] *population[country,income] ~~|
This equation is really saying for each country {USA,CANADA,MEXICO} for each
income {LOW,MIDDLE,HIGH}
births[country,income]= frac_birth_rat[country,income] *population[country,income] ~~|
end for each income end for each country
The equations for country and class determine the meaning of each country and each
income as indicated by the comments. The Subscript Ranges on the left-hand side of an
equation determine the implicit "for each" components. Thus the equation
births[country,HIGH] = frac_birth_rat[country,income] *population[country,income] ~~|
would be wrong. The left-hand side implies only a single "for each" loop on country, but
the righthand side requires one for country and one for income. In this case, you will get
a message reporting that the Subscript Range income appears on the right but not on the
left of the equation.
Family mismatches are another common problem with subscripts. All variables must
have the same number of subscripts from the same family. For example, the equation that
contains both population[country] and population[country,income] will cause a problem

20
since population must be broken down either by country, or by country and income. It
cannot be broken down by country sometimes and by country and income at other times.
Even when the number of subscripts match, there can be problems if the families do not
also match. Suppose that population[country,income] appears in one place and
population[country,region] in another. It makes no sense for population to be broken
down in two different ways, both by income and by region.
Tracing Subscript Errors:
Subscript errors can be hard to trace because the equation that Vensim flags as having the
error might be correct, and another equation in error. Generally the best strategy for
finding subscript errors is to select the variable name that is causing problems as the
Workbench Variable and then click on the Uses Tree tool to show where it is used. By
looking at the equation for the variable, and then at each equation in which it is used, you
should be able to determine the source of the problem.
HINT: When working with the Sketch Editor, select a variable into the Workbench and
click on the Equation Edit tool contained in the Analysis Toolbar to directly open the
equation for a variable. When working with the Text Editor, turn on Entrain before you
select variables into the Workbench.
5. References Customer.mdl [1]: Created by Dr.Hazhir Rahmandad
Appendix 1: Vensim Reference manual
Appendix 2: Vensim Reference manual