Embed Size (px)
Citation preview

ISCO - Fenton-like treatment of MtBE contaminated groundwater
Renato Baciocchi
Summer school on Advanced Oxidation processesUniversity of Salerno - June 16, 2015
Laboratory of Environmental Engineering
University of Rome “Tor Vergata”

Outline
� What is ISCO?� Basics of ISCO design� Why do we need to cleanup MtBE ?� Case study
- Feasibility study of ISCO treatment of MtBE (Lab + Modeling)- ISCO pilot-scale test on a MtBE contaminated site- Lesson learned and conclusions
2

What is ISCO
3
� Hydrogen peroxide (Fenton’s reagent)
� Potassium permanganate
� Sodium persulfate (activated)
� Ozone
ISCO = In-Situ Chemical Oxidation
Application of an AOP to the subsoil

What is ISCO
4

What is ISCO
5
from: EPA/600/R-06/072 August, 2006

What is ISCO
6
Oxidant Redox potential (Eo) (V)
Hydroxyl radical 2.8
Sulfate radical 2.6
Ozone 2.07
Persulfate ion 2.01
Hydrogen peroxide 1.70
Permanganate ion 1.68

What is ISCO
7
Fe3+ + H2O
2⇒ Fe2+ + HO
2• + H+
HO2
• + Fe3+ ⇒ O2 + H+ + Fe2+
HO2
• ⇔ O2-• + H+
H2O2 + Fe2+ ⇒⇒⇒⇒ Fe3+ + OH- + OH•
OH• + Fe2+ ⇒ Fe3+ + OH-
OH• + H2O2 ⇒ HO2
• + H2O
H2O2 ⇔ H2O + ½ O2
O2-• + Fe3+ ⇒ Fe2+ + O2
O2-• + Fe2+ + 2H+ ⇒ Fe3+ + H2O2
O2-• + HO
2• + 2H+ ⇒ HO
2- + O2
Non productiveconsumption
Superoxideradical
Hydroperoxideradical
Redox cycleFe2+/Fe3+

What is ISCO
8
Fenton process:
• Reaction in aqueous phase
• [H2O2] low (< 10-2M)
• Acid pH (2 – 3)
• Catalyst (Fe2+,Fe 3+)
Modified Fenton’s process:
• Soil + Water;
• [H2O2] high (> 10-2 M);
• “natural” pH(6 – 8);
• Catalyst (Fe2+, Fe3+);
• Chelants (for Fe) or stabilizers of H2O2
Fenton-like process:
• Soil + Water;
• [H2O2] high (> 10-2 M);
• “natural” pH (6 – 8);
• Use of Fe present in the soil;
• Chelates (for Fe) + Stabilizers of H2O2

Why do we need to cleanup MtBE?
9
� Methyl-t-butil ether (MtBE)
� is used as an additive for gasoline to improve combustion efficiency
and to increase the octane rating as replacement for tetra-ethyl lead
In Europe MtBE is added to gasoline in the range 5 -20% (mean values around 5%)
Concawe, 2010

10
+ Highly soluble
+ Poorly volatile
+ Poorly biodegradable
= Effects on groundwater quality
Solubility in water (g/l) Henry’s constant (-)
Why do we need to cleanup MtBE?

Basics of ISCO design
11
� Lab-scale feasibility study
- selection of the most efficient oxidant
- oxidant lifetime/ decomposition kinetics
- optimization of oxidant dosage
� Hydrogeological characterization
- indirect estimate of geological characterisitics
- pumping tests (eventually slug tests)
- test with tracers: transmissivity of the aquifer
� Modelling and design of the pilot test
� ISCO Pilot test operation
� Design of full scale ISCO remediation

Case study: former petroleum storage tank site
� Confined aquifer (5 ÷ 6 m depth fromground level);
� Artificial groundwater’s gradient ~ 3%
� Only groundwater contamination:
� Fine sand and silt;� Heterogeneous soil (each meterpresents different texture).
12
Hydraulic barrier of Pump &Treat
• MtBE: 2000 ÷ 5000 µg/l;

Lab-scale feasibility test
� Selection of best oxidant: H2O2 (based on preliminary tests)� Oxidant dosage: concentration 6 % (based on preliminary tests)
� Oxidant lifetime/decomposition kinetics
Effect of stabilizerEffect of stabilizerEffect of stabilizerEffect of stabilizer
13
Effect of chelateEffect of chelateEffect of chelateEffect of chelate
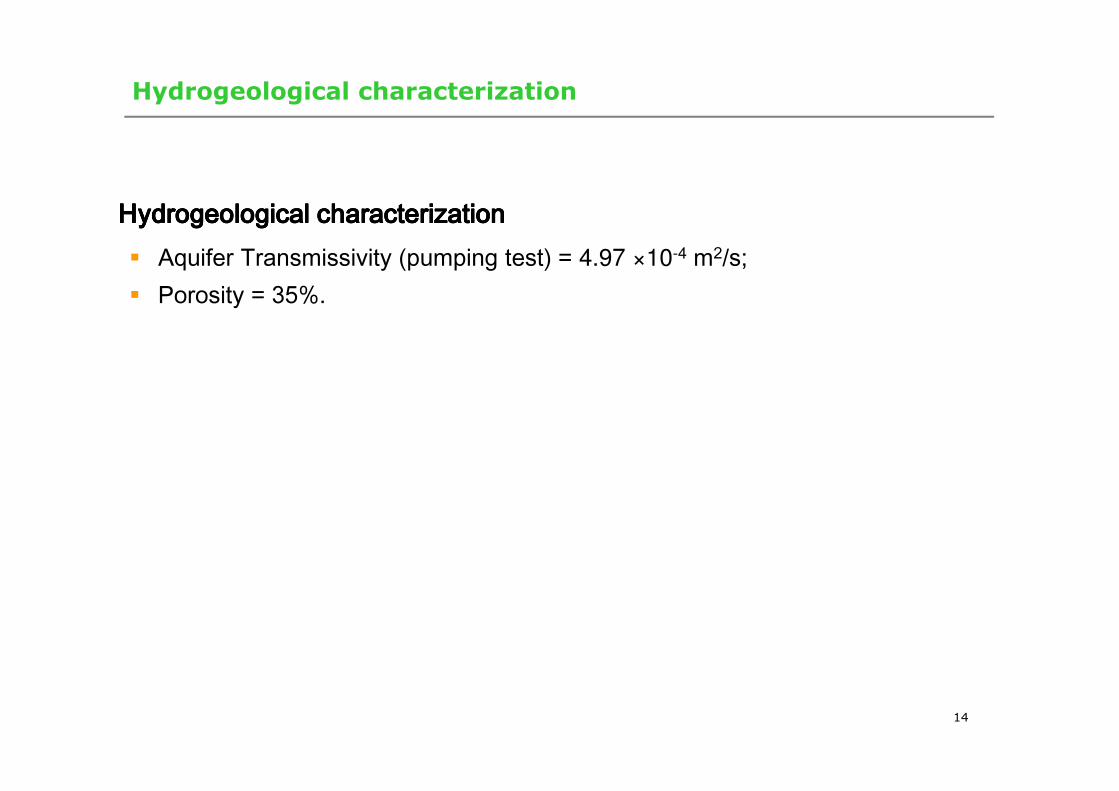
Hydrogeological characterization
HydrogeologicalHydrogeologicalHydrogeologicalHydrogeological characterizationcharacterizationcharacterizationcharacterization� Aquifer Transmissivity (pumping test) = 4.97 ×10⁻⁴ m2/s;� Porosity = 35%.
14

Modeling and design of the pilot test
� Pilot scale layout selection;� Identification of the most suitable injection rate;
ModellingModellingModellingModelling studystudystudystudy 2222DDDD
15
Parameter Units Value
Injection flow rate m3/day 2- 10
Hydrogen peroxide concentration %wt 6
Aquifer trasmissivity m2/s 5 × 10⁻⁴
Aquifer thickness m 2 - 4
Hydraulic gradient (with P&T in operation) % 3
Porosity - 0.35
H2O2 decomposition rate constant (1st order) h-1 0.11
H2O2 injection time h 15

� N. 3 injection wells� N.10 monitoring wells� Depth of about 10 meters below ground
Design of the pilot test layout
16
Off gases from each well are collected and treated with GAC beforeventing.

Modeling of the ISCO pilot test (H2O2 delivery)
17
Hydrogen peroxide
distribution of hydrogen
peroxide after 15 hours
injection
Q = 2 m3/day; s= 2mQ = 10 m3/day; s= 2m
Q = 10 m3/day; s= 4m Q = 2 m3/day; s= 4m
Different flow rates and
thickness of the target
aquifer were assumed

18
ModellingModellingModellingModelling studystudystudystudy 2222DDDD
Conditions simulated with FEFLOW ROI
(m)
O2max
(m3/h)
Δh
(m)
Q = 10 m3/day for 15 h (k = 0.11 h-1; thickness 4 m) 2.5 – 4 9 0.6
Q = 2 m3/day for 15 h (k = 0.11 h-1; thickness 4 m) 1.2 – 2.5 1.8 0.15
Q = 10 m3/day for 15 h (k = 0.11 h-1; thickness 2 m) 3.3 – 5.5 9 0.6
Q = 2 m3/day for 15 h (k = 0.11 h-1; thickness 2 m) 1.5 – 3.5 1.8 0.15
Modeling of the ISCO pilot test (H2O2 ROI)
ROI = Radius of InfluenceO2max = Maximum stoichiometric O2 production by H2O2 decompositionΔh = Estimated increase of water head near the injection well

Injection skid
Qinj= 2 ÷10 m3/d for each injection well
Pilot plant
19
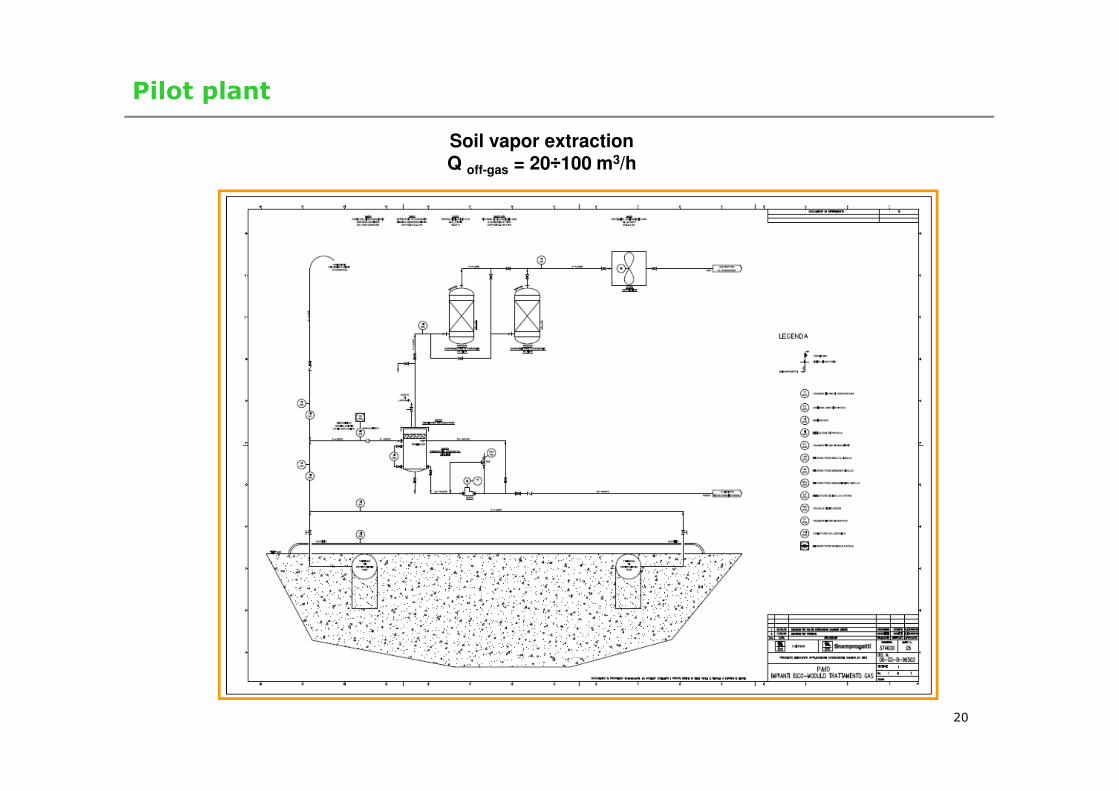
Soil vapor extractionQ off-gas = 20÷100 m3/h
Pilot plant
20

Pilot plant and injection/monitoring wells
� Injection and monitoring wells
� Pilot plant
21

Pilot plant management
� OneOneOneOne injectioninjectioninjectioninjection cyclecyclecyclecycle waswaswaswas completedcompletedcompletedcompleted ((((16161616hhhh ofofofof injectioninjectioninjectioninjection))))::::• H2O2 6%, Qinj = 2 m3/d (for each inj. well)
� BeforeBeforeBeforeBefore HHHH2222OOOO2222 injectioninjectioninjectioninjection,,,, aaaa chelatingchelatingchelatingchelating agentagentagentagent (EDTA)(EDTA)(EDTA)(EDTA) solutionsolutionsolutionsolution waswaswaswas injectedinjectedinjectedinjected;
22

Groundwater monitoring during injection (H2O2)
Results of the pilot-scale test - H2O2 (%wt) contour lines (axis scale in m):
(a) after 6h injection;
(b) after 11h injection.
23

Results of the pilot-scale test - Redox (mV) contour lines (axis scale in m):
(a) after 6h injection;
(b) after 12h injection.
24
Groundwater monitoring during injection (Redox)

Results of the pilot-scale test - pH contour lines (axis scale in m):
(a) after 6h injection;
(b) after 12h injection.
25
Groundwater monitoring during injection (pH)

Results of the pilot-scale test - O2 (%) contour lines (axis scale in m):
(a) after 6h injection;
(b) after 12h injection.
26
Off-gas monitoring during injection (O2)

Results of the pilot-scale test - CO2 (%) contour lines (axis scale in m):
(a) after 6h injection;
(b) after 30h injection.
27
Off-gas monitoring during injection (CO2)

Results of the pilot-scale test -- MtBE (µg/L) contour lines (axis scale in m):
(a) after chelating agent injection;
(b) after H2O2 injection.
28
Groundwater analysis (MtBE)

Results of the pilot-scale test -- TBA (µg/L) contour lines (axis scale in m) :
(a) after chelating agent injection;
(b) after H2O2 injection.
29
Groundwater analysis (TBA)

Results of the pilot-scale test -- TPH (µg/L) contour lines (axis scale in m) :
(a) after chelating agent injection;
(b) after H2O2 injection.
30
Groundwater analysis (TPH)

Secondary effects: metal mobilization
31
FeFeFeFe
MnMnMnMn

Mass balance
32
, ,
2
in i out i
i
i
M MCO
MWγ
−= ⋅
It was performed on the carbon dioxide produced by MtBE mineralization
Measured CO2: estimated from the flow rate of each off-gas extraction well
(approximately 1.5 m3/h) and the corresponding CO2 concentration measured at
different time intervals.
Calculated CO2:
5 12 2 2 2
155 6
2+ → +C H O O CO H O
4 10 2 2 26 4 5+ → +C H O O C O H O
2 2 24 2
+ + → +
n m
m mC H n O nCO H O
MtBE
TBA
TPH

Mass balance
33
Compound
Initial
Mass
(g)
Mass after
ISCO
(g)
Mass
removed
(g)
Calculated
CO2
(mol)
Measured
CO2
(mol) W W + S W W + S W W + S W W + S
MtBE 169 171 26.1 26.4 143 145 8.1 8.2
78 TBA 184 185 41.2 41.3 143 143 7.7 7.7
TPH 108 1499 24.7 343.9 83 1155 5.8 79.8
Total 461 1855 92 412 369 1443 22 96
Two assumptions were made
W: MtBE only in the water phase
W+S: MtBE both in the water and soil phase = ⋅ ⋅s w o c o cC C k f

Lessons learned: H2O2 delivery
34
Possibly the oxidant propagationcould have addressed only themore permeable layer, whereprobably most of MtBEcontaminated groundwater shouldbe present.
Q = 2 m3/day; s= 4m
Q = 2 m3/day; s= 2m
FieldFieldFieldField datadatadatadataModelModelModelModel predictionspredictionspredictionspredictions

Lessons learned (H2O2 delivery vs. MtBE degradation)
35
H2O2 propagation Residual MtBE
Good MtBE removal by 1 peroxide injection (8 wells about 13 monitoredwells have met the cleanup goals).
No problem with gas production or local overheating.

� The feasibility test and the modeling activitied allowed for a properdesign of the ISCO pilot-scale tests
� Where hydrogen peroxide delivery was effective, MtBE, TBA and TPHwere effectively oxidised by ISCO using Fenton’s reagent and mostlymineralized
� Issues related to soil heterogeneity probably affected the delivery ofthe oxidant and the effectiveness of the ISCO treatment
Conclusions
36
• Iason Verginelli, Daniela Zingaretti post-docs in our group• Eni, for supporting this research and for pilot plant data
Acknowledgements
37