Embed Size (px)
Citation preview
ISBRA 2006 ISBRA 2006 HIV and HIV and Alcohol Alcohol SymposiumSymposium
Jeffrey H. Samet, MD, MA, MPH, ChairmanJeffrey H. Samet, MD, MA, MPH, Chairman
Evgeny M. Krupitsky, MD, Phd, Co-Evgeny M. Krupitsky, MD, Phd, Co-ChairmanChairman
The Impact of Alcohol The Impact of Alcohol Consumption on HIV Consumption on HIV Disease ProgressionDisease Progression
Jeffrey H. Samet, MD, MA, Jeffrey H. Samet, MD, MA, MPHMPHChief, Section General Internal MedicineChief, Section General Internal MedicineBoston Medical CenterBoston Medical CenterProfessor of Medicine and Public HealthProfessor of Medicine and Public HealthBoston University Schools of Medicine Boston University Schools of Medicine and Public Healthand Public Health
ISBRA 2006 HIV and Alcohol Symposium
AuthorsAuthors
Samet JH1, Cheng DM1, Libman H3, Nunes D1, Alperen J1, Faber V6, Saitz R1
1Boston Medical Center, Boston University School of Medicine, United States;
2Beth Israel Deaconess Medical Center, Harvard Medical School, United States;
3 DM-STAT, United States
Funded by the National Institute on Alcoholism and Alcohol Abuse: R01-AA13216, R01-AA11785, & R01-AA10870 and USPHS M01-RR00533 (GCRC)
BackgroundBackground
Alcohol use is common among Alcohol use is common among HIV-infected persons HIV-infected persons – 36% of HIV-infected veterans 36% of HIV-infected veterans
(n=881) were current hazardous (n=881) were current hazardous drinkers*drinkers*
– 42% of HIV-infected patients 42% of HIV-infected patients establishing primary care (n=664) establishing primary care (n=664) had history of alcohol problems**had history of alcohol problems**
*Conigliaro, Gordon, McGinnis, Rabeneck, Justice. JAIDS. 2003;33:521-525.**Samet, Phillips, Horton, Traphagen, Freedberg. AIDS Res Hum Retroviruses. 2004;20:151-155.
*Dingle, Oei. Psychol Bull. 1997;122:56-71. **Samet, Horton, Traphagen, Lyon, Freedberg. Alcohol Clin Exp Res. 2003;27:862-7.
BackgroundBackground
The impact of alcohol use on HIV The impact of alcohol use on HIV disease progression is unclear. disease progression is unclear. – Pre-HAART (circa 1996), no association found *Pre-HAART (circa 1996), no association found *
– Among persons receiving antiretroviral therapy Among persons receiving antiretroviral therapy (ART) between 1997-2000 (ART) between 1997-2000 cross-sectionalcross-sectional evidence evidence found an association of heavy alcohol use with found an association of heavy alcohol use with lower CD4 and higher HVL (HIV viral load).**lower CD4 and higher HVL (HIV viral load).**
BackgroundBackground
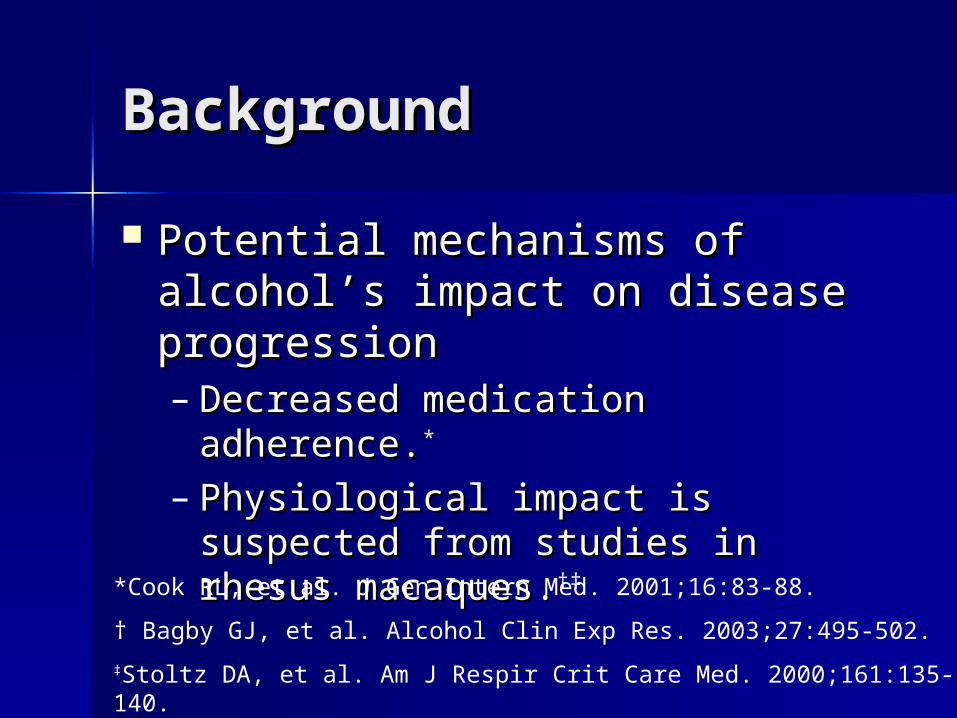
Potential mechanisms of alcohol’s Potential mechanisms of alcohol’s impact on disease progressionimpact on disease progression– Decreased medication adherence.Decreased medication adherence.*
– Physiological impact is suspected Physiological impact is suspected from studies in rhesus macaques.from studies in rhesus macaques.†‡
*Cook RL, et al. J Gen Intern Med. 2001;16:83-88.
† Bagby GJ, et al. Alcohol Clin Exp Res. 2003;27:495-502.
‡Stoltz DA, et al. Am J Respir Crit Care Med. 2000;161:135-140.
HypothesisHypothesis
Alcohol consumption is associated Alcohol consumption is associated with more rapid HIV disease with more rapid HIV disease progression:progression:– CD4 decreaseCD4 decrease– HVL (i.e. HIV RNA) increaseHVL (i.e. HIV RNA) increase
Participants & DesignParticipants & Design
Two consecutive prospective Two consecutive prospective cohorts of HIV-infected persons cohorts of HIV-infected persons with current or past alcohol with current or past alcohol problemsproblemsHIV-ALC (HIV-Alcohol Longitudinal
Cohort): 7/97-7/01 HIV-LIVE (HIV-Longitudinal
Interrelationship between Viruses and Ethanol): 8/01-03/06
Eligibility criteriaEligibility criteria
Inclusion CriteriaInclusion Criteria– HIV infectionHIV infection– Two or more positive CAGE* responsesTwo or more positive CAGE* responses– Fluent in English or SpanishFluent in English or Spanish
Exclusion criteriaExclusion criteria– Mini Mental State Examination** score < 21Mini Mental State Examination** score < 21– Plans to move from area in next yearPlans to move from area in next year
*Ewing. *Ewing. JAMAJAMA. 1984;252:1905-07.. 1984;252:1905-07.
**Folstein et al. **Folstein et al. J Psychiatr Res. J Psychiatr Res. 1975;12:189-98.1975;12:189-98.
Subject AssessmentSubject Assessment
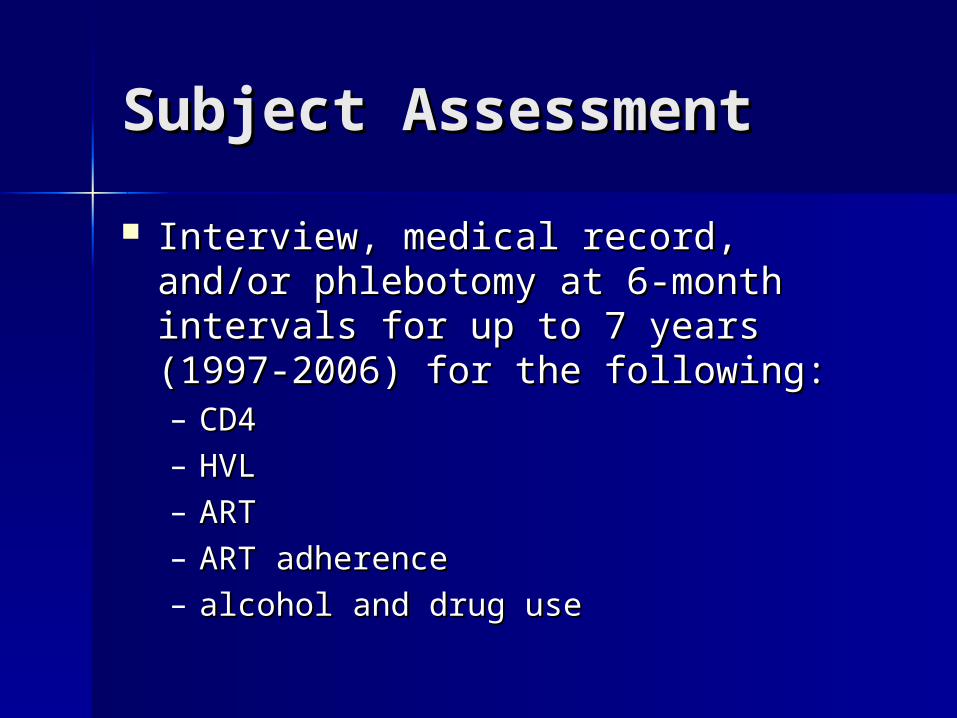
Interview, medical record, and/or Interview, medical record, and/or phlebotomy at 6-month intervals for phlebotomy at 6-month intervals for up to 7 years (1997-2006) for the up to 7 years (1997-2006) for the following: following: – CD4 CD4 – HVLHVL– ARTART– ART adherenceART adherence– alcohol and drug usealcohol and drug use
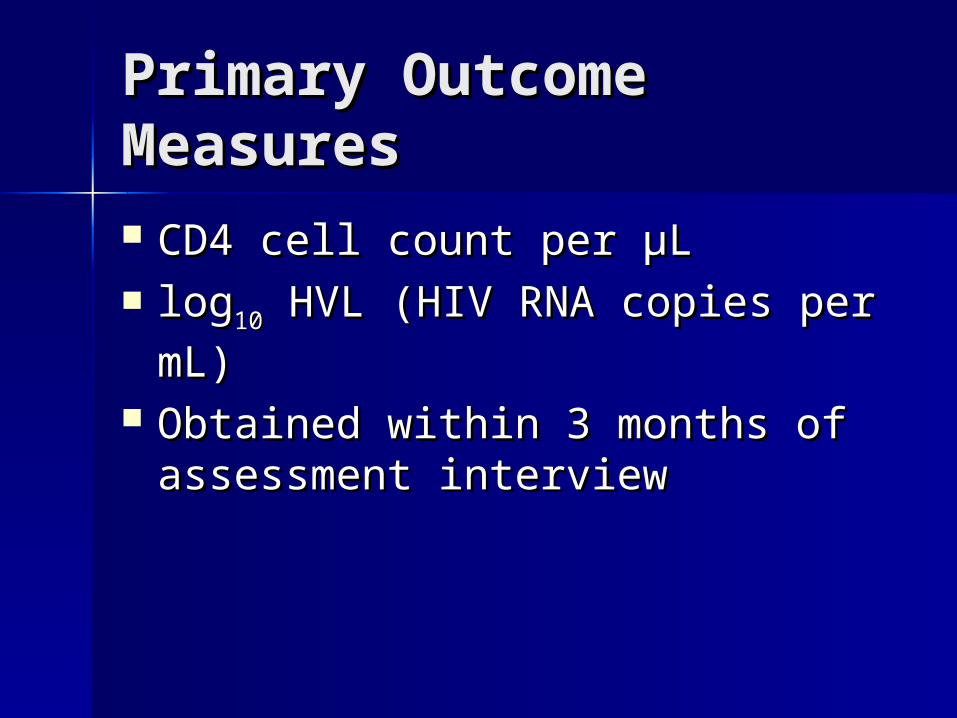
Primary Outcome Primary Outcome MeasuresMeasures CD4 cell count per µL CD4 cell count per µL loglog1010 HVL (HIV RNA copies per mL) HVL (HIV RNA copies per mL) Obtained within 3 months of Obtained within 3 months of
assessment interviewassessment interview
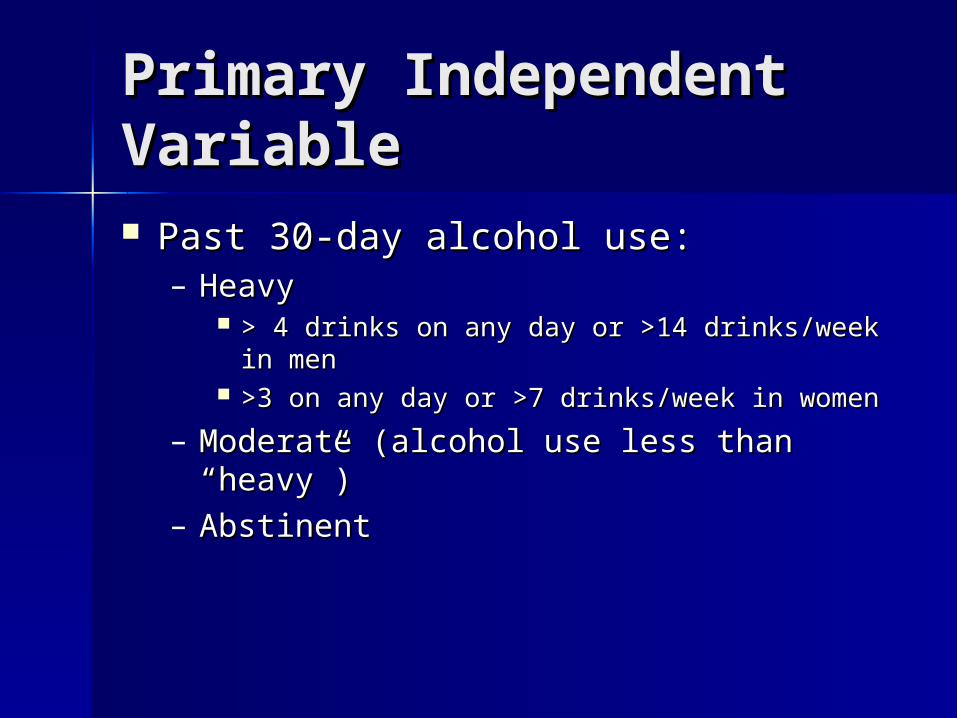
Primary Independent Primary Independent VariableVariable Past 30-day alcohol use:Past 30-day alcohol use:
– Heavy Heavy > 4 drinks on any day or >14 drinks/week in > 4 drinks on any day or >14 drinks/week in
menmen >3 on any day or >7 drinks/week in women>3 on any day or >7 drinks/week in women
– Moderate (alcohol use less than “heavy”)Moderate (alcohol use less than “heavy”)– AbstinentAbstinent
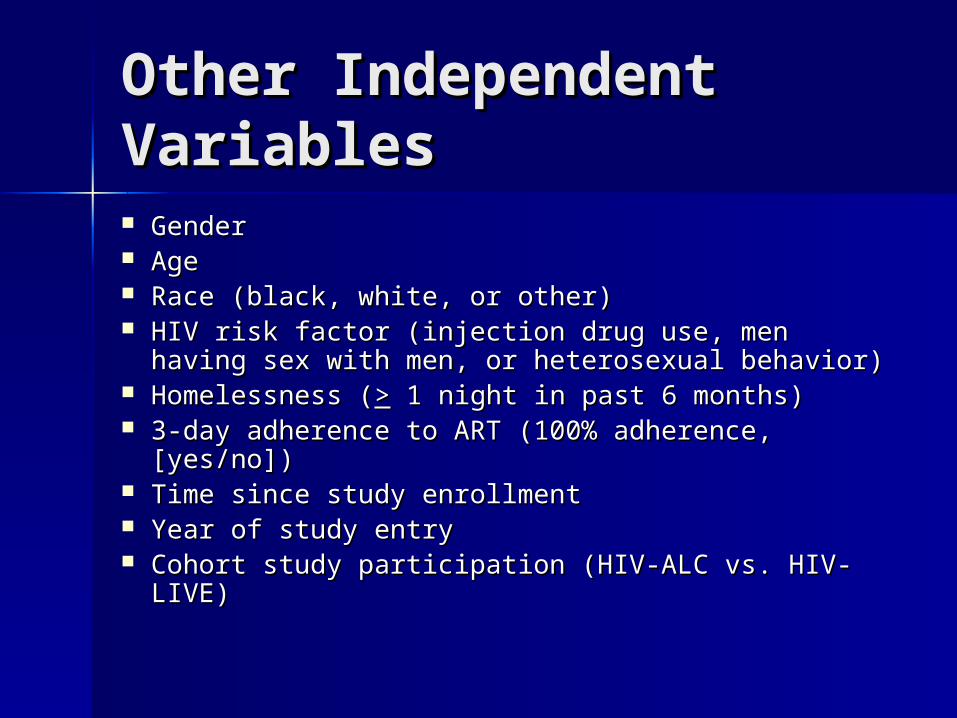
Other Independent Other Independent VariablesVariables GenderGender AgeAge Race (black, white, or other)Race (black, white, or other) HIV risk factor (injection drug use, men having HIV risk factor (injection drug use, men having
sex with men, or heterosexual behavior)sex with men, or heterosexual behavior) Homelessness (Homelessness (>> 1 night in past 6 months) 1 night in past 6 months) 3-day adherence to ART (100% adherence, 3-day adherence to ART (100% adherence,
[yes/no])[yes/no]) Time since study enrollmentTime since study enrollment Year of study entryYear of study entry Cohort study participation (HIV-ALC vs. HIV-LIVE)Cohort study participation (HIV-ALC vs. HIV-LIVE)
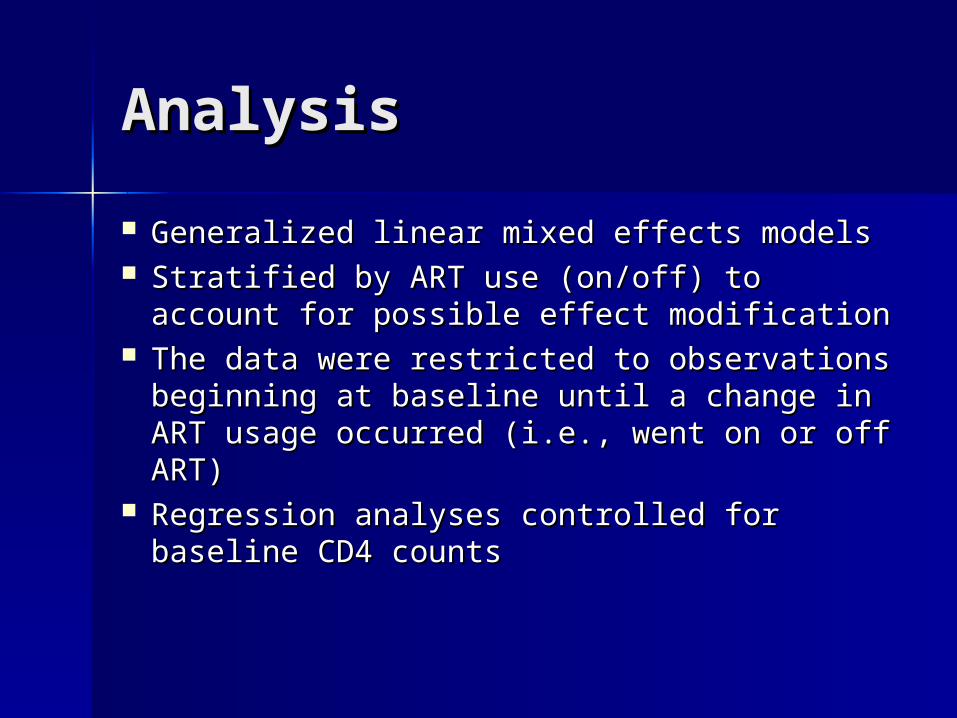
AnalysisAnalysis
Generalized linear mixed effects modelsGeneralized linear mixed effects models Stratified by ART use (on/off) to account Stratified by ART use (on/off) to account
for possible effect modificationfor possible effect modification The data were restricted to The data were restricted to
observations beginning at baseline until observations beginning at baseline until a change in ART usage occurred (i.e., a change in ART usage occurred (i.e., went on or off ART)went on or off ART)
Regression analyses controlled for Regression analyses controlled for baseline CD4 countsbaseline CD4 counts
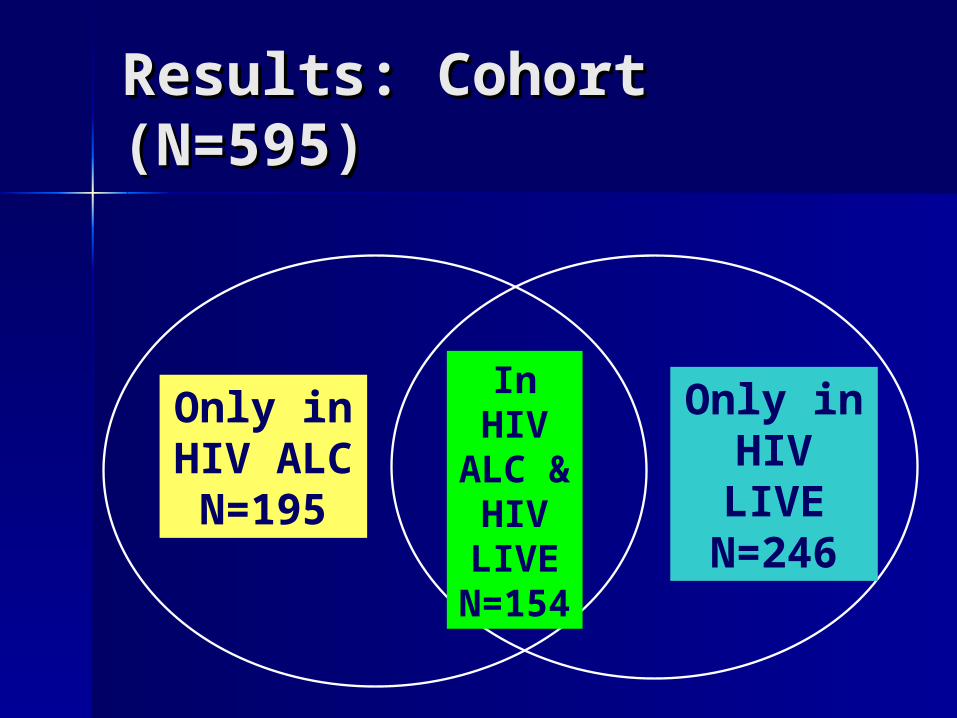
Results: Cohort Results: Cohort (N=595)(N=595)
Only in HIV LIVE
N=246
Only in HIV ALC N=195
In HIV ALC &
HIV LIVE
N=154
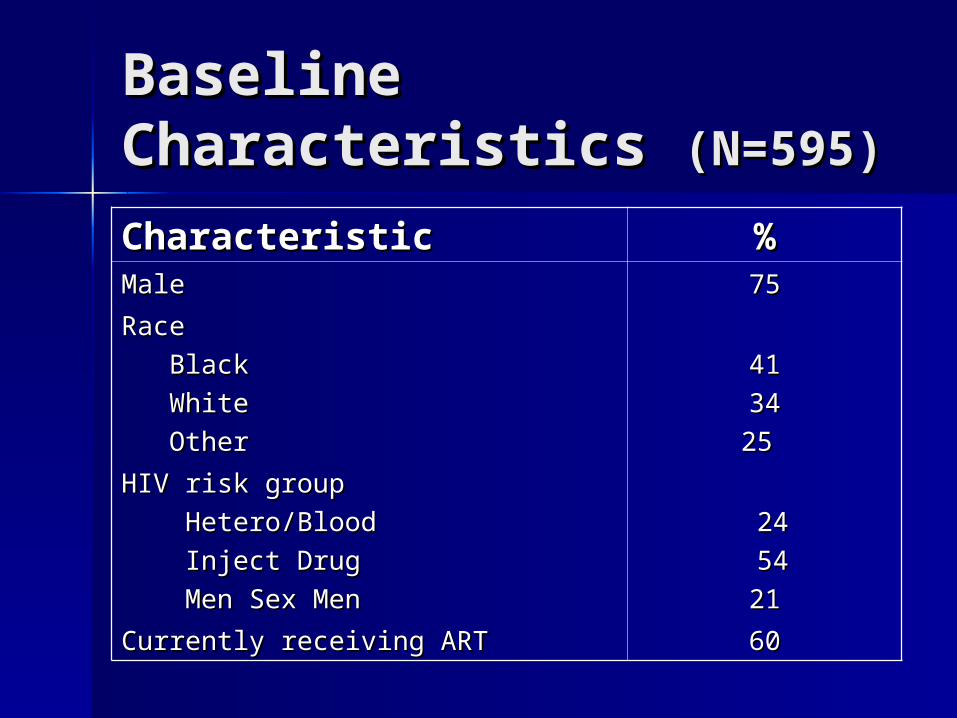
Baseline Baseline Characteristics Characteristics (N=595)(N=595)
CharacteristicCharacteristic %%MaleMale 7575
RaceRace
BlackBlack
White White
OtherOther
4141
3434
2525
HIV risk groupHIV risk group
Hetero/BloodHetero/Blood
Inject DrugInject Drug
Men Sex MenMen Sex Men
2424
5454
2121
Currently receiving ARTCurrently receiving ART 6060
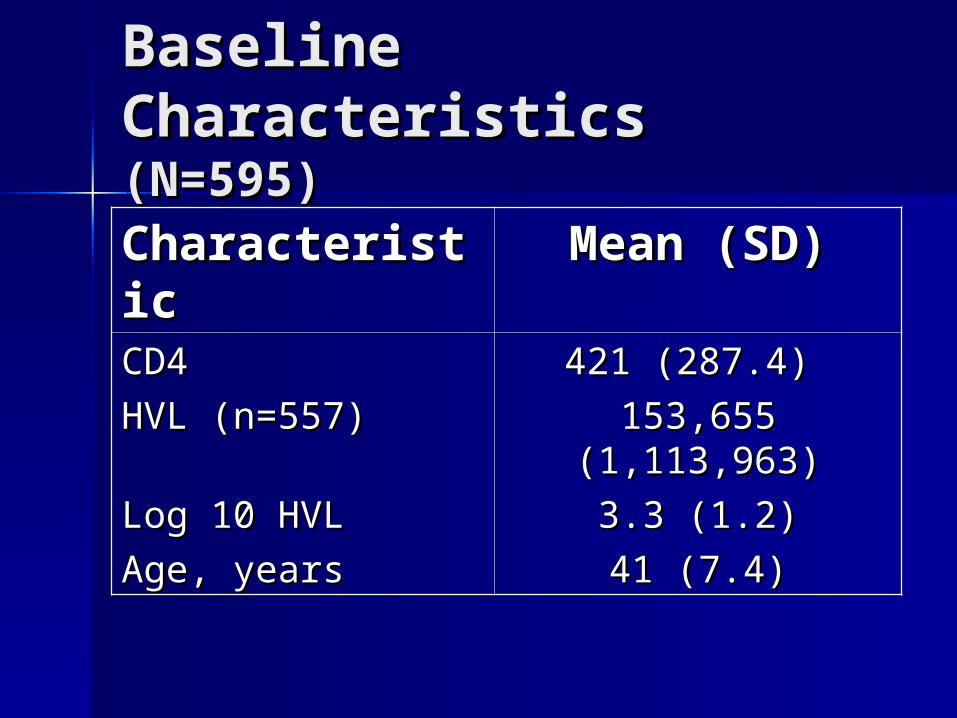
Baseline Baseline CharacteristicsCharacteristics(N=595)(N=595)CharacteristiCharacteristicc
Mean (SD)Mean (SD)
CD4CD4 421 (287.4)421 (287.4)
HVL HVL (n=557)(n=557) 153,655 (1,113,963)153,655 (1,113,963)
Log 10 HVLLog 10 HVL 3.3 (1.2)3.3 (1.2)
Age, yearsAge, years 41 (7.4)41 (7.4)
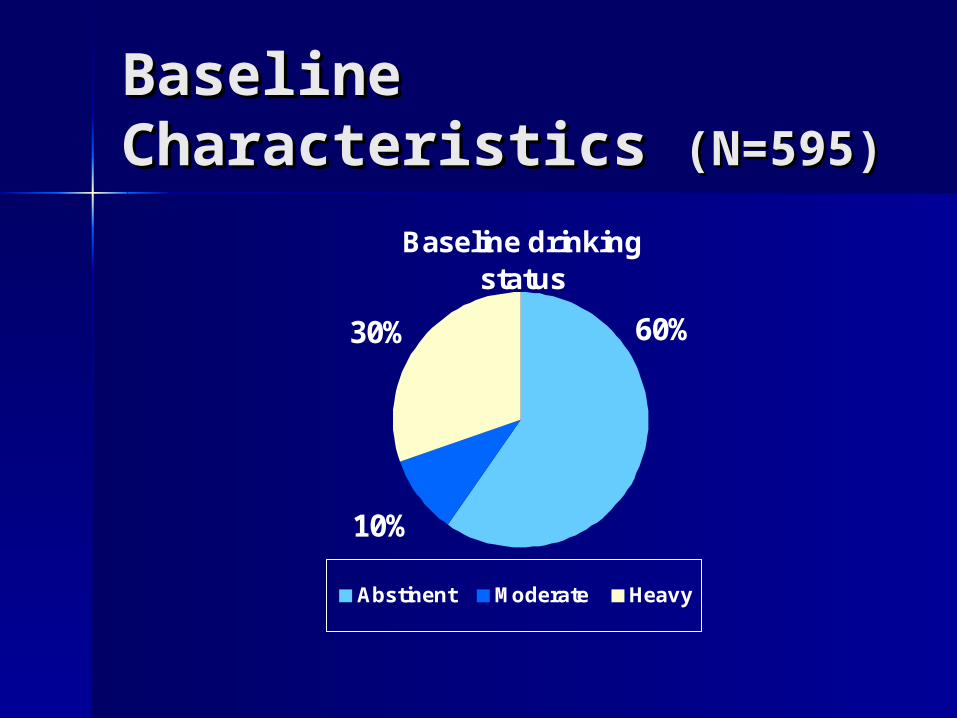
Baseline Baseline Characteristics Characteristics (N=595)(N=595)
Baseline drinking status
10%
30% 60%
Abstinent Moderate Heavy
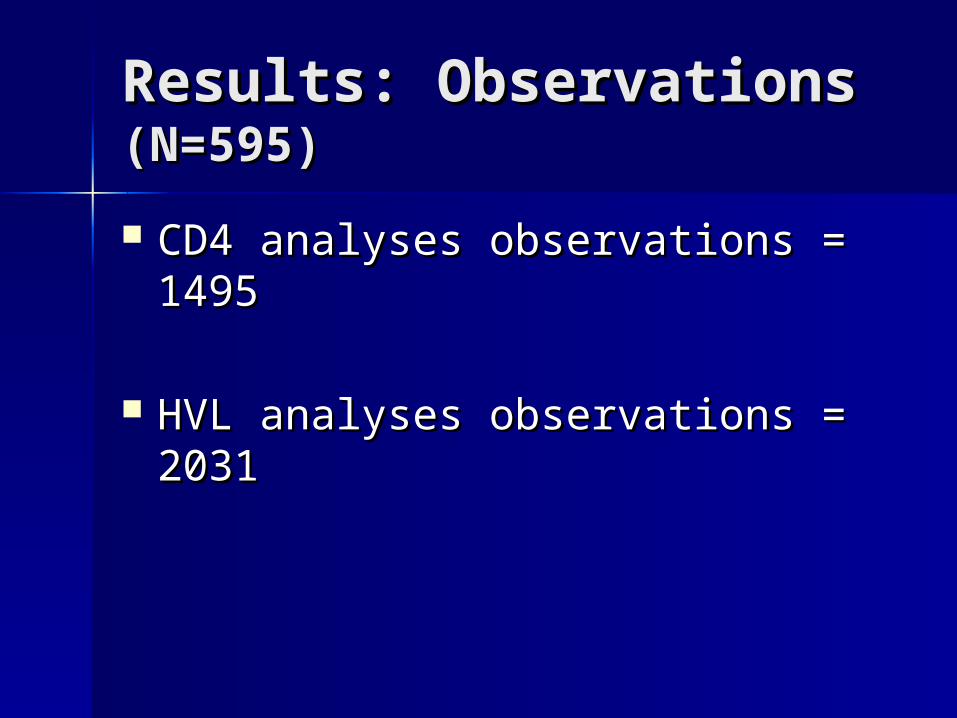
Results: Observations Results: Observations (N=595)(N=595)
CD4 analyses observations = CD4 analyses observations = 1495 1495
HVL analyses observations = HVL analyses observations = 20312031

Results: Multivariable Analyses
Adjusted mean differences in CD4 and Log10 HVL associated with alcohol use
ART Status
Alcohol consumptio
n
CD4 cell count (SE)
Log10 HVL (SE)
On ART(n=355)
Abstinent -- --
Moderate 12.31 (13.8) 0.03 (0.08)
Heavy -1.46 (10.9) 0.13 (0.07)†
Not on ART(n=240)
Abstinent -- --
Moderate -27.03 (18.3) -0.11 (0.08)
Heavy -53.4 (22) * 0.0003 (0.08)†p=0.09
*p=0.02
LimitationsLimitations
Participants in the no ART group may Participants in the no ART group may have been exposed to these medications have been exposed to these medications in the past but were no longer receiving in the past but were no longer receiving them at the time of study entry. them at the time of study entry.
Observational cohort: possible Observational cohort: possible uncontrolled confoundinguncontrolled confounding
Inconsistent time frames: alcohol Inconsistent time frames: alcohol assessed 30 days prior to the interview; assessed 30 days prior to the interview; CD4 & HIV RNA within 3 months CD4 & HIV RNA within 3 months
ConclusionConclusion
In those on ART, heavy drinking In those on ART, heavy drinking was possibly associated with was possibly associated with higher HVL.higher HVL.
In those not on ART, heavy In those not on ART, heavy drinking was associated with drinking was associated with lower CD4 cell counts. lower CD4 cell counts.
ImplicationsImplications
Avoiding alcohol consumption at Avoiding alcohol consumption at heavy levels may have a beneficial heavy levels may have a beneficial effect on HIV disease progression.effect on HIV disease progression.
Determining the behavioral and/or Determining the behavioral and/or biological basis for these effects biological basis for these effects and addressing alcohol use in HIV-and addressing alcohol use in HIV-infected patients are important infected patients are important research and clinical issues.research and clinical issues.
Reduction of risky sexual Reduction of risky sexual behavior among behavior among hospitalized Russian hospitalized Russian substance dependent substance dependent patientspatients
The Russian Partnership to Reduce The Russian Partnership to Reduce the Epidemic Via Engagement in the Epidemic Via Engagement in Narcology Treatment (Russian Narcology Treatment (Russian PREVENT)PREVENT) Study Study
ISBRA-2006 ISBRA-2006 Symposium "Alcohol and HIV"Symposium "Alcohol and HIV" Supported by National Institute on Alcohol Abuse and Alcoholism (NIAAA), NIH: R21-AA014821
Krupitsky E.Krupitsky E.11, Cheng D.M., Cheng D.M.22, , Raj A.Raj A.22, Egorova V., Egorova V.11, Levenson , Levenson S.S.22, Bridden C., Bridden C.33, Zvartau E,, Zvartau E,1 1
Samet J.H.Samet J.H.2,32,3
11St. Petersburg State Pavlov Medical St. Petersburg State Pavlov Medical University, Russian Federation; University, Russian Federation; 22Boston Boston University School of Public Health, United University School of Public Health, United States; States;
33 Boston University School of Medicine, Boston Boston University School of Medicine, Boston Medical Center, United StatesMedical Center, United States
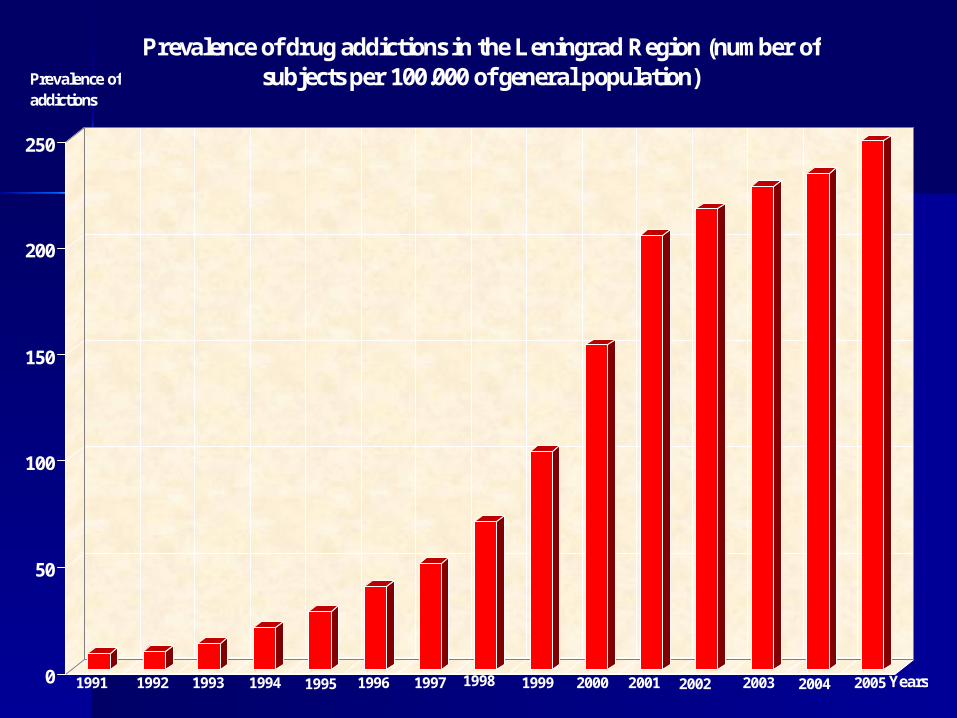
0
50
100
150
200
250
Prevalence of drug addictions in the Leningrad Region (number of subjects per 100.000 of general population)Prevalence of
addictions
Years1991 1992 1993 1994 1995 1996 1997 1998 1999 2000 2001 2002 2003 2004 2005
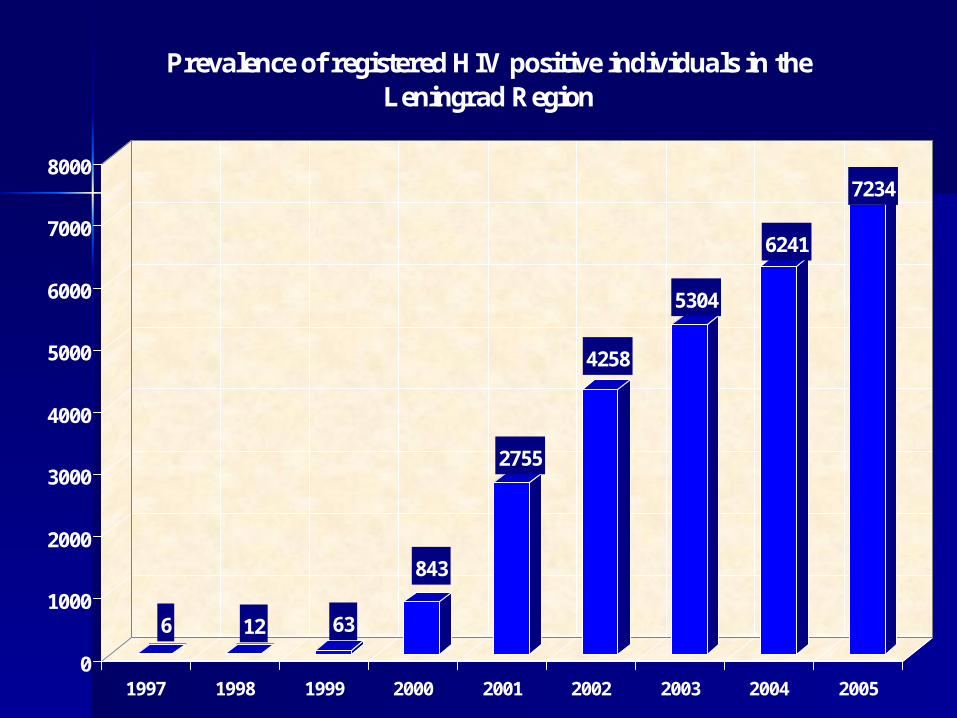
6 12 63
843
2755
4258
5304
6241
7234
0
1000
2000
3000
4000
5000
6000
7000
8000
1997 1998 1999 2000 2001 2002 2003 2004 2005
Prevalence of registered HIV positive individuals in the Leningrad Region
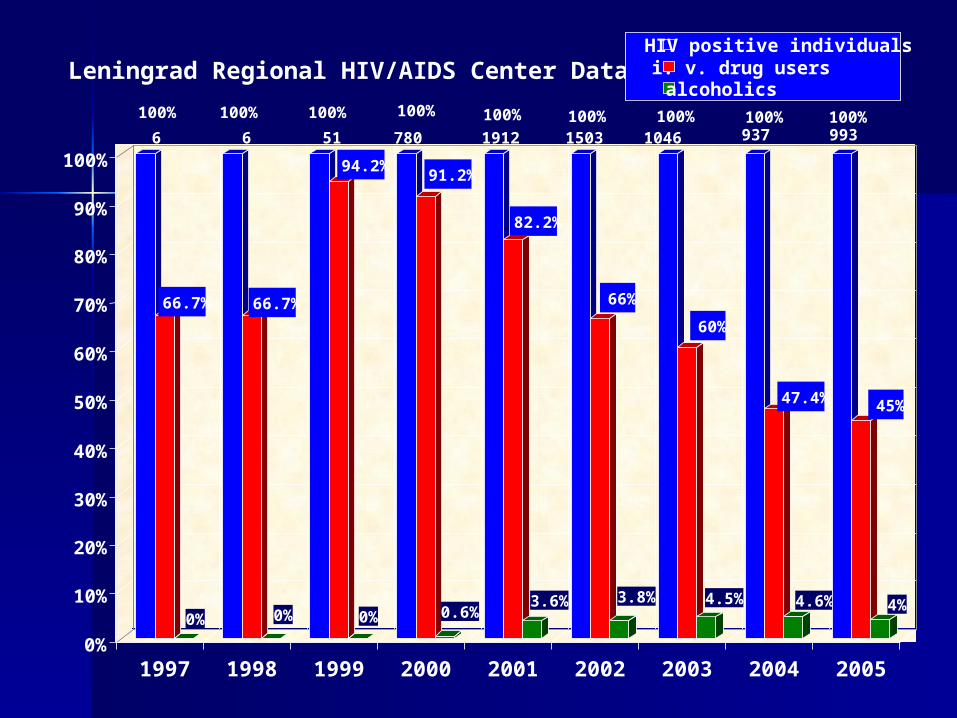
937 993
100%
66.7%
0%
100%
66.7%
0%
100%
94.2%
0%
100%
91.2%
0.6%
100%
82.2%
3.6%
100%
66%
3.8%
100%
60%
4.5%
100%
47.4%
4.6%
100%
45%
4%
0%
10%
20%
30%
40%
50%
60%
70%
80%
90%
100%
1997 1998 1999 2000 2001 2002 2003 2004 2005
Leningrad Regional HIV/AIDS Center DataHIV positive individualsi. v. drug usersalcoholics
6 6 51 780 1912 1503 1046
BackgroundBackground
Russia has one of the highest per capita Russia has one of the highest per capita alcohol consumption rates in the world.alcohol consumption rates in the world.
The Russian HIV epidemic is propelled The Russian HIV epidemic is propelled by injection drug use. by injection drug use.
Alcohol useAlcohol use may increase high-risk may increase high-risk sexual behaviors and promote sexual behaviors and promote spreading of HIV from IDUs into the spreading of HIV from IDUs into the general population.general population.
BackgroundBackground
Regional narcology hospitals play a Regional narcology hospitals play a central role in Russia’s efforts to central role in Russia’s efforts to address alcohol and drug dependence address alcohol and drug dependence but have not aggressively addressed but have not aggressively addressed HIV. HIV.
Risky sexual behaviors need to be Risky sexual behaviors need to be addressed with effective and feasible addressed with effective and feasible interventions among Russian substance interventions among Russian substance dependent persons.dependent persons.
PurposePurpose
To assess the effectiveness of a sexual To assess the effectiveness of a sexual risk reduction intervention in the risk reduction intervention in the Russian narcology hospital setting Russian narcology hospital setting
HypothesisHypothesis
Subjects receiving the intervention will Subjects receiving the intervention will report fewer risky sexual behaviors.report fewer risky sexual behaviors.
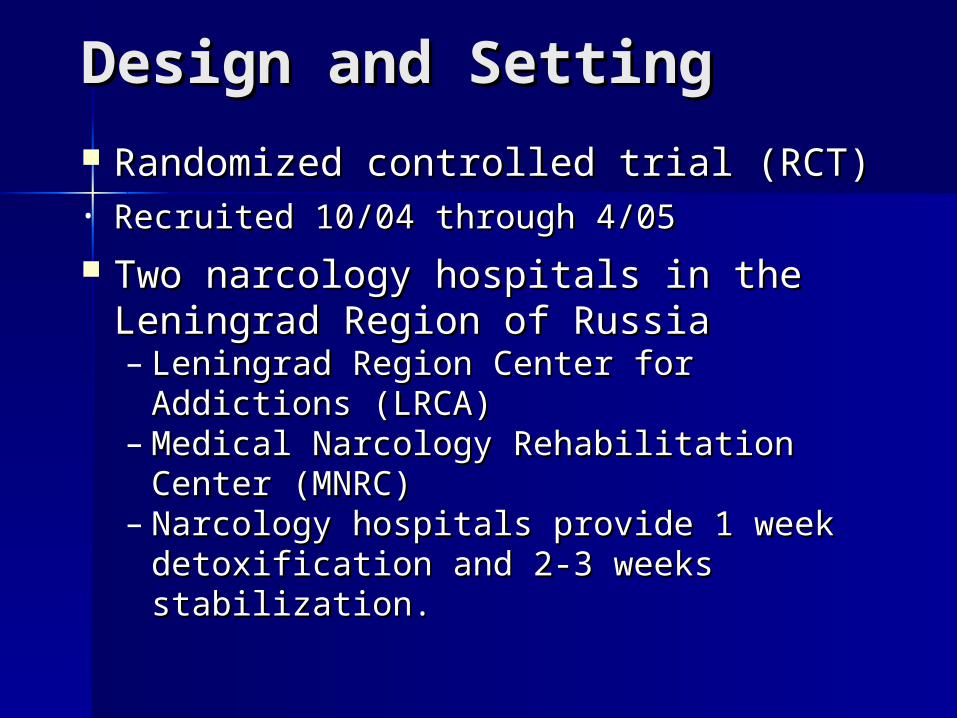
Design and SettingDesign and Setting
Randomized controlled trial (RCT)Randomized controlled trial (RCT)• Recruited 10/04 through 4/05Recruited 10/04 through 4/05
Two narcology hospitals in the Two narcology hospitals in the Leningrad Region of Russia Leningrad Region of Russia – Leningrad Region Center for Addictions Leningrad Region Center for Addictions
(LRCA)(LRCA)– Medical Narcology Rehabilitation Medical Narcology Rehabilitation
Center (MNRC)Center (MNRC) – Narcology hospitals provide 1 week Narcology hospitals provide 1 week
detoxification and 2-3 weeks detoxification and 2-3 weeks stabilization. stabilization.
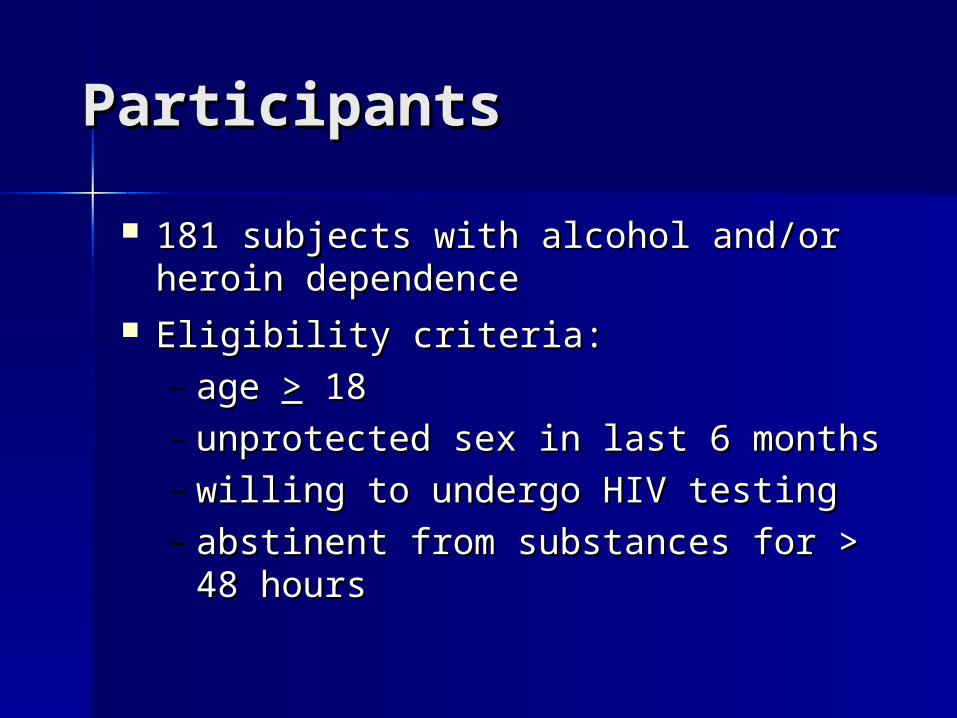
ParticipantsParticipants
181 subjects with alcohol and/or 181 subjects with alcohol and/or heroin dependenceheroin dependence
Eligibility criteria:Eligibility criteria:– age age >> 18 18– unprotected sex in last 6 monthsunprotected sex in last 6 months– willing to undergo HIV testingwilling to undergo HIV testing– abstinent from substances for > 48 abstinent from substances for > 48
hourshours
Behavioral InterventionBehavioral Intervention
Culturally and contextually adapted Culturally and contextually adapted CDC-endorsed RESPECT brief counseling CDC-endorsed RESPECT brief counseling designed to reduce sex-risk behaviors*designed to reduce sex-risk behaviors*
Received 30 condoms at baselineReceived 30 condoms at baseline
2 intervention sessions at medical 2 intervention sessions at medical center plus 3 monthly booster sessions center plus 3 monthly booster sessions via telephonevia telephone
Behavioral InterventionBehavioral Intervention Session 1 (30-40 min)Session 1 (30-40 min)
– Personal assessment of HIV riskPersonal assessment of HIV risk– Increasing HIV risk perceptionsIncreasing HIV risk perceptions– Negotiating a personalized risk reduction planNegotiating a personalized risk reduction plan
Session 2 (60 min)Session 2 (60 min)– Provision and discussion of HIV test results; review Provision and discussion of HIV test results; review
planplan– Promotion of safer sex: condom skills; self-Promotion of safer sex: condom skills; self-
efficacy; emphasizing relationship between efficacy; emphasizing relationship between alcohol and sexual riskalcohol and sexual risk
– For HIV-infected subjectsFor HIV-infected subjects: skills building to reduce : skills building to reduce violence and stigmatization when disclosing to violence and stigmatization when disclosing to partnerspartners
– For injection drug usersFor injection drug users: education and skills : education and skills building to promote new needle usage and building to promote new needle usage and cleaning of needles/workscleaning of needles/works
Behavioral InterventionBehavioral Intervention
3 monthly booster sessions (10-3 monthly booster sessions (10-20 min)20 min)– Provision of ongoing case Provision of ongoing case
management tailored to the management tailored to the individual’s stage of readiness to individual’s stage of readiness to engage in sexual or drug use risk engage in sexual or drug use risk reduction reduction
Control ProgramControl Program
Usual addiction treatment, which Usual addiction treatment, which includes no sexual behavior counselingincludes no sexual behavior counseling
Received 30 condoms at baselineReceived 30 condoms at baseline HIV-infected controls received brief HIV-infected controls received brief
post-test counselingpost-test counseling– Provision and discussion of HIV test Provision and discussion of HIV test
results; creation of risk reduction goalsresults; creation of risk reduction goals– Referral to an HIV care programReferral to an HIV care program
3 monthly study check-in phone calls 3 monthly study check-in phone calls (3 min)(3 min)
Subject AssessmentSubject Assessment Assessed at baseline, 3, and 6 Assessed at baseline, 3, and 6
monthsmonths Baseline and 6 month assessment Baseline and 6 month assessment
via face-to-face interviews with the via face-to-face interviews with the Risk Assessment Battery and Time Risk Assessment Battery and Time Line Follow Back survey.Line Follow Back survey.– HIV risk behaviors additionally HIV risk behaviors additionally
assessed by Audio Computer-Assisted assessed by Audio Computer-Assisted Self Interviewing (ACASI) System (to Self Interviewing (ACASI) System (to promote truth telling)promote truth telling)
3-month assessment interviewer- 3-month assessment interviewer- administered via the telephoneadministered via the telephone
OutcomesOutcomes Assessed at 6 months*:Assessed at 6 months*:
– Primary:Primary: percentage of safe sex episodespercentage of safe sex episodes consistent safe sex (yes/no)consistent safe sex (yes/no)
– Secondary:Secondary: any condom use any condom use number of unsafe sex episodesnumber of unsafe sex episodes
Assessed at 3 months (all secondary)Assessed at 3 months (all secondary)††::– percentage of safe sex episodespercentage of safe sex episodes– consistent safe sex (yes/no)consistent safe sex (yes/no)– any condom useany condom use
*In the past 3 months, ACASI †In the past 3 months, telephone interview
Primary OutcomesPrimary Outcomes(assessed at 6-month follow-up visit by (assessed at 6-month follow-up visit by ACASI)ACASI)
Percentage of safe sex episodes Percentage of safe sex episodes (continuous variable)(continuous variable)– number of times condoms were used number of times condoms were used
out of the number of sexual episodes out of the number of sexual episodes (anal and vaginal intercourse) (anal and vaginal intercourse)
Consistent safe sex (yes/no)Consistent safe sex (yes/no)– 100% condom use during anal and 100% condom use during anal and
vaginal intercourse or abstinence vaginal intercourse or abstinence from sexfrom sex
Secondary OutcomesSecondary Outcomes
6 months:6 months:– Any condom use (yes/no)Any condom use (yes/no)– Number of unsafe sex episodesNumber of unsafe sex episodes
no condom use during anal or vaginal sexno condom use during anal or vaginal sex
3 months:3 months:– percentage of safe sex episodespercentage of safe sex episodes– consistent safe sex (yes/no)consistent safe sex (yes/no)– any condom use (yes/no)any condom use (yes/no)
AnalysisAnalysis
Intent-to-treatIntent-to-treat Descriptive statistics (e.g., medians, Descriptive statistics (e.g., medians,
interquartile ranges [IQR], and interquartile ranges [IQR], and proportions) were used to characterize the proportions) were used to characterize the sample by treatment group. sample by treatment group.
Chi-square, Fisher’s exact, or Wilcoxon Chi-square, Fisher’s exact, or Wilcoxon rank sum tests used as appropriate for rank sum tests used as appropriate for dichotomous and continuous variables.dichotomous and continuous variables.
Additional analyses using logistic Additional analyses using logistic regression and median regression models regression and median regression models to adjust for possible group differences at to adjust for possible group differences at baselinebaseline
ResultsResults
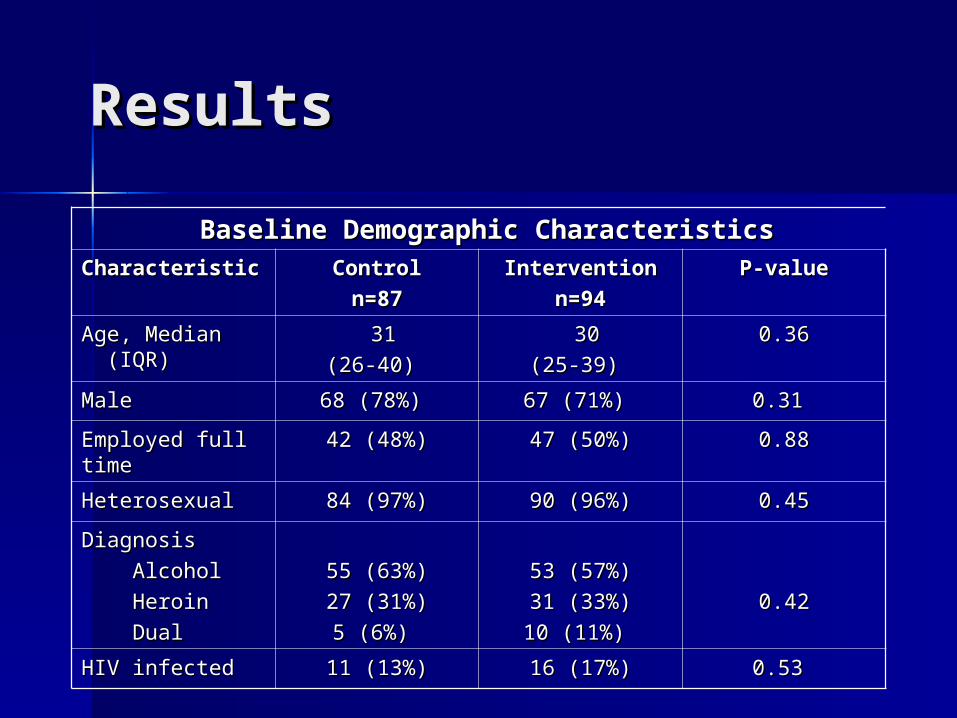
Baseline Demographic CharacteristicsBaseline Demographic CharacteristicsCharacteristicCharacteristic ControlControl
n=87n=87InterventionIntervention
n=94n=94P-valueP-value
Age, Median Age, Median (IQR) (IQR)
3131
(26-40) (26-40) 3030
(25-39) (25-39) 0.36 0.36
MaleMale 68 (78%)68 (78%) 67 (71%)67 (71%) 0.310.31
Employed full Employed full timetime
42 (48%)42 (48%) 47 (50%)47 (50%) 0.880.88
HeterosexualHeterosexual 84 (97%)84 (97%) 90 (96%)90 (96%) 0.450.45
DiagnosisDiagnosis
AlcoholAlcohol
HeroinHeroin
DualDual
55 (63%)55 (63%)
27 (31%)27 (31%)
5 (6%)5 (6%)
53 (57%)53 (57%)
31 (33%)31 (33%)
10 (11%)10 (11%)
0.420.42
HIV infectedHIV infected 11 (13%)11 (13%) 16 (17%)16 (17%) 0.530.53
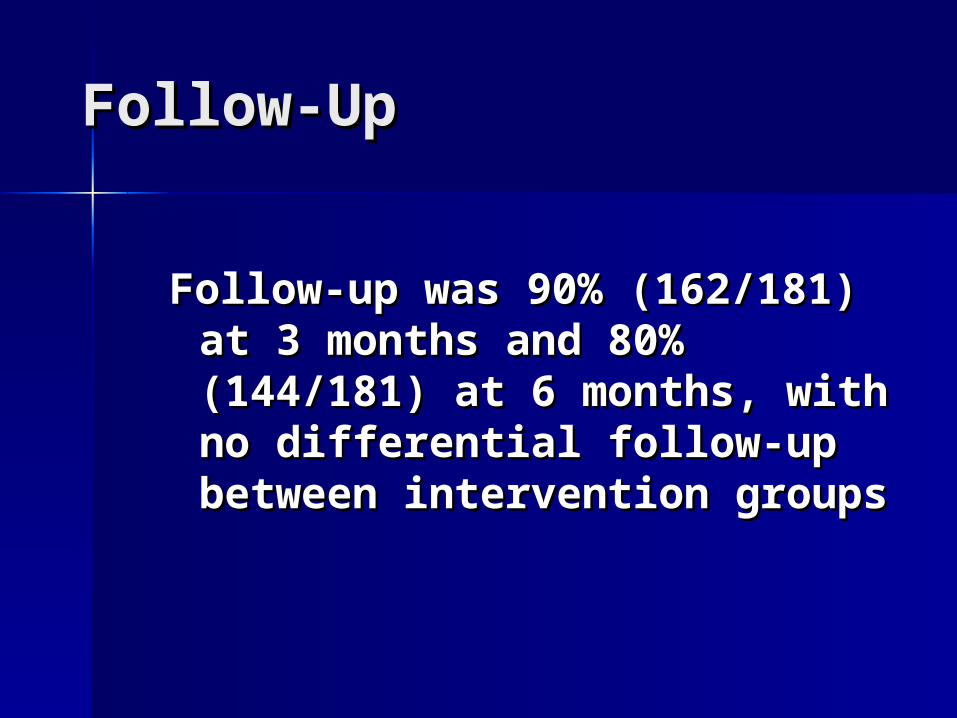
Follow-UpFollow-Up
Follow-up was 90% (162/181) Follow-up was 90% (162/181) at 3 months and 80% at 3 months and 80% (144/181) at 6 months, with (144/181) at 6 months, with no differential follow-up no differential follow-up between intervention between intervention groupsgroups
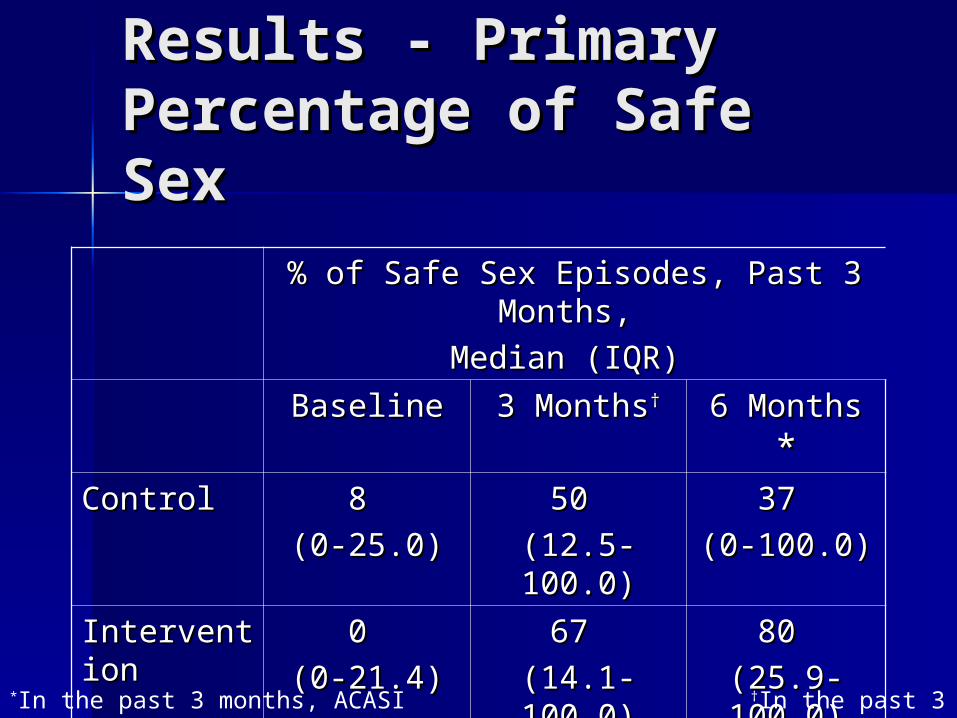
Results - PrimaryResults - PrimaryPercentage of Safe Sex Percentage of Safe Sex
% of Safe Sex Episodes, Past 3 % of Safe Sex Episodes, Past 3 Months, Months,
Median (IQR)Median (IQR)
BaselineBaseline 3 Months3 Months†† 6 Months 6 Months **ControlControl 8 8
(0-25.0)(0-25.0)50 50
(12.5-(12.5-100.0)100.0)
37 37
(0-100.0)(0-100.0)
InterventiInterventionon
0 0
(0-21.4)(0-21.4)67 67
(14.1-(14.1-100.0)100.0)
80 80
(25.9-(25.9-100.0)100.0)
P-valueP-value 0.090.09 0.980.98 0.020.02*In the past 3 months, ACASI †In the past 3 months, telephone interview
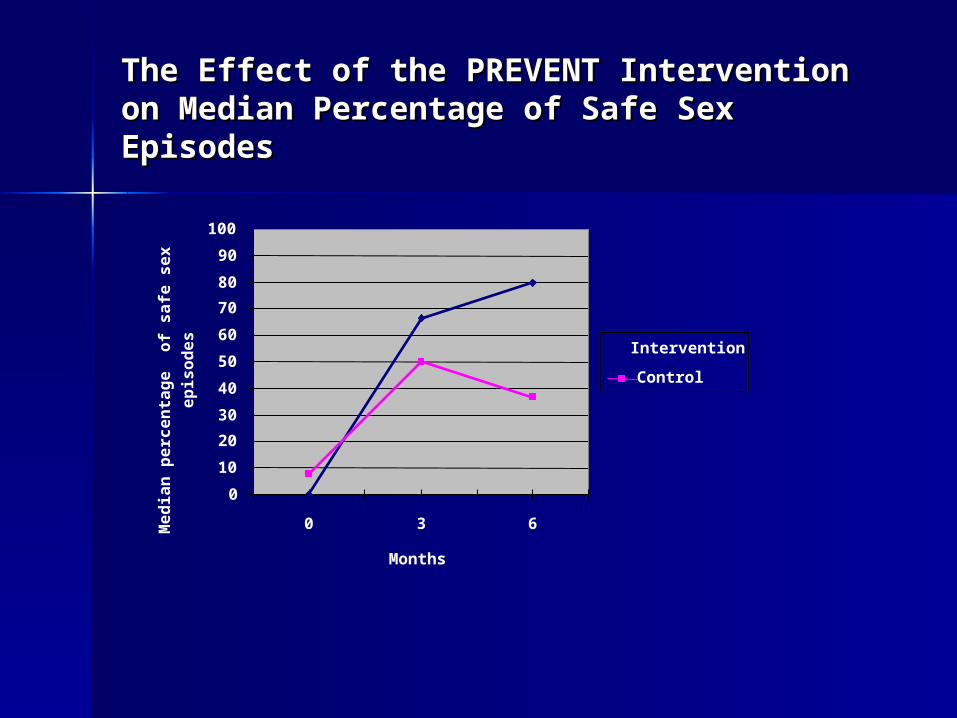
The Effect of the PREVENT Intervention on The Effect of the PREVENT Intervention on Median Percentage of Safe Sex EpisodesMedian Percentage of Safe Sex Episodes
0
10
20
30
40
50
60
70
80
90
100
0 3 6
Months
Me
dia
n p
erc
en
tag
e
of
sa
fe s
ex
ep
iso
de
s
Intervention
Control
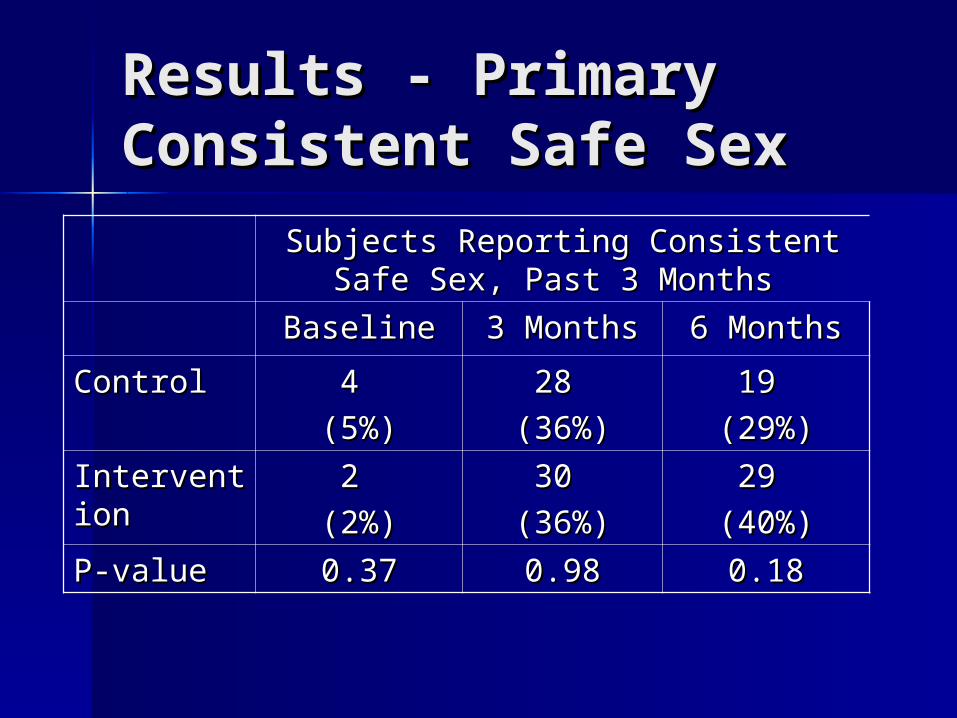
Results - PrimaryResults - PrimaryConsistent Safe SexConsistent Safe Sex
Subjects Reporting Consistent Safe Subjects Reporting Consistent Safe Sex, Past 3 MonthsSex, Past 3 Months
BaselineBaseline 3 Months3 Months 6 Months6 Months
ControlControl 4 4
(5%)(5%)28 28
(36%)(36%)19 19
(29%)(29%)
InterventiInterventionon
2 2
(2%)(2%)30 30
(36%)(36%)29 29
(40%)(40%)
P-valueP-value 0.370.37 0.980.98 0.180.18
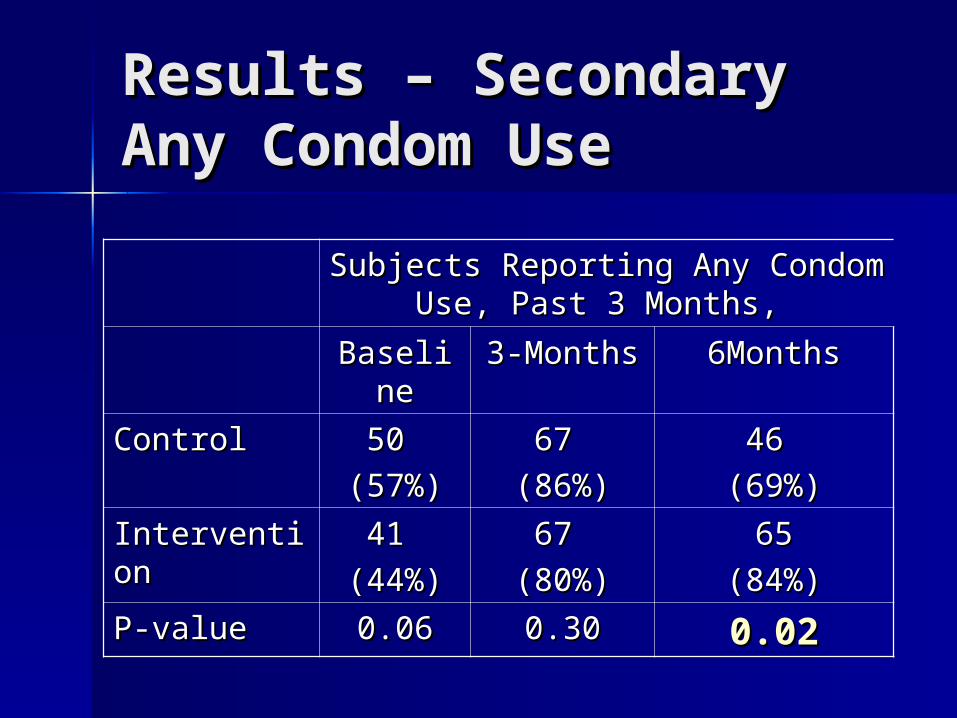
Results – SecondaryResults – SecondaryAny Condom UseAny Condom Use
Subjects Reporting Any Condom Subjects Reporting Any Condom Use, Past 3 Months,Use, Past 3 Months,
BaselinBaselinee
3-Months3-Months 6Months6Months
ControlControl 50 50
(57%)(57%)67 67
(86%)(86%)46 46
(69%)(69%)
InterventionIntervention 41 41
(44%)(44%)67 67
(80%)(80%)6565
(84%)(84%)
P-valueP-value 0.060.06 0.300.30 0.020.02
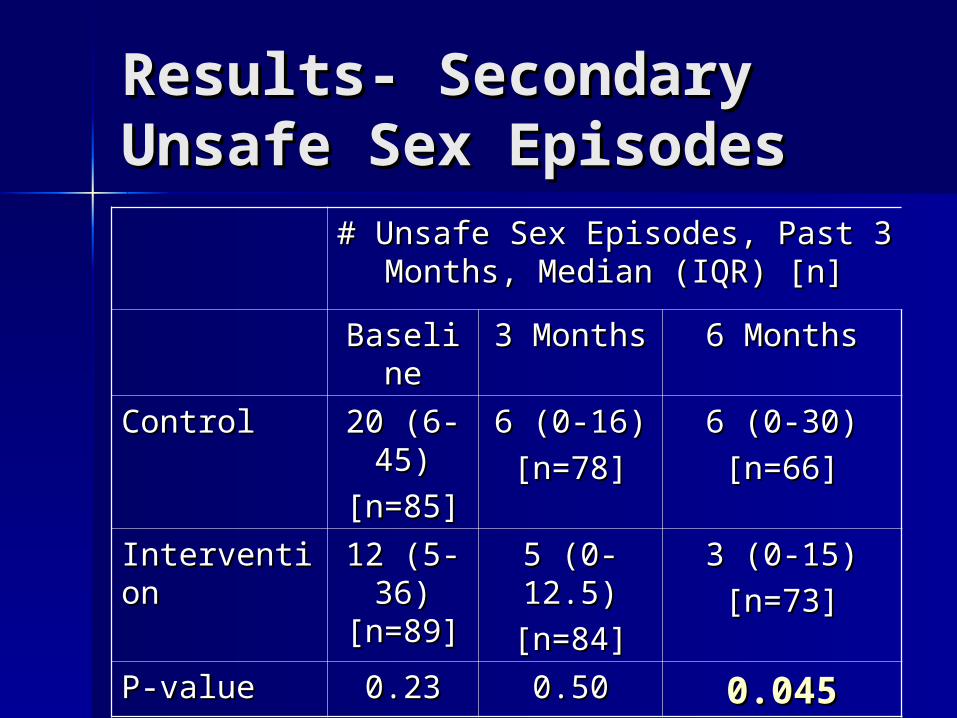
Results- SecondaryResults- SecondaryUnsafe Sex EpisodesUnsafe Sex Episodes
# Unsafe Sex Episodes, Past 3 # Unsafe Sex Episodes, Past 3 Months, Median (IQR) [n]Months, Median (IQR) [n]
BaselinBaselinee
3 Months3 Months 6 Months6 Months
ControlControl 20 (6-20 (6-45)45)
[n=85][n=85]
6 (0-16)6 (0-16)
[n=78][n=78]6 (0-30)6 (0-30)
[n=66][n=66]
InterventionIntervention 12 (5-12 (5-36) 36)
[n=89][n=89]
5 (0-12.5)5 (0-12.5)
[n=84][n=84]3 (0-15)3 (0-15)
[n=73][n=73]
P-valueP-value 0.230.23 0.500.50 0.0450.045
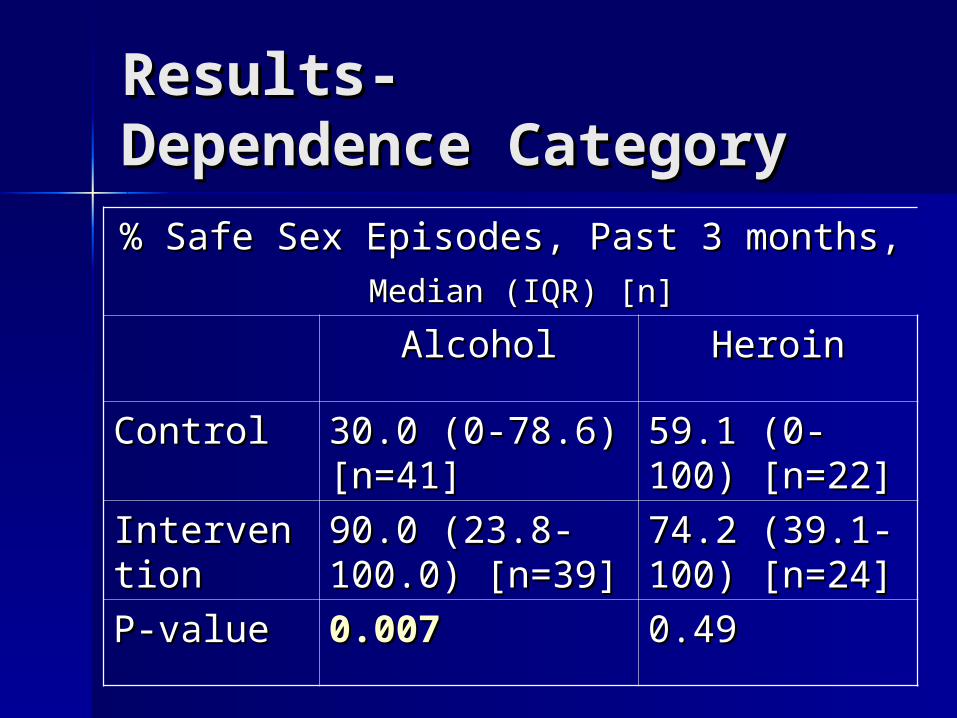
Results-Results-Dependence CategoryDependence Category
% Safe Sex Episodes, Past 3 months,% Safe Sex Episodes, Past 3 months,
Median (IQR) [n]Median (IQR) [n]
AlcoholAlcohol HeroinHeroin
ControlControl 30.0 (0-78.6) 30.0 (0-78.6) [n=41][n=41]
59.1 (0-100) 59.1 (0-100) [n=22][n=22]
InterventiInterventionon
90.0 (23.8-90.0 (23.8-100.0) [n=39]100.0) [n=39]
74.2 (39.1-74.2 (39.1-100) [n=24]100) [n=24]
P-valueP-value 0.0070.007 0.490.49
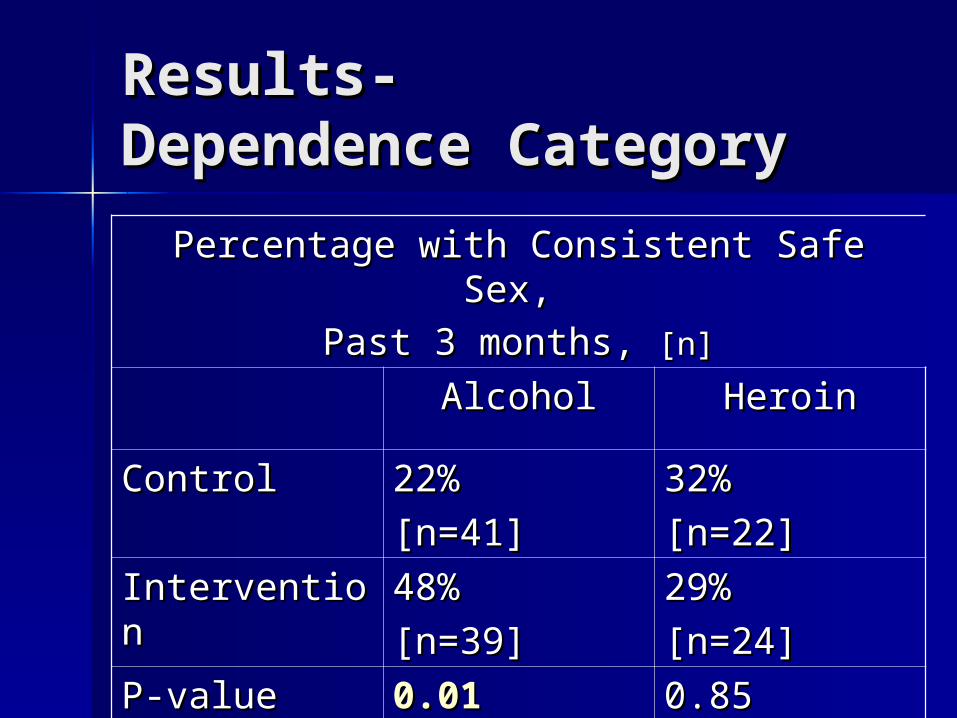
Results-Results-Dependence CategoryDependence Category
Percentage with Consistent Safe Sex, Percentage with Consistent Safe Sex,
Past 3 months, Past 3 months, [n][n]
AlcoholAlcohol HeroinHeroin
ControlControl 22%22%
[n=41][n=41]32%32%
[n=22][n=22]
InterventionIntervention 48%48%
[n=39][n=39]29%29%
[n=24][n=24]
P-valueP-value 0.010.01 0.850.85
LimitationsLimitations
• Use of self-reported instruments/assessmentsUse of self-reported instruments/assessments
• Possibility of social desirability biasPossibility of social desirability bias
• No objective biological outcomes (e.g. STDs No objective biological outcomes (e.g. STDs or new HIV infection) assessedor new HIV infection) assessed
ConclusionsConclusions
Adaptation of a pragmatic sexual risk Adaptation of a pragmatic sexual risk reduction intervention in two Russian reduction intervention in two Russian narcology hospitals reduced risky sexual narcology hospitals reduced risky sexual behaviors in substance dependent behaviors in substance dependent persons.persons.
Dissemination of this effective Dissemination of this effective intervention in comparable settings could intervention in comparable settings could be one component of a broad strategy be one component of a broad strategy needed to reduce the risk of HIV infection needed to reduce the risk of HIV infection in Eastern Europe and other settings. in Eastern Europe and other settings.
Current Alcohol Consumption and Current Alcohol Consumption and Cardiovascular Disease among Men Cardiovascular Disease among Men Infected with HIVInfected with HIV
Matthew Freiberg, MD, MScMatthew Freiberg, MD, MSc
University of Pittsburgh, USAUniversity of Pittsburgh, USA
Alcohol and HIV SymposiumAlcohol and HIV Symposium
ISBRA 2006 World Congress on Alcohol ISBRA 2006 World Congress on Alcohol Research Research
Sydney, AustraliaSydney, Australia
September 11September 11thth, 2006, 2006
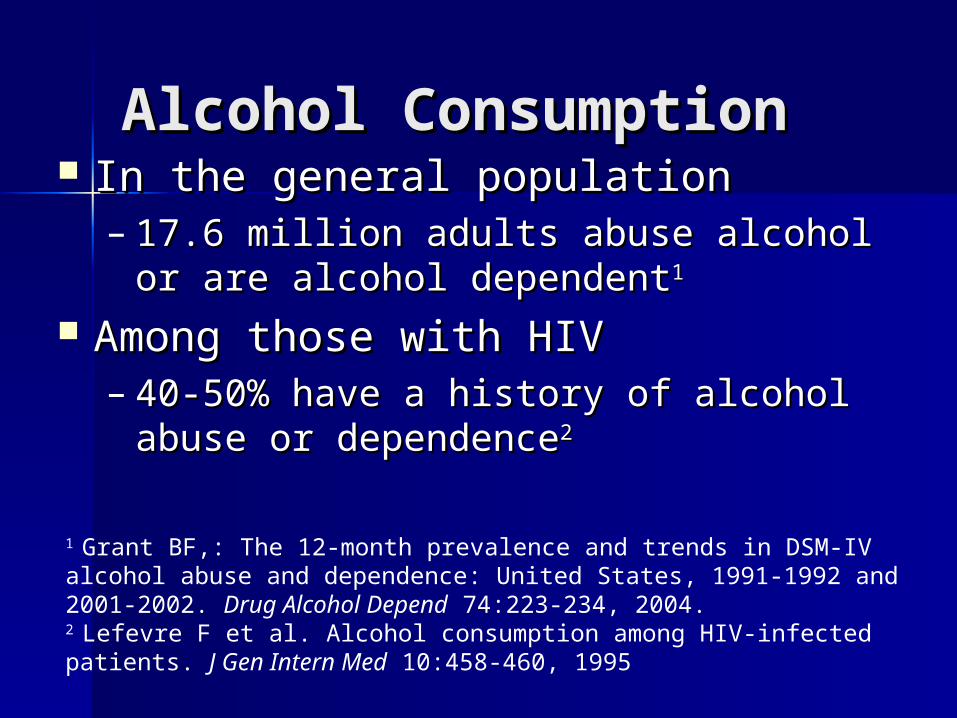
Alcohol ConsumptionAlcohol Consumption In the general populationIn the general population
– 17.6 million adults abuse alcohol or are 17.6 million adults abuse alcohol or are alcohol dependentalcohol dependent11
Among those with HIVAmong those with HIV– 40-50% have a history of alcohol abuse or 40-50% have a history of alcohol abuse or
dependencedependence22
1 Grant BF,: The 12-month prevalence and trends in DSM-IV alcohol abuse and dependence: United States, 1991-1992 and 2001-2002. Drug Alcohol Depend 74:223-234, 2004.2 Lefevre F et al. Alcohol consumption among HIV-infected patients. J Gen Intern Med 10:458-460, 1995
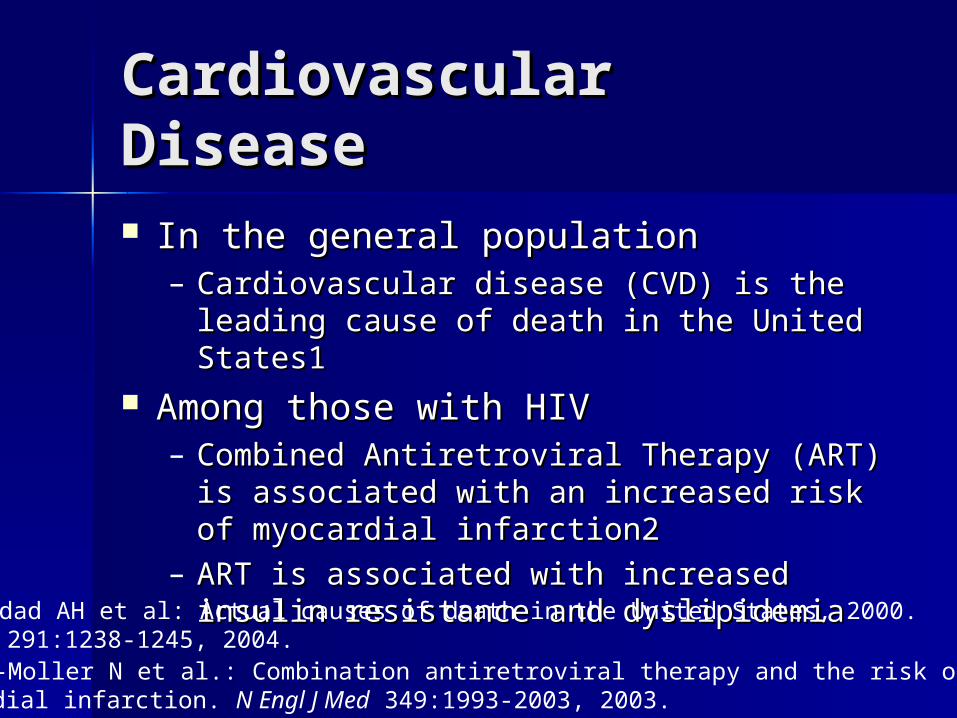
Cardiovascular DiseaseCardiovascular Disease
In the general populationIn the general population– Cardiovascular disease (CVD) is the Cardiovascular disease (CVD) is the
leading cause of death in the United leading cause of death in the United States1States1
Among those with HIVAmong those with HIV– Combined Antiretroviral Therapy (ART) is Combined Antiretroviral Therapy (ART) is
associated with an increased risk of associated with an increased risk of myocardial infarction2myocardial infarction2
– ART is associated with increased insulin ART is associated with increased insulin resistance and dyslipidemiaresistance and dyslipidemia
1 Mokdad AH et al: Actual causes of death in the United States, 2000. JAMA 291:1238-1245, 2004. 2 Friis-Moller N et al.: Combination antiretroviral therapy and the risk of myocardial infarction. N Engl J Med 349:1993-2003, 2003.
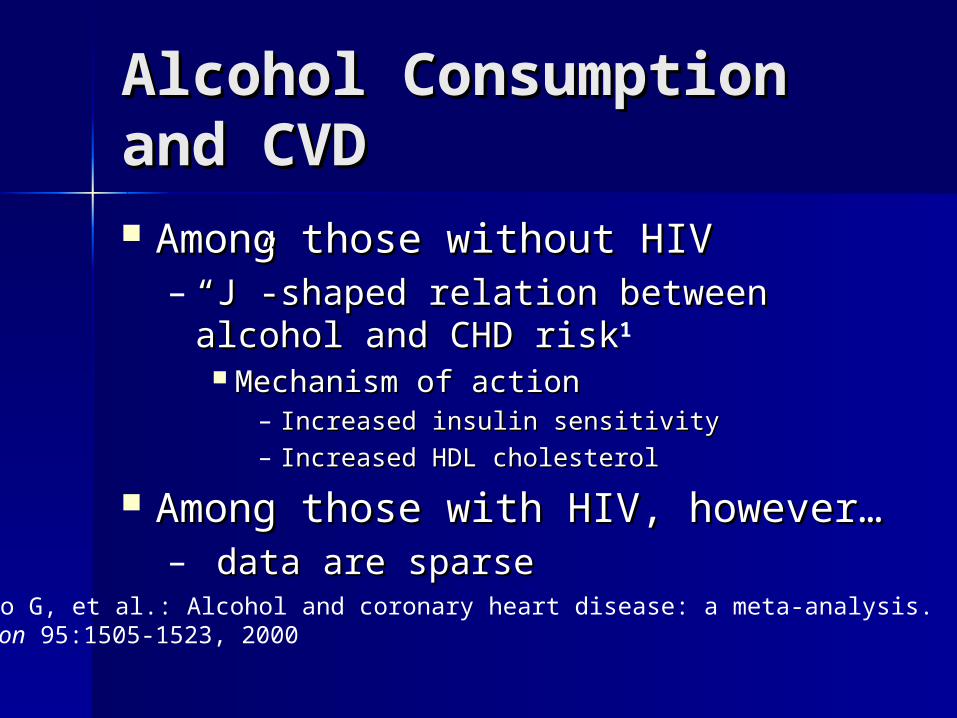
Alcohol Consumption Alcohol Consumption and CVDand CVD Among those without HIVAmong those without HIV
– ““J”-shaped relation between alcohol and J”-shaped relation between alcohol and CHD riskCHD risk1
Mechanism of actionMechanism of action– Increased insulin sensitivityIncreased insulin sensitivity– Increased HDL cholesterolIncreased HDL cholesterol
Among those with HIV, however…Among those with HIV, however…– data are sparsedata are sparse
1 Corrao G, et al.: Alcohol and coronary heart disease: a meta-analysis. Addiction 95:1505-1523, 2000
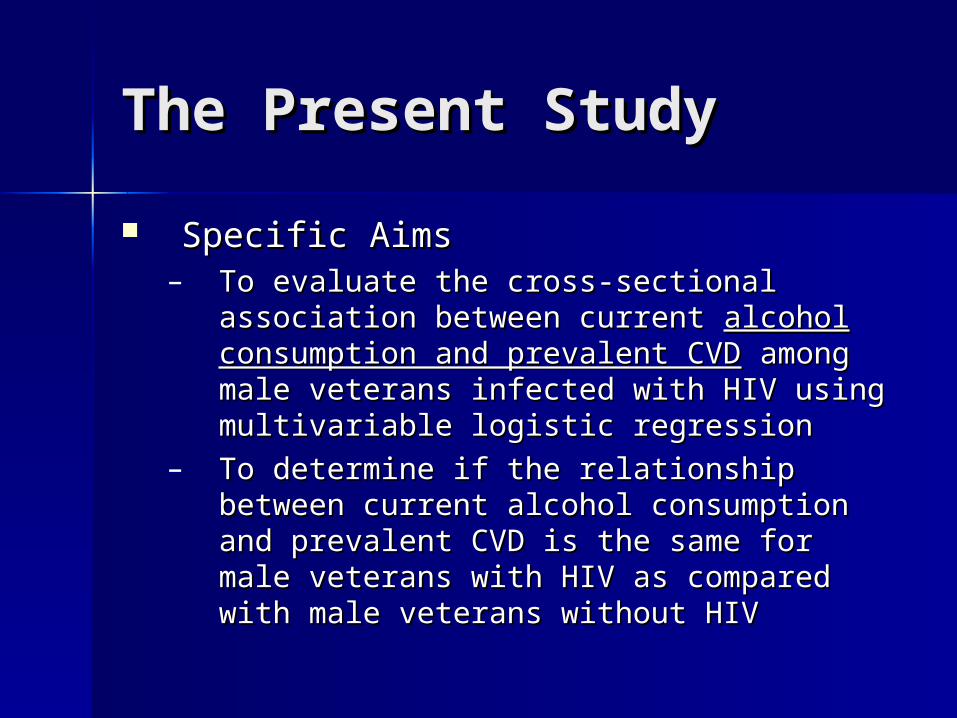
The Present StudyThe Present Study
Specific AimsSpecific Aims– To evaluate the cross-sectional To evaluate the cross-sectional
association between current association between current alcohol alcohol consumption and prevalent CVDconsumption and prevalent CVD among among male veterans infected with HIV using male veterans infected with HIV using multivariable logistic regression multivariable logistic regression
– To determine if the relationship between To determine if the relationship between current alcohol consumption and current alcohol consumption and prevalent CVD is the same for male prevalent CVD is the same for male veterans with HIV as compared with male veterans with HIV as compared with male veterans without HIVveterans without HIV
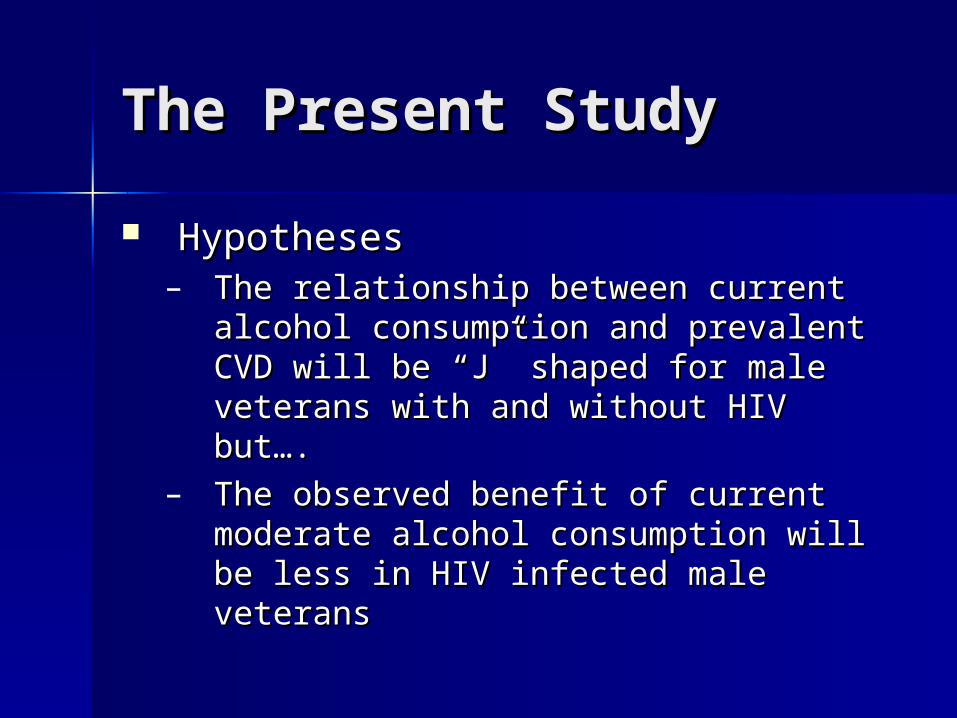
The Present StudyThe Present Study
HypothesesHypotheses– The relationship between current The relationship between current
alcohol consumption and prevalent alcohol consumption and prevalent CVD will be “J” shaped for male CVD will be “J” shaped for male veterans with and without HIV but…. veterans with and without HIV but….
– The observed benefit of current The observed benefit of current moderate alcohol consumption will be moderate alcohol consumption will be less in HIV infected male veteransless in HIV infected male veterans
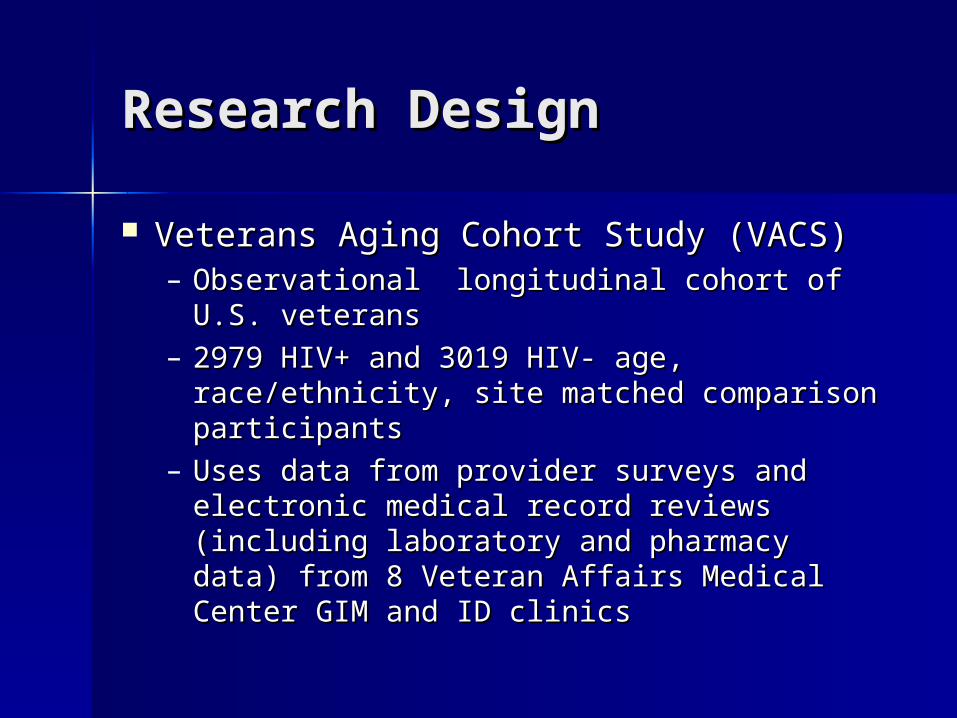
Research DesignResearch Design
Veterans Aging Cohort Study (VACS)Veterans Aging Cohort Study (VACS)– Observational longitudinal cohort of U.S. Observational longitudinal cohort of U.S.
veteransveterans– 2979 HIV+ and 3019 HIV- age, race/ethnicity, 2979 HIV+ and 3019 HIV- age, race/ethnicity,
site matched comparison participantssite matched comparison participants– Uses data from provider surveys and electronic Uses data from provider surveys and electronic
medical record reviews (including laboratory and medical record reviews (including laboratory and pharmacy data) from 8 Veteran Affairs Medical pharmacy data) from 8 Veteran Affairs Medical Center GIM and ID clinics Center GIM and ID clinics
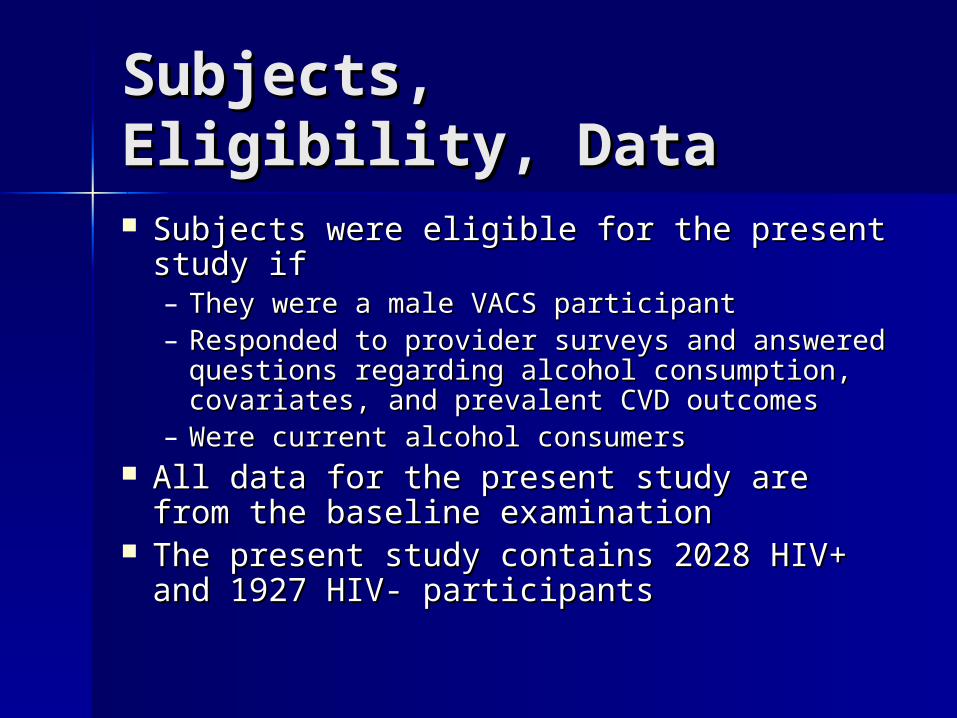
Subjects, Eligibility, Subjects, Eligibility, DataData Subjects were eligible for the present study ifSubjects were eligible for the present study if
– They were a male VACS participantThey were a male VACS participant– Responded to provider surveys and answered Responded to provider surveys and answered
questions regarding alcohol consumption, questions regarding alcohol consumption, covariates, and prevalent CVD outcomescovariates, and prevalent CVD outcomes
– Were current alcohol consumersWere current alcohol consumers All data for the present study are from the All data for the present study are from the
baseline examinationbaseline examination The present study contains 2028 HIV+ and The present study contains 2028 HIV+ and
1927 HIV- participants1927 HIV- participants
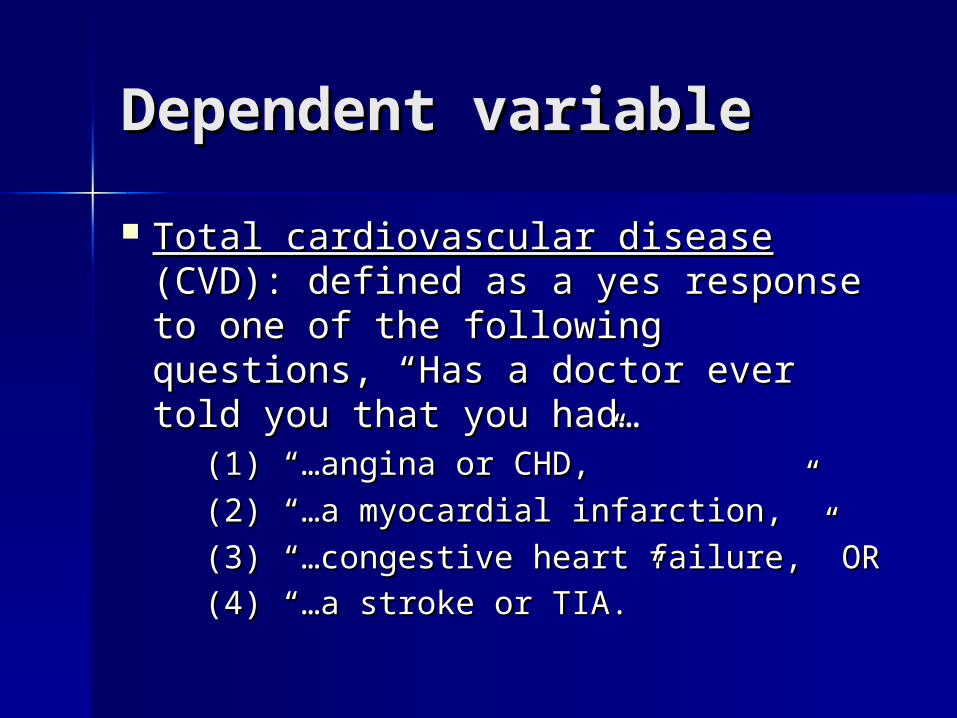
Dependent variableDependent variable
Total cardiovascular diseaseTotal cardiovascular disease (CVD): (CVD): defined as a yes response to one of defined as a yes response to one of the following questions, “Has a the following questions, “Has a doctor ever told you that you had… doctor ever told you that you had…
(1) “…angina or CHD,” (1) “…angina or CHD,”
(2) “…a myocardial infarction,”(2) “…a myocardial infarction,”
(3) “…congestive heart failure,” OR(3) “…congestive heart failure,” OR
(4) “…a stroke or TIA.”(4) “…a stroke or TIA.”
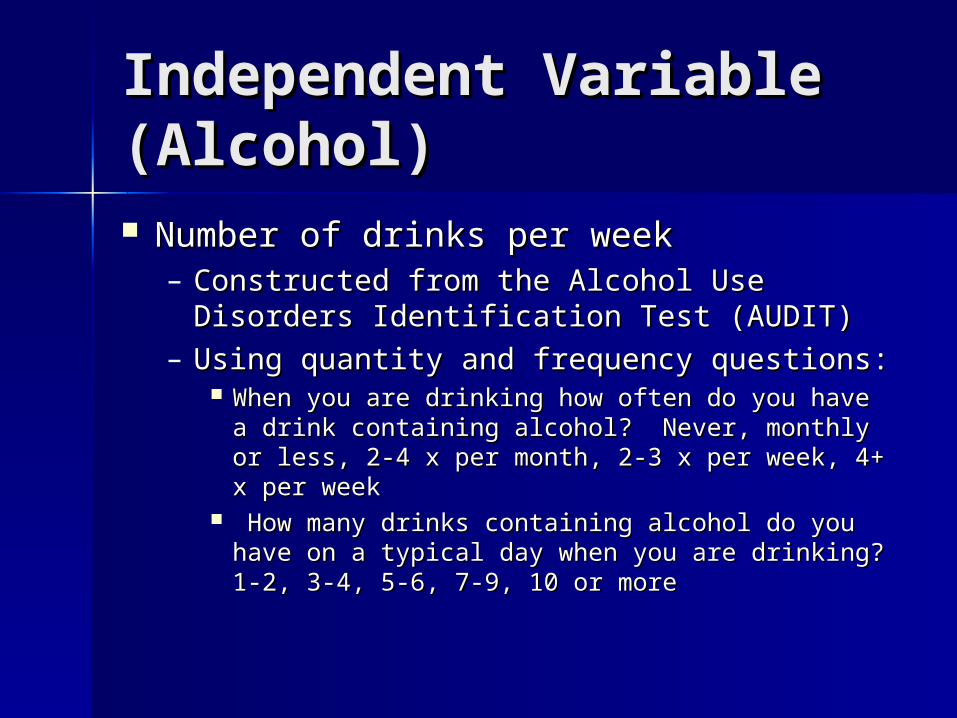
Independent Variable Independent Variable (Alcohol)(Alcohol) Number of drinks per weekNumber of drinks per week
– Constructed from the Alcohol Use Constructed from the Alcohol Use Disorders Identification Test (AUDIT)Disorders Identification Test (AUDIT)
– Using quantity and frequency questions:Using quantity and frequency questions: When you are drinking how often do you have a When you are drinking how often do you have a
drink containing alcohol? Never, monthly or drink containing alcohol? Never, monthly or less, 2-4 x per month, 2-3 x per week, 4+ x per less, 2-4 x per month, 2-3 x per week, 4+ x per weekweek
How many drinks containing alcohol do you How many drinks containing alcohol do you have on a typical day when you are drinking? 1-have on a typical day when you are drinking? 1-2, 3-4, 5-6, 7-9, 10 or more2, 3-4, 5-6, 7-9, 10 or more
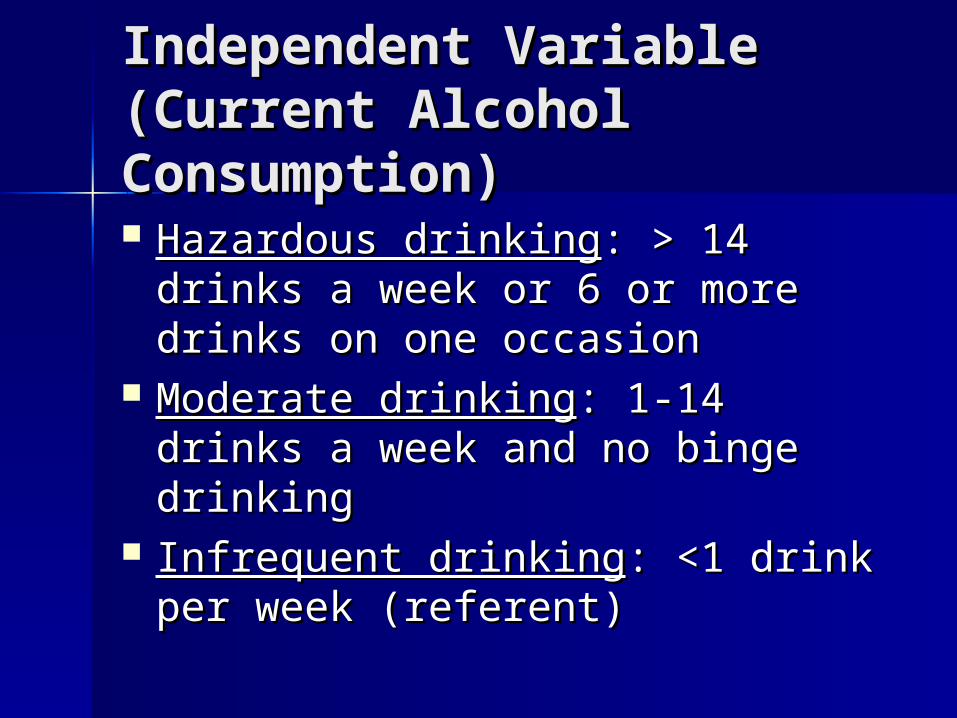
Independent Variable Independent Variable (Current Alcohol (Current Alcohol Consumption)Consumption) Hazardous drinkingHazardous drinking: > 14 drinks a : > 14 drinks a
week or 6 or more drinks on one week or 6 or more drinks on one occasionoccasion
Moderate drinkingModerate drinking: 1-14 drinks a : 1-14 drinks a week and no binge drinkingweek and no binge drinking
Infrequent drinkingInfrequent drinking: <1 drink per : <1 drink per week (referent)week (referent)
CovariatesCovariates
AgeAge Race (White, Black, Other)Race (White, Black, Other) Height Height WeightWeight
CovariatesCovariates
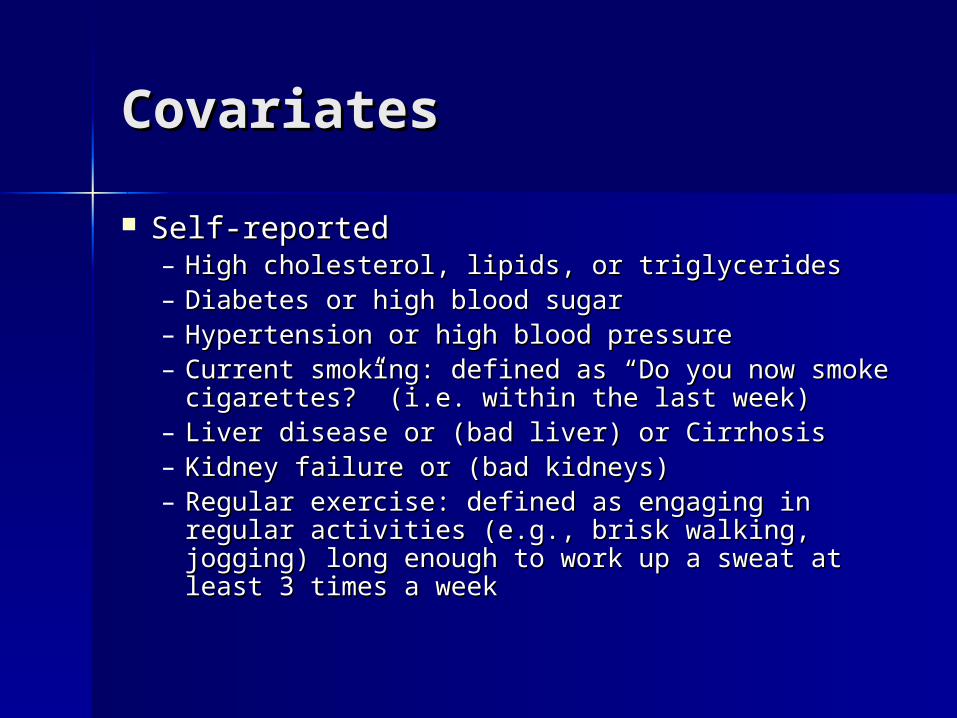
Self-reportedSelf-reported– High cholesterol, lipids, or triglyceridesHigh cholesterol, lipids, or triglycerides– Diabetes or high blood sugarDiabetes or high blood sugar– Hypertension or high blood pressureHypertension or high blood pressure– Current smoking: defined as “Do you now Current smoking: defined as “Do you now
smoke cigarettes?” (i.e. within the last week)smoke cigarettes?” (i.e. within the last week)– Liver disease or (bad liver) or CirrhosisLiver disease or (bad liver) or Cirrhosis– Kidney failure or (bad kidneys)Kidney failure or (bad kidneys)– Regular exercise: defined as engaging in Regular exercise: defined as engaging in
regular activities (e.g., brisk walking, jogging) regular activities (e.g., brisk walking, jogging) long enough to work up a sweat at least 3 long enough to work up a sweat at least 3 times a weektimes a week
CovariatesCovariates
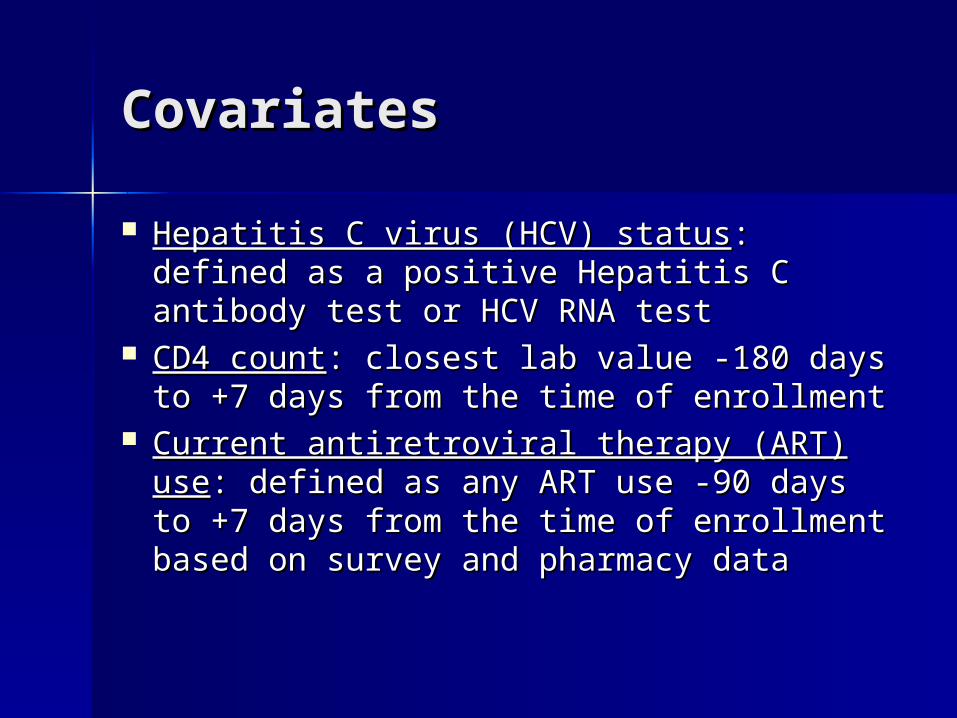
Hepatitis C virus (HCV) statusHepatitis C virus (HCV) status: defined : defined as a positive Hepatitis C antibody test as a positive Hepatitis C antibody test or HCV RNA testor HCV RNA test
CD4 countCD4 count: closest lab value -180 days : closest lab value -180 days to +7 days from the time of enrollmentto +7 days from the time of enrollment
Current antiretroviral therapy (ART) Current antiretroviral therapy (ART) useuse: defined as any ART use -90 days : defined as any ART use -90 days to +7 days from the time of enrollment to +7 days from the time of enrollment based on survey and pharmacy databased on survey and pharmacy data
AnalysisAnalysis
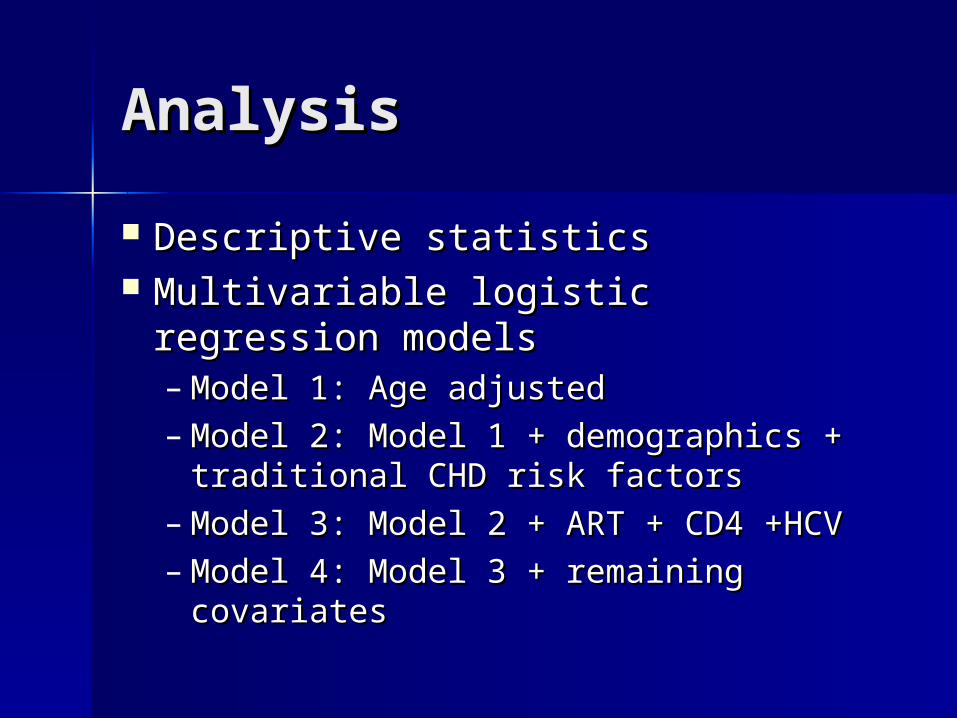
Descriptive statisticsDescriptive statistics Multivariable logistic regression Multivariable logistic regression
modelsmodels– Model 1: Age adjustedModel 1: Age adjusted– Model 2: Model 1 + demographics + Model 2: Model 1 + demographics +
traditional CHD risk factorstraditional CHD risk factors– Model 3: Model 2 + ART + CD4 +HCVModel 3: Model 2 + ART + CD4 +HCV– Model 4: Model 3 + remaining Model 4: Model 3 + remaining
covariatescovariates
Demographics Demographics
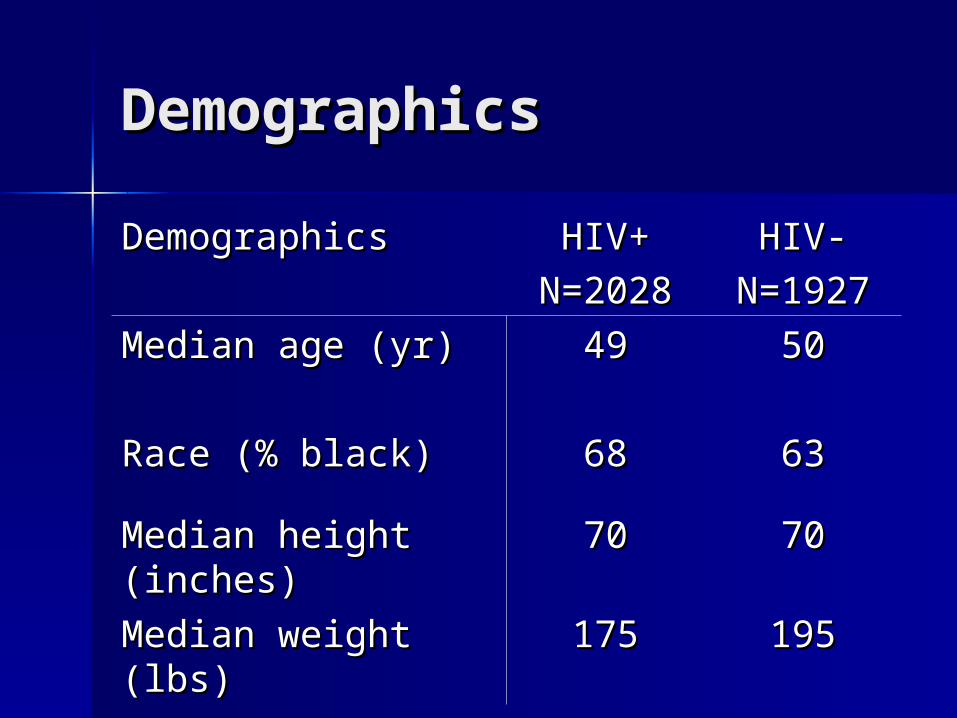
DemographicsDemographics HIV+HIV+
N=2028N=2028HIV-HIV-
N=1927N=1927
Median age (yr)Median age (yr) 4949 5050
Race (% black)Race (% black) 6868 6363
Median height Median height (inches)(inches)
7070 7070
Median weight (lbs)Median weight (lbs) 175175 195195
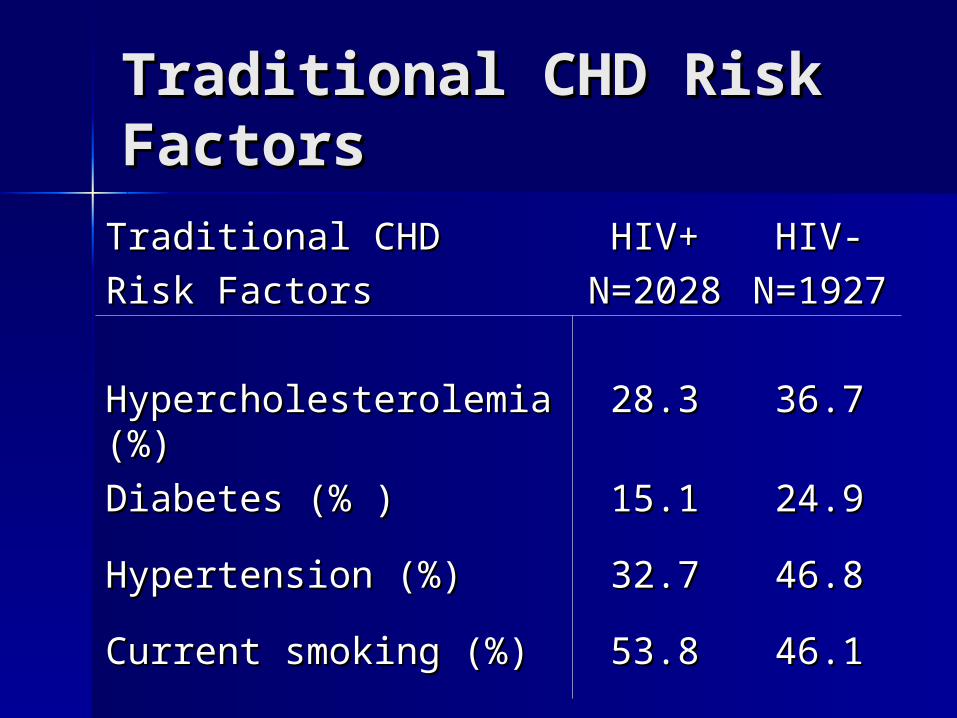
Traditional CHD Risk Traditional CHD Risk FactorsFactors
Traditional CHD Traditional CHD
Risk FactorsRisk FactorsHIV+HIV+
N=202N=20288
HIV-HIV-
N=192N=19277
Hypercholesterolemia Hypercholesterolemia (%)(%)
28.328.3 36.736.7
Diabetes (% )Diabetes (% ) 15.115.1 24.924.9
Hypertension (%) Hypertension (%) 32.732.7 46.846.8
Current smoking (%) Current smoking (%) 53.853.8 46.146.1
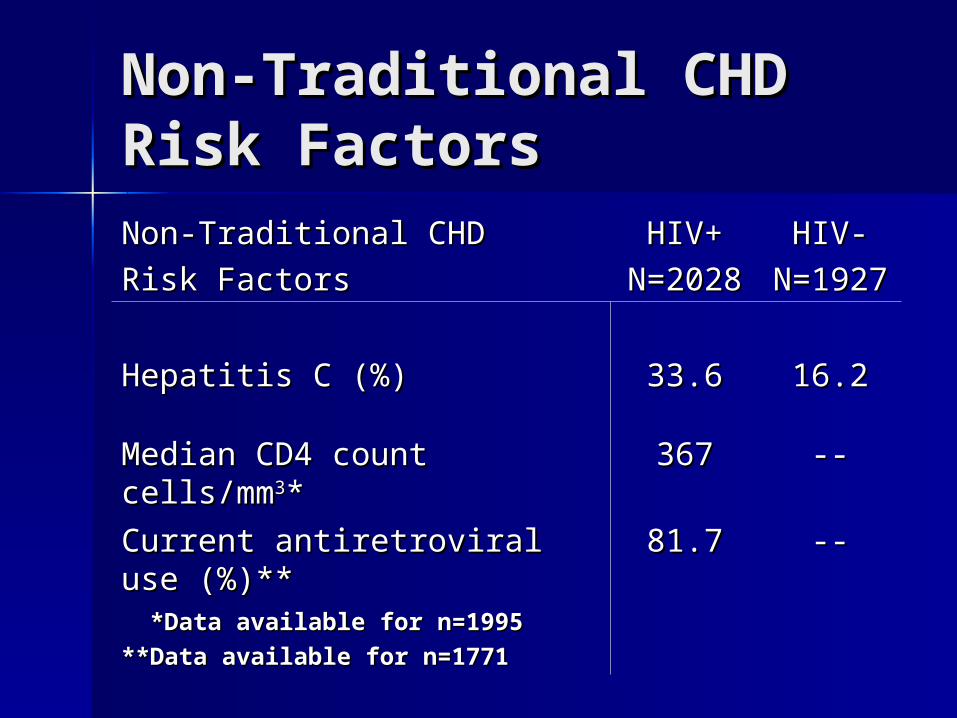
Non-Traditional CHD Non-Traditional CHD Risk FactorsRisk FactorsNon-Traditional CHD Non-Traditional CHD
Risk FactorsRisk FactorsHIV+HIV+
N=202N=20288
HIV-HIV-
N=192N=19277
Hepatitis C (%) Hepatitis C (%) 33.633.6 16.216.2
Median CD4 count cells/mmMedian CD4 count cells/mm33** 367367 ----
Current antiretroviral use Current antiretroviral use (%)** (%)**
81.781.7 ----
*Data available for n=1995*Data available for n=1995
**Data available for n=1771**Data available for n=1771
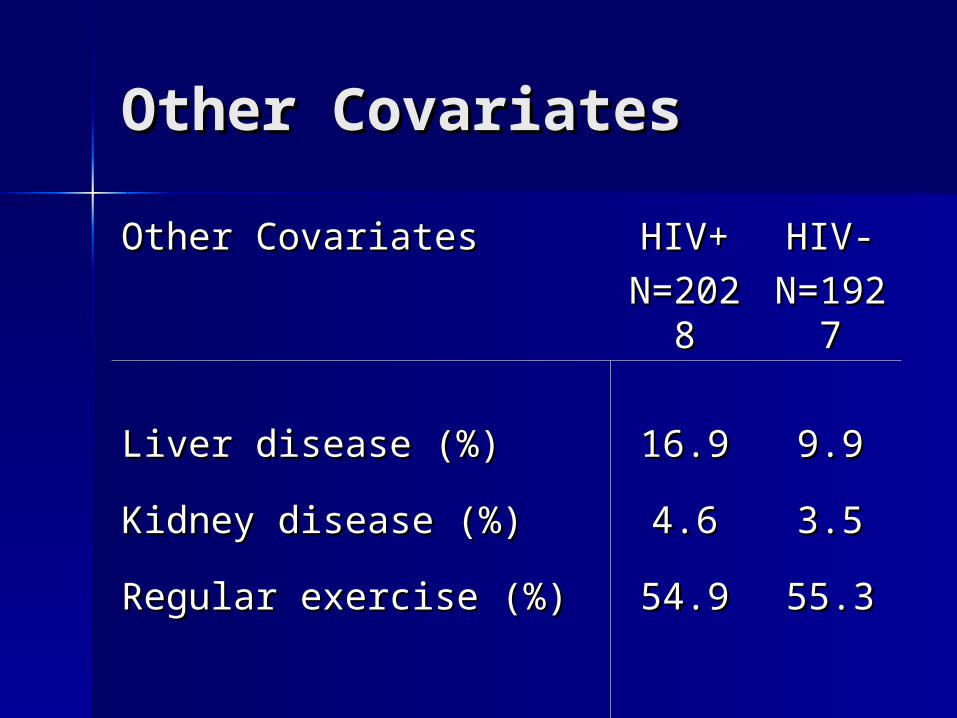
Other CovariatesOther Covariates
Other CovariatesOther Covariates HIV+HIV+
N=20N=202828
HIV-HIV-
N=19N=192727
Liver disease (%) Liver disease (%) 16.916.9 9.99.9
Kidney disease (%)Kidney disease (%) 4.64.6 3.53.5
Regular exercise (%)Regular exercise (%) 54.954.9 55.355.3
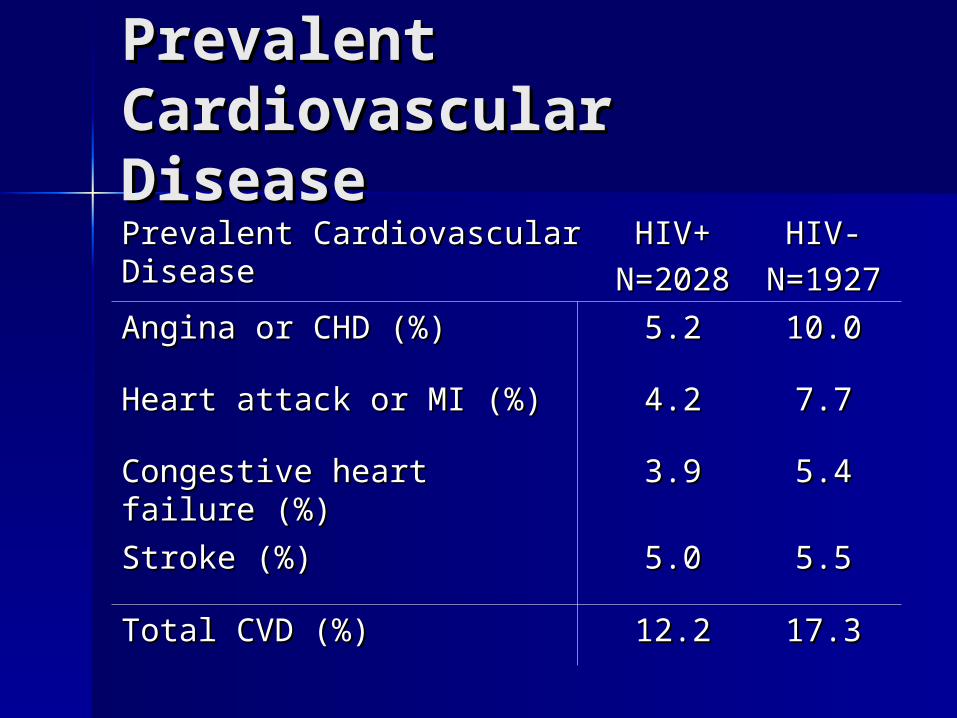
Prevalent Prevalent Cardiovascular DiseaseCardiovascular DiseasePrevalent Cardiovascular Prevalent Cardiovascular DiseaseDisease
HIV+HIV+
N=202N=20288
HIV-HIV-
N=1927N=1927
Angina or CHD (%) Angina or CHD (%) 5.25.2 10.010.0
Heart attack or MI (%)Heart attack or MI (%) 4.24.2 7.77.7
Congestive heart failure Congestive heart failure (%)(%)
3.93.9 5.45.4
Stroke (%)Stroke (%) 5.05.0 5.55.5
Total CVD (%)Total CVD (%) 12.212.2 17.317.3
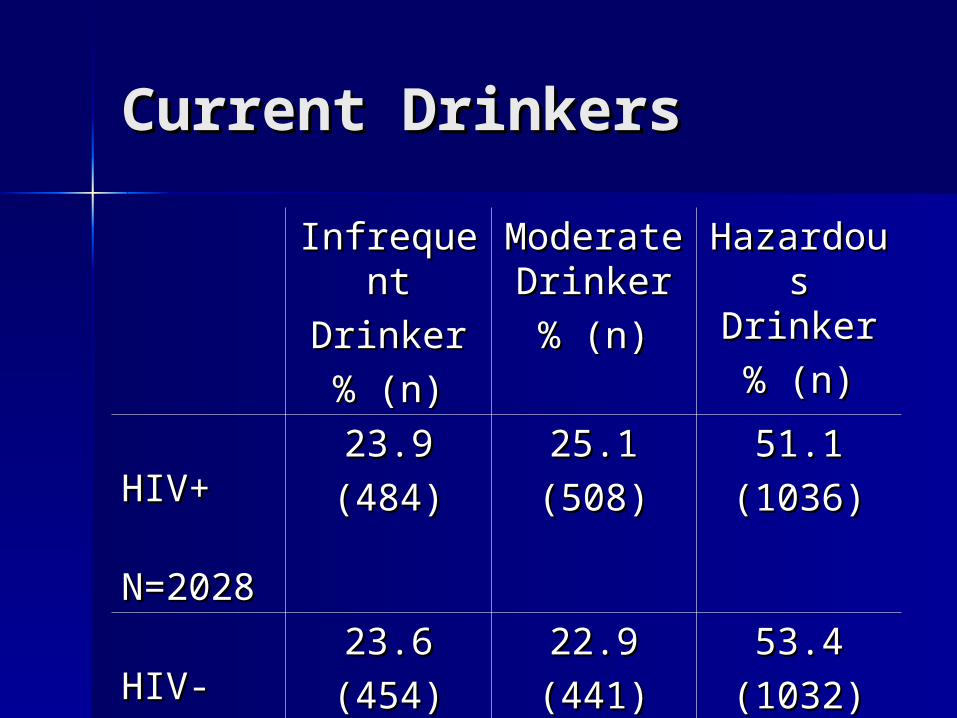
Current DrinkersCurrent Drinkers
InfrequenInfrequentt
DrinkerDrinker
% (n)% (n)
Moderate Moderate DrinkerDrinker
% (n)% (n)
HazardouHazardous Drinkers Drinker
% (n)% (n)
HIV+HIV+
N=2028N=2028
23.923.9
(484)(484)25.125.1
(508)(508)51.151.1
(1036)(1036)
HIV-HIV-
N=1927N=1927
23.623.6
(454)(454)22.922.9
(441)(441)53.453.4
(1032)(1032)
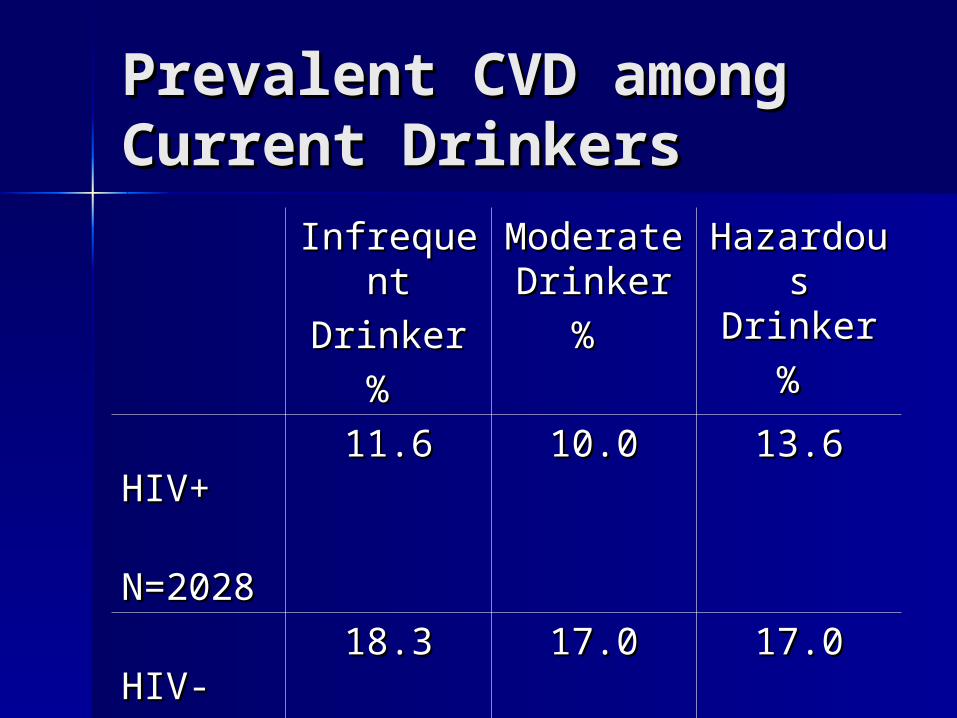
Prevalent CVD among Prevalent CVD among Current DrinkersCurrent Drinkers
InfrequenInfrequentt
DrinkerDrinker
% %
Moderate Moderate DrinkerDrinker
% %
HazardouHazardous Drinkers Drinker
% %
HIV+HIV+
N=2028N=2028
11.611.6 10.010.0 13.613.6
HIV-HIV-
N=1927N=1927
18.318.3 17.017.0 17.017.0
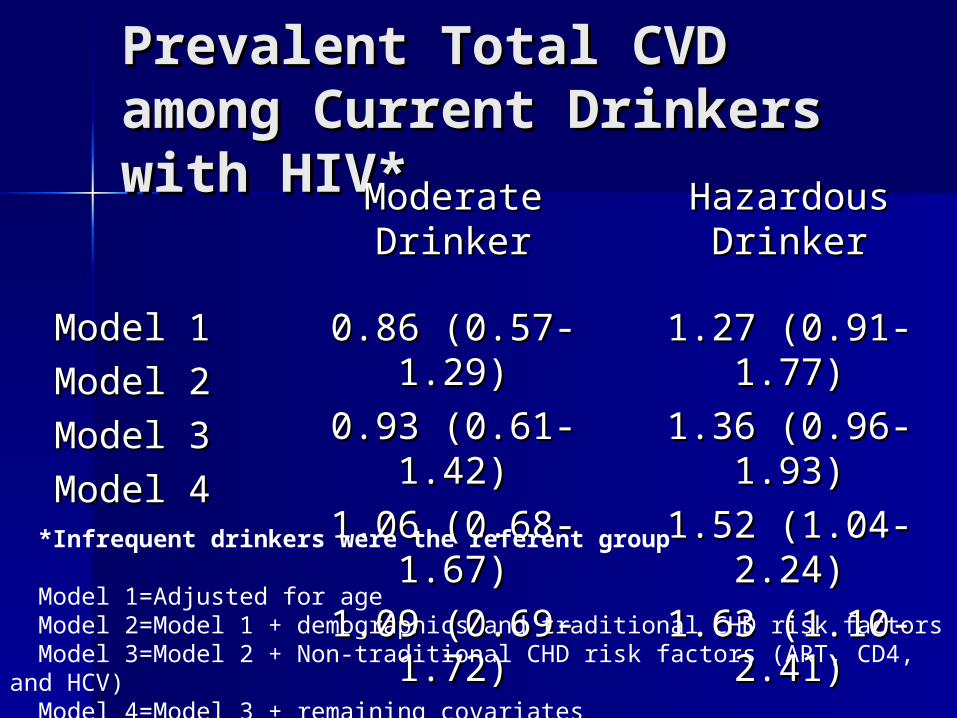
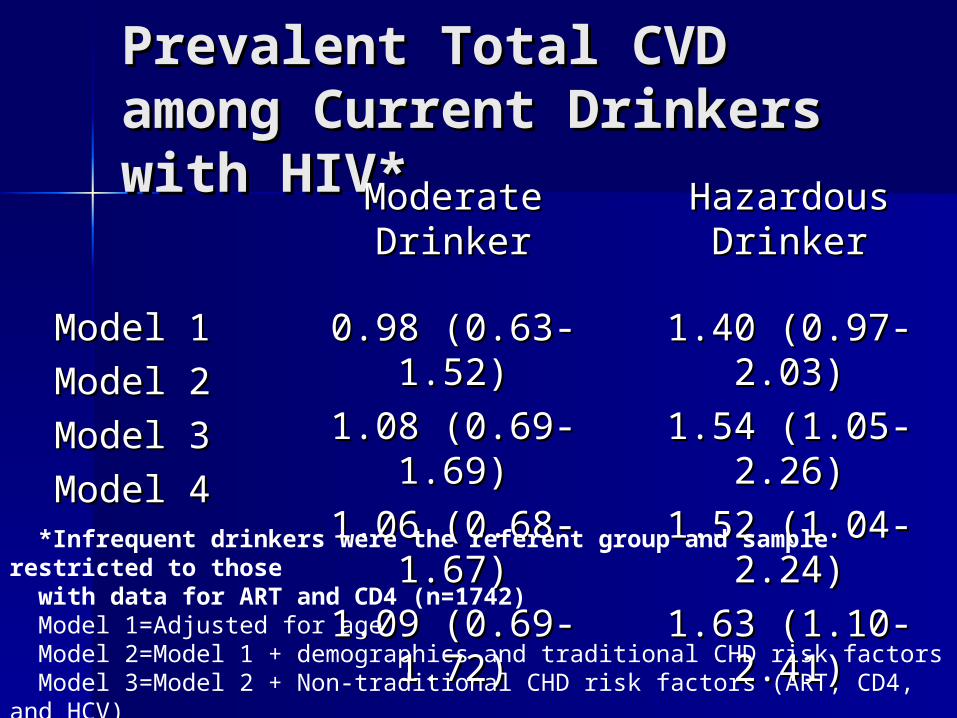
Prevalent Total CVD Prevalent Total CVD among Current Drinkers among Current Drinkers with HIV*with HIV*Moderate Moderate
DrinkerDrinkerHazardous Hazardous
DrinkerDrinker
Model 1Model 1
Model 2Model 2
Model 3Model 3
Model 4Model 4
0.86 (0.57-1.29)0.86 (0.57-1.29)
0.93 (0.61-1.42)0.93 (0.61-1.42)
1.06 (0.68-1.67)1.06 (0.68-1.67)
1.09 (0.69-1.72)1.09 (0.69-1.72)
1.27 (0.91-1.77)1.27 (0.91-1.77)
1.36 (0.96-1.93)1.36 (0.96-1.93)
1.52 (1.04-2.24)1.52 (1.04-2.24)
1.63 (1.10-2.41)1.63 (1.10-2.41) *Infrequent drinkers were the referent group
Model 1=Adjusted for age Model 2=Model 1 + demographics and traditional CHD risk factors Model 3=Model 2 + Non-traditional CHD risk factors (ART, CD4, and HCV) Model 4=Model 3 + remaining covariates
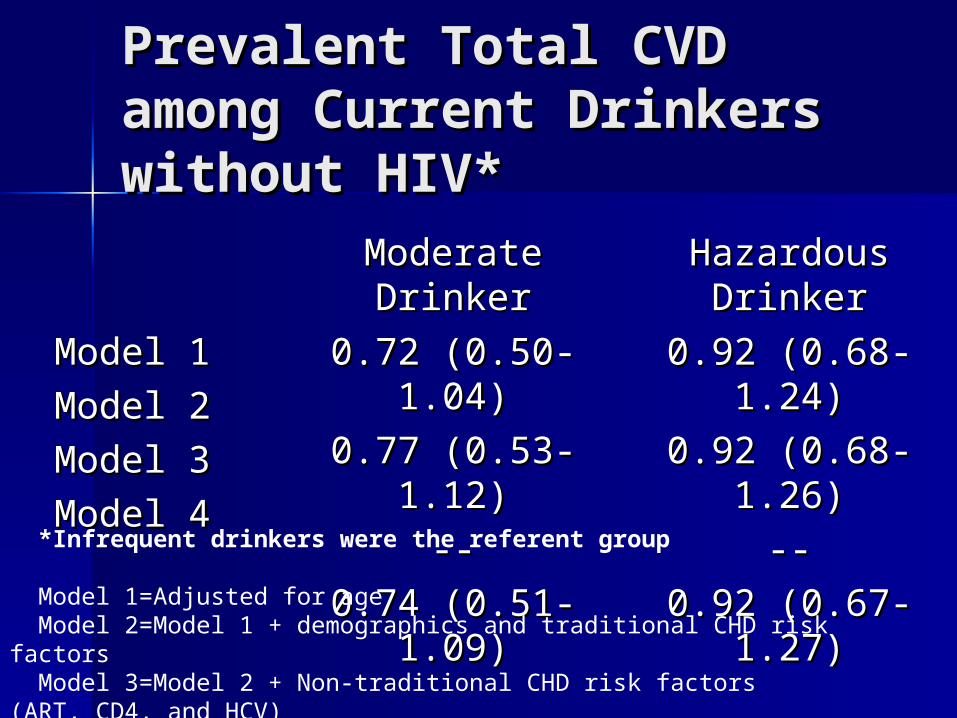
Prevalent Total CVD Prevalent Total CVD among Current Drinkers among Current Drinkers without HIV*without HIV*
Moderate Moderate DrinkerDrinker
Hazardous Hazardous DrinkerDrinker
Model 1Model 1
Model 2Model 2
Model 3Model 3
Model 4Model 4
0.72 (0.50-1.04)0.72 (0.50-1.04)
0.77 (0.53-1.12)0.77 (0.53-1.12)
----
0.74 (0.51-1.09)0.74 (0.51-1.09)
0.92 (0.68-1.24)0.92 (0.68-1.24)
0.92 (0.68-1.26)0.92 (0.68-1.26)
----
0.92 (0.67-1.27)0.92 (0.67-1.27) *Infrequent drinkers were the referent group
Model 1=Adjusted for age Model 2=Model 1 + demographics and traditional CHD risk factors Model 3=Model 2 + Non-traditional CHD risk factors (ART, CD4, and HCV) Model 4=Model 3 + remaining covariates
LimitationsLimitations
Possible non-differential misclassification Possible non-differential misclassification associated with self-reported outcomesassociated with self-reported outcomes
Possible differential misclassification Possible differential misclassification associated with HIV and frequent health associated with HIV and frequent health care visitscare visits
Hepatitis C laboratory screening was Hepatitis C laboratory screening was provider dependentprovider dependent
Cannot comment on cause and effectCannot comment on cause and effect Veterans may not be generalizable to Veterans may not be generalizable to
other populationsother populations
ConclusionsConclusions
A “J” shaped relationship between A “J” shaped relationship between alcohol and prevalent CVD was alcohol and prevalent CVD was observed for HIV+ and HIV- veteransobserved for HIV+ and HIV- veterans– For HIV+ veterans the J shaped For HIV+ veterans the J shaped
relationship was not present after relationship was not present after adjusting for confoundersadjusting for confounders
– For HIV- veterans, the J shaped For HIV- veterans, the J shaped relationship remained after adjusting for relationship remained after adjusting for confounders but was not statistically confounders but was not statistically significantsignificant
AcknowledgementsAcknowledgements
Funding: National Institute of Alcohol Abuse and Funding: National Institute of Alcohol Abuse and Alcoholism (NIAAA) Grants 5U01AA013566 and Alcoholism (NIAAA) Grants 5U01AA013566 and 7K23AA015914 7K23AA015914
Co-Investigators: Co-Investigators: – Amy Justice and the VACS Project TeamAmy Justice and the VACS Project Team– Jeffrey SametJeffrey Samet– Lewis KullerLewis Kuller– Kevin KraemerKevin Kraemer– R. Curtis EllisonR. Curtis Ellison– Richard SaitzRichard Saitz– Arlene AshArlene Ash– R.S. VasanR.S. Vasan– Lewis KazisLewis Kazis
Missing DataMissing Data
VACS cohort has 5988VACS cohort has 5988 1454 participants were former or 1454 participants were former or
never consumers of alcohol or did never consumers of alcohol or did not respond to one of the quantity not respond to one of the quantity frequency questionsfrequency questions
301 participants were women301 participants were women 208 participants were missing 208 participants were missing
data on covariate datadata on covariate data
Prevalent Total CVD Prevalent Total CVD among Current Drinkers among Current Drinkers with HIV*with HIV*Moderate Moderate
DrinkerDrinkerHazardous Hazardous
DrinkerDrinker
Model 1Model 1
Model 2Model 2
Model 3Model 3
Model 4Model 4
0.98 (0.63-1.52)0.98 (0.63-1.52)
1.08 (0.69-1.69)1.08 (0.69-1.69)
1.06 (0.68-1.67)1.06 (0.68-1.67)
1.09 (0.69-1.72)1.09 (0.69-1.72)
1.40 (0.97-2.03)1.40 (0.97-2.03)
1.54 (1.05-2.26)1.54 (1.05-2.26)
1.52 (1.04-2.24)1.52 (1.04-2.24)
1.63 (1.10-2.41)1.63 (1.10-2.41) *Infrequent drinkers were the referent group and sample restricted to those with data for ART and CD4 (n=1742) Model 1=Adjusted for age Model 2=Model 1 + demographics and traditional CHD risk factors Model 3=Model 2 + Non-traditional CHD risk factors (ART, CD4, and HCV) Model 4=Model 3 + remaining covariates
Alcohol & HIV: Alcohol & HIV: Developing Developing Interactive Interactive Computerized Brief Computerized Brief InterventionsInterventions
Joseph Conigliaro, MD, MPHJoseph Conigliaro, MD, MPH
Center for Enterprise Quality Center for Enterprise Quality and Safetyand Safety
University of KentuckyUniversity of Kentucky
Alcohol Use and AbuseAlcohol Use and Abuse 90% currently use or have used 90% currently use or have used
alcoholalcohol 14% report abuse or dependence14% report abuse or dependence Major factor in hospital, Major factor in hospital,
emergency visits, sick days & emergency visits, sick days & accidentsaccidents
Economic burdenEconomic burden
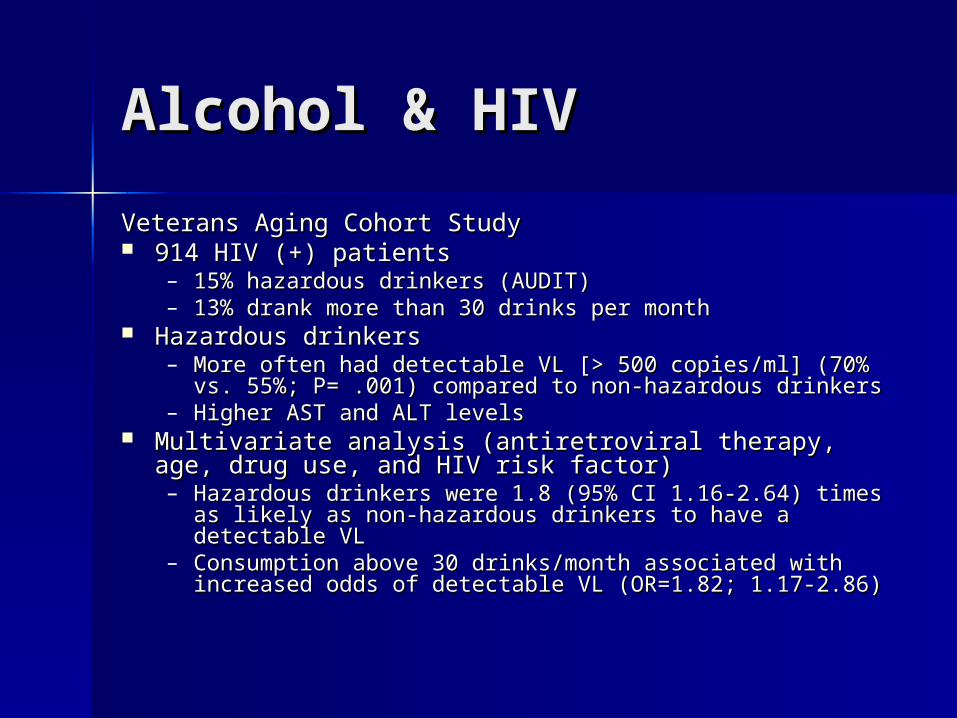
Alcohol & HIVAlcohol & HIV
Veterans Aging Cohort StudyVeterans Aging Cohort Study 914 HIV (+) patients914 HIV (+) patients
– 15% hazardous drinkers (AUDIT)15% hazardous drinkers (AUDIT)– 13% drank more than 30 drinks per month13% drank more than 30 drinks per month
Hazardous drinkersHazardous drinkers– More often had detectable VL [> 500 copies/ml] (70% vs. More often had detectable VL [> 500 copies/ml] (70% vs.
55%; P= .001) compared to non-hazardous drinkers55%; P= .001) compared to non-hazardous drinkers– Higher AST and ALT levelsHigher AST and ALT levels
Multivariate analysis (antiretroviral therapy, age, drug Multivariate analysis (antiretroviral therapy, age, drug use, and HIV risk factor)use, and HIV risk factor)– Hazardous drinkers were 1.8 (95% CI 1.16-2.64) times as Hazardous drinkers were 1.8 (95% CI 1.16-2.64) times as
likely as non-hazardous drinkers to have a detectable VLlikely as non-hazardous drinkers to have a detectable VL– Consumption above 30 drinks/month associated with Consumption above 30 drinks/month associated with
increased odds of detectable VL (OR=1.82; 1.17-2.86)increased odds of detectable VL (OR=1.82; 1.17-2.86)
Alcohol & HIVAlcohol & HIV
Significant implications for clinical Significant implications for clinical management and outcomesmanagement and outcomes
Associated with increased Associated with increased morbidity & mortality, rapid morbidity & mortality, rapid disease progression, poorer disease progression, poorer adherence to antiretroviral adherence to antiretroviral regimens, and viral resistanceregimens, and viral resistance
Institute of MedicineInstitute of Medicine
Providers should be able to:Providers should be able to:– identifyidentify– treat alcohol problemstreat alcohol problems– refer for specialist treatmentrefer for specialist treatment
Unique position for early detection & RxUnique position for early detection & Rx– prevalenceprevalence– patient accesspatient access– Linkage of medical problemsLinkage of medical problems– Rapport with patientRapport with patient
Lack expertise and capabilityLack expertise and capability Limited time and resourcesLimited time and resources
Brief InterventionsBrief Interventions
Reduce alcohol consumptionReduce alcohol consumption Decrease Decrease alcohol related alcohol related
complicationscomplications Reduce alcohol related health care Reduce alcohol related health care
costscosts Not routine practiceNot routine practice
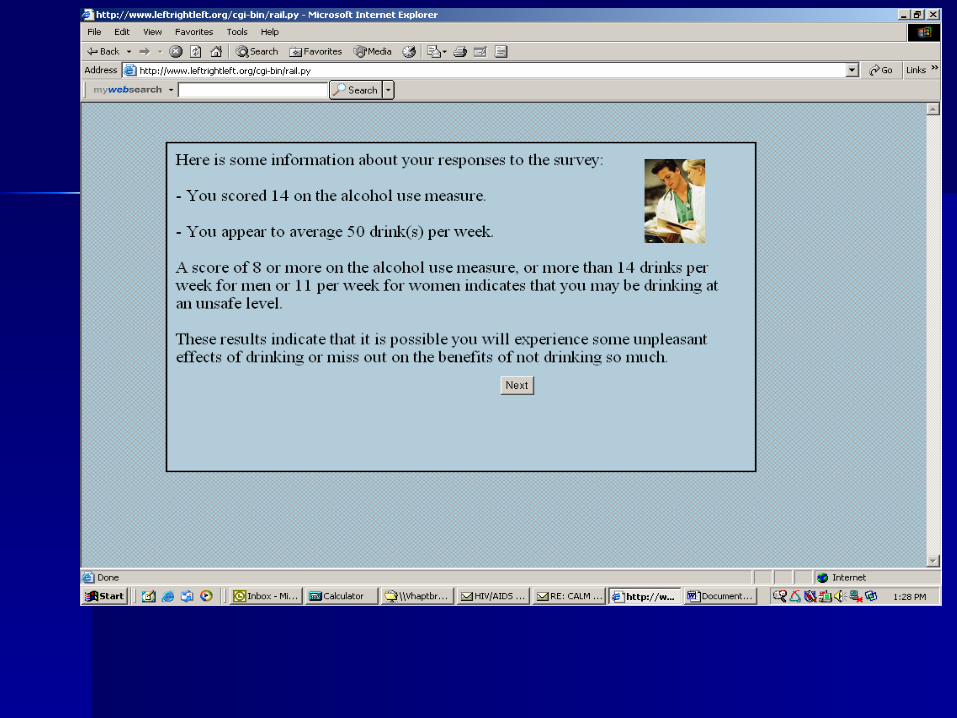
Interactive Computer Interactive Computer Programs & BIsPrograms & BIs Assess drinking status & readiness to changeAssess drinking status & readiness to change Initiate provider delivered BIsInitiate provider delivered BIs Prepare patient & provider for targeted sessionPrepare patient & provider for targeted session Saves timeSaves time Reduce time lag between assessment and feedback.Reduce time lag between assessment and feedback. Facilitate individualized feedback immediately upon Facilitate individualized feedback immediately upon
submission of datasubmission of data Provide lower-cost and customized intervention to Provide lower-cost and customized intervention to
more drinkersmore drinkers Provide anonymity, convenience –can be done Provide anonymity, convenience –can be done
anytime, day or nightanytime, day or night Feedback objective and not influenced by counselor Feedback objective and not influenced by counselor
biasbias
Internet to Reduce Internet to Reduce Problem DrinkingProblem Drinking
Computers, and the internet, have become Computers, and the internet, have become integral part of lifeintegral part of life
Approx 80 % of internet "surfers" in the US Approx 80 % of internet "surfers" in the US have reportedly used it to access health have reportedly used it to access health informationinformation
In-person brief motivational interventions In-person brief motivational interventions are currently offered via the internetare currently offered via the internet
Drinkers may prefer this formatDrinkers may prefer this format– way to save faceway to save face– can begin to look at their drinking in private can begin to look at their drinking in private
and nonjudgmental wayand nonjudgmental way
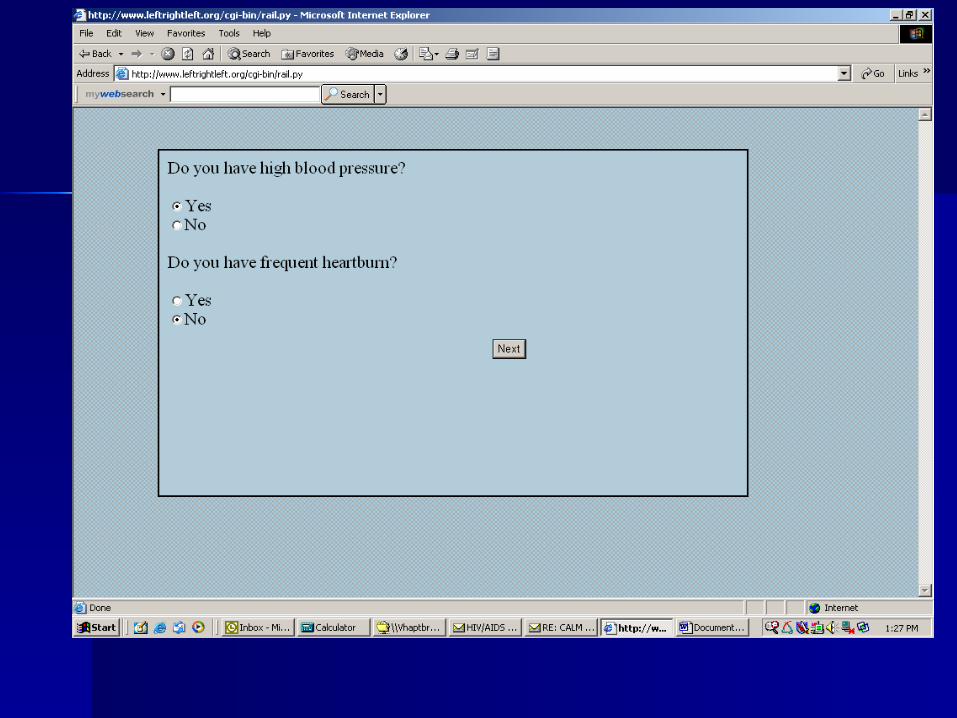
AlcoholScreening.orgAlcoholScreening.org
AnonymousAnonymous Free online serviceFree online service Offers visitorsOffers visitors
– self-screening of drinking behaviorsself-screening of drinking behaviors– individualized feedbackindividualized feedback– when appropriate, information about when appropriate, information about
treatmenttreatment
AlcoholScreening.orgAlcoholScreening.org Examined whether the site reached potential Examined whether the site reached potential
hazardous drinkers.hazardous drinkers. 14-months14-months
– over 66,000 visitorsover 66,000 visitors– nearly 40,000 > age 18 completed screen about nearly 40,000 > age 18 completed screen about
drinking habitsdrinking habits 90% of all visitors who completed screen were 90% of all visitors who completed screen were
hazardous drinkers (by AUDIT, and 2 quantity and hazardous drinkers (by AUDIT, and 2 quantity and frequency questions - >14 drinks per week or >4 frequency questions - >14 drinks per week or >4 drinks per occasion for men, and >7 drinks per week drinks per occasion for men, and >7 drinks per week or >3 drinks per occasion for women)or >3 drinks per occasion for women)
65% had possible alcohol abuse or dependence65% had possible alcohol abuse or dependence After receiving results, 19% chose “Learn More” or After receiving results, 19% chose “Learn More” or
“Get Help” options“Get Help” options
The Drinker's Check-upThe Drinker's Check-up
internet equivalent of 2-3 face-face sessions with internet equivalent of 2-3 face-face sessions with counselorcounselor
same elements of original DCUsame elements of original DCU– drinker's risk factors, family history, alcohol & drug use, drinker's risk factors, family history, alcohol & drug use,
alcohol-related problems, symptoms of dependence, & alcohol-related problems, symptoms of dependence, & motivation for changemotivation for change
– objective feedback based on answers; objective feedback based on answers; – module to resolve ambivalence about whether to changemodule to resolve ambivalence about whether to change
helps users decide to change their drinkinghelps users decide to change their drinking goals of change –stopping or cutting backgoals of change –stopping or cutting back heavy drinkers increased internal motivation for heavy drinkers increased internal motivation for
change and reduced drinking, alcohol-related change and reduced drinking, alcohol-related problems and symptoms of dependence by 50 % at problems and symptoms of dependence by 50 % at 12-months12-months
The e-CHUGThe e-CHUG
web-based version of the Check-Up to web-based version of the Check-Up to Go (CHUG) mailed feedback instrumentGo (CHUG) mailed feedback instrument
proven effective in college trialsproven effective in college trials favorable to more lengthy prevention favorable to more lengthy prevention
programs and may increase the impact programs and may increase the impact of educational or skill-based prevention of educational or skill-based prevention effortsefforts
provides information about personal provides information about personal consumption, potential risk factors, and consumption, potential risk factors, and comparison to campus normscomparison to campus norms

Current Internet Current Internet ProgramsPrograms Accessible to those with Accessible to those with
computer/internetcomputer/internet Geared toward younger personsGeared toward younger persons Not specific to HIVNot specific to HIV Not linked to EMRNot linked to EMR Not linked to providerNot linked to provider Not linked to clinic visitNot linked to clinic visit
QuestionsQuestions
Can it be done in the clinic?Can it be done in the clinic? What about older veterans?What about older veterans?
Long Term GoalLong Term Goal To identify and treat hazardous To identify and treat hazardous
drinking among HIV infected drinking among HIV infected veterans through the use of BIs veterans through the use of BIs and to identify and refer alcohol and to identify and refer alcohol use disorders among veterans use disorders among veterans using brief interventionsusing brief interventions
Specific AimsSpecific Aims
Test and adapt an alcohol screening and Test and adapt an alcohol screening and interactive computer prototype using interactive computer prototype using iterative process of user testing, focus iterative process of user testing, focus groups and face-to-face interviews with groups and face-to-face interviews with provider & patientsprovider & patients
Test feasibility of implementing prototype in Test feasibility of implementing prototype in two VA HIV clinicstwo VA HIV clinics
Gather information on effect size of Gather information on effect size of intervention to reduce consumption, and HIV intervention to reduce consumption, and HIV relevant consequences (sexual risk behavior relevant consequences (sexual risk behavior & antiretroviral medication adherence)& antiretroviral medication adherence)
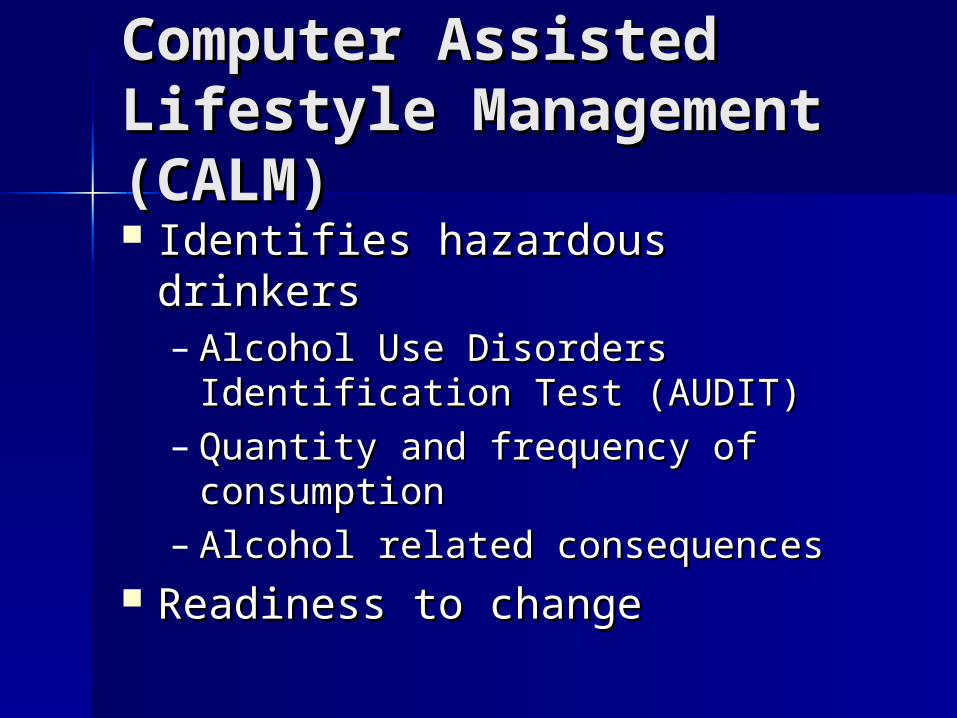
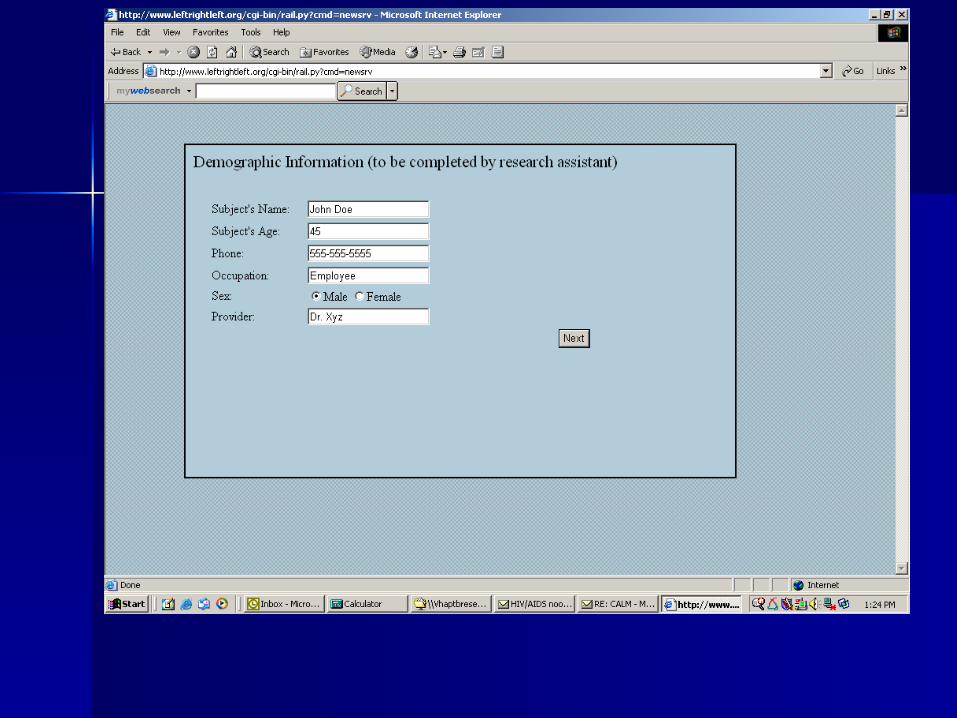
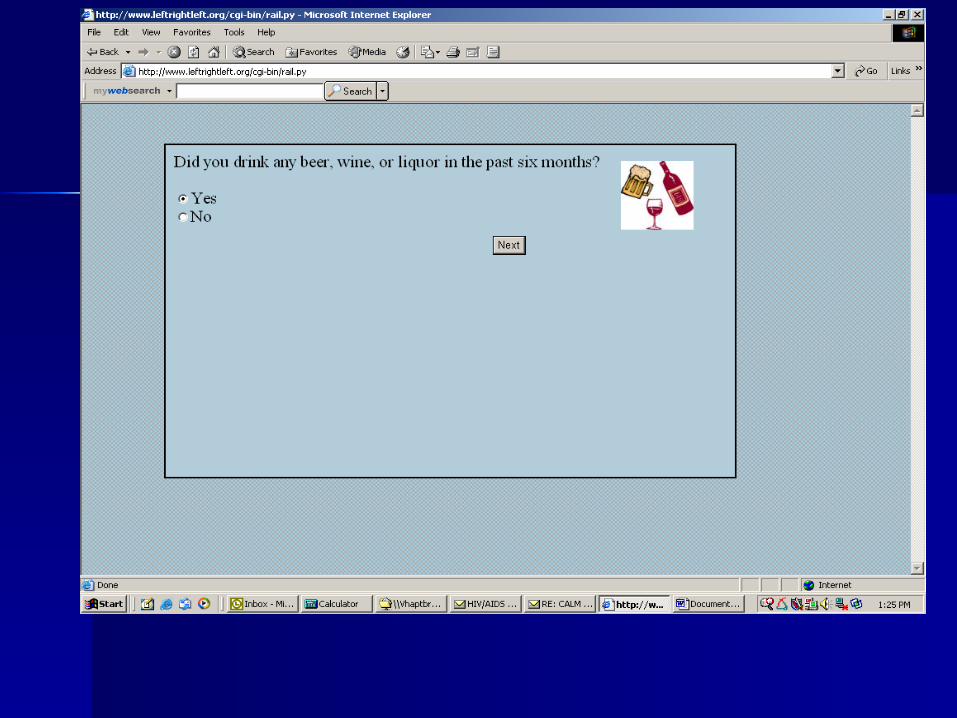
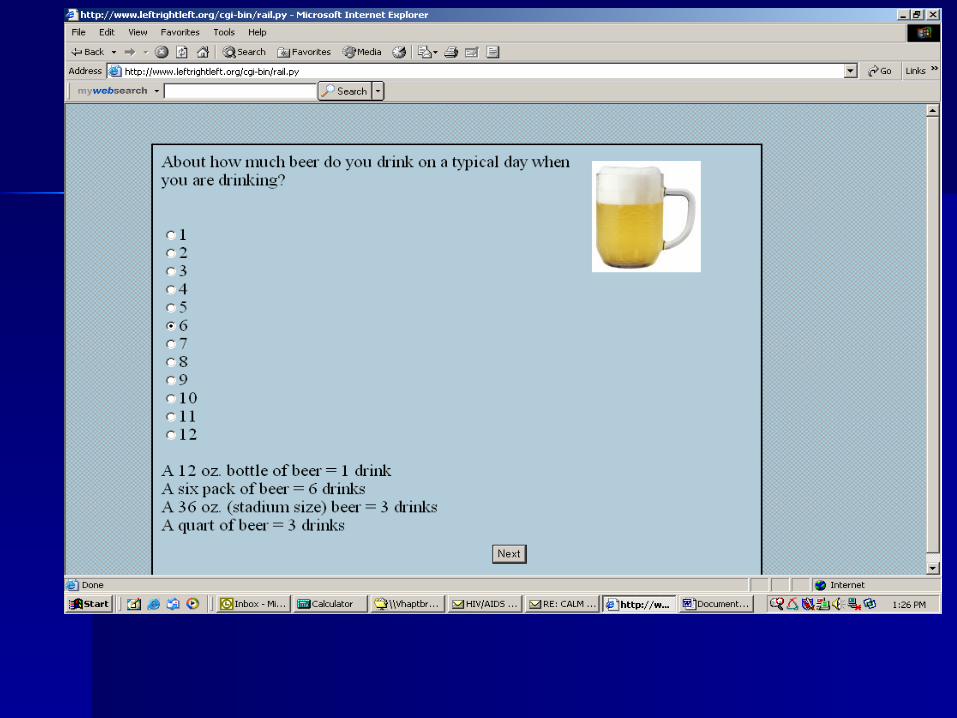
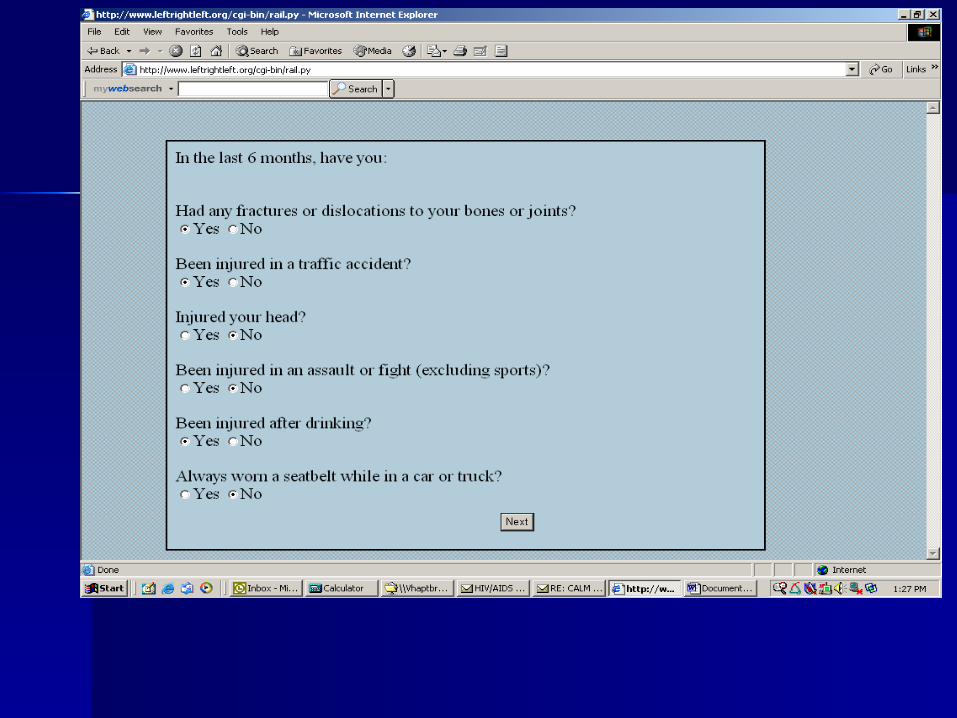
Computer Assisted Computer Assisted Lifestyle Management Lifestyle Management (CALM)(CALM) Identifies hazardous drinkersIdentifies hazardous drinkers
– Alcohol Use Disorders Identification Alcohol Use Disorders Identification Test (AUDIT)Test (AUDIT)
– Quantity and frequency of Quantity and frequency of consumptionconsumption
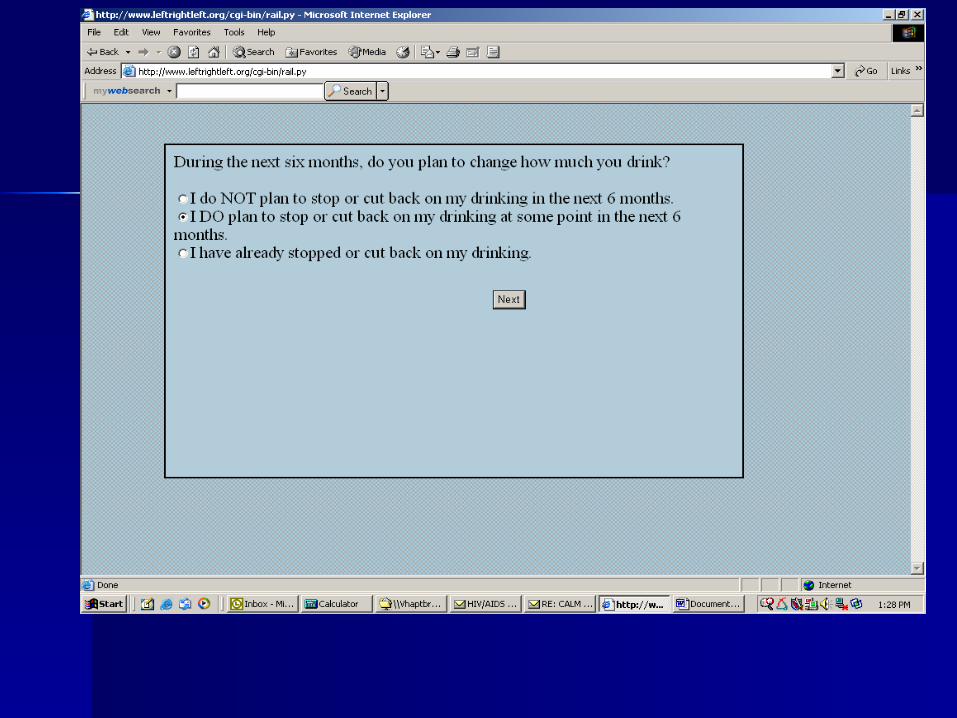
– Alcohol related consequencesAlcohol related consequences Readiness to changeReadiness to change
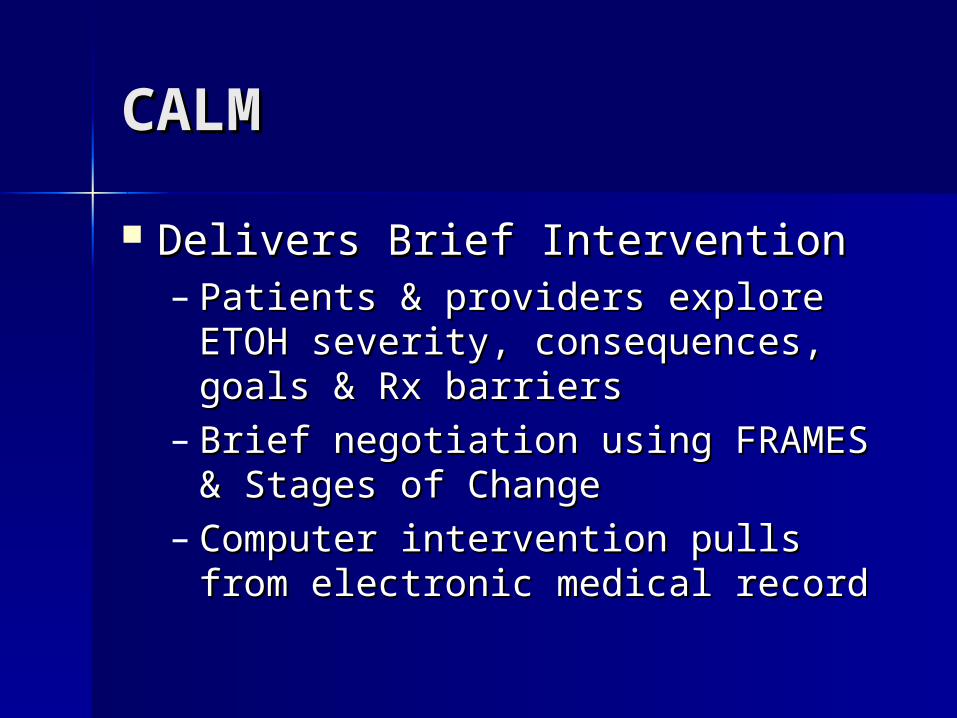
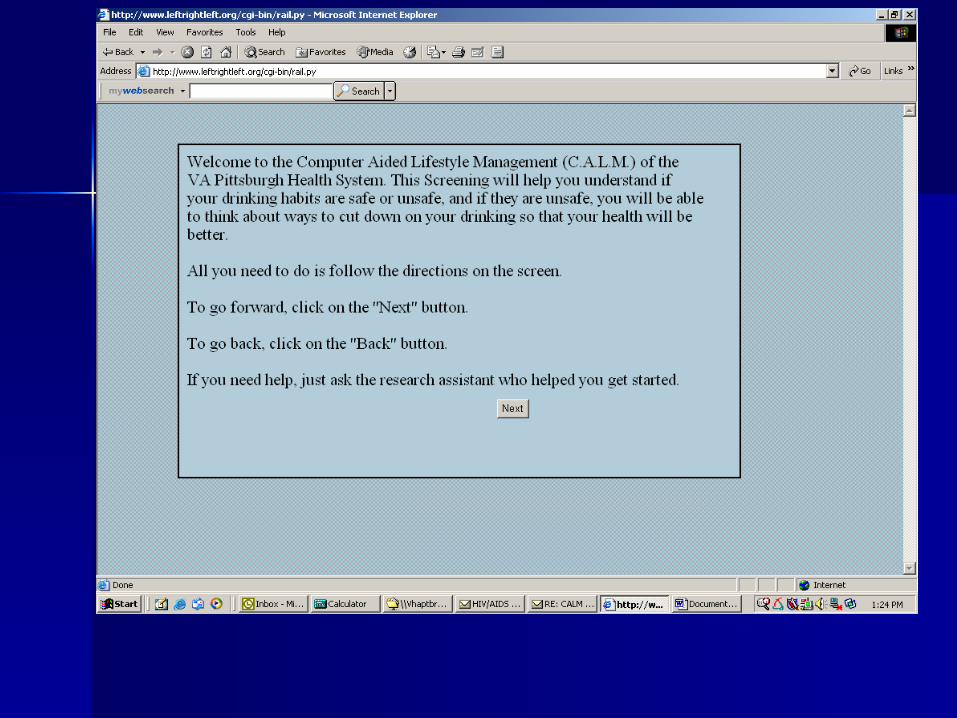
CALMCALM
Delivers Brief InterventionDelivers Brief Intervention– Patients & providers explore ETOH Patients & providers explore ETOH
severity, consequences, goals & Rx severity, consequences, goals & Rx barriersbarriers
– Brief negotiation using FRAMES & Brief negotiation using FRAMES & Stages of ChangeStages of Change
– Computer intervention pulls from Computer intervention pulls from electronic medical recordelectronic medical record
CALMCALM
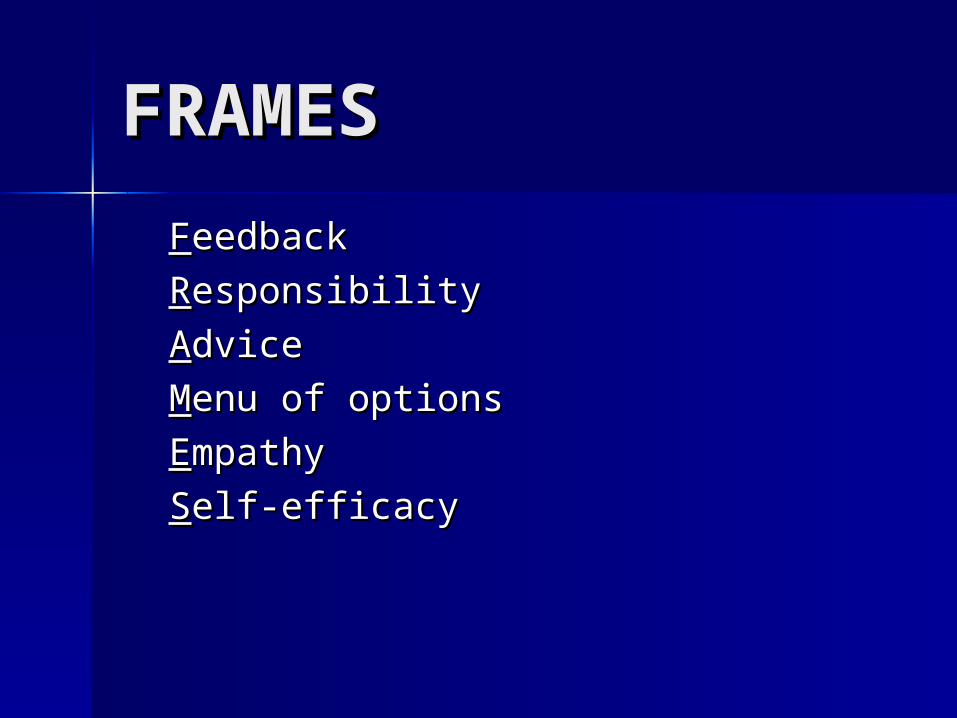
FRAMESFRAMES
FFeedbackeedback
RResponsibilityesponsibility
AAdvicedvice
MMenu of optionsenu of options
EEmpathympathy
SSelf-efficacyelf-efficacy
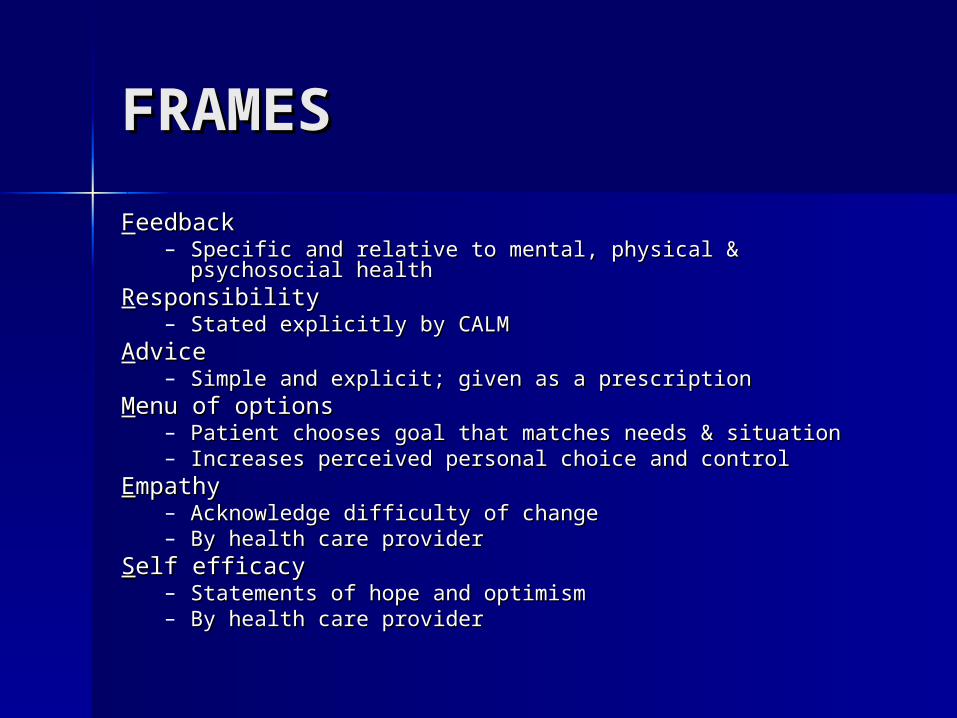
FRAMESFRAMES
FFeedbackeedback– Specific and relative to mental, physical & psychosocial Specific and relative to mental, physical & psychosocial
healthhealthRResponsibilityesponsibility
– Stated explicitly by CALMStated explicitly by CALMAAdvicedvice
– Simple and explicit; given as a prescriptionSimple and explicit; given as a prescriptionMMenu of optionsenu of options
– Patient chooses goal that matches needs & situationPatient chooses goal that matches needs & situation– Increases perceived personal choice and controlIncreases perceived personal choice and control
EEmpathympathy– Acknowledge difficulty of changeAcknowledge difficulty of change– By health care providerBy health care provider
SSelf efficacyelf efficacy– Statements of hope and optimismStatements of hope and optimism– By health care providerBy health care provider
Pilot StudyPilot Study
Specific AimsSpecific Aims To assess ease of use and To assess ease of use and
acceptability of CALM among acceptability of CALM among veterans in primary care clinicveterans in primary care clinic
To assess patient knowledge and To assess patient knowledge and attitudes regarding computersattitudes regarding computers
To assess provider attitudes To assess provider attitudes regarding use of CALM in clinicregarding use of CALM in clinic
MethodsMethods Veterans approached in PC waiting areaVeterans approached in PC waiting area Completed self administered computer Completed self administered computer
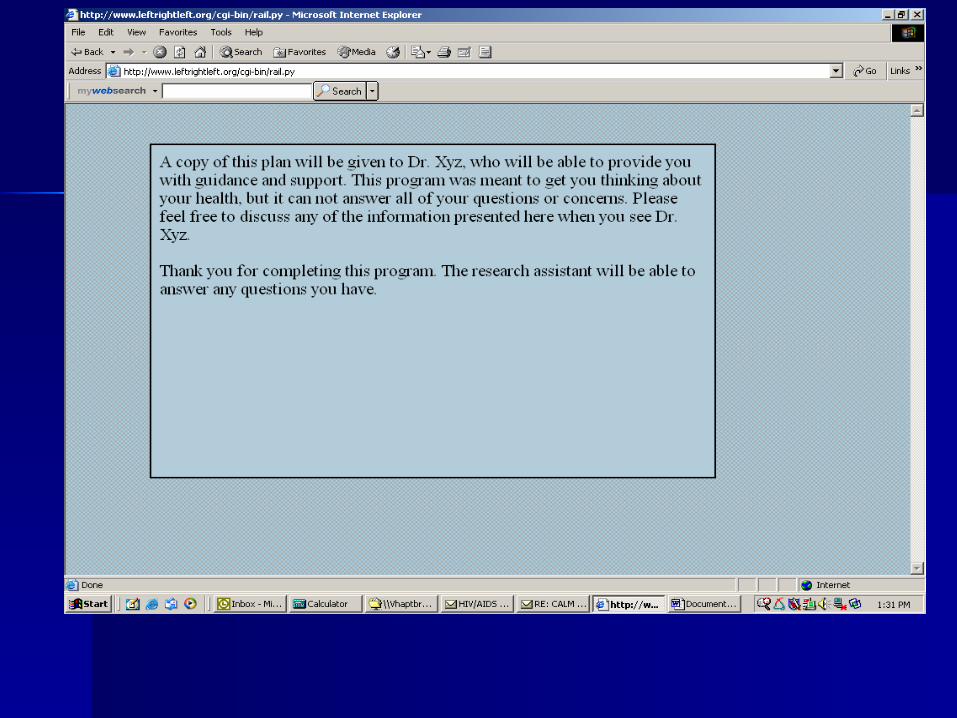
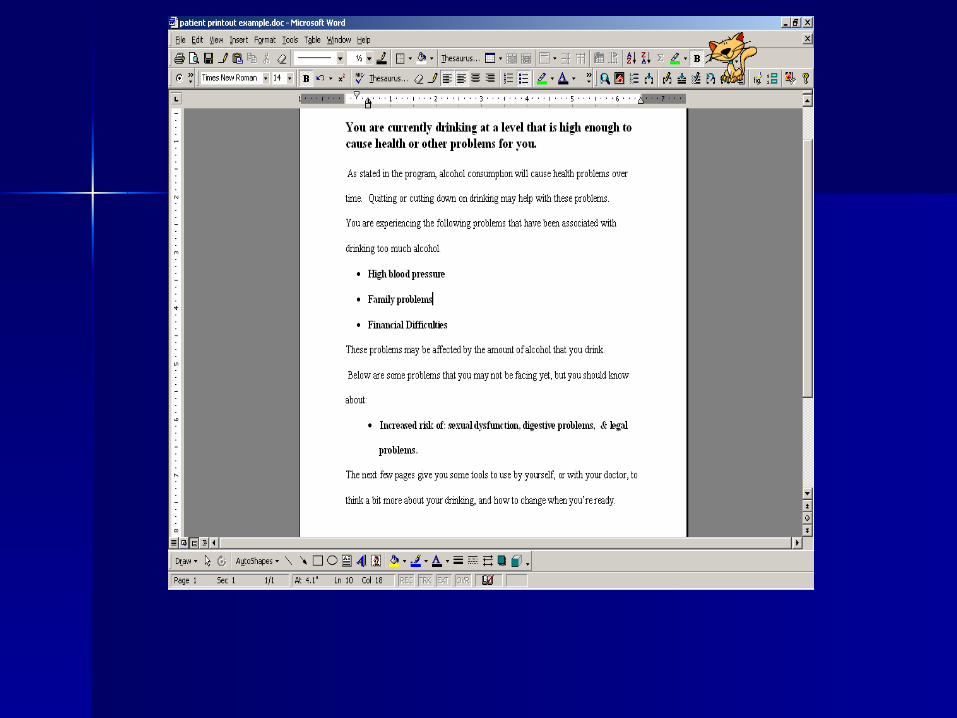
programprogram Touch screen tablet computerTouch screen tablet computer Patient print out – summary & change Patient print out – summary & change
planplan Provider print out - patient responses & Provider print out - patient responses &
change planchange plan Providers surveyed after patient visitProviders surveyed after patient visit
MethodsMethods
Measures Measures – assessment of ease of use and assessment of ease of use and
acceptability of CALMacceptability of CALM– knowledge and attitudes regarding knowledge and attitudes regarding
computercomputer
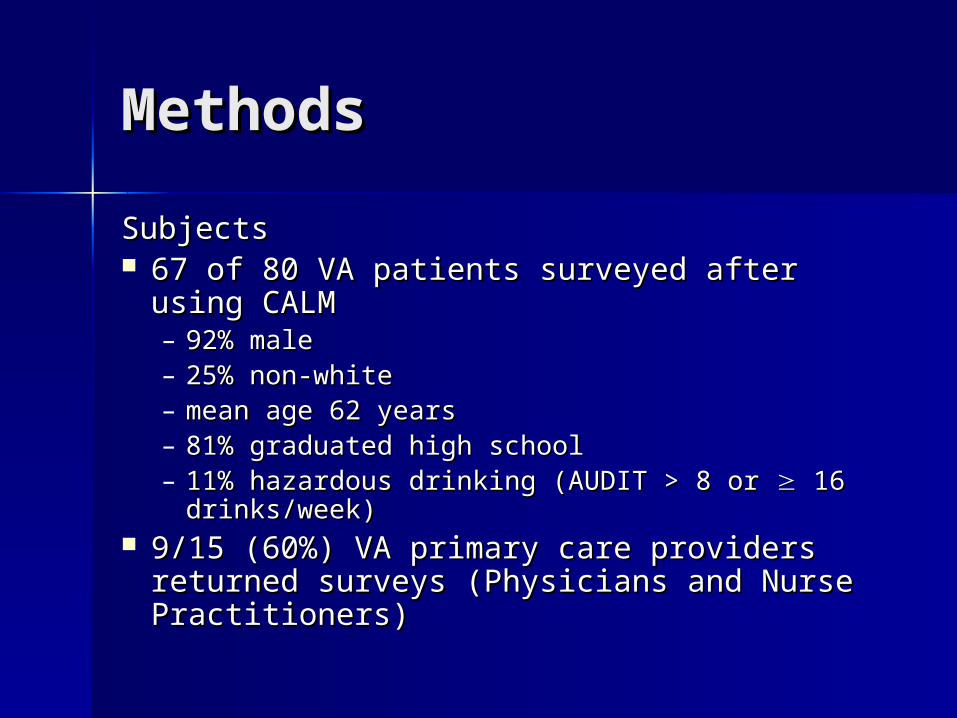
MethodsMethods
SubjectsSubjects 67 of 80 VA patients surveyed after using 67 of 80 VA patients surveyed after using
CALMCALM– 92% male92% male– 25% non-white25% non-white– mean age 62 yearsmean age 62 years– 81% graduated high school81% graduated high school– 11% hazardous drinking (AUDIT > 8 or 11% hazardous drinking (AUDIT > 8 or 16 16
drinks/week)drinks/week) 9/15 (60%) VA primary care providers 9/15 (60%) VA primary care providers
returned surveys (Physicians and Nurse returned surveys (Physicians and Nurse Practitioners)Practitioners)
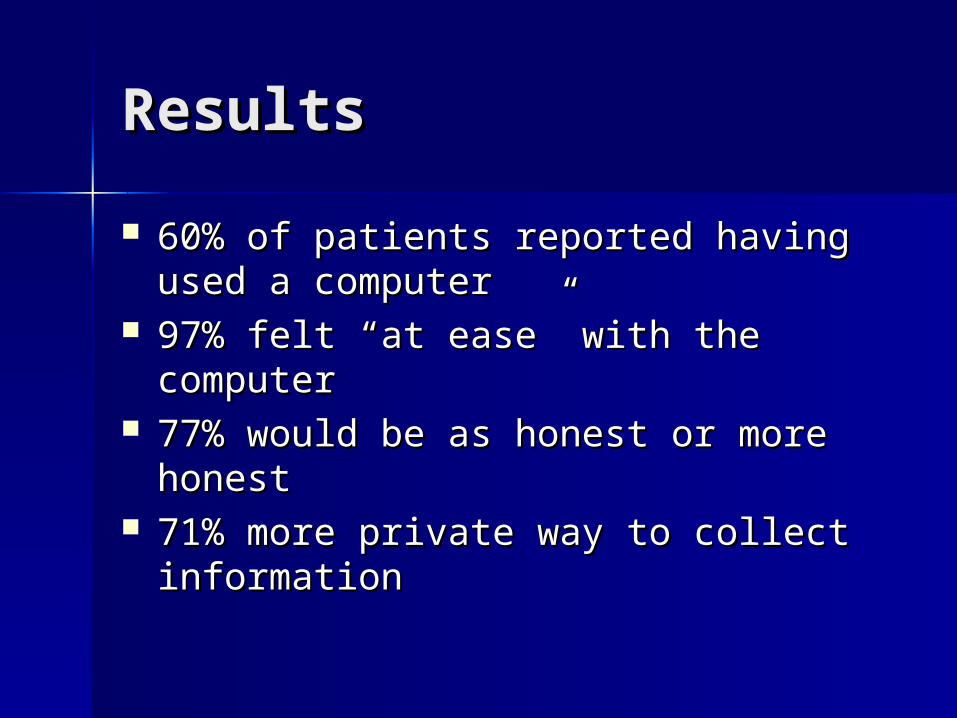
ResultsResults
60% of patients reported having used 60% of patients reported having used a computera computer
97% felt “at ease” with the computer97% felt “at ease” with the computer 77% would be as honest or more 77% would be as honest or more
honesthonest 71% more private way to collect 71% more private way to collect
informationinformation
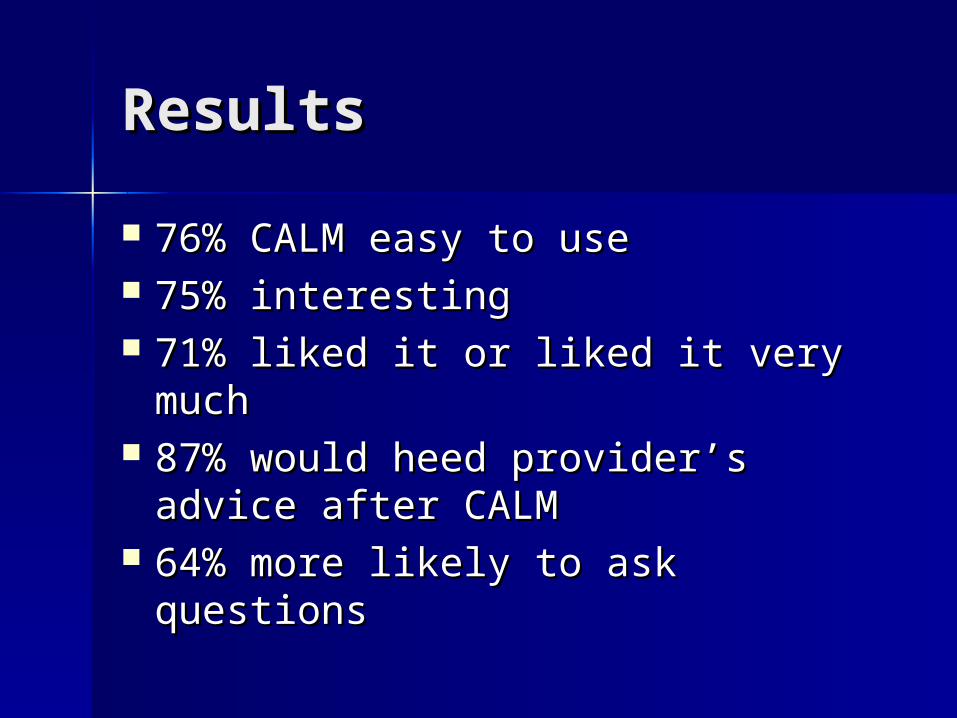
ResultsResults
76% CALM easy to use76% CALM easy to use 75% interesting75% interesting 71% liked it or liked it very much71% liked it or liked it very much 87% would heed provider’s 87% would heed provider’s
advice after CALMadvice after CALM 64% more likely to ask questions64% more likely to ask questions
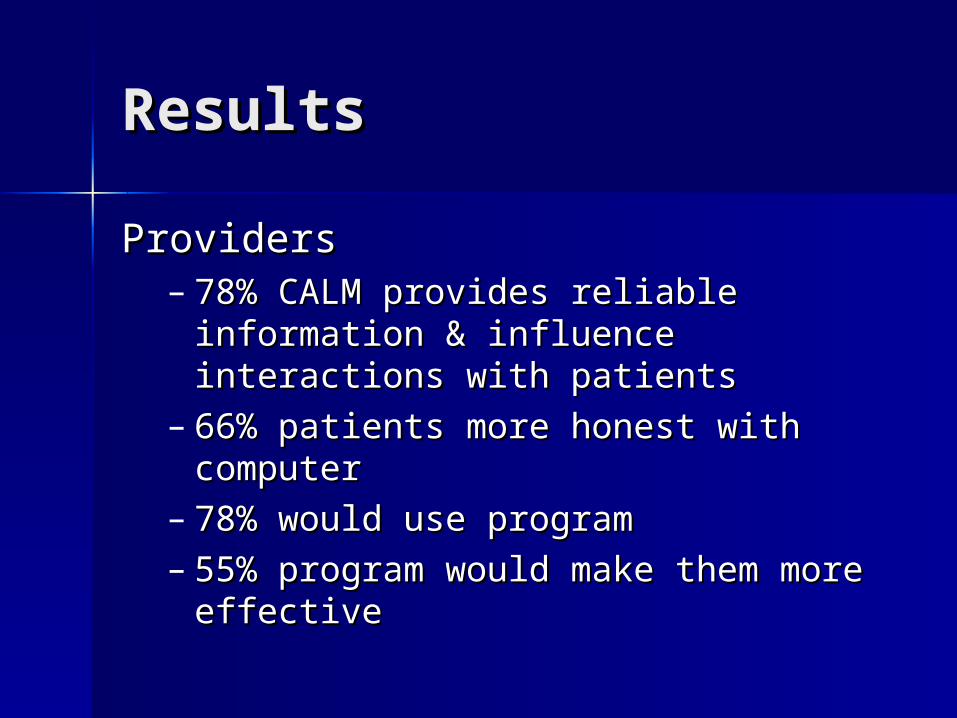
ResultsResults
ProvidersProviders– 78% CALM provides reliable 78% CALM provides reliable
information & influence interactions information & influence interactions with patientswith patients
– 66% patients more honest with 66% patients more honest with computercomputer
– 78% would use program78% would use program– 55% program would make them more 55% program would make them more
effectiveeffective
ConclusionsConclusions
Delivering a computerized BI in Delivering a computerized BI in primary care primary care – acceptable to providers and patientsacceptable to providers and patients– viewed as facilitating dialogue about viewed as facilitating dialogue about
drinkingdrinking– may enhance patient receptiveness may enhance patient receptiveness
to provider adviceto provider advice
Methodological IssuesMethodological Issues
1.1. What is “hazardous drinking” in What is “hazardous drinking” in the HIV Population?the HIV Population?
2.2. Is the clinic an appropriate venue Is the clinic an appropriate venue to administer CALM? Role of to administer CALM? Role of Internet?Internet?
3.3. What is the best way to deliver What is the best way to deliver info to providers?info to providers?
4.4. Timing of intervention with Timing of intervention with respect to provider visit?respect to provider visit?
Future DirectionsFuture Directions
RefinementRefinement Customization in Subspecialty Customization in Subspecialty
ClinicsClinics– HIV ClinicsHIV Clinics
Linkage to CPRSLinkage to CPRS– Wireless “print out” to providerWireless “print out” to provider
Timing of CALM deliveryTiming of CALM delivery– Before visit at home? waiting room? Before visit at home? waiting room?
after clinic?after clinic?
Tailoring Tailoring Computerized BIsComputerized BIs BIsBIs
– Need to be tailored to individual Need to be tailored to individual patientspatients
– Need to be tailored to individual Need to be tailored to individual conditionsconditions
– Varying age, health problemVarying age, health problem Link to clinical care, providerLink to clinical care, provider Tailor any BITailor any BI
CALM SPECSCALM SPECS
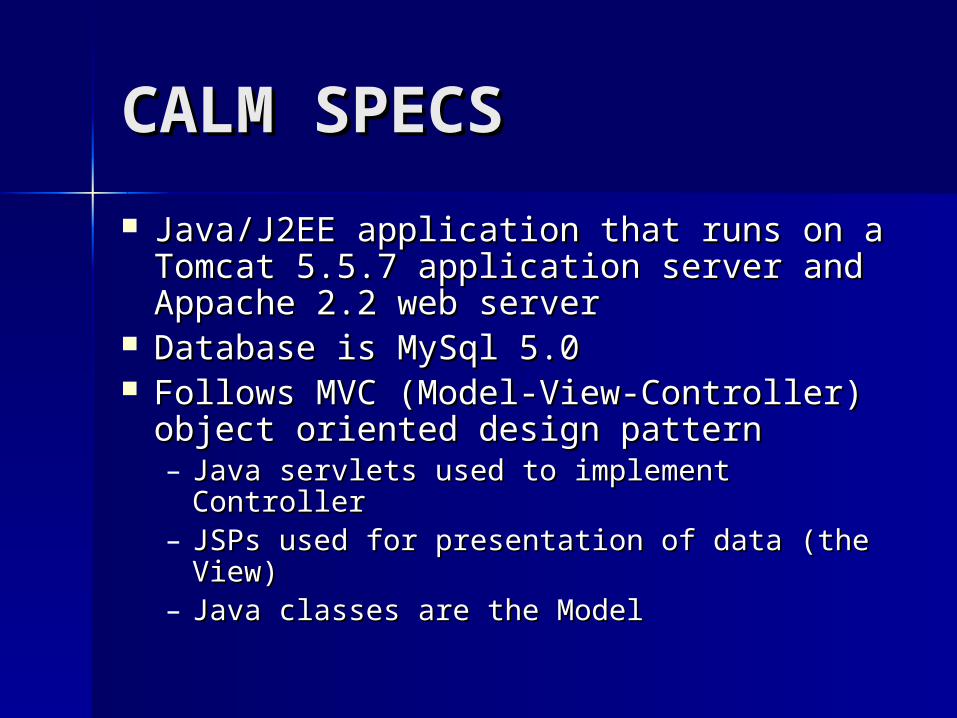
Java/J2EE application that runs on a Java/J2EE application that runs on a Tomcat 5.5.7 application server and Tomcat 5.5.7 application server and Appache 2.2 web serverAppache 2.2 web server
Database is MySql 5.0Database is MySql 5.0 Follows MVC (Model-View-Controller) Follows MVC (Model-View-Controller)
object oriented design patternobject oriented design pattern– Java servlets used to implement ControllerJava servlets used to implement Controller– JSPs used for presentation of data (the JSPs used for presentation of data (the
View)View)– Java classes are the ModelJava classes are the Model
CALMCALM
Can be used as:Can be used as:1.1. authoring of BIsauthoring of BIs
2.2. presentation of BIspresentation of BIs
3.3. Reporting/statistical tool (all data can be Reporting/statistical tool (all data can be exported into Excel, CSV or HTML format)exported into Excel, CSV or HTML format)
Provides application level security, Provides application level security, where Administrators (aka super-where Administrators (aka super-users) can manage access privileges users) can manage access privileges of other usersof other users

Future enhancements:Future enhancements:
Question Library.Question Library. Allow multimedia to be inserted Allow multimedia to be inserted
into Brief Intervention text.into Brief Intervention text. HTML toolbox to allow nicer HTML toolbox to allow nicer
formatting of text questions.formatting of text questions.

CALMCALM
NIAAANIAAA VACSVACS University of KentuckyUniversity of Kentucky Baltimore VABaltimore VA Pittsburgh VAPittsburgh VA
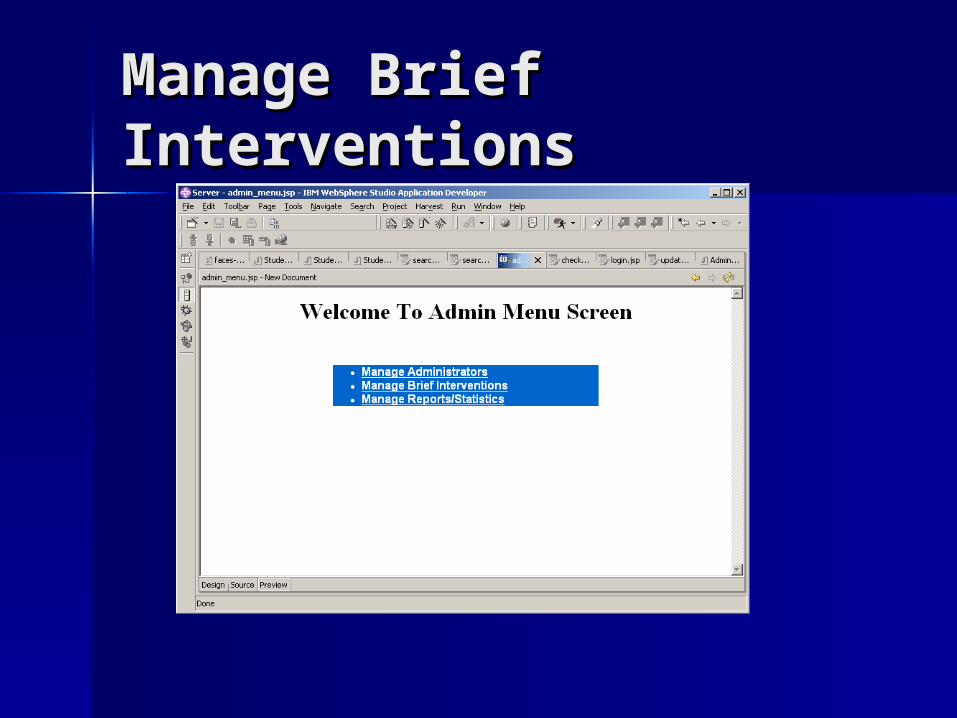
Manage Brief Manage Brief InterventionsInterventions
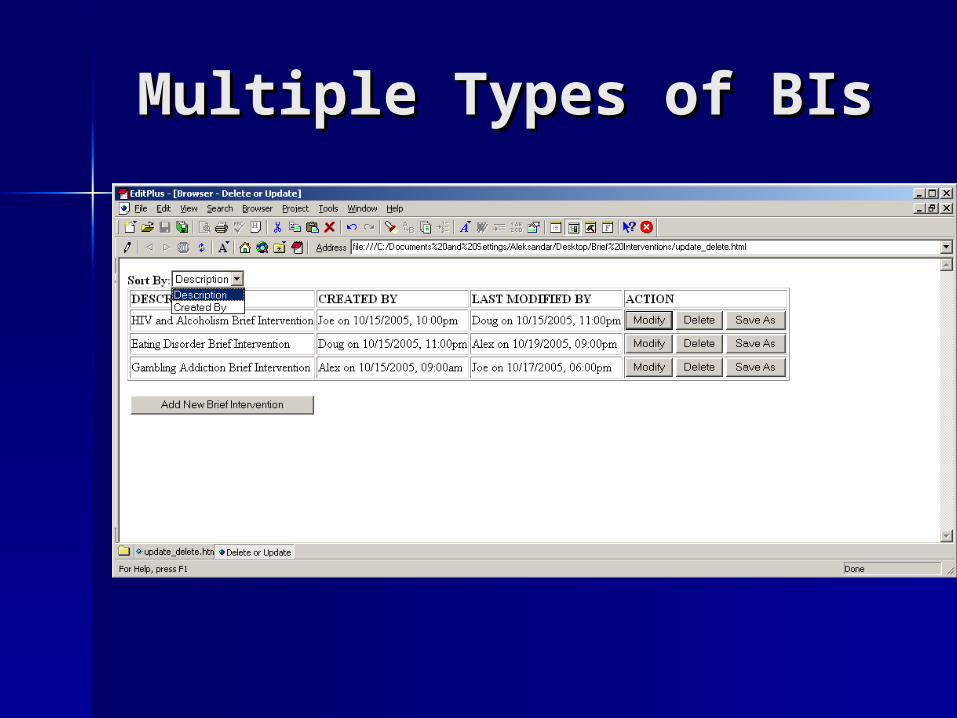
Multiple Types of BIsMultiple Types of BIs
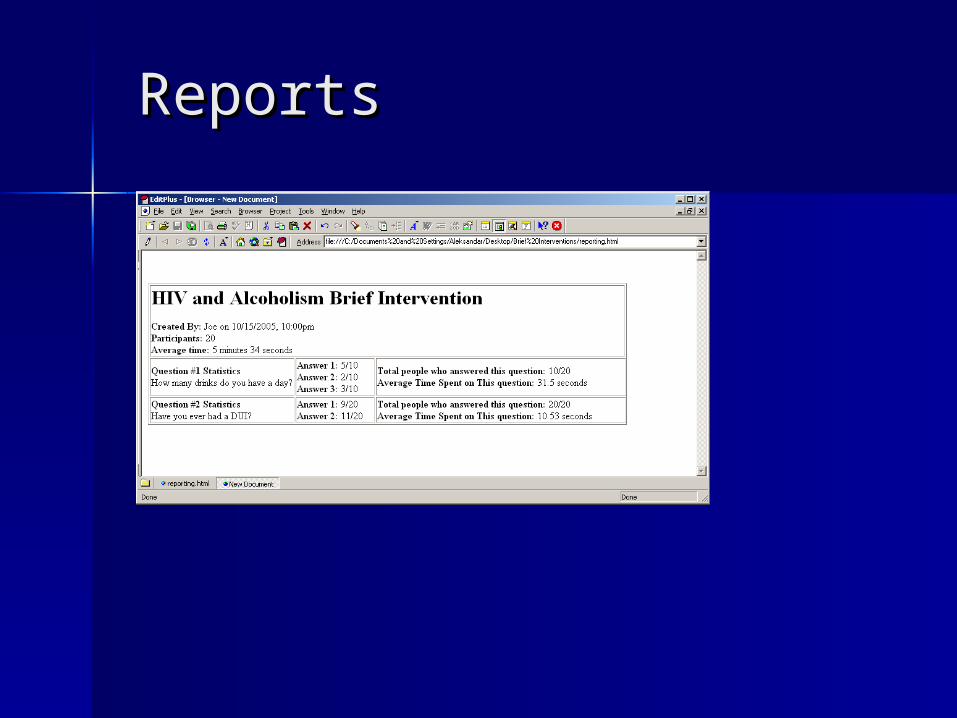
ReportsReports