Embed Size (px)
Citation preview

Trading Favorites is used with permission from Project Food, Land & People. For
more information about the project or to obtain a complete copy of the Resources for
Learning please visit www.foodlandpeople.org.
1© 2008 Project Food, Land & People
MATERIALSWriting materials, string, table-size world maps, and photocopies of the attached Trading Favorites Cards, Trading Favorites Tasks and Trading Partners Chartsheets; Internet access to America’s Heartland Episodes. Optional: globe, wall-size world map, small world maps or an atlas.
VOCABULARYabsolute advantage, comparative advantage, competitive advantage, ecological, equator, export, Foreign Agricultural Service (FAS), import, latitude, longitude, prime meridian, trade
RELATED LESSONSGlobal Grocery BagsFeed the NeedIn Harmony
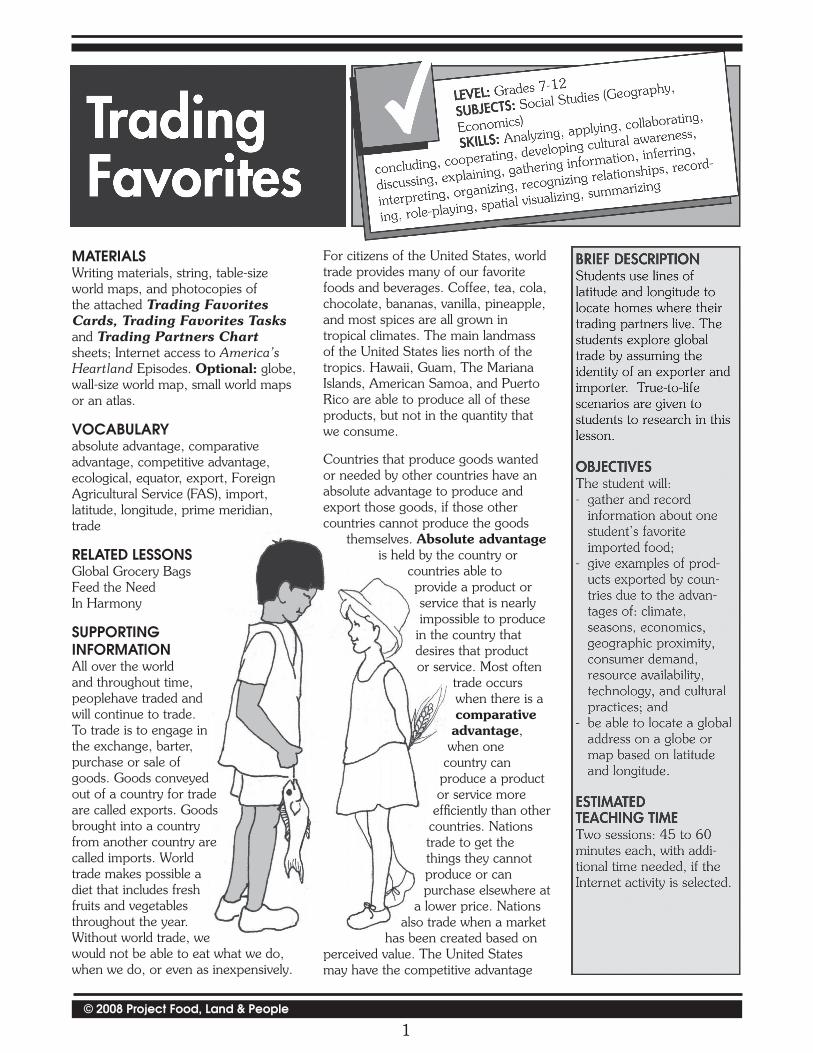
SUPPORTINGINFORMATIONAll over the world and throughout time, peoplehave traded and will continue to trade. To trade is to engage in the exchange, barter, purchase or sale of goods. Goods conveyed out of a country for trade are called exports. Goods brought into a country from another country are called imports. World trade makes possible a diet that includes fresh fruits and vegetables throughout the year. Without world trade, we would not be able to eat what we do, when we do, or even as inexpensively.
For citizens of the United States, world trade provides many of our favorite foods and beverages. Coffee, tea, cola, chocolate, bananas, vanilla, pineapple, and most spices are all grown in tropical climates. The main landmass of the United States lies north of the tropics. Hawaii, Guam, The Mariana Islands, American Samoa, and Puerto Rico are able to produce all of these products, but not in the quantity that we consume.
Countries that produce goods wanted or needed by other countries have an absolute advantage to produce and export those goods, if those other countries cannot produce the goods
themselves. Absolute advantage is held by the country or
countries able to provide a product or service that is nearly impossible to produce in the country that desires that product or service. Most often
trade occurs when there is a comparative advantage, when one country can produce a product or service more effi ciently than other countries. Nations trade to get the things they cannot produce or can purchase elsewhere at
a lower price. Nations also trade when a market
has been created based on perceived value. The United States may have the competitive advantage
2© 2008 Project Food, Land & People
in selling blue jeans because those blue jeans come from the United States. A perceived advantage can be created even though real differences may be difficult, if not impossible to detect, giving a business or country the competitive advantage.
Factors That Influence TradeThere are many factors that influence why people and nations trade.
Climate and seasons offer trade advantages. As the characteristic weather of an area over time, climate is usually described by temperature and rainfall. (The term rainfall indicates all forms of precipitation.) Temperature and rainfall depend on latitude and altitude, which determine if a region is usually hot or cold, dry or wet, and whether it has strongly marked seasonal changes.
Near the equator, for example, the warm and relatively constant climate and frequent rainfall of the humid tropics is perfect for growing tea, cacao (cocoa), coffee, bananas, rubber, many spices, and silk. The mainland United States and other temperate-climate countries cannot produce these tropical products commercially. (With the technology available, we can produce these products, but at great expense.) Tropical countries have a trade advantage because they have all the right conditions and natural resources for growing large quantities of these crops economically.
Countries in the Southern Hemisphere experience seasons just the opposite of countries in the Northern Hemisphere. (See the FLP lesson “Seasons Through the Year.”) Seasonal items such as fresh and processed fruits and vegetables are imported from other countries where they grow during “off season” periods. For example, if people living in the Northern Hemisphere want kiwi and strawberries for breakfast in the winter and spring, that fruit will probably come from the Southern Hemisphere where the summer and fall growing season occurs from December through June.
There are economic reasons for trade. Political boundaries between and within countries tend to separate markets, which leads to price differences and creates an incentive to trade. Trading to get food and other goods at a cheaper price than you can produce it makes economic sense. Those countries able to produce goods at the least cost have a comparative advantage over other countries. Imports provide people
with a wider variety of lower priced goods than would be available by relying solely on the domestic or at home market. The economic benefits of trade are so great that both growers and food processors are concentrating on exporting more than ever. The reverse also is true. Imports are competing more than ever with goods domestically produced. Whether the domestic goods are produced at a comparative advantage or whether the advantage is artificially enhanced by governmental policies such as import tax is of great issue in world trade.
Geographic proximity also influences trade. Trading with countries in close proximity
reduces transportation costs. This is not an issue, if the consumers of the importing company are willing to pay transportation costs. When fresh strawberries, raspberries or kiwis are flown to the United States in mid-winter, those that can afford to purchase them and desire to do so, do not hesitate to pay twice as much as they would for that same fruit in season. A large portion of the added cost off-season, is due to transportation.
Consumer demands are always changing and that influences
trade. Demand is sometimes so great for a product that a country already producing it may also have to import more of the product to get adequate quantities. As people travel and learn more of the world, their lifestyle and food habits can change with new knowledge. Many Americans have added kiwi, jicama, star fruit, seaweed, tofu, varieties of salsa, and other “new” foods to their diets. Some Russians prize American hamburgers for which people stand in line to dine at a popular American-style, fast-food restaurant in Moscow.
Unique cultural practices and consumption preferences influence trade. European countries import a lot of organ meats such as kidney, heart, brain, liver, and testicles because they are preferred in the diet. There is a huge demand in China and other parts of Asia for chicken feet, a popular fast food that is even served in Chinese movie theaters. The trade export of chicken feet shows how a low-value product in the United States can be supplied as a high-demand product to Asia and China due to cultural preference. Sales of chicken feet or paws from the United States to China currently have an annual market value of about $167.5 million and account for about 50 percent of total boiler meat cuts exported to China. The United States is China’s largest supplier. About 650 million pounds of chicken paws are sold each year.
3© 2008 Project Food, Land & People
As the nation’s leader in poultry production, Georgia is responsible for about 20 percent of the nation’s chicken paws. The Peach State benefits from this foreign demand for chicken paws through increased production, more jobs, and more trade dollars. Poultry producers in rural Georgia have the opportunity to expand their supply as the Asian market expands. The Georgia poultry business also takes advantage of the Port of Savannah to export large quantities of its chicken paws to China. Major chicken processing businesses have located near the port.
Because many conditions can impact the size and quality of the chicken foot, scientists and poultry specialists at the University of Georgia and Auburn University have studied how to protect the quality of the chicken paw from diseases such as dermatitis. Dermatitis in humans can make skin itch and burn. When it hits chickens, it drastically reduces farmers’ profits and cuts the supply of the Asian delicacy. Quality matters. Chinese and other people in Asia pay more per pound for chicken feet than people in America pay per pound for chicken breasts. The chicken paw has risen to the third-most popular part of the chicken below the breast and wing.
Resource availability influences trade. Countries export products for which they have the resources to produce goods and services more efficiently than countries that lack these same resources. Resources include productive soils, adequate water supplies, trained workforce, and the infrastructure (equipment, machinery, factories, plants, efficient transportation system) for producing, processing, distributing and storing goods. The United States and Brazil have the grazing lands necessary for raising beef cattle. Japan has the well-trained people necessary to produce high quality electronics. The United States has 25 percent of the world’s best land for crops and the climate suitable to produce vast quantity of grains; corn, wheat and soybeans; and other crops such as cotton, tobacco and almonds. Because of its comparative advantage, the United States brings more to the world’s food table. U.S. exports include 39 percent of the corn, 38 percent of the soybeans, 22 percent of the beef and veal, 21 percent of the cotton, 19 percent of the milk, and 9 percent of the wheat and eggs available on the world market.
Compared to the general economy, U.S. agriculture is twice as reliant on overseas markets. American farming outputs exceed the domestic demand. Bulk commodities have long depended on overseas markets. Feeding others abroad keeps U.S. agriculture growing at home. Nearly half of our wheat and rice crops are
exported; about one-third of soybean, tobacco and cotton production is shipped overseas; and 20 percent of the corn crop is exported. High-value products, including fruits, vegetables and animal products, are increasingly dependent on overseas markets as well, and many are approaching or have already reached the same level of export dependency. One-third or more of fresh table grapes, dried plums, raisins, canned sweet corn, walnuts and animal fats is exported. The export dependency of the almond industry is even higher, with 67 percent of the crop shipped overseas.
Research and technology play an important role in world trade. Fragile products like strawberries
and fresh flowers can be flown to trading partners. Refrigerated ships, rail cars or trucks can ship unripened bananas or fresh oranges to their final destination in good condition. The technology of controlled storage for apples and pears has improved the amount, availability, and quality of the fruit people can enjoy. Scientists at Clemson University in South Carolina developed durable packaging to protect fresh produce
during shipment. They also developed a controlled atmosphere storage system to boost exports of watermelon, peaches, tomatoes, and other highly perishable items. Even old-fashioned technology can have significant impacts upon global trade. Researchers in Kansas developed a portable mill to grind wheat into flour.
The mill is easily set up in remote, rural areas in developing countries. They also developed wheat
varieties that meet milling, protein, and baking qualities desired in both domestic and foreign markets. Idaho researchers developed a wheat variety that can be used to make Asian noodles creamcolored rather than white.
Severe natural and ecological events influence trade. When unusual freezing temperatures, hail, drought, floods, hurricanes, volcanic eruptions, fires, pollution, soil erosion, pest infestations, etc. disrupt a large growing area, significant production may be decreased or totally lost altogether. Countries must then trade (import) the products from some place that has had a successful harvest.
U.S. Trade PartnersThe United States is both a major exporter and importer in agricultural products. In 2007, the United States exported agricultural products valued at more than $89.8 billion and imported more than $71.4 billion of products, according to the FAS. With more exports than imports, the positive balance of agricultural trade for 2007 was $18.4 billion, the highest such positive balance since 2001 and significantly higher than the five-year average of $8.0 billion since 2002.
4© 2008 Project Food, Land & People
The top ten trading partners with the United States – exports and imports combined – are (in order) Canada, Mexico, The People’s Republic of China (Mainland China), Japan, the Republic of Korea (South Korea), Italy, Netherlands, Indonesia, Taiwan, and Australia. These 10 countries represented 59 percent of all U.S. trade activity in total dollar value for 2007. The largest agricultural trade imbalance is with Japan. Japan receives the third largest total of U.S. exports, with agricultural products valued at more than 23 times that of what the United States imports from it. Of interest, in 2007, Japan ranked 30th among U.S. importers and it has the 44th largest amount of arable and permanent cropland. By contrast, the largest import trade imbalance is with Italy. Ranking third among countries importing to the United States, Italy receives about 4.5 times less than it sends to the United States. Italy is 23rd on the list of U.S. trade exports.
The top ten export partners of the United States account for 64.1 percent of all exports. As our top export partner, Canada accounts for 15.6 percent of all trade, with the top four partners, also including Mexico, Japan and China, accounting for half of all trade. Annual trends show that the United States imports a greater dollar value of goods from Canada than it exports, but it exports more to Mexico than it imports. Both are fairly balanced in total exports and imports.
2007 U.S. Agricultural Trade Exportswith Top Ten Partners
Export Rank Country Dollar Amount
1 Canada $14.06 billion2 Mexico $12.69 billion3 Japan $10.12 billion4 China $ 8.31 billion5 Korea $ 3.53 billion6 Taiwan $ 3.09 billion7 Indonesia $ 1.54 billion 8 Turkey $ 1.50 billion 9 Netherlands $ 1.48 billion10 United Kingdom $ 1.32 billionAll Others (Rest of World) $32.29 billion
The United States leads the world in agricultural exports. About 17 percent of raw U.S. agriculture products are exported yearly,
with one-fourth of the world’s beef and nearly one-fifth of the world’s grain, milk and eggs produced in the United States. Furthermore, one in three U.S. farm acres is planted for export, and 25 percent of gross farm income comes directly from exports, according to the American Farm Bureau. U.S. cropland accounts for almost one-eighth of the world’s total arable and permanent cropland.
For many reasons, the United States has the comparative advantage to produce the products it exports. It sells to more than 185 countries each year. The products exported by the United States include bulk commodities such as soybean, wheat, corn, red meats and value-added consumer goods.
Such value-added goods include brand name frozen foods, cereals, snack foods,
and vegetable oils.
2007 U.S. Agricultural Trade Importswith Top Ten Partners
Import Rank Country Dollar Amount
1 Canada $15.24 billion2 Mexico $10.17 billion3 Italy $ 3.06 billion4 China $ 2.92 billion5 Brazil $ 2.64 billion6 Australia $ 2.63 billion7 Ireland $ 2.28 billion8 Netherlands $ 2.26 billion9 France $ 2.20 billion10 Indonesia $ 2.08 billionAll Others (Rest of World) $26.44 billion
The top ten import partners of the United States account for 63.2 percent of all imports. Imports coming from Canada and Mexico account for more than 35 percent of all imports. The United States imports goods from more than 170 countries each year. The United States imports lumber, wine, beer, shrimp, natural rubbers, snack goods, sugar, coffee, fruits, processed fruits and vegetables, red meats, live animals, tropical oils, rice, ornamental plants and many other products.
5© 2008 Project Food, Land & People
A Historic Trade Shift: Economics in ActionSince 1980, the United States has experienced a shift in where its exports go. The shift is away from traditional European markets and toward Eastern Asia and Mexico. Several reasons lie behind this development, underscoring the importance of economic reasons why countries trade. The fast-growing economies in Eastern Asia and Mexico have resulted in expanded markets for U.S. products and for goods from throughout the world. The previous two charts make it clear that Mexico is a major trading partner of the United States. The progress toward trade liberalization in many countries, best exemplified by implementation of the North American Free Trade Agreement (NAFTA) in 1994, has reduced trade barriers (taxes, regulations, and others) that interfere with the U.S. import-export trade. Even though this shift is occurring, Canada still remains our major trading partner. A reduction in trade barriers (taxes, fees, regulations, varying restrictions, and others) has expanded the amount and types of agricultural products that are both exported and imported. The lifting of trade barriers has been most exemplified by the North American Free Trade Agreement ) NAFTA) in 1994. Years later, Canada remains our leading trade partner and has replaced Japan as the largest importer of our agricultural products.
(FAS), an agency of the U.S. Department of Agriculture (USDA), represents the diverse interests of U.S. farmers and fosters international trade for American food and agricultural businesses.
Formed in 1953, FAS operates worldwide with personnel located in 102 offices in 82 countries around the world. FAS staff also monitor and report on the agricultural trade matters of an additional 71 countries. Its overseas staff is supported by many analysts, negotiators, and marketing specialists located in Washington, D.C. FAS influences the imports of about 85 percent of all cheese and most other dairy products coming into the United States. FAS also administers the tariff rate quota for sugar and sugar syrups, as well as several programs that permit domestic refineries to use foreign sugar without disrupting U.S. sugar production. FAS also helps U.S. AID programs overseas in their efforts to stimulate economic growth in developing countries through agricultural assistance coupled with good environmental approaches. A goal has been set by the FAS to help American farmers increase U.S. agricultural exports. Refer to the FAS Web site at http://www.fas.usda.gov/ to obtain current information about markets, products, trends, and commodity statistics related to U.S. trade and the world.
GETTING STARTEDGather writing materials, string, and table-size world maps. You need one table-size world map for every four to six students. Photocopy the Trading Favorites Tasks sheet. Make a photocopy and cut apart the Trading Favorites Cards sheets so you have one card per student for up to 36 students. The cards are organized by pairs. Use only the number of pairs that you need. If you have an odd number
of students, invite someone to participate in this lesson (student from another classroom, office staff, volunteer parent). Make photocopies of Trading Partners Chart sheet, one copy per student. You need to determine the latitude and longitude of your town or city for Procedure, Step 1. Optional: globe, wall-size world map.
PROCEDURE
1. Introduce this lesson by showing America’s Heartland episode #210, segment To the Sea in Ships at http://www.americasheartland.org/episodes/episode_210/index.htm, episode #213 segment Going with the Grain at
http://www.americasheartland.org/episodes/episode_213/index.htm to depict how U.S. grains travel down the Mississippi for export to other countries and episode #312, segment Crops and Cars at http://www.americasheartland.org/episodes/episode_312/index.htm to explain how commodities travel in both directions to and from the United States and its trading partners.
Mexico also remains a major trading partner and may become the largest importer of U.S. products. Trade data indicate that before NAFTA in 1993, the United States exported 21 percent of its agricultural products to Canada and Mexico; in 2007 that total increased to 29.7 percent. Before NAFTA, U.S imports from Canada and Mexico accounted for 29.4 percent of all products, in 2007 that total increased to 35 percent. Before NAFTA, U.S. exports exceeded Canada and Mexico imports by 21 percent; in 2007 exports exceeded imports by 5.3 percent. Another example of the impact of economics on trade, the nation’s exports were increasing at a record pace in 2008 because other countries could afford to buy more U.S. agricultural products because of the shrinking value of the U.S. dollar in foreign markets.
Linking Trade: The Foreign Agricultural ServiceU.S. farm exports generate employment,income, and purchasing power in both the farm and nonfarm sectors in our country. The Foreign Agricultural Service
6© 2008 Project Food, Land & People
2. Introduce this lesson by reviewing latitude and longitude. Remind students that every place on Earth has a location fixed by geographers or a global address that is identified at the intersection of a line of latitude by a line of longitude. Maps and globes have imaginary lines that form a grid pattern. Thus, every place can be located by two numbers of degrees (°) and two directions (north or south and east or west). Latitude lines measure distance from 0° to 90° north and south of the equator. Longitude lines measure distance from 0° to 180° east and west of a “prime meridian” that passes through Greenwich, England.
Divide the class into groups of four to six. Give each group a table-size world map. Ask them to give you the latitude and longitude for each of the following locations.
- Monterey, Nuevo Leon, Mexico (25.4°N, 100.2°W)
- Albany, Western Australia (35°S, 117.5°E)
- Nairobi, Kenya, Southern Africa (1.4°S, 37.1°E)
- Your town or city
3. Explain to students that they are going to learn about imports, exports, and the many reasons for trading among countries. Tell students they will each select a card with the name, location, and favorite food of a student from the United States or another country. The card also will identify that student’s favorite food(s) and food(s) exported from his/her city, state, and/or country.
4. Display the transparency Trading Favorites Tasks and review each of the tasks with the students. Each student becomes both an exporter and importer from a specific city, state and/or country. They use the global address (latitude and longitude) on their Trading Favorites Card to locate their “home.” They then need to find the person that exports their favorite food(s). That person becomes their trading partner or the person with whom they will import and export goods.
5. Have each student select one of the Trading Favorites Cards. They read their card and begin completing the tasks. Assist students as necessary. Use the Trading Partners Answers sheet to assist those students who are having difficulty using latitude and longitude to locate their city, state and/or country.
6. Once students have found their trading partner, distribute the Trading Partners Chart, one copy per student. Tell students to complete their chart. If they are having difficulty writing their summary sentences, share the following example: “I am Sally from Denver, Colorado, 40°N, 105°W. I import coffee from Jose in Ecuador throughout the year because they have the right climate to grow it. I export apples to Jose because it is too hot for apples to grow there.”
7. When students have completed their Trading Partners Chart, have them use string to connect the homes of each pair of trading partners. If you do not have one large wall-size world map, use the table-size world maps from Step 1. Once all trading partners have located their homes on the world map, have them share their summary sentences with the rest of the class.
Optional: Use the classroom to create a world map. Place the equator along the longest part of the room to represent the east-west line of longitude. The prime meridian is the center of the width of the room, perpendicular to the equator, and represents the north-south lines of latitude. You may want to use string to show the equator and prime meridian and place direction cards (N, S, E, W). Have students use their global address to physically locate themselves on this classroom-size world map, using string to connect trading partners.
8. Summarize the lesson by asking the following questions:
- Which trades occur because of climate advantages? (chili peppers, blueberries, apples, bananas, orange juice, cocoa, almonds, cantaloupe, coffee, sugarcane, tea, cola, kiwi)
- Which trades occur on a seasonal basis? (fresh fruits and vegetables)
- Which trades occur because of resource advantages? (all)
- Which trades occur for economic reasons? (all)
- Which trades occur to meet consumer demand throughout the year? (all)
7© 2008 Project Food, Land & People
- Which product was exported from one country where there is little or no demand? (chicken feet)
- Which products have a trading advantage due to technology? (all)
- What patterns, if any, did you observe between the amount of arable land available and the foods exported/imported? (Countries with abundant land are able to export cattle products and raw and processed grains, fruits, and vegetables. Countries with minimal land for raising food must import more food.) Between climate and exports? (Countries export foods unique to their climate.) Between latitude and exports? Between longitude and exports? (Have students use their maps to respond to the latitude and longitude questions.) What other connections can you make?
- Why are environmentally sound approaches important to export trade? (They maintain the country’s ability to continue producing its food products.)
- Which of the traded foods could be affected by natural or ecological disasters? (all) Ask for anecdotes of disasters affecting food through which students may have lived or about which they may have heard.
- Why does the United States export foods to so many places? (Accept all reasonable responses.)
- How many of the imported foods have you eaten? Which ones are available locally at some time during the year? Which ones are never grown or produced locally?
- What are your “real” favorite foods (raw and/or processed)? Which ones are imported at some time during the year?
- Could you eat the way you do without trade? Why or why not?
EVALUATION OPTIONS1. Have teams of students list the many reasons
why countries might trade. (absolute advantage, comparative advantage, competitive advantage, whim, fads, cultural reasons, etc.)
2. Ask students to identify their favorite imported food and the possible reasons why the food is imported.
3. Provide a short story about their favorite food. Have students make a Trading Favorites Chart to identify the who, what, when, where, and why for their food. The foods can be a raw product or a fi nished product that combines ingredients from many countries.
4. Work with the world map and challenge students to identify the location of several
global addresses (latitude, longitude). Give 1 point for locating the continent, 2 points for the country, 3 points for the state or province, and 4 points for the city. Students may be timed to increase interest.
EXTENSIONS AND VARIATIONS1. Conduct research to learn which of the products listed in this lesson
are available from local, regional, and national sources at some time during the year. Which ones are never produced locally? Why? From what other countries do we import some of these foods?
2. Challenge students to investigate the technologies and
infrastructures, which facilitate trade of these and other commodities, and to determine where their favorite foods are being imported from today and throughout the year. They can begin by checking Web sites by specifi c commodities and by countries (many have agriculture and trade sites). The Foreign Agricultural Service has several helpful sites. Start with its primary Web site at http://www.fas.usda.gov/ to learn about trade markets, commodities, trends, agreements, and agricultural products in the global market. Also, see http://www.usda.gov/wps/portal/!ut/p/_s.7_0_A/7_0_1OB?contentidonly=true&contentid=FAS_Agency_Splash.xml for an overview of the FAS and its offi ces, programs and services and see http://www.fas.usda.gov/ustrade/ to research United States international trade statistics on agricultural, fi sh, forest and textile products. Also, use Google.com or Dogpile.com to search for multiple topics related to the research.
3. If your school or students have Internet access, have them search the World Wide Web for information about their country and commodity. The Foreign Agricultural Service (FAS) of the USDA has several helpful sites. Start with its Web site address http://www.fas.usda.gov/ on the Internet. Use the listings included in the Additional Resources section or use Google.com or Dogpile.com to search for multiple topics related to research.
8© 2008 Project Food, Land & People
4. Have students complete the Trading Partners Chart during interviews with local grocers. Learn which foods are always, sometimes or never imported to your area and under what circumstances. What factors influence the foods which are imported? Learn how prices on fresh fruits and vegetables vary throughout the year. What other factors do parents and other food shoppers consider when purchasing imported foods? What relationships appear to exist among cost, country of origin, weather, season, consumer demand, cultural and religious preferences, and other trade factors? Prepare summaries of the interviews and discuss the findings.
5. Have students explore what major exports are produced in their state in addition to commodities (e.g., farm equipment in Iowa).
6. Have students research the histories of:
A. Trade by civilizations, e.g. Roman, Mayan, Chinese, or by time periods, e.g. Renaissance, American Colonial period, etc. What effect did waterways, continental boundaries, and political boundaries have?
B. Map making and the challenge of representing the spherical Earth in two dimensions and materials used (e.g., cloth, parchment).
7. Help students determine approximate distances between producers and consumers using the circumference of the Earth (about 25,000 miles) and at a 90 degree longitude difference at the equator (more than 6,000 miles). Computer software programs are available that calculate point-to-point mileage.
8. Choose a country and research its top 10 imports and exports and what the trade relationship is with the United States.
CREDITSAmerica’s Heartland episode #210, segment To the Sea in Ships, episode #213 segment Going with the Grain and episode #312 segment Crops and Cars. KVIE, Inc., 2006. http://www.americasheartland.org
Arable and permanent cropland by country. 2000. World Resources Institute. Nationmaster.Com http://www.nationmaster.com/graph/agr_ara_and_per_cro-agriculture-arable-and-permanent-cropland
Competing in a Healthy Global Economy: Healthy, Marketable Chicken Feet, The University of Georgia. 2008. http://www.uga.edu/aboutUGA/compete-chicken_feet.html
Fast Facts. The Voice of Agriculture, America Farm Bureau, 2008. http://www.fb.org/index.php?fuseaction=newsroom.fastfacts
Foreign Agricultural Trade of the United States. Foreign Agricultural Service, United States Department of Agriculture. 2008. http://www.ers.usda.gov/data/FATUS/
Foreign Agricultural Export Aggregations, U.S. Trade Statistics. Economic Research Service, United States Department of Agriculture, 2008. http://www.fas.usda.gov/ustrade/
Foreign Agricultural Import Aggregations, U.S. Trade Statistics. Economic Research Service, United States Department of Agriculture, 2008. http://www.fas.usda.gov/ustrade/
Litter Moisture and Footpad Dermatitis as Affected by Diets Formulated on an All-Vegetable Basis or Having the Inclusion of Poultry By-Product. The Journal of Applied Poultry Research. 2007. G. Eichner, S. L. Vieira, et. al. Department of Poultry Science, Auburn University, Auburn, AL http://japr.fass.org/cgi/content/abstract/16/3/344
ADDITIONAL RESOURCESCIA World Factbook, Central Intelligence Agency, United States Government, 2008. https://www.cia.gov/library/publications/the-world-factbook/
Economic Research Service, United States Department of Agriculture, 2008. http://www.ers.usda.gov
The Europa World Yearbook 2008. 49th Edition. Routledge, Taylor and Frances Group, June 24, 2008.
Foreign Agricultural Service, United States Department of Agriculture, 1400 Independence Avenue, S.W., Washington, DC 20250 or http://www.fas.usda.gov/ustrade/
State Exports, United States Department of Commerce, 2008. http://www.ita.doc.gov/td/industry/otea/state/index.html
General Web site address to reach foreign embassies in the United States is http://embassy.org/embassies/index.html
9
© 2008 Project Food, Land & People Conceptual Framework Reference: I.B.2., I.B.4., I.C.3., II.C.7., IV.A.1., IV.A.2., IV.A.3., IV.A.4., IV.B.2.a., IV.B.2.b., IV.A.2., IV.B.3.a., IV.B.3.b., IV.C.2., IV.E.5
WEB SITESCIA World Factbook, Central Intelligence Agency, United States Government, 2008. https://www.cia.gov/library/publications/the-world-factbook/ (accessed October 2008)
Economic Research Service, United States Department of Agriculture. http://www.ers.usda.gov/data/FATUS/ (accessed October 2008)
Foreign Agricultural Service, United States Department of Agriculture. 2008. http://www.fas.usda.gov/ustrade/ (accessed October 2008)
Institute for Agriculture and Trade Policy, 2105 First Avenue South, Minneapolis MN 55404 http://www.iatp.org (accessed October 2008)
International Food & Agricultural Trade Policy Council, 1616 P Street, NW, Suite 100 Washington, DC 20036. http://www.agritrade.org/ (accessed October 2008)
State Exports, United States Department of Commerce, 2008. http://www.ita.doc.gov/td/industry/otea/state/index.html (accessed October 2008)
Voice of Agriculture, American Farm Bureau.http://www.fb.org/index.php?fuseaction=newsroom.fastfacts (accessed October 2008)
World Trade Organization, Geneva, Switzerland, 2008. http://www.wto.org (accessed October 2008)
EDUCATOR’S NOTES
10© 2008 Project Food, Land & People Trading Favorites
720 ©2003 Project Food, Land & People Trading Favorites
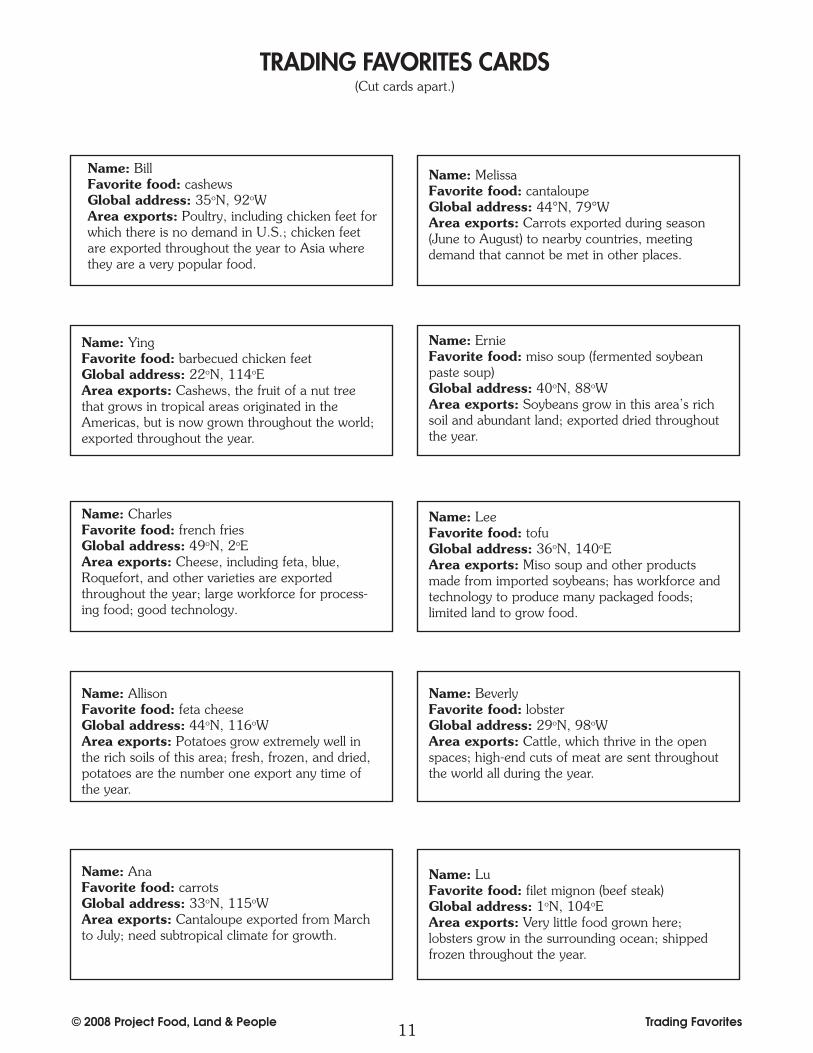
Name: BillFavorite food: cashewsGlobal address: 35oN, 92oWArea exports: Poultry, including chicken feet forwhich there is no demand in U.S.; chicken feetare exported throughout the year to Asia wherethey are a very popular food.
Name: YingFavorite food: barbecued chicken feetGlobal address: 22oN, 114oEArea exports: Cashews, the fruit of a nut treethat grows in tropical areas originated in theAmericas, but is now grown throughout the world;exported throughout the year.
Name: CharlesFavorite food: french friesGlobal address: 49oN, 2oEArea exports: Cheese, including feta, blue,Roquefort, and other varieties are exportedthroughout the year; large workforce for process-ing food; good technology.
Name: AllisonFavorite food: feta cheeseGlobal address: 44oN, 116oWArea exports: Potatoes grow extremely well inthe rich soils of this area; fresh, frozen, and dried,potatoes are the number one export any time ofthe year.
Name: AnaFavorite food: carrotsGlobal address: 33oN, 115oWArea exports: Cantaloupe exported from Marchto July; need subtropical climate for growth.
Name: MelissaFavorite food: cantaloupeGlobal address: 23oN, 122oWArea exports: Carrots exported during season(June to August) to nearby countries, meetingdemand that cannot be met in other places.
Name: ErnieFavorite food: miso soup (fermented soybeanpaste soup)Global address: 40oN, 88oWArea exports: Soybeans grow in this area’s richsoil and abundant land; exported dried throughoutthe year.
Name: LeeFavorite food: tofuGlobal address: 36oN, 140oEArea exports: Miso soup and other productsmade from imported soybeans; has workforce andtechnology to produce many packaged foods;limited land to grow food.
Name: BeverlyFavorite food: lobsterGlobal address: 29oN, 98oWArea exports: Cattle, which thrive in the openspaces; high-end cuts of meat are sent throughoutthe world all during the year.
Name: LuFavorite food: filet mignon (beef steak)Global address: 1oN, 104oEArea exports: Very little food grown here;lobsters grow in the surrounding ocean; shippedfrozen throughout the year.
TRADING FAVORITES CARDS(Cut cards apart.)
11© 2008 Project Food, Land & People Trading Favorites
44°N, 79°W
721 ©2003 Project Food, Land & People Trading Favorites
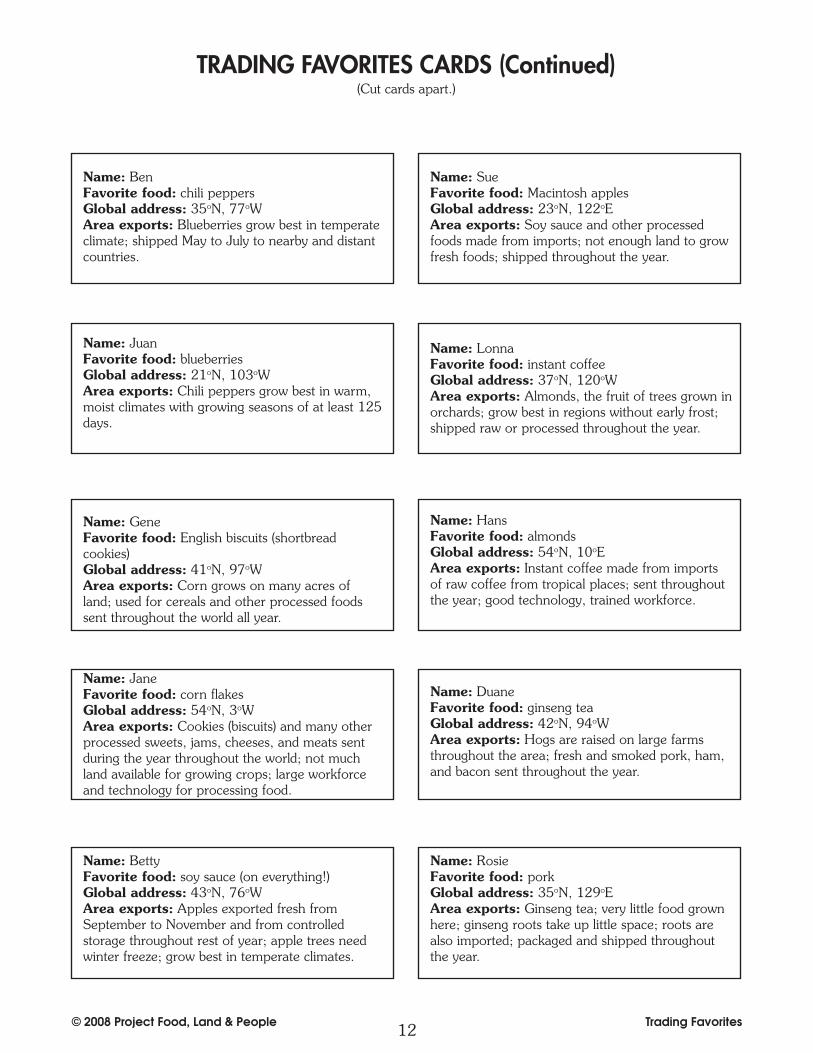
Name: BenFavorite food: chili peppersGlobal address: 35oN, 77oWArea exports: Blueberries grow best in temperateclimate; shipped May to July to nearby and distantcountries.
Name: JuanFavorite food: blueberriesGlobal address: 21oN, 103oWArea exports: Chili peppers grow best in warm,moist climates with growing seasons of at least 125days.
Name: GeneFavorite food: English biscuits (shortbreadcookies)Global address: 41oN, 97oWArea exports: Corn grows on many acres ofland; used for cereals and other processed foodssent throughout the world all year.
Name: JaneFavorite food: corn flakesGlobal address: 54oN, 3oWArea exports: Cookies (biscuits) and many otherprocessed sweets, jams, cheeses, and meats sentduring the year throughout the world; not muchland available for growing crops; large workforceand technology for processing food.
Name: BettyFavorite food: soy sauce (on everything!)Global address: 43oN, 76oWArea exports: Apples exported fresh fromSeptember to November and from controlledstorage throughout rest of year; apple trees needwinter freeze; grow best in temperate climates.
Name: SueFavorite food: Macintosh applesGlobal address: 23oN, 122oEArea exports: Soy sauce and other processedfoods made from imports; not enough land to growfresh foods; shipped throughout the year.
Name: LonnaFavorite food: instant coffeeGlobal address: 37oN, 120oWArea exports: Almonds, the fruit of trees grown inorchards; grow best in regions without early frost;shipped raw or processed throughout the year.
Name: HansFavorite food: almondsGlobal address: 54oN, 10oEArea exports: Instant coffee made from importsof raw coffee from tropical places; sent throughoutthe year; good technology, trained workforce.
Name: DuaneFavorite food: ginseng teaGlobal address: 42oN, 94oWArea exports: Hogs are raised on large farmsthroughout the area; fresh and smoked pork, ham,and bacon sent throughout the year.
Name: RosieFavorite food: porkGlobal address: 35oN, 129oEArea exports: Ginseng tea; very little food grownhere; ginseng roots take up little space; roots arealso imported; packaged and shipped throughoutthe year.
TRADING FAVORITES CARDS (Continued)(Cut cards apart.)
12© 2008 Project Food, Land & People Trading Favorites
722 ©2003 Project Food, Land & People Trading Favorites
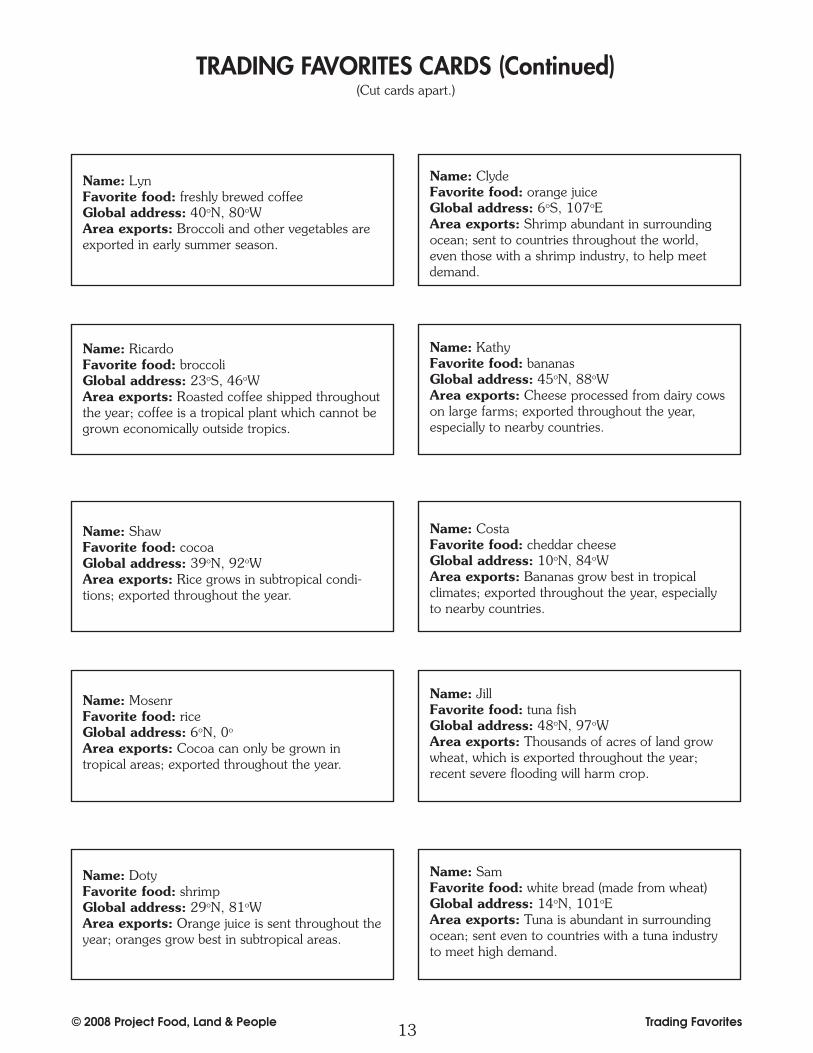
Name: LynFavorite food: freshly brewed coffeeGlobal address: 40oN, 80oWArea exports: Broccoli and other vegetables areexported in early summer season.
Name: RicardoFavorite food: broccoliGlobal address: 23oS, 46oWArea exports: Roasted coffee shipped throughoutthe year; coffee is a tropical plant which cannot begrown economically outside tropics.
Name: ShawFavorite food: cocoaGlobal address: 39oN, 92oWArea exports: Rice grows in subtropical condi-tions; exported throughout the year.
Name: MosenrFavorite food: riceGlobal address: 6oN, 0o
Area exports: Cocoa can only be grown intropical areas; exported throughout the year.
Name: DotyFavorite food: shrimpGlobal address: 29oN, 81oWArea exports: Orange juice is sent throughout theyear; oranges grow best in subtropical areas.
Name: KathyFavorite food: bananasGlobal address: 45oN, 88oWArea exports: Cheese processed from dairy cowson large farms; exported throughout the year,especially to nearby countries.
Name: CostaFavorite food: cheddar cheeseGlobal address: 10oN, 84oWArea exports: Bananas grow best in tropicalclimates; exported throughout the year, especiallyto nearby countries.
Name: ClydeFavorite food: orange juiceGlobal address: 6oS, 107oEArea exports: Shrimp abundant in surroundingocean; sent to countries throughout the world,even those with a shrimp industry, to help meetdemand.
Name: JillFavorite food: tuna fishGlobal address: 48oN, 97oWArea exports: Thousands of acres of land growwheat, which is exported throughout the year;recent severe flooding will harm crop.
Name: SamFavorite food: white bread (made from wheat)Global address: 14oN, 101oEArea exports: Tuna is abundant in surroundingocean; sent even to countries with a tuna industryto meet high demand.
TRADING FAVORITES CARDS (Continued)(Cut cards apart.)
13© 2008 Project Food, Land & People Trading Favorites
723 ©2003 Project Food, Land & People Trading Favorites
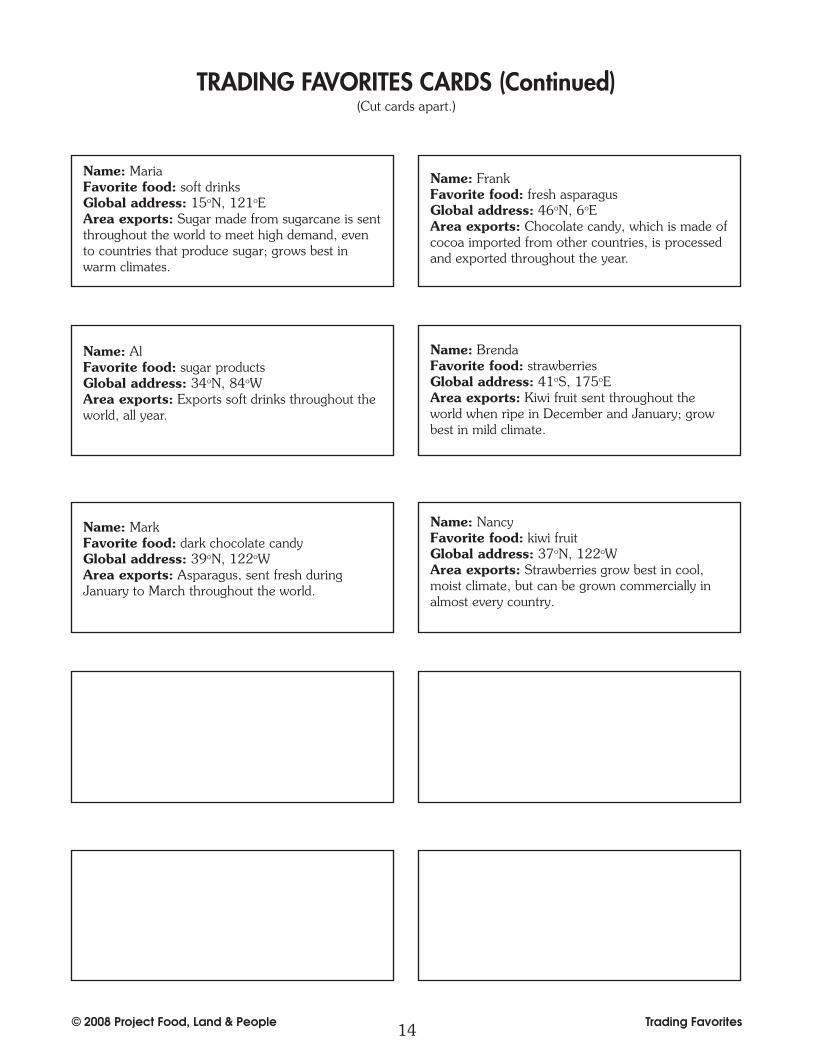
Name: MariaFavorite food: soft drinksGlobal address: 15oN, 121oEArea exports: Sugar made from sugarcane is sentthroughout the world to meet high demand, evento countries that produce sugar; grows best inwarm climates.
Name: AlFavorite food: sugar productsGlobal address: 34oN, 84oWArea exports: Exports soft drinks throughout theworld, all year.
Name: MarkFavorite food: dark chocolate candyGlobal address: 39oN, 122oWArea exports: Asparagus, sent fresh duringJanuary to March throughout the world.
Name: FrankFavorite food: fresh asparagusGlobal address: 46oN, 6oEArea exports: Chocolate candy, which is made ofcocoa imported from other countries, is processedand exported throughout the year.
Name: BrendaFavorite food: strawberriesGlobal address: 41oS, 175oEArea exports: Kiwi fruit sent throughout theworld when ripe in December and January; growbest in mild climate.
Name: NancyFavorite food: kiwi fruitGlobal address: 37oN, 122oWArea exports: Strawberries grow best in cool,moist climate, but can be grown commercially inalmost every country.
TRADING FAVORITES CARDS (Continued)(Cut cards apart.)
14© 2008 Project Food, Land & People Trading Favorites
724 ©2003 Project Food, Land & People Trading Favorites
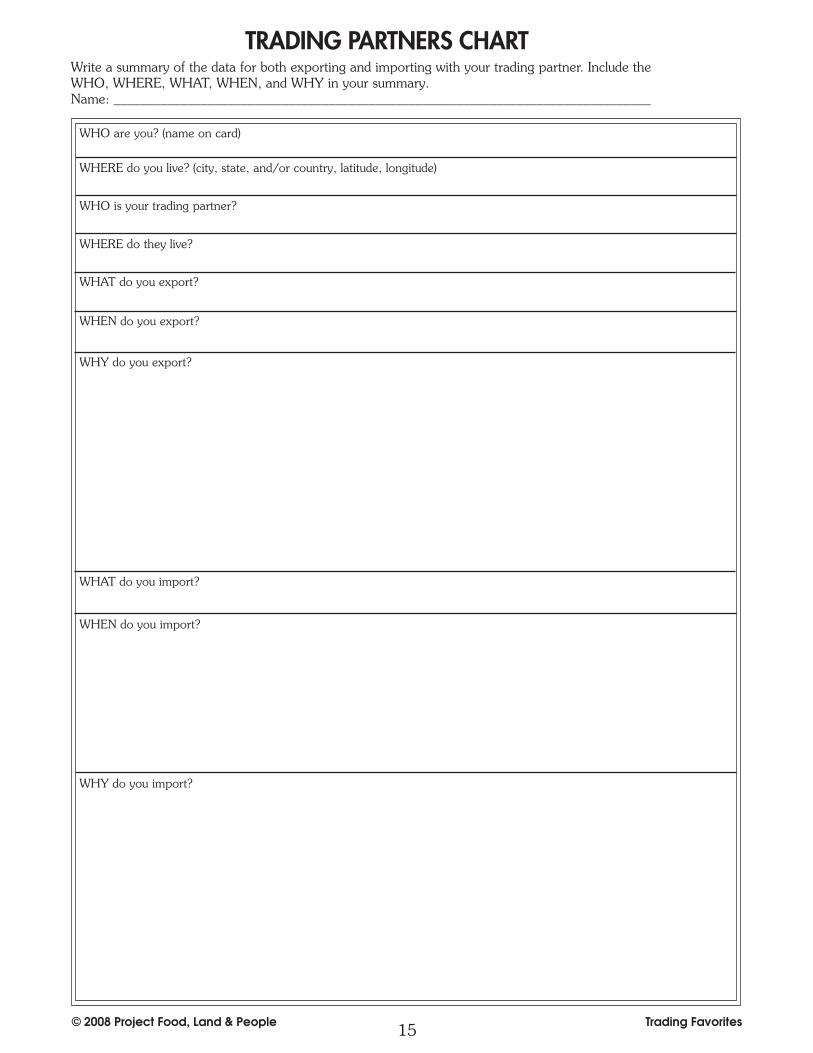
TRADING PARTNERS CHART
WHO are you? (name on card)
WHO is your trading partner?
WHAT do you export?
WHEN do you export?
WHERE do they live?
WHY do you export?
WHAT do you import?
WHEN do you import?
WHY do you import?
WHERE do you live? (city, state, and/or country, latitude, longitude)
Write a summary of the data for both exporting and importing with your trading partner. Include theWHO, WHERE, WHAT, WHEN, and WHY in your summary.Name: ________________________________________________________________________________
15© 2008 Project Food, Land & People Trading Favorites
725 ©2003 Project Food, Land & People Trading Favorites
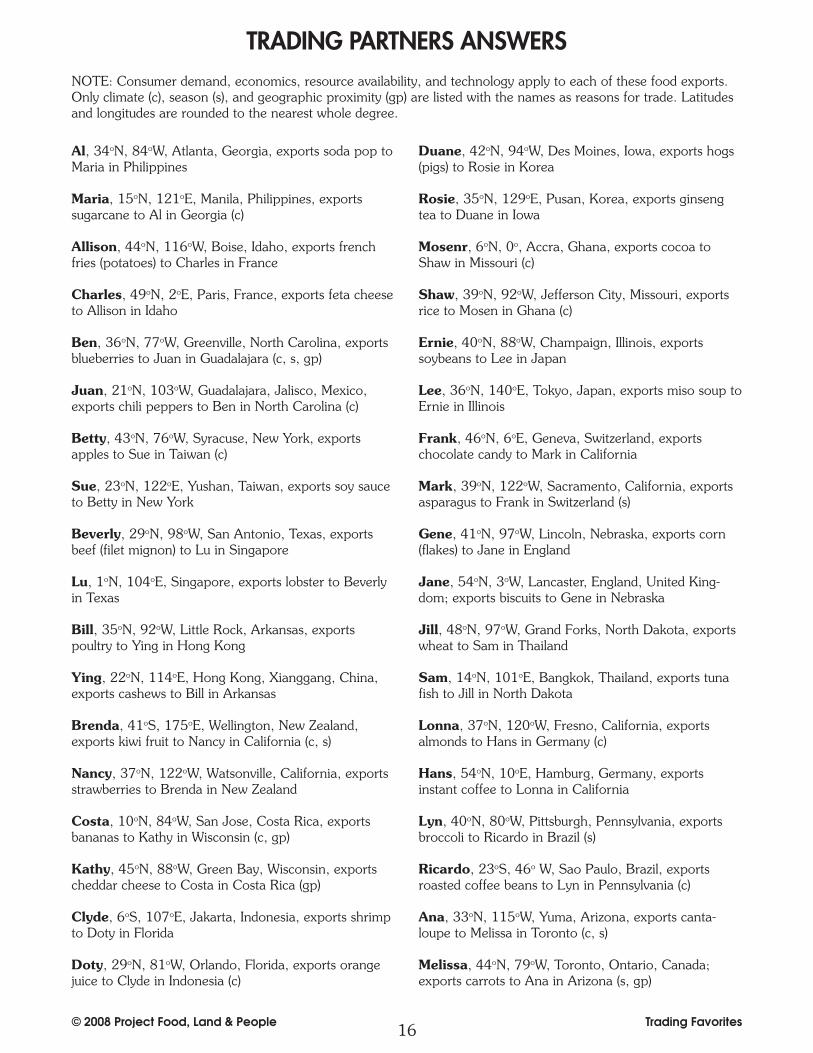
TRADING PARTNERS ANSWERSNOTE: Consumer demand, economics, resource availability, and technology apply to each of these food exports.Only climate (c), season (s), and geographic proximity (gp) are listed with the names as reasons for trade. Latitudesand longitudes are rounded to the nearest whole degree.
Al, 34oN, 84oW, Atlanta, Georgia, exports soda pop toMaria in Philippines
Maria, 15oN, 121oE, Manila, Philippines, exportssugarcane to Al in Georgia (c)
Allison, 44oN, 116oW, Boise, Idaho, exports frenchfries (potatoes) to Charles in France
Charles, 49oN, 2oE, Paris, France, exports feta cheeseto Allison in Idaho
Ben, 36oN, 77oW, Greenville, North Carolina, exportsblueberries to Juan in Guadalajara (c, s, gp)
Juan, 21oN, 103oW, Guadalajara, Jalisco, Mexico,exports chili peppers to Ben in North Carolina (c)
Betty, 43oN, 76oW, Syracuse, New York, exportsapples to Sue in Taiwan (c)
Sue, 23oN, 122oE, Yushan, Taiwan, exports soy sauceto Betty in New York
Beverly, 29oN, 98oW, San Antonio, Texas, exportsbeef (filet mignon) to Lu in Singapore
Lu, 1oN, 104oE, Singapore, exports lobster to Beverlyin Texas
Bill, 35oN, 92oW, Little Rock, Arkansas, exportspoultry to Ying in Hong Kong
Ying, 22oN, 114oE, Hong Kong, Xianggang, China,exports cashews to Bill in Arkansas
Brenda, 41oS, 175oE, Wellington, New Zealand,exports kiwi fruit to Nancy in California (c, s)
Nancy, 37oN, 122oW, Watsonville, California, exportsstrawberries to Brenda in New Zealand
Costa, 10oN, 84oW, San Jose, Costa Rica, exportsbananas to Kathy in Wisconsin (c, gp)
Kathy, 45oN, 88oW, Green Bay, Wisconsin, exportscheddar cheese to Costa in Costa Rica (gp)
Clyde, 6oS, 107oE, Jakarta, Indonesia, exports shrimpto Doty in Florida
Doty, 29oN, 81oW, Orlando, Florida, exports orangejuice to Clyde in Indonesia (c)
Duane, 42oN, 94oW, Des Moines, Iowa, exports hogs(pigs) to Rosie in Korea
Rosie, 35oN, 129oE, Pusan, Korea, exports ginsengtea to Duane in Iowa
Mosenr, 6oN, 0o, Accra, Ghana, exports cocoa toShaw in Missouri (c)
Shaw, 39oN, 92oW, Jefferson City, Missouri, exportsrice to Mosen in Ghana (c)
Ernie, 40oN, 88oW, Champaign, Illinois, exportssoybeans to Lee in Japan
Lee, 36oN, 140oE, Tokyo, Japan, exports miso soup toErnie in Illinois
Frank, 46oN, 6oE, Geneva, Switzerland, exportschocolate candy to Mark in California
Mark, 39oN, 122oW, Sacramento, California, exportsasparagus to Frank in Switzerland (s)
Gene, 41oN, 97oW, Lincoln, Nebraska, exports corn(flakes) to Jane in England
Jane, 54oN, 3oW, Lancaster, England, United King-dom; exports biscuits to Gene in Nebraska
Jill, 48oN, 97oW, Grand Forks, North Dakota, exportswheat to Sam in Thailand
Sam, 14oN, 101oE, Bangkok, Thailand, exports tunafish to Jill in North Dakota
Lonna, 37oN, 120oW, Fresno, California, exportsalmonds to Hans in Germany (c)
Hans, 54oN, 10oE, Hamburg, Germany, exportsinstant coffee to Lonna in California
Lyn, 40oN, 80oW, Pittsburgh, Pennsylvania, exportsbroccoli to Ricardo in Brazil (s)
Ricardo, 23oS, 46o W, Sao Paulo, Brazil, exportsroasted coffee beans to Lyn in Pennsylvania (c)
Ana, 33oN, 115oW, Yuma, Arizona, exports canta-loupe to Melissa in Toronto (c, s)
Melissa, 44oN, 79oW, Toronto, Ontario, Canada;exports carrots to Ana in Arizona (s, gp)
16© 2008 Project Food, Land & People Trading Favorites