Embed Size (px)
Citation preview
24th Annual “State of Logistics Report®”
Talking Freight Federal Highway Administration
August 21, 2013
Rosalyn Wilson
[email protected] 571-425-4923
Is This The New Normal?
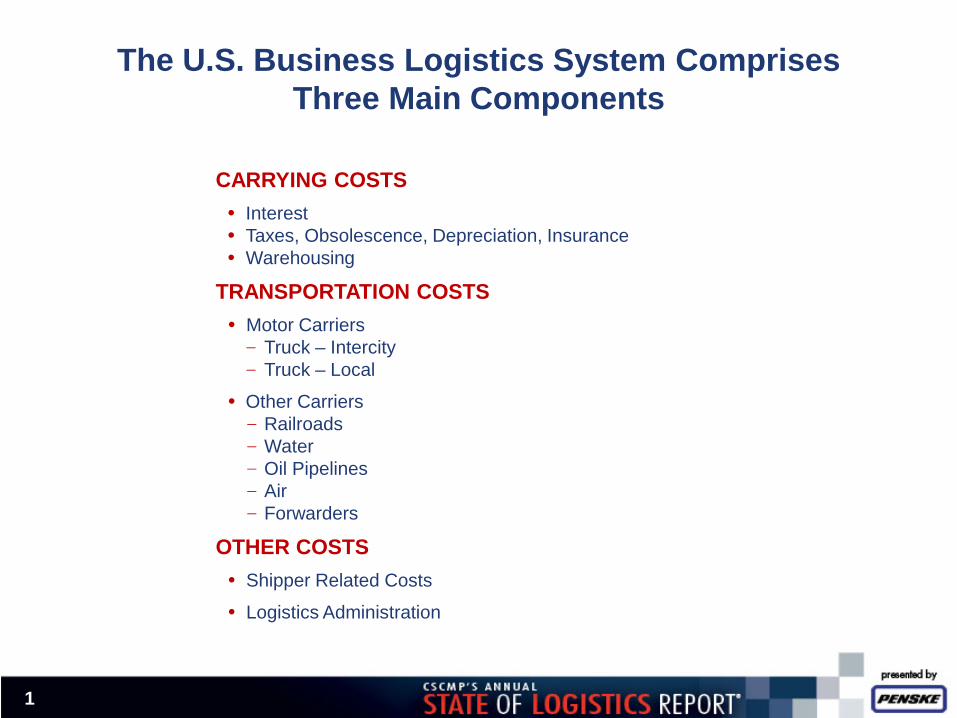
The U.S. Business Logistics System Comprises Three Main Components
1
CARRYING COSTS • Interest • Taxes, Obsolescence, Depreciation, Insurance • Warehousing
TRANSPORTATION COSTS • Motor Carriers - Truck – Intercity - Truck – Local
• Other Carriers - Railroads - Water - Oil Pipelines - Air - Forwarders
OTHER COSTS • Shipper Related Costs
• Logistics Administration
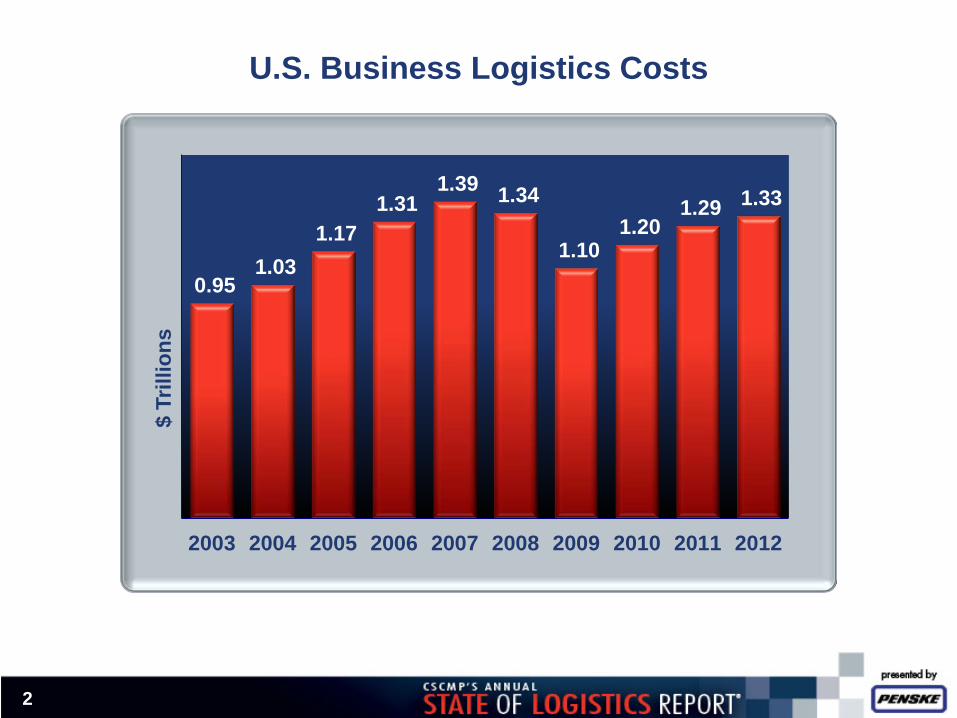
U.S. Business Logistics Costs
2
0.95 1.03
1.17 1.31
1.39 1.34
1.10 1.20
1.29 1.33
2003 2004 2005 2006 2007 2008 2009 2010 2011 2012
$ Tr
illio
ns
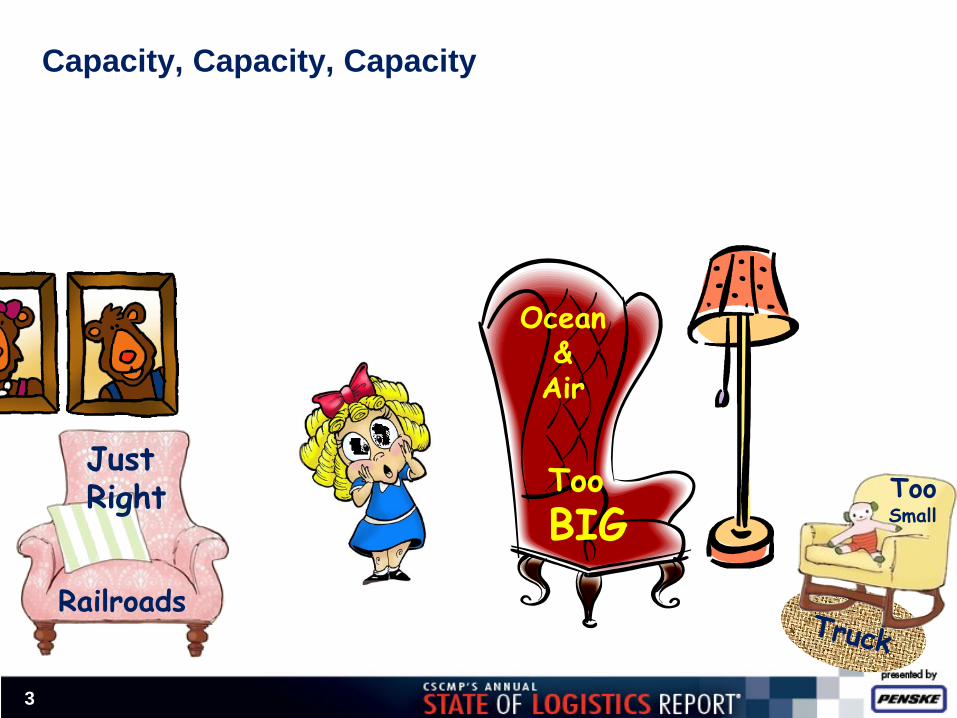
Capacity, Capacity, Capacity
Ocean & Air
Railroads
Too BIG
Too Small
Just Right
3
4
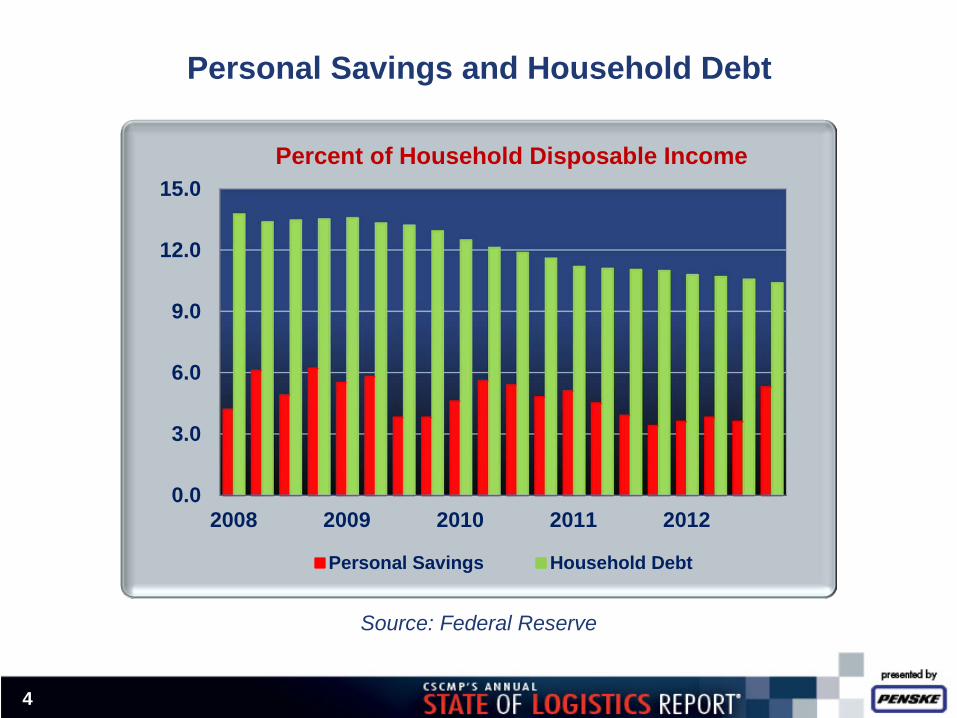
Personal Savings and Household Debt
Source: Federal Reserve
0.0
3.0
6.0
9.0
12.0
15.0
2008 2009 2010 2011 2012
Percent of Household Disposable Income
Personal Savings Household Debt
5
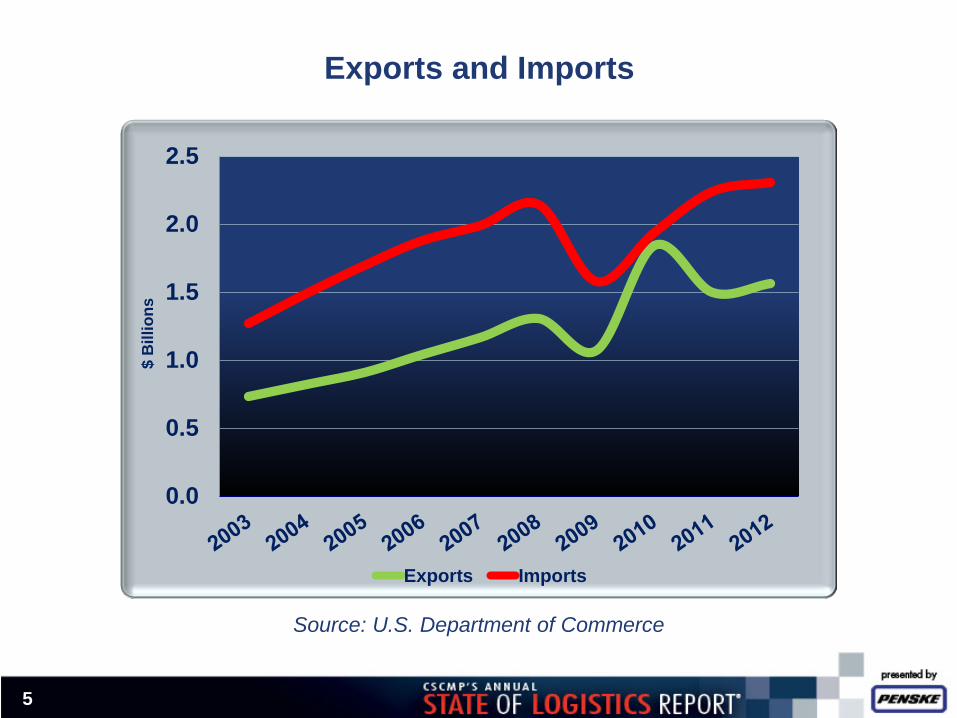
Exports and Imports
Source: U.S. Department of Commerce
0.0
0.5
1.0
1.5
2.0
2.5$
Bill
ions
Exports Imports
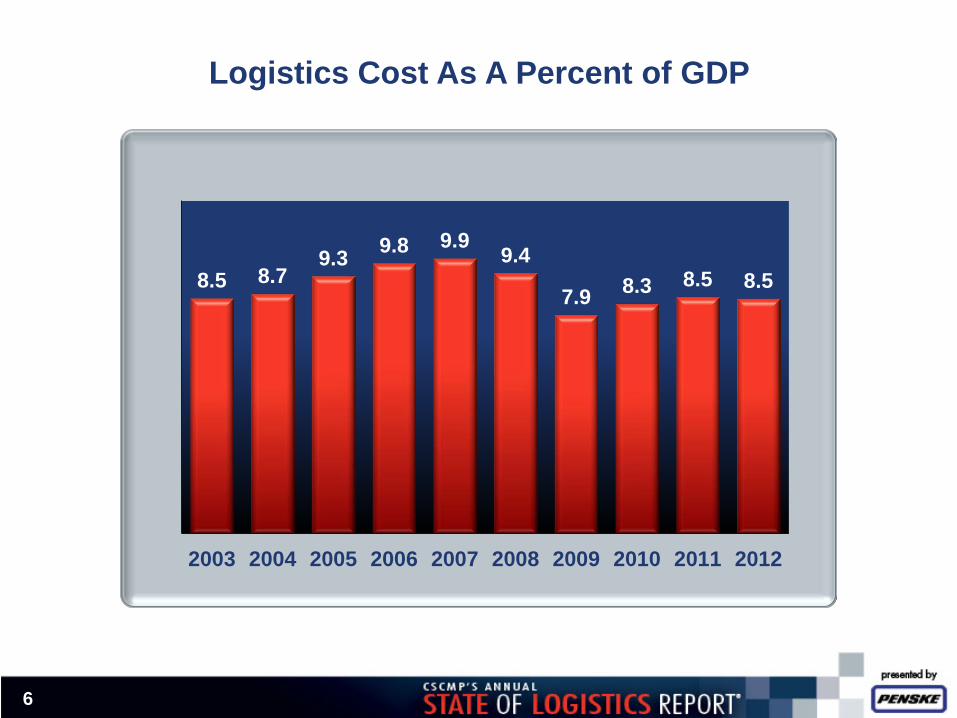
Logistics Cost As A Percent of GDP
6
8.5 8.7 9.3 9.8 9.9 9.4
7.9 8.3 8.5 8.5
2003 2004 2005 2006 2007 2008 2009 2010 2011 2012
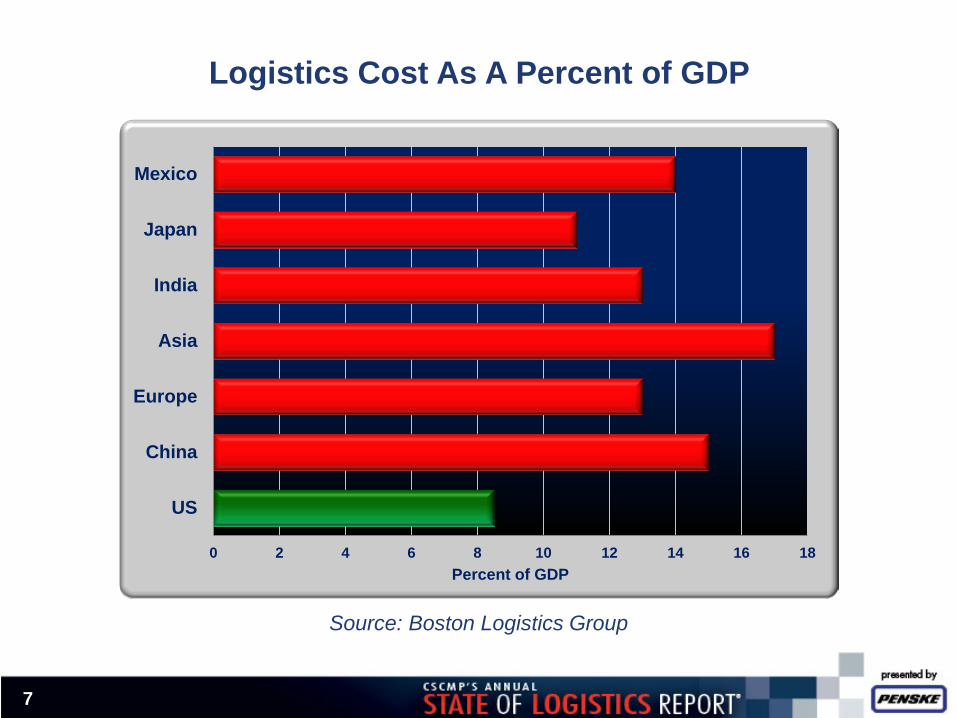
0 2 4 6 8 10 12 14 16 18
US
China
Europe
Asia
India
Japan
Mexico
Percent of GDP
Logistics Cost As A Percent of GDP
Source: Boston Logistics Group
7
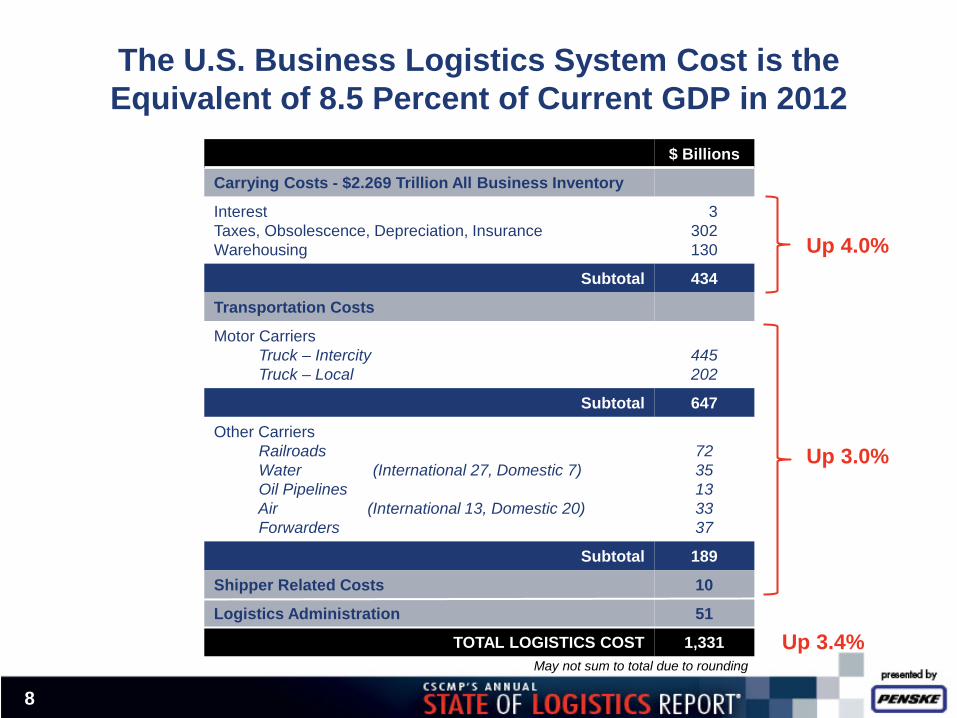
The U.S. Business Logistics System Cost is the Equivalent of 8.5 Percent of Current GDP in 2012
Up 4.0%
Up 3.0%
Up 3.4%
8
$ Billions
Carrying Costs - $2.269 Trillion All Business Inventory
Interest Taxes, Obsolescence, Depreciation, Insurance Warehousing
3 302 130
Subtotal 434
Transportation Costs
Motor Carriers Truck – Intercity Truck – Local
445 202
Subtotal 647
Other Carriers Railroads Water (International 27, Domestic 7) Oil Pipelines Air (International 13, Domestic 20) Forwarders
72 35 13 33 37
Subtotal 189
Shipper Related Costs 10
Logistics Administration 51
TOTAL LOGISTICS COST 1,331 May not sum to total due to rounding
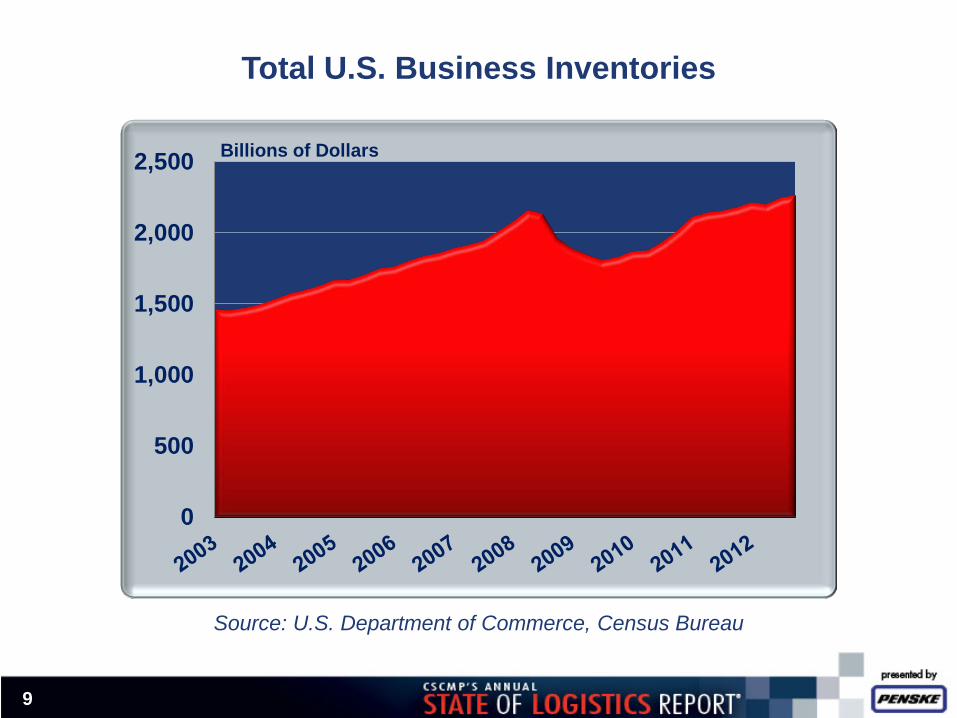
Total U.S. Business Inventories
Source: U.S. Department of Commerce, Census Bureau
US Recessions
0
500
1,000
1,500
2,000
2,500 Billions of Dollars
9
10
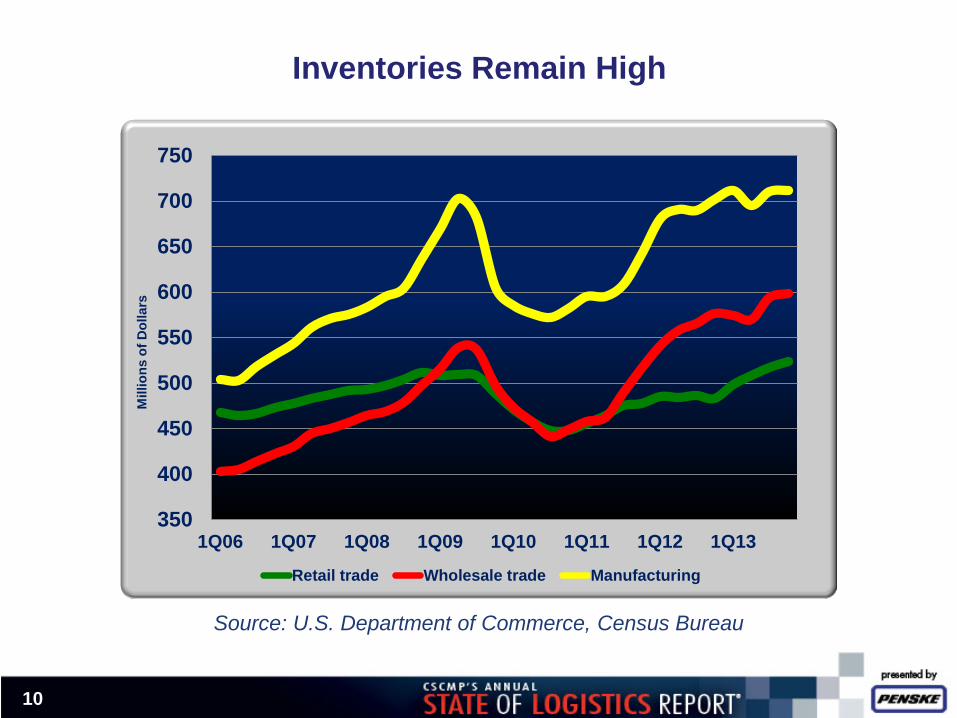
Inventories Remain High
Source: U.S. Department of Commerce, Census Bureau
350
400
450
500
550
600
650
700
750
1Q06 1Q07 1Q08 1Q09 1Q10 1Q11 1Q12 1Q13
Mill
ions
of D
olla
rs
Retail trade Wholesale trade Manufacturing
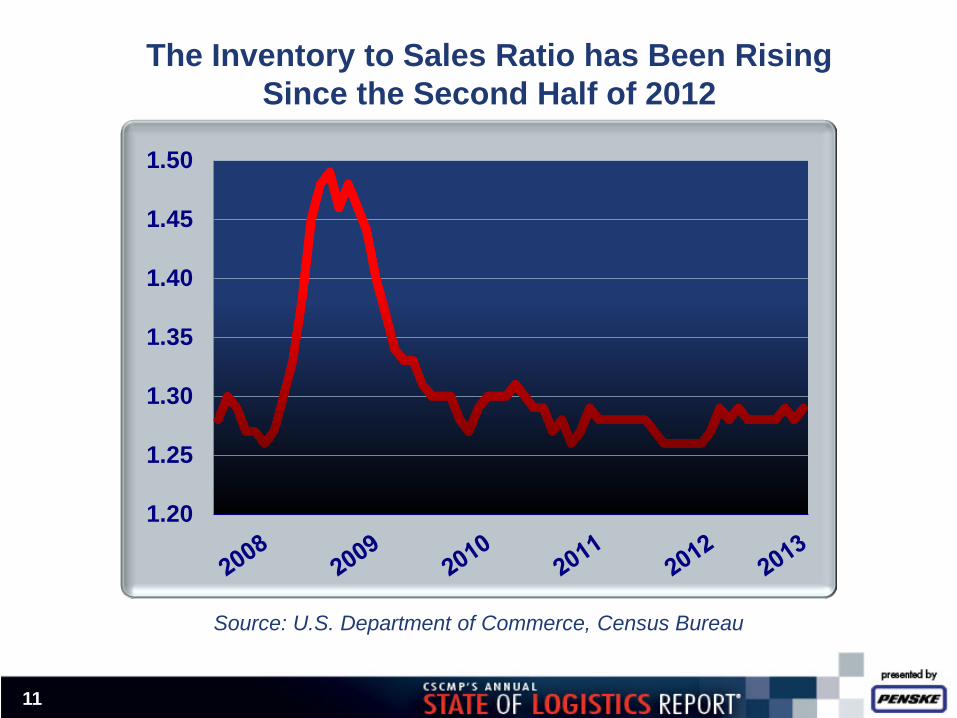
The Inventory to Sales Ratio has Been Rising Since the Second Half of 2012
Source: U.S. Department of Commerce, Census Bureau
11
1.20
1.25
1.30
1.35
1.40
1.45
1.50
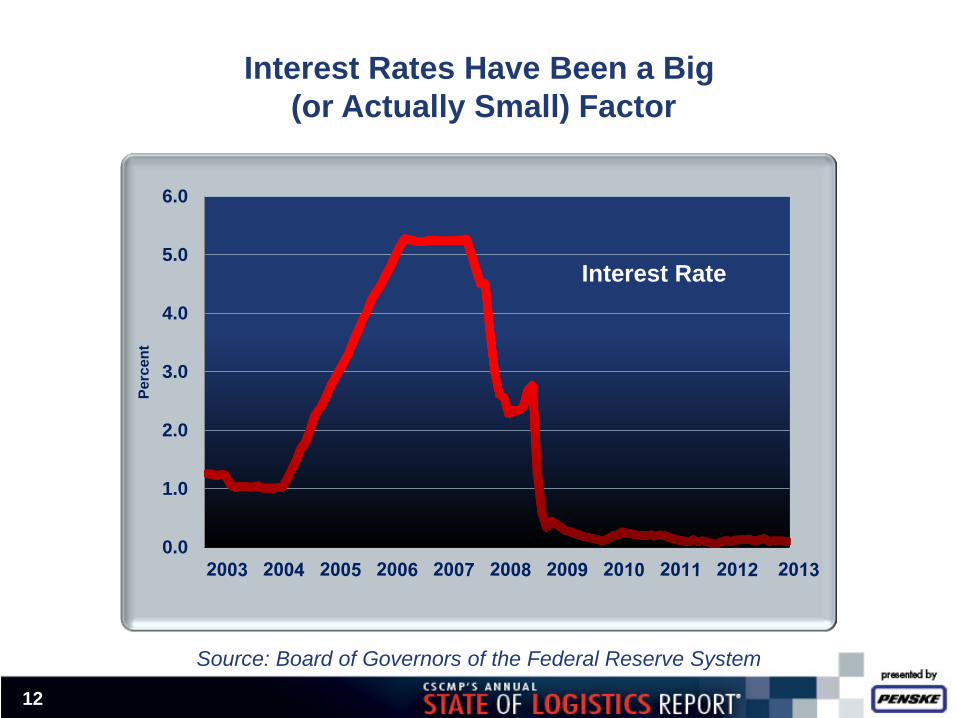
Interest Rates Have Been a Big (or Actually Small) Factor
12
0.0
1.0
2.0
3.0
4.0
5.0
6.0
Perc
ent
Interest Rate
Source: Board of Governors of the Federal Reserve System
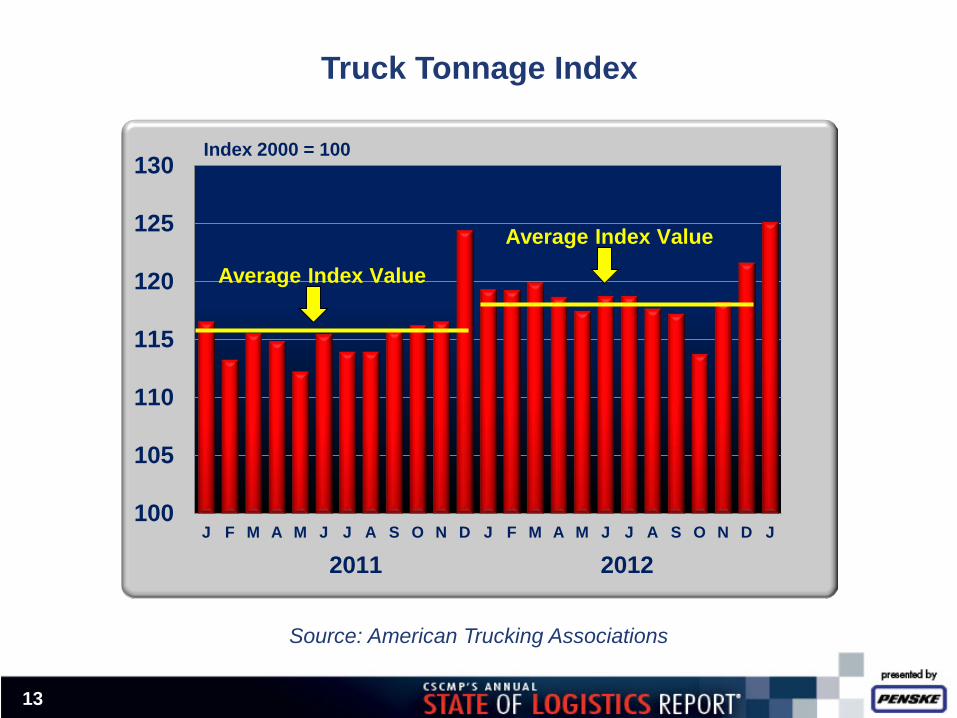
Truck Tonnage Index
13
Source: American Trucking Associations
100
105
110
115
120
125
130
J F M A M J J A S O N D J F M A M J J A S O N D J
2011 2012
Average Index Value
Average Index Value
Index 2000 = 100
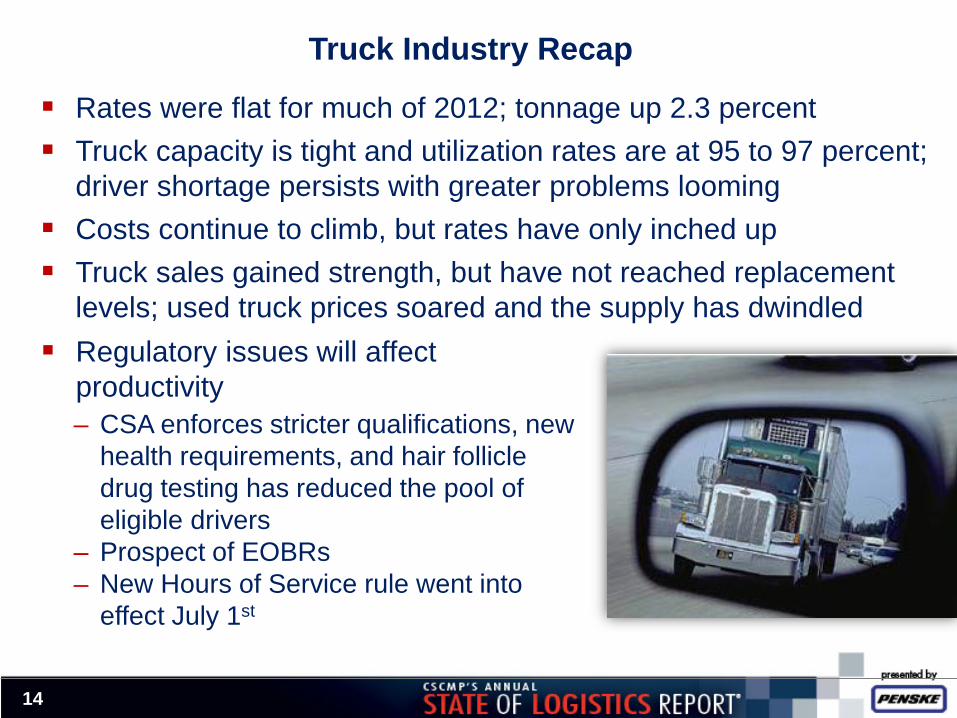
Truck Industry Recap
Rates were flat for much of 2012; tonnage up 2.3 percent Truck capacity is tight and utilization rates are at 95 to 97 percent;
driver shortage persists with greater problems looming Costs continue to climb, but rates have only inched up Truck sales gained strength, but have not reached replacement
levels; used truck prices soared and the supply has dwindled Regulatory issues will affect
productivity – CSA enforces stricter qualifications, new
health requirements, and hair follicle drug testing has reduced the pool of eligible drivers
– Prospect of EOBRs – New Hours of Service rule went into
effect July 1st
14
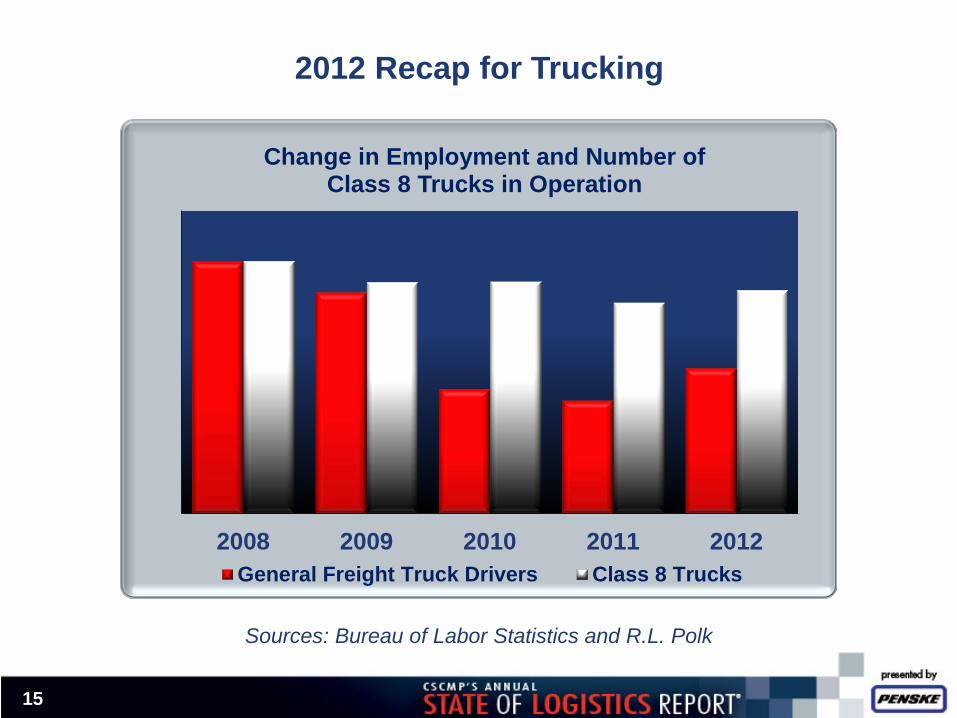
2012 Recap for Trucking
15
Sources: Bureau of Labor Statistics and R.L. Polk
2008 2009 2010 2011 2012
Change in Employment and Number of Class 8 Trucks in Operation
General Freight Truck Drivers Class 8 Trucks
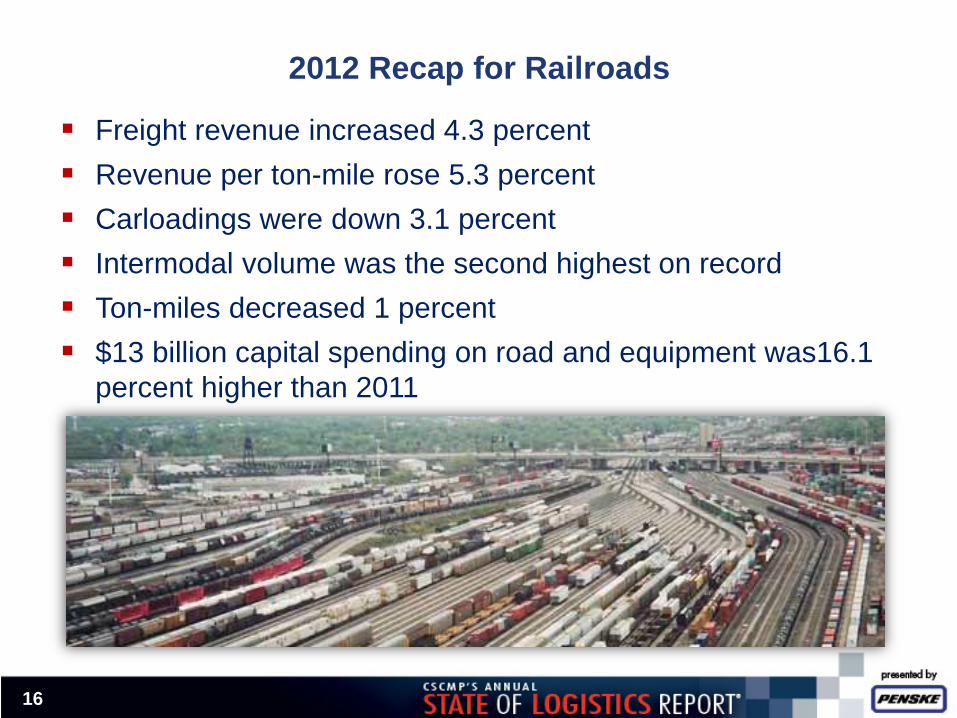
2012 Recap for Railroads
16
Freight revenue increased 4.3 percent Revenue per ton-mile rose 5.3 percent Carloadings were down 3.1 percent Intermodal volume was the second highest on record Ton-miles decreased 1 percent $13 billion capital spending on road and equipment was16.1
percent higher than 2011
17
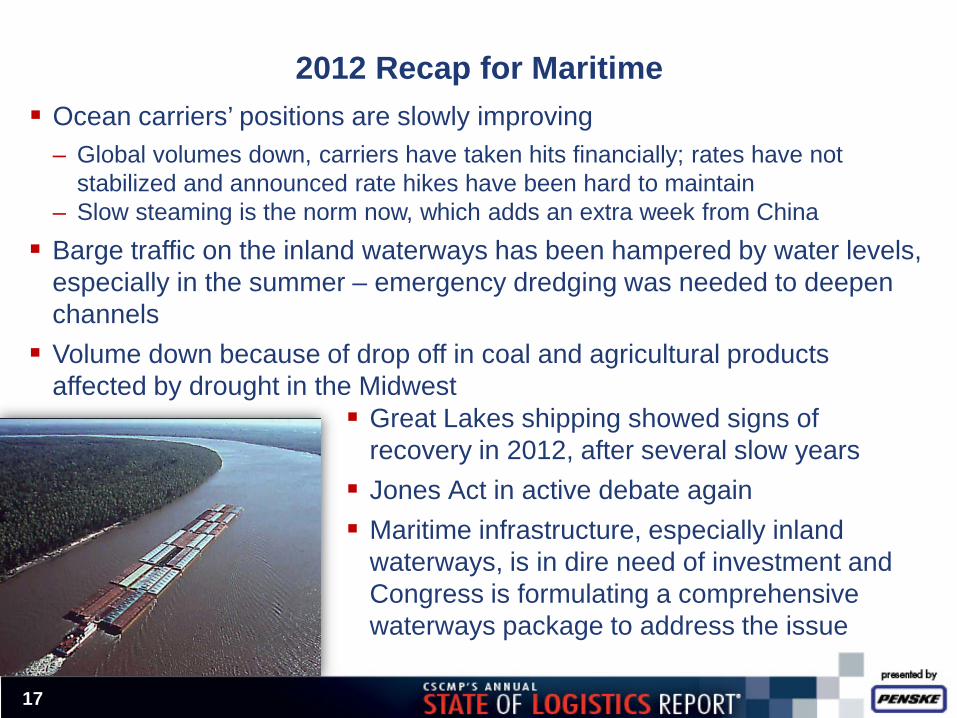
2012 Recap for Maritime
Ocean carriers’ positions are slowly improving – Global volumes down, carriers have taken hits financially; rates have not
stabilized and announced rate hikes have been hard to maintain – Slow steaming is the norm now, which adds an extra week from China Barge traffic on the inland waterways has been hampered by water levels,
especially in the summer – emergency dredging was needed to deepen channels Volume down because of drop off in coal and agricultural products
affected by drought in the Midwest Great Lakes shipping showed signs of
recovery in 2012, after several slow years Jones Act in active debate again Maritime infrastructure, especially inland
waterways, is in dire need of investment and Congress is formulating a comprehensive waterways package to address the issue
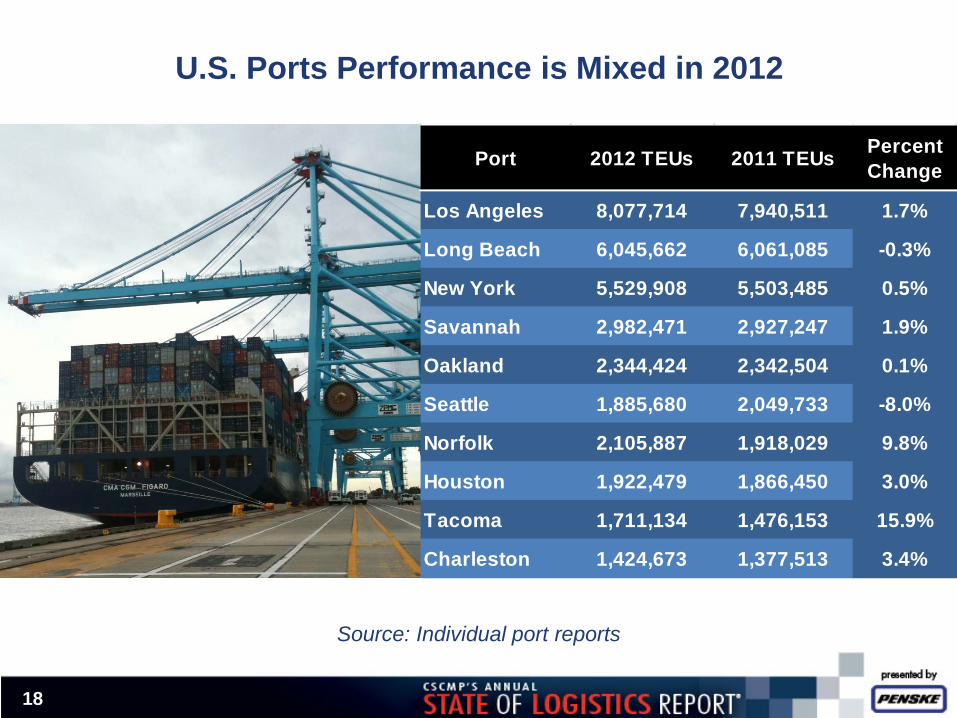
Source: Individual port reports
U.S. Ports Performance is Mixed in 2012
18
Port 2012 TEUs 2011 TEUs Percent Change
Los Angeles 8,077,714 7,940,511 1.7%
Long Beach 6,045,662 6,061,085 -0.3%
New York 5,529,908 5,503,485 0.5%
Savannah 2,982,471 2,927,247 1.9%
Oakland 2,344,424 2,342,504 0.1%
Seattle 1,885,680 2,049,733 -8.0%
Norfolk 2,105,887 1,918,029 9.8%
Houston 1,922,479 1,866,450 3.0%
Tacoma 1,711,134 1,476,153 15.9%
Charleston 1,424,673 1,377,513 3.4%
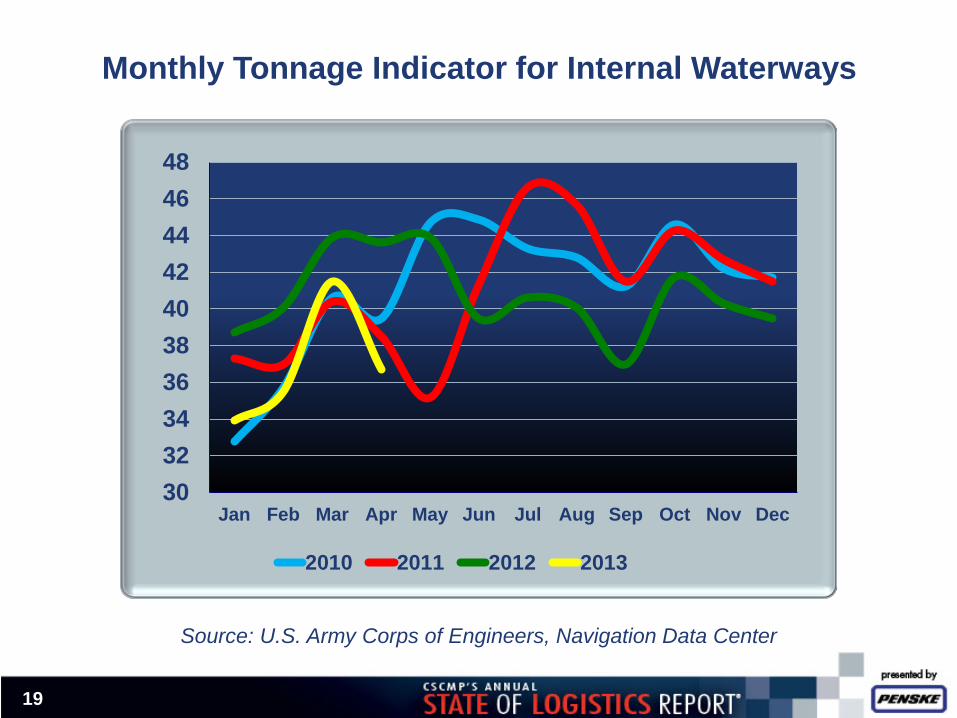
Monthly Tonnage Indicator for Internal Waterways
Source: U.S. Army Corps of Engineers, Navigation Data Center
19
30323436384042444648
Jan Feb Mar Apr May Jun Jul Aug Sep Oct Nov Dec
2010 2011 2012 2013
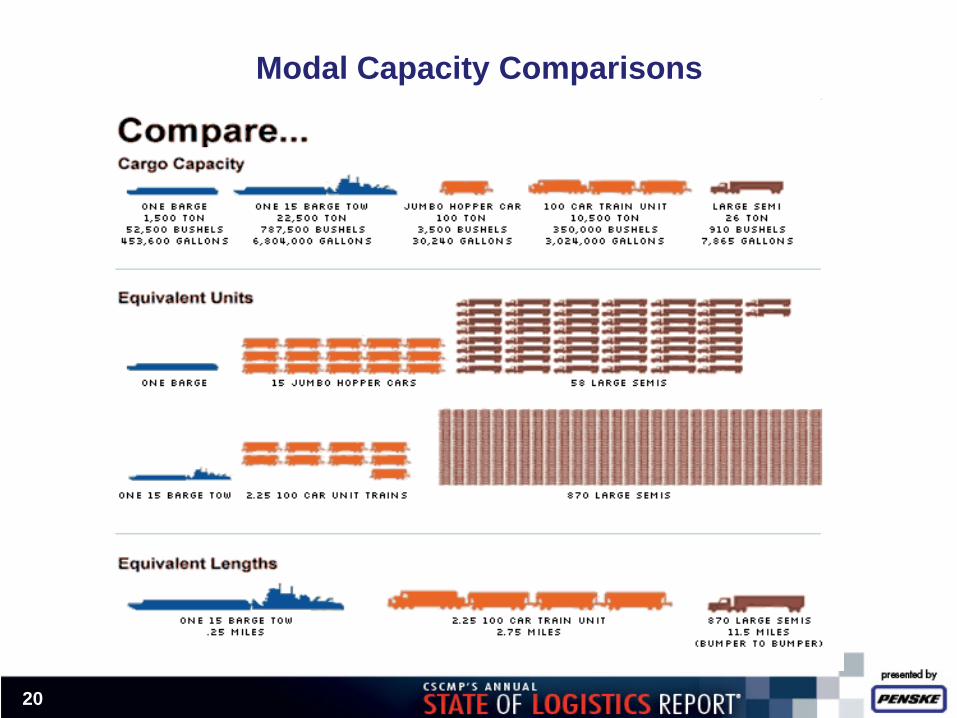
20
Modal Capacity Comparisons
21
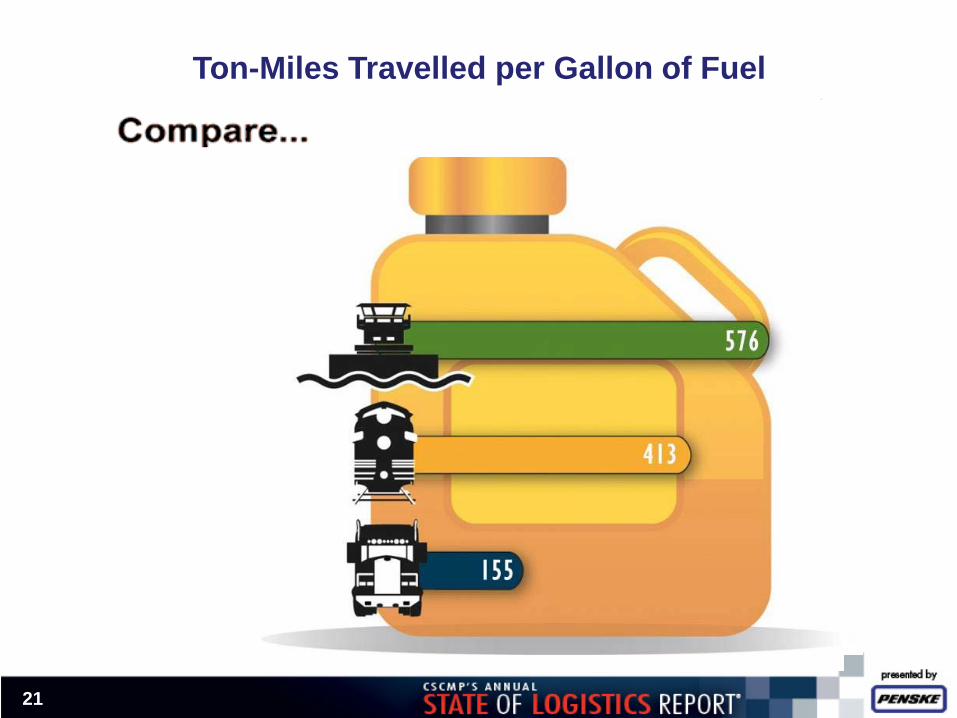
Ton-Miles Travelled per Gallon of Fuel
22
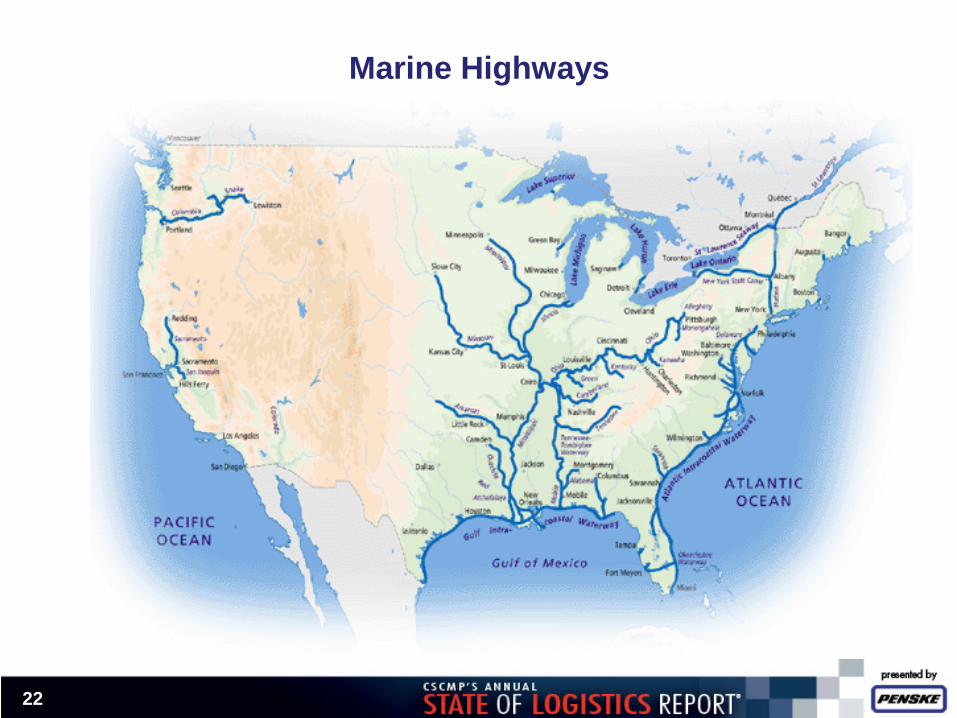
Marine Highways
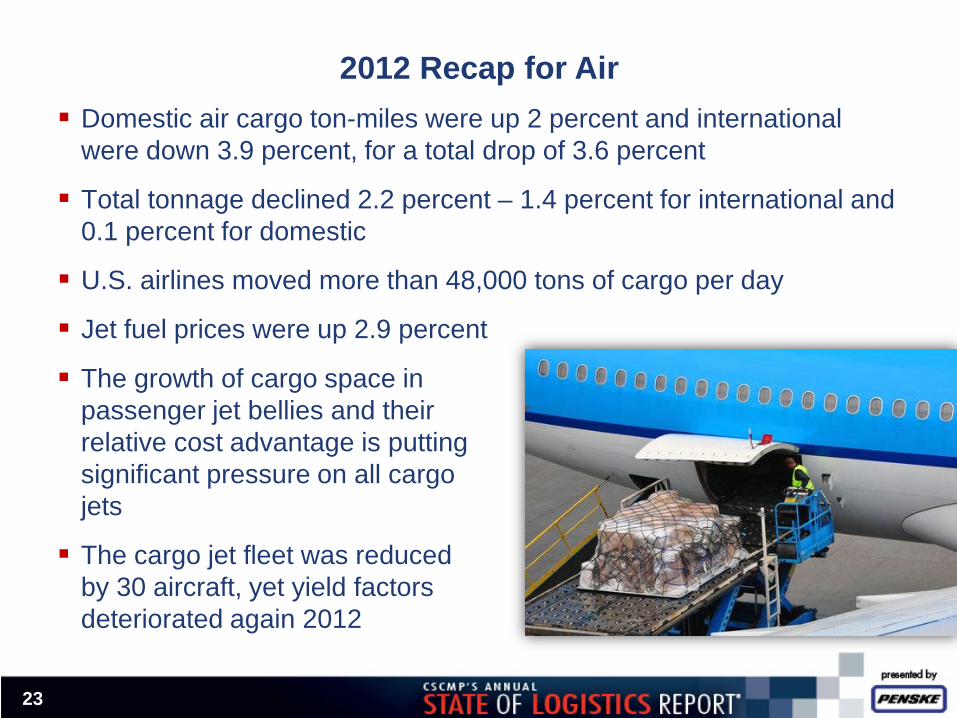
Domestic air cargo ton-miles were up 2 percent and international were down 3.9 percent, for a total drop of 3.6 percent
Total tonnage declined 2.2 percent – 1.4 percent for international and 0.1 percent for domestic
U.S. airlines moved more than 48,000 tons of cargo per day
Jet fuel prices were up 2.9 percent
23
2012 Recap for Air
The growth of cargo space in passenger jet bellies and their relative cost advantage is putting significant pressure on all cargo jets
The cargo jet fleet was reduced by 30 aircraft, yet yield factors deteriorated again 2012
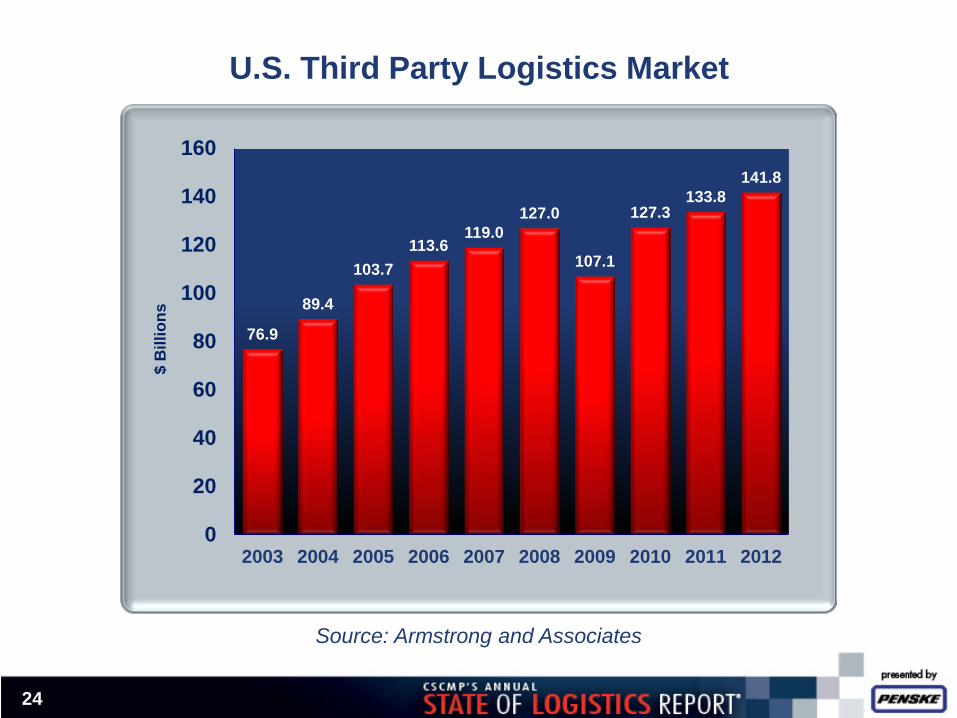
U.S. Third Party Logistics Market
24
Source: Armstrong and Associates
76.9
89.4
103.7 113.6
119.0 127.0
107.1
127.3 133.8
141.8
0
20
40
60
80
100
120
140
160
2003 2004 2005 2006 2007 2008 2009 2010 2011 2012
$ B
illio
ns
25
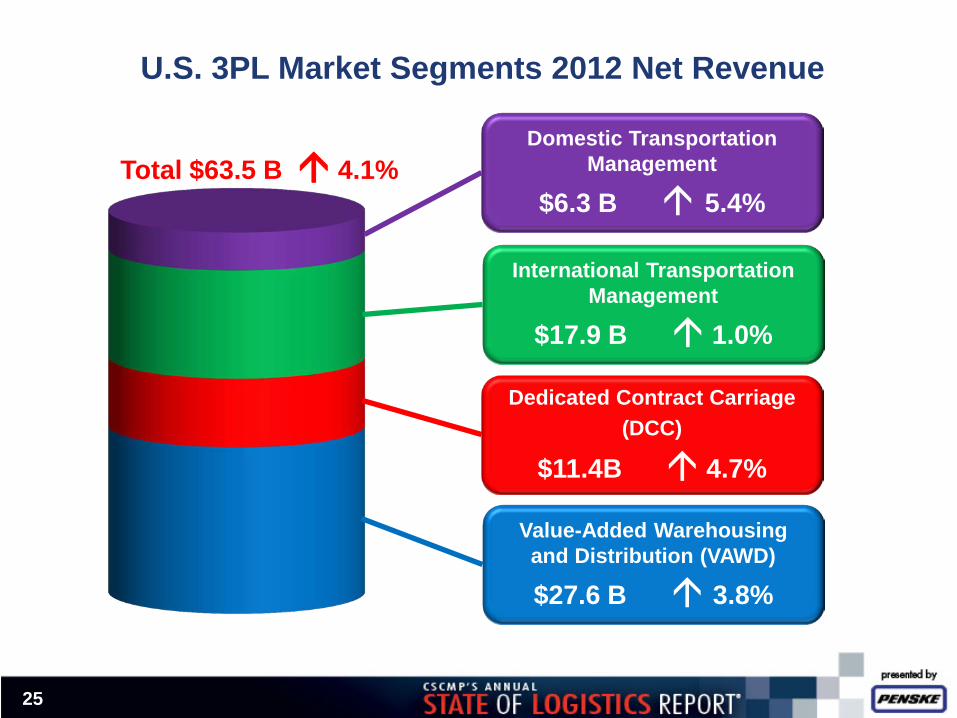
U.S. 3PL Market Segments 2012 Net Revenue
Domestic Transportation Management
$6.3 B 5.4%
International Transportation Management
$17.9 B 1.0%
Dedicated Contract Carriage (DCC)
$11.4B 4.7%
Value-Added Warehousing and Distribution (VAWD)
$27.6 B 3.8%
Total $63.5 B 4.1%
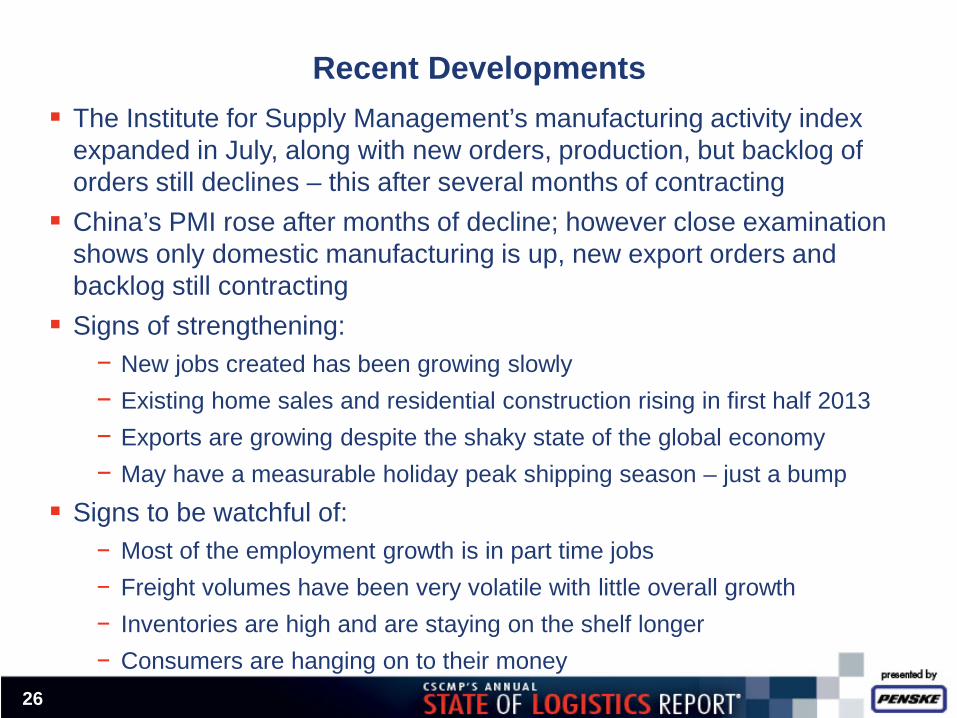
Recent Developments The Institute for Supply Management’s manufacturing activity index
expanded in July, along with new orders, production, but backlog of orders still declines – this after several months of contracting China’s PMI rose after months of decline; however close examination
shows only domestic manufacturing is up, new export orders and backlog still contracting Signs of strengthening:
− New jobs created has been growing slowly − Existing home sales and residential construction rising in first half 2013 − Exports are growing despite the shaky state of the global economy − May have a measurable holiday peak shipping season – just a bump
Signs to be watchful of: − Most of the employment growth is in part time jobs − Freight volumes have been very volatile with little overall growth − Inventories are high and are staying on the shelf longer − Consumers are hanging on to their money
26
27
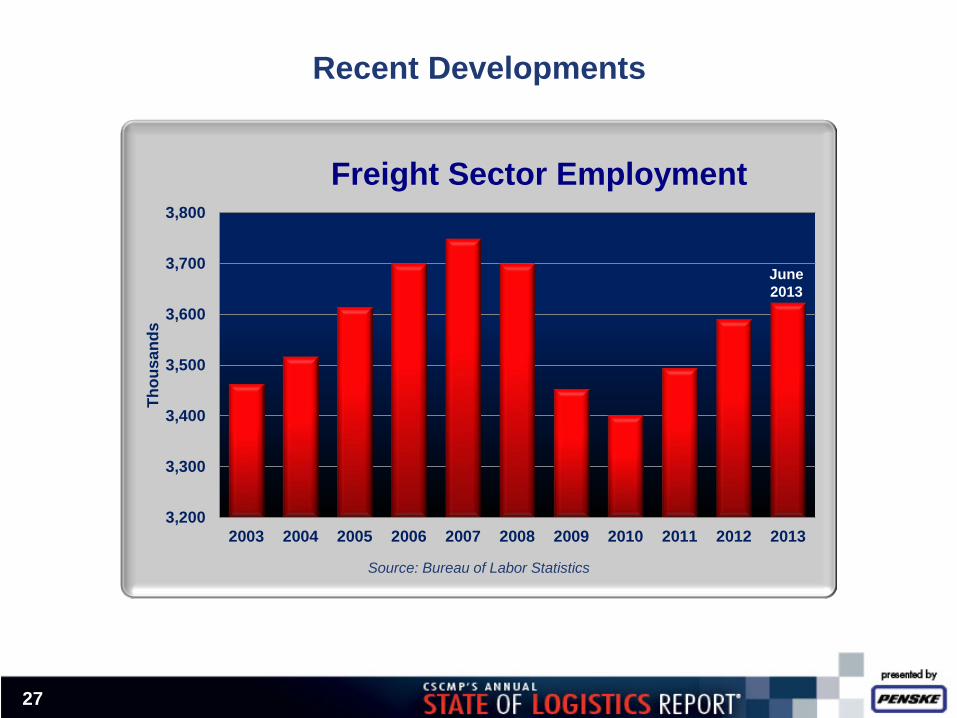
Recent Developments
3,200
3,300
3,400
3,500
3,600
3,700
3,800
2003 2004 2005 2006 2007 2008 2009 2010 2011 2012 2013
Thou
sand
s Freight Sector Employment
Source: Bureau of Labor Statistics
June 2013
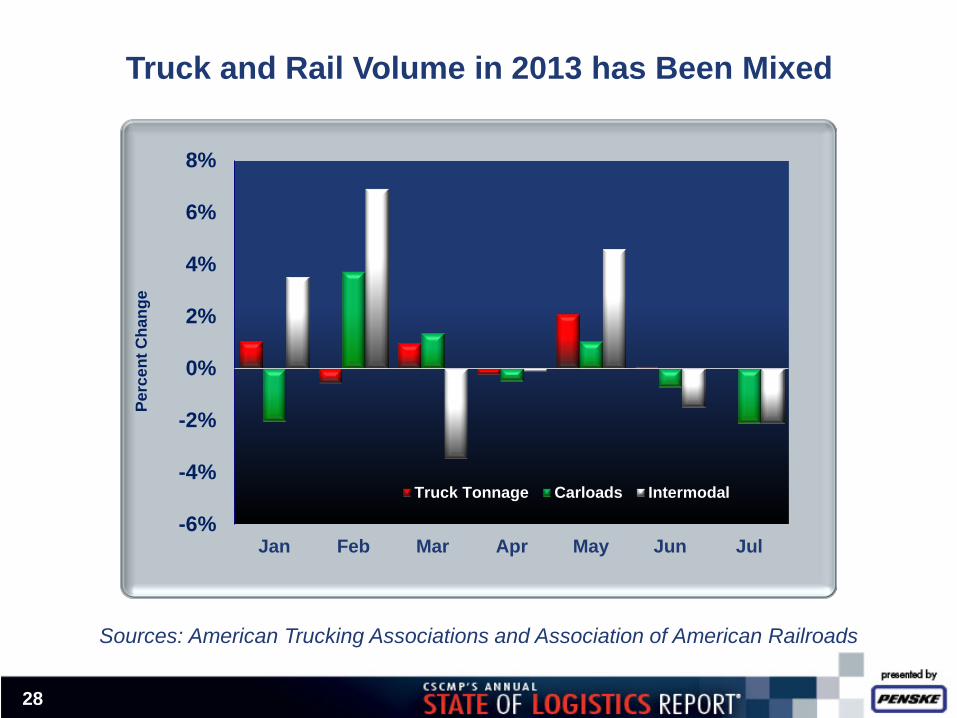
Truck and Rail Volume in 2013 has Been Mixed
28
Sources: American Trucking Associations and Association of American Railroads
-6%
-4%
-2%
0%
2%
4%
6%
8%
Jan Feb Mar Apr May Jun Jul
Perc
ent C
hang
e
Truck Tonnage Carloads Intermodal
29
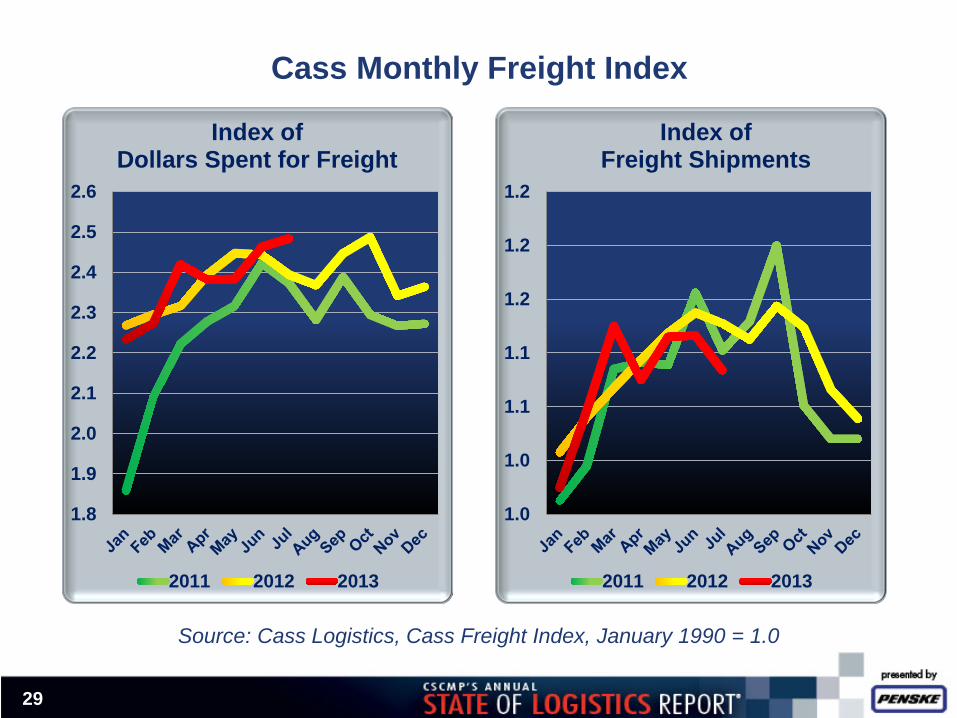
Cass Monthly Freight Index
Source: Cass Logistics, Cass Freight Index, January 1990 = 1.0
1.8
1.9
2.0
2.1
2.2
2.3
2.4
2.5
2.6
Index of Dollars Spent for Freight
2011 2012 2013
1.0
1.0
1.1
1.1
1.2
1.2
1.2
Index of Freight Shipments
2011 2012 2013
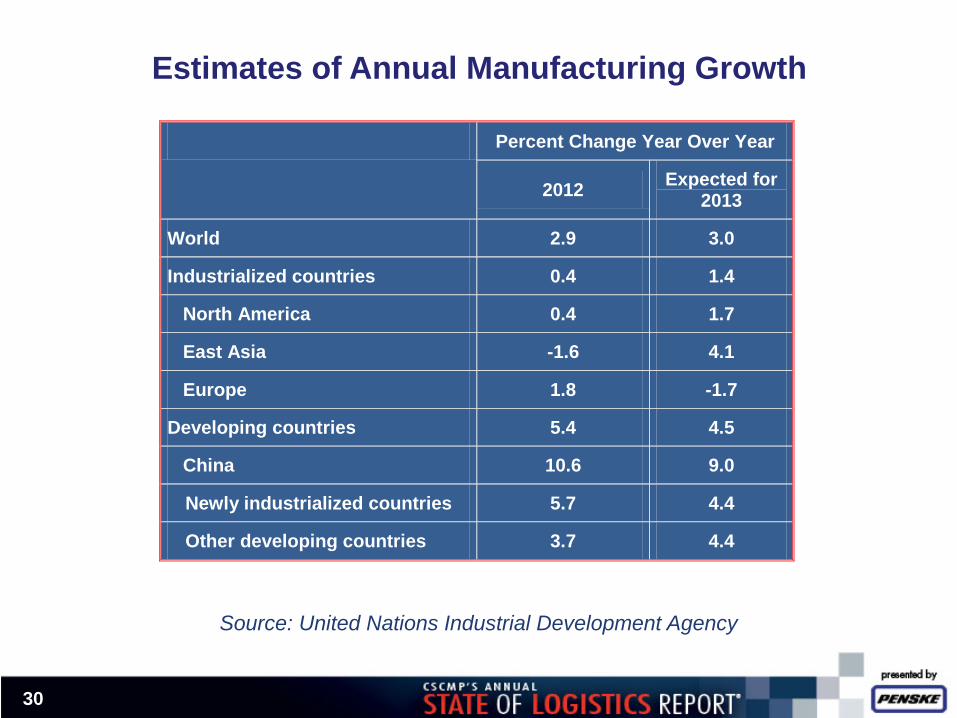
Estimates of Annual Manufacturing Growth
Source: United Nations Industrial Development Agency
30
Percent Change Year Over Year
2012 Expected for 2013
World 2.9 3.0
Industrialized countries 0.4 1.4
North America 0.4 1.7
East Asia -1.6 4.1
Europe 1.8 -1.7
Developing countries 5.4 4.5
China 10.6 9.0
Newly industrialized countries 5.7 4.4
Other developing countries 3.7 4.4
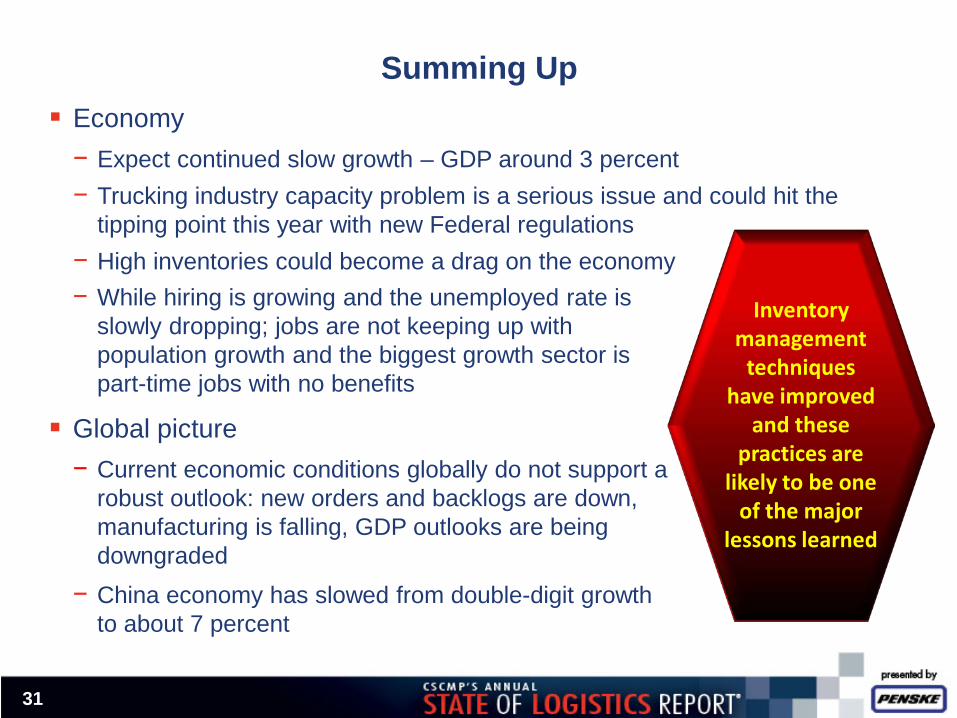
Summing Up Economy − Expect continued slow growth – GDP around 3 percent − Trucking industry capacity problem is a serious issue and could hit the
tipping point this year with new Federal regulations − High inventories could become a drag on the economy
31
Inventory management
techniques have improved
and these practices are
likely to be one of the major
lessons learned
− While hiring is growing and the unemployed rate is slowly dropping; jobs are not keeping up with population growth and the biggest growth sector is part-time jobs with no benefits
Global picture − Current economic conditions globally do not support a
robust outlook: new orders and backlogs are down, manufacturing is falling, GDP outlooks are being downgraded
− China economy has slowed from double-digit growth to about 7 percent
Copies of the State of Logistics Report are available from CSCMP at CSCMP.org
Questions? Roz Wilson [email protected] 703-587-6213
32