Embed Size (px)
Citation preview

Is there Universality in the Dielectric Response ofPolar Glass Formers?K. L. Ngai
CNR-IPCF, Università di PisaZaneta Wojnarowska ( [email protected] )
University of Silesia in KatowiceMarian Paluch
University of Silesia in Katowice
Research Article
Keywords: dielectric spectroscopy, photon correlation spectroscopy (PCS), nuclear magnetic resonance(NMR), Johari-Goldstein (JG), dielectric permittivity, polar glass-formers
Posted Date: May 11th, 2021
DOI: https://doi.org/10.21203/rs.3.rs-493275/v1
License: This work is licensed under a Creative Commons Attribution 4.0 International License. Read Full License

1
Is there Universality in the Dielectric Response of Polar Glass Formers?
K.L. Ngai1, Z. Wojnarowska2*, M. Paluch2
1Dipartimento di Fisica, CNR-IPCF, Università di Pisa, Largo Bruno Pontecorvo 3, I-56127,
Pisa, Italy
2Institute of Physics, University of Silesia in Katowice, 75 Pułku Piechoty 1A, 41–500 Chorzów, Poland
*corresponding author [email protected]
Abstract
The frequency dispersion of structural -relaxation obtained from broadband dielectric
spectroscopy measurements is relatively narrow in many polar glass-formers. On the other hand,
it becomes much broader when probed by other techniques, including photon correlation
spectroscopy (PCS), nuclear magnetic resonance (NMR), and mechanical shear modulus.
Therefore, the dynamics of glass-formers observed by dielectric permittivity spectroscopy (DS) is
called into question. Herein we propose a way to resolve this problem. First, we point out an
unresolved Johari-Goldstein (JG) -relaxation is present nearby the -relaxation in these polar
glass-formers. The dielectric relaxation strength of the JG -relaxation is sufficiently weak
compared to the -relaxation so that the narrow dielectric frequency dispersion faithfully
represents the dynamic heterogeneity and cooperativity of the -relaxation. However, when the
other techniques are used to probe the same glass-former, there is a reduction of relaxation strength
of -relaxation relative to that of the JG -relaxation. Additionally, the separation between the
and the JG relaxations in dielectric permittivity) decreases when probed by mechanical shear
modulus. These changes in relation of - to JG -relaxation, when examined by the other
techniques, engender the non-negligible contribution of the latter to the former. Hence the apparent
-relaxation is broader than observed by the dielectric permittivity. The broadening is artificial
because it is due to a confluence of the and JG relaxations with a disparity in their relaxation
strengths much less when the other techniques than by dielectric permittivity are used. This
explanation is supported by showing the α-relaxation of polar glass-formers becomes broader when the dielectric data are represented in terms of the electric modulus instead of permittivity.
The broadening, in this case, is again due to a reduction of the relaxation strength of the α-relaxation relative to that of the JG β-relaxation in the electric modulus representation. A corollary of the explanation applicable to weakly polar glass-formers having JG -relaxation widely
separated from the -relaxation is the prediction that the frequency dispersion of dielectric -
relaxation is nearly the same as that of the electric modulus, and there is no significant additional
broadening when probed by the other techniques. A host of experimental data from the literature
and our new measurements are given to support the explanation for polar glass-formers and the

2
ancillary prediction for weakly polar glass-formers. Thus the narrow frequency dispersion of the
intense relaxation in polar glass-formers observed by dielectric permittivity is real and genuinely
represents the dynamically heterogeneous and cooperative dynamics of -relaxation. By contrast,
the broad dispersion found by the other techniques is artificial and misleading.
1. INTRODUCTION
Dielectric spectroscopy, an experimental technique to study the relaxation and diffusion of
materials, has a long and glorious history in scientific research. One may trace it back to 1854 of
the measurements of electrical relaxation of alkali ions in the Leyden jar (a glass) by R. Kohlrausch
[1] which led to the fractional exponential correlation function attributed to him, ��(�) = exp [−(�/��)��], (1)
where is the structural -relaxation of glass-formers and K is a fractional exponent. Another
notable milestone of dielectric spectroscopy was the theoretical description of polarization
phenomena of polar molecules by Debye in 1913 [2], and tested the description by the dielectric
response of several monohydroxy alcohols reported in his 1929 book ‘Polar Molecules’ [3]. One
example of the modern developments is the dielectric measurement of glycerol by Davidson and
Cole [4]. They proposed a relaxation function to represent the frequency dependence of the
dielectric susceptibility *(f). Since then, dielectric spectroscopy has become widely used to study
molecular structural relaxation and ionic conductivity relaxation in various materials [ 5 ].
Nowadays, the advance in instrumentation makes it possible to measure dielectric response over
18 decades of frequency [6]. The abundance of dielectric relaxation data accumulated to the present
time enables the observation of the widely different dynamics in diverse materials and glass-
formers belonging to the same class.
For materials with significant dipole moment, dielectric spectroscopy has the sensitivity to
observe faster processes, including the secondary relaxation and nearly constant loss originating
from caged molecular dynamics. It is the technique used by Johari and Goldstein to reveal the
presence of secondary relaxations in many glass-formers and make the critical discovery that the
secondary relaxation is present even in totally rigid molecules [7]. This is followed by another
finding that there is a secondary relaxation in each glass-former that bears an inseparable
connection in properties with the primary structural -relaxation [8 ,9 ,10]. To distinguish this
secondary mode from secondary relaxations not having these properties, it is called the Johari-
Goldstein (JG) -relaxations [11]. An example of the properties is the anti-correlation of K with
the separation between the JG -relaxation and the -relaxation given by the logarithm of the ratio
of their relaxation times, log(/JG) at the glass transition temperature Tg [12 , 13]. This anti-
correlation is supported theoretically by the Coupling Model (CM) via the approximate relation
[14], log�� − log��� ≈ (1 − ��)log(��/��), (2)
where tc is the onset of classical chaos and has the value of 1 to 2 ps for molecular glass-formers
determined by quasielastic neutron scattering.
A recent application of dielectric spectroscopy to van der Waals molecular glass-formers
has found that the width of the -loss peak near the glass transition temperature Tg is strongly anti-
correlated with the polarity of the molecule. The larger the dielectric relaxation strength (Tg) or
the glass-former is more polar, the narrower is the -loss peak (anti-correlation) and larger is the
Kohlrausch exponent K in Eq.(1) (correlation) [15]. This remarkable property was explained by
the contribution from the dipole-dipole interaction potential to the attractive part of the
3
intermolecular potential, making the resultant potential more harmonic. The consequence is ����(i.e. K from dielectric spectroscopy) and the narrowing of the -relaxation increasing rapidly
with the dipole moment and (Tg). Subsequent tests of the correlation have repeatedly
confirmed it [16,17,18,19].
Let us combine this correlation of ���� with (Tg) with the anti-correlation between ����
and log(/JG) at Tg mentioned in the above and given by Eq.(2).. The combination strongly
suggests the presence of the JG -relaxation and its separation from the -relaxation becomes
smaller in glass-formers having narrower -relaxation or larger ���� . This fact is essential for
anyone who raises the issue with the correlation of ���� with (Tg) to recognize. As we shall show
in this paper that this fact becomes relevant for the issue raised in 2020 by Körber et al. [19], who
question the relevance of the correlation of ���� with (Tg) established from dielectric
spectroscopy (DS) by the contrasting results from photon correlation spectroscopy (PCS), Fabry–
Perot interferometry, and nuclear magnetic resonance relaxometry. In a number of the polar
molecular glass-formers having narrow -relaxation or large ���� and with large (Tg) they show
the -relaxations probed by PCS and NMR are much broader. Remarkably the widths of the -
relaxations from PCS and NMR varies weakly among the polar liquids with K falling within the
range of 0.58 ± 0.06. Actually, only a few polar liquids were presented by Körber et al. to show
the contrast between the larger value of ���� compared to the smaller value of �����. We pick the
best two cases; one is from glycerol with ����=0.69 vs. �����=0.52, and the other one is from
phenolphthalein dimethylether (PDE) with ����=0.76 vs. �����=0.55. More examples are given in
this paper to show the contrast between the larger ���� and the smaller values of ��� from shear
modulus G* measured by mechanical relaxation in a number of polar glass-formers.
Körber et al.[19] seem to imply that the correlation of ���� with (Tg) from dielectric
spectroscopy is not general because it does not hold when the dynamics is probed by the other
spectroscopies. From their results that the Kohlrausch exponent K for a given substance is method
independent except dielectric spectroscopy (DS), Körber et al.[19] seem to imply that the dynamics
from DS is not fundamental. At the International Dielectric Society Meeting on 30 September
2020, Rössler cited from a referee report of the paper by Körber et al. [19] the following remark:
“After reading this paper I couldn’t help but wonder if we could have saved 20 years of viscous
liquid research if we had not spent so much on dielectric spectroscopy”. These are profound
implications that could undermine the verity of the voluminous amount of data taken by DS and
theoretical interpretations over more than a century, which is currently the technique commonly
used by numerous researchers in glass-forming materials around the world. This unsettling status
of DS imposed by the above remark needs to be addressed and reexamined independently. This is
the purpose of the present paper by going deeper and broader into the experimental data. We
performed shear mechanical modulus G*(f) measurements in several glass-formers and collected
G*(f) and PCS data of other glass-formers from the literature to compare with dielectric relaxation
data. Moreover, we explain why the Kohlrausch exponent K observed by G*(f), PCS and NMR
are smaller than ���� by DS in highly polar glass-formers with large ���� and (Tg). The key to
the explanation is the presence of the JG -relaxation lying close by the -relaxation according to
Eq.(2) because of the larger value of ���� close to 1. It has low dielectric strength compared to the
dominant -relaxation. The two factors combined make it unresolved in the dielectric spectra. It
does not affect the main part of the frequency dispersion of the -relaxation and the value of ����
in the fit by the Fourier transform of the Kohlrausch function. On the other hand, when measured
by the other spectroscopies, the relaxation strength of the -relaxation relative to the JG -

4
relaxation is substantially reduced. Consequently, the width of -relaxation becomes broader due
to the overlap with the relatively higher level of the JG contribution, resulting in smaller values
of the Kohlrausch exponent K in the other spectroscopies than ����. Thus the larger ���� of highly
polar molecules found by DS truly reflects the frequency dispersion and the dynamics of the -
relaxation of the polar molecular glass-formers, whereas the results are muddled in the spectra
measured by the other methods.
The less polar glass-formers have smaller values of ���� according to the correlation of ����
with (Tg) [15]. The combination of this with Eq.(2) means that the JG -relaxation is widely
separated from the -relaxation. Thus the former has little or no bearing on the frequency
dispersion or the Kohlrausch exponent K of the latter, whether measured by dielectric relaxation
or by other methods. Consequently, the frequency dispersion of the -relaxation seen by DS and
the other methods is not changed much except for the different correlation functions, and hence K
differs little from ���� , as observed. Examples supporting this explanation include OTP with ����=0.50 [20,21] compared to �����=0.55 [22]; toluene with ����=0.52 and �����=0.52 [19]; and
dimethyl phthalate (DMP) with ����=0.59 and �����=0.60 [19]. More cases are given in the sections
to follow in this paper.
2. CAUSE OF THE BROADENING OF THE -RELAXATION OF POLAR GLASS-
FORMERS WHEN PROBED BY G*, PCS, and NMR
Following the first paper in 1998, the presence of a secondary relaxation having strong connections
with the α-relaxation (with properties including Eq.(2)) has been found in many glass-formers [23].
A notable property of the JG -relaxation is the pressure dependence of its relaxation time JG.
When considering both pressure P and temperature T dependence, Eq.(2) takes the form log��(�, �) − log���(�, �) ≈ [1 − ��(�, �)][log��(�, �)/��]. (3)
A general property found by DS is the co-invariance of log��(�, �) − log���(�, �) and ��(�, �)
to variations of P and T while keeping ��(�, �) constant. The term JG -relaxation was chosen for
such secondary relaxation to distinguish it from other and usually intramolecular secondary
relaxations. The JG -relaxation is predicted to be present in all glass-formers since the
omnipresent primitive relaxation of the CM is a part of the distribution of processes in the JG -
relaxation, and the primitive relaxation time 0 is approximately equal to the most probable JG -
relaxation time JG, i.e., JG0.[24] This approximate relation was one of the criteria commonly
used to check if a resolved secondary relaxation is the JG -relaxation or not. For those polar and
highly polar glass-formers with larger ����, the JG -relaxation is not resolved because (log�� −log���) according to Eq.(2) is small, and hence it is not well separated from the dominant -
relaxation. Nevertheless, the dielectric loss data cannot be accounted for entirely by the Fourier
transform of a Kohlrausch function. There is an excess loss on the high-frequency flank of the
Kohlrausch fit, and in addition an excess wing shows up at higher frequencies in some cases such
as propylene carbonate, glycerol [25], quinaldine [26], and picoline [27]. The excess wing should be
distinguished from the nearly constant dielectric loss (f) f- with small and positive, which
is due to loss while molecules are mutually caged by the anharmonic intermolecular potential.
There are several facts supporting that the excess loss and the excess wing come from the
unresolved JG -relaxation. (1) Long-term aging experiments performed on propylene carbonate,
propylene glycol and glycerol [28,29] show the excess wing was transformed to a broad shoulder

5
making the JG -relaxation partially resolved. (2) The relation in frequency of the excess
loss/excess wing to the -loss peak remains unchanged with variations of P and T while the -loss
peak frequency is kept constant in propylene carbonate, aroclor (polychlorinated biphenyls), salol,
and other polar and highly polar glass-formers, in accord with the property of JG -relaxation
given by Eq.(3). (3) The separation in frequency between the excess wing and the -loss peak
agrees with that calculated by the right-hand-side of Eq.(2) using the dielectric ���� for �� therein.
(4) Highly polar glass-formers with larger ���� such as quinaldine [ 30 ], picoline [ 31 ], and
cyanobenzene [32] have no resolved secondary relaxation at all, and methyltetrahydrofuran (MTHF)
[33,34] and diethyl phthalate (DEP) [47] have a non-JG secondary relaxation. A JG -relaxation
belonging to all of these glass-formers was resolved by mixing with a higher Tg non-polar
component. These experiments indicate the JG -relaxation is present in these highly polar glass-
formers but not resolved due to weak intermolecular interaction revealed by larger values of ����.
From the narrative given above, we postulate the presence of an unresolved JG -relaxation
in polar and highly polar glass-formers having dielectric strength small compared to the -
relaxation. It shows up as the excess loss/excess wing on the high-frequency flank of the narrow
dielectric -loss peak. Notwithstanding, it does not alter the frequency dispersion of the -
relaxation, and thus the dielectric Kohlrausch exponent �� truly reflects the dynamic
heterogeneity and cooperativity of the -relaxation. With this done, we are ready to suggest the
cause of the dramatic broadening when probed by shear modulus (SM), PCS and NMR. A priori,
there is no reason to expect the responses of the JG -relaxation relative to the -relaxation
observed in susceptibility by DS is exactly preserved when probed by any of the other methods
simply because the correlation functions are different. Moreover, dielectric susceptibility * is
compliance and shear mechanical G* is the modulus, and the difference is another reason for
expecting a change. As we shall show by actual dielectric data, the much larger strength (Tg) of
the -relaxation relative to JG(Tg) of the unresolved JG -relaxation in polar glass-formers
shown in permittivity becomes much reduced when represented in electric modulus, resulting in
broadening of the former by the latter. Therefore a heuristic explanation of the broader -relaxation
observed by the other methods than DS in polar glass-formers is a decrease of the relaxation
strength of the -relaxation relative to that of the JG -relaxation. The reduction of the relaxation
strength of the -relaxation when probed by the other methods with little or no change of the JG
-relaxation is plausible. This is because the cooperative many-body -relaxation is more sensitive
to change of correlation function and/or change from compliance to modulus than the JG -
relaxation. This heuristic explanation needs to be tested by experimental data. The results are
presented in the following sections.
3. EXPERIMENTAL VERIFICATIONS
We have proposed a heuristic explanation of why the narrow dielectric -loss peak with large ����
at temperatures near Tg of polar glass-formers becomes a broader loss peak with smaller K when
probed by the other methods. In supporting this explanation, we have made new dielectric and
shear modulus measurements of several glass-formers, and also have collected and reanalyzed
previously obtained data. All the polar glass-formers showing the difference in -relaxation
dispersion of dielectric and PCS considered by Körber et al. are covered here. Additionally, we
added more cases not included in their paper. The results are reported below, and the explanation
is reiterated wherever deemed necessary.

6
3.1 Highly Polar Glass-formers
We have mentioned that the ratio of the relaxation strengths of the and JG relaxations
of polar glass-formers with large =(0-) can be reduced when either represented by electric
modulus or permittivity, resulting in a broader modulus loss peak. The most direct test is to
compare *(f) with the electric modulus M*(f) =1/*(f). Actually *(f) and its time domain
correspondent (t) should be referred to as dielectric retardation. The true dielectric relaxation is
the modulus M*(f) and M(t). M(t) can be directly determined by measuring the time decay of the
electric field E(t)~M(t) under constant charge conditions, as demonstrated by Wagner and Richert
in poly(vinylacetate) and cresolphthaleine-dimethyl-ether (KDE), and hence also M*(f) is obtained
directly after Fourier transformation [35,36] Thus one can obtain M*(f) either indirectly from 1/*(f)
or directly from M(t) after Fourier transform, and the result should be the same as demonstrated
by Wagner and Richert.
3.1.1 Cresolphthaleine-dimethyl-ether (KDE)
The fact that the same M*(f) is obtained either indirectly from 1/*(f) or directly from M(t)
after Fourier transform is verified by the several independent studies of KDE, a highly polar glass-
former having dielectric =20 and ����=0.75. The M(t) data of KDE from Richert and Wagner
has time dependence well described by the Kohlrausch function (Eq.1) with ���=0.57 (see Fig.1B),
while M*(f) obtained from 1/*(f) by Paluch et al. was fitted by the Fourier transform of nearly the
same Kohlrausch function with ��� =0.58 (see Fig.1A) [ 37 ]. The data of G(f) at the same
temperature show a slightly narrower M*(f) loss peak, and the Kohlrausch function used to fit has ���=0.60. The time dependence of the VH light scattering intensity autocorrelation functions from
Kahle et al. [38] were fitted to the Kohlrausch function. The exponents �����(�), shown in Fig. 1C,
decrease with temperature and assume the value of �����=0.51 at 318 K. The correlation function
of PCS is the third order Legendre polynomial and the susceptibility ����,, (�) is a compliance and
not modulus. Nevertheless, it is much broader than (f) and its �����=0.51 is significantly smaller
than ����=0.76. More comparison of ����,, (�) data from PCS with (f) and M(f) of polar glass-
formers will be given later.
In Fig.1D we compare the (f), M(f), and G(f) data of KDE at 318 K. Compared with
*(f), it is well known that M*(f) is shifted to higher frequencies by a factor of about s/. To
observe the decrease of the relaxation strength of the -relaxation with little or no change of the
JG -relaxation in M(f) and G(f), we shift the M(f) data vertically as well the scaled G(f) data
to superpose their high frequency data with that of (f). The (f) together with the vertically
shifted M(f) and G(f) are presented in Fig.1D. It shows, when probed as electric modulus or shear
modulus, the maximum of the -loss peak in (f) is reduced by about one decade in M(f) and
G(f), while the excess loss/excess wing representing the unresolved JG -relaxation is unchanged.
Hence when KDE is probed by electric modulus M(f) or shear modulus G(f), the -loss peak is
distorted by the presence of by the JG -relaxation. The shift of the -loss peaks of M(f) and G(f) to higher frequencies from that of (f) by the factor s/ is slightly larger than one decade. The
shift reduces the separation of the -relaxation from the JG -relaxation, and it also enhances the
merge of the latter with the former. Consequently, the -loss peaks of M(f) and G(f) become

7
broader than that found in (f), and explains why the Kohlrausch exponents ��� =0.58 and ���=0.60 are smaller than ����=0.76 (see Fig.1A).
3.1.2 Phenylphthalein-dimethylether (PDE) Phenolphthalein-dimethyl ether (PDE)
The difference between (f) and the electric modulus M(f) and shear modulus G(f) in
the frequency dispersion and strength of the -loss peak of KDE is general for all highly polar
glass-formers, and we have more data to show. Fig. 2A shows (f) and M(f) data of
phenylphthalein-dimethylether (PDE) at T=301 K. G(f) data are not available. PDE has =17.5,
similar to =20 for KDE. In the upper panel, the M(f) data are shifted vertically to show: (i) the
frequency dependence of the excess loss/excess wing representing the JG -relaxation is the same
as in (f), (ii) there is about one-decade reduction of the intensity of the -loss peak and (iii) there
is about one decade shift to higher frequencies. The similarity in the relation of the shifted M(f) to (f) in PDE and KDE goes together with the comparable values of ����, 0.79 for PDE and 0.76
for KDE. The normalized (f) and M(f) data of PDE at T=301 K are compared in Fig. 2B. The
Kohlrausch fit of M(f) needs a value of ��� equal to 0.53 or 0.55. PCS measurements of PDE
were performed by Kahle et al. [38]. As shown in the inset the Kohlrausch exponent ����� is
temperature dependent and the value of 0.51 at 301 K is close to ��� of M(f). This suggests that
the cause of the broader dispersion of the -relaxation seen by PCS than by dielectric spectroscopy
is the same as M(f).
3.1.3 Polychlorinated biphenyl (Aroclor1242)
Polychlorinated biphenyls known also as Aroclor is another highly polar glass-former
having a narrow dielectric loss peak. The dielectric loss spectra of Aroclor 1242 [39] are shown in
Fig. 3A at 224 K near Tg=221 K and at a higher temperature of 249.1 K. The fits by the Kohlrausch
functions yield ����=0.68 at 224 K, and 0.70 at 249.1 K. The corresponding electric modulus M(f) loss peak becomes broader as shown by comparing with (f) after normalizing by the maxima and
compensating the shift of M(f) to higher frequencies. The values of ��� for M(f) is 0.55 at 224
K, and 0.63 at 249.1 K. Newly acquired shear modulus data of G(f) at 224 K are included in the
lower panel to show the -frequency dispersion is the same as M(f) and the Kohlrausch exponents ��� and ��� are equal to 0.55. Thus the broadening seen in G(f) is explained by the decrease of the
relaxation strength of the -relaxation relative to the JG -relaxation. Plazek et al.[40] made shear
recovery compliance Jr(t) measurements of Aroclor 1248 having a slightly higher molecular
weight than Aroclor 1242 and Tg two degrees higher. From the measurements, the complex
dynamic compliance was computed. The imaginary part, �" − 1/��, shown in Fig. 3C is fitted by
the Fourier transform of the Kohlrausch function with ��� =0.54. The agreement of ��� =0.54 with ��� and ��� =0.53 indicates that mechanical spectroscopies (employing either the modulus or
compliance modes) broaden the α-relaxation in the same way. PCS was performed by Rizos et al. [41] on Aroclor 1242 at temperatures near 249.1 K and
higher but not at lower temperatures. The value of ����� reported is 0.64 and temperature
independent, which is practically the same as 0.63 for ��� and we made this clear in Figure 3. The
agreement between �����and ��� is like that found in Fig.2 for PDE. It indicates that the broadening
of the -relaxation seen in dielectric permittivity when probed by PCS is due to a decrease of the

8
relaxation strength of the -relaxation relative to the unresolved JG -relaxation close by, enabling
the latter to broaden the frequency dispersion of the former.
3.1.4 Glycerol
The most studied highly polar molecule is glycerol with large of over 60. The dielectric
-loss peak in (f) is narrow and the value of the Kohlrausch exponent ���� at 189 K is 0.71. The
frequency dispersion of the -loss peaks in M(f) at the same temperature and in the shear modulus
G(f) at 192.5 K from Schröter and Donth [42] are compared in Fig. 4, and are found to be identical.
Both are much broader than that of (f), with their K-exponents ���and ��� having the value of
0.44. The agreement in the frequency dispersion of the -relaxation from M(f) and G(f) was also
found by Gabriel et al. [43] in glycerol at 200 K. They also compared data from PCS and DS. The
comparison reproduced by the inset of Fig. 4 shows the narrow DS -relaxation with ����=0.70
and the broader PCS one with ����=0.55 at 200 K. The arrow indicates the location of the dielectric
primitive relaxation frequency f0fJG calculated by Eq.(2) with ����=0.70. Moreover the maximum
of the PCS -loss peak is reduced by a factor of 6 from that of DS, while the high frequency excess
loss/excess wing representing JG -relaxation are unchanged. This change of the relation of the
to the JG -relaxation when glycerol is probed by PCS in lieu of DS is like the corresponding
change of KDE and PDE when probed by M(f) and G(f) to replace DS. Hence the same
explanation applies.
3.1.5 Tributyl phosphate (TBP)
The family tributyl phosphate (TBP), triethyl phosphate (TEP), and triphenyl phosphate
(TPP) are highly polar glass-formers. TBP has =140 and narrow dielectric -loss peak as shown
in the upper panel of Fig.5 and the Kohlrausch fit requires a large ����=0.84 and similar values for
the other members (shown in Fig.S1 for TEP and Fig.S2 for TPP) [44,45,46]. This property is like
KDE, PDE, aroclor, and glycerol, as well as the other highly polar glass-formers [16,17] conforming
to the correlation of ����with found [15]. However unlike KDE, PDE, and glycerol, TBP and
the other members have a prominent dielectric secondary -relaxation but it is not the JG -
relaxation, which is unresolved as suggested by the location of the primitive frequency f0 at 146 K
indicated by the arrow in the figure. This difference of TBP and other examples such as diethyl
phthalate [47], dibutyl phthalate [48], and higher members. TBP and the others do not fall into the
class of the so called “type A glass formers”, defined as liquids with dielectric spectra that do not
display a discernible secondary relaxation peak (-relaxation) at temperatures above Tg [49].
Nevertheless these polar glass-formers have larger ���� and correlate with as well.
The comparison of the frequency dispersion of the -loss peak from (f) and M(f) shows
the reduction of the relaxation strength of the -relaxation relative to the excess loss representing
the unresolved JG -relaxation as well as the resolved non-JG -relaxation. This is the cause for
the broader -loss peak in M(f). In the lower panel of Fig. 5 we compare M(f) with the
susceptibility (f) from PCS (or DLS) obtained by Pabst et al., which has �����=0.49 [46]. There
is excellent agreement in frequency dependence between M(f) and (f), and hence the difference
of the -relaxation when probed by DLS from (f) is explained in the same way as for M(f).

9
3.1.6 Tripropylene glycol (TPG), Methyl tetrahydrofuran (MTHF), Diglycyl ether of
bisphenol (DGEBA), Tricresyl phosphate (TCP), α-phenyl o-cresol
These polar glass-formers except TPG all have unresolved JG -relaxation, and some like
MTHF has a fast -relaxation. The values of for TPG, MTHF, DGEBA, TCP, and α-phenyl o-cresol in decreasing order are 20, 18.6, 7, 5.6, and 3.4 respectively. These glass-formers are chosen
because in addition to (f) and M(f) data either G(f) or PCS data are available to compare with.
The data shown in Panels A-F of Fig. 6 for TPG [50], MTHF [33], DGEBA [51], TCP [52], and -
phenyl o-cresol [52]. The smaller value ���=0.41 than ���=0.48 of TPG is explained by lesser
sensitivity of shear modulus than electric modulus. The PCS data of MTHF, TCP, and -phenyl
o-cresol are not reproduced from the publications except their respective ����� values of 0.60, 0.51,
0.55, and 0.54. The approximate agreement of ����� =0.55 with ��� =0.56 in TCP as well as �����=0.54 with ���=0.50 in α-phenyl o-cresol is worth notice for supporting the explanation given. In the case of DGEBA, Panel C of Fig.6 show good agreement in the frequency dispersion
of the -loss peak between G(f) at 253.5 K and M(f) at 256 K with both having the same
Kohlrausch exponent, ���=0.46=���. At 261 K, the lowest temperature of the PCS experiment [53],
the value of ����� is 0.51, while it is 0.55 at 263 K. The temperature dependence of ����� makes
uncertain its value at 253.5 K, ten degrees lower, to compare with ���(253.5 K)=0.46. On the other
hand, the -loss peak in (f) at 257 K is narrower with larger ����=0.53 [54].The arrow in Panel D
of Fig.6 indicates the dielectric primitive relaxation frequency f0fJG calculated by Eq.(2) with ����=0.53. The fact that f0 is much higher than the -loss peak frequency suggests the broadening
in going from (f) to M(f) or G(f) and (f) from PCS is not large. This is consistent with the
small difference between �����=0.51 and ����=0.53.
3.1.7 New (f), M(f), and G(f) experimental data of highly polar glass-formers
To bolster the experimental support of the explanation, we made new measurements of
G(f) over the range, 10-2<f<20 Hz, of several highly polar glass-formers for which (f) were also
measured and represented together in Figure 7. These include propylene carbonate (PC) and three
van der Waals liquids, S-methoxy PC, 4-vinyl-1,3-dioxolan-2-one (VPC) and 4-ethyl-1,3-
dioxolan-2-one (EPC), have chemical structures modified from that of PC). The dielectric
measurements of PC-derivatives were carried out over a frequency range from 10-3 Hz to 107 Hz
by means of Novo-Control GMBH Alpha dielectric spectrometer. The temperature was controlled
by the Novo-control Quattro system with the accuracy of 0.1 K. During this measurement, the
sample was placed between two stainless steel electrodes (diameter = 15 mm). The distance of
0.098 mm was provided by the quartz ring. The mechanical properties of PC-derivatives were
measured by means of an ARES G2 Rheometer. The shear modulus measurements in the vicinity
of liquid-glass transition were performed by means of aluminum parallel plates geometry
(diameter = 4 mm).
The width of the dielectric -relaxation in S-methoxy PC is narrowest and its value of 0.85
for ���� at Tg is the largest recorded for highly polar glass-formers consistent with its large =230.
Dielectric loss peaks of the other three systems are slightly broader with ���� equals to 0.75 and
smaller in the range from 58 to 70. The corresponding M(f) calculated from (f) are compared
with G(f) for all four glass-formers in Figure 7. Again the -relaxation frequency dispersion of
M(f) and G(f) are broader than that of (f), and the values of ��� and ��� are smaller. More

10
important is the reduction in the relaxation strength of the -loss peak relative to the excess loss
representing the unresolved JG -relaxation when represented by M(f) or measured in terms of
G(f). The (f) changes by more than two decades from the -loss peak to the excess wing. By
contrast, the corresponding change in M(f) and G(f) is about one decade. Again the difference
means that the -relaxation seen by dielectric relaxation and characterized by the larger ���� is real
because it is not modified by the much weaker JG -relaxation despite the latter is close by. On
the other hand, the broader modulus peaks characterized by smaller ��� and ��� is unreal because
of the reduction in the disparity between the relaxation strengths of the two processes.
We made dielectric (f) and shear modulus G(f) measurements of novivamide with
chemical structure different from PC and PC derivative. The comparison of M(f) and G(f) with
(f) in Figure 7F supports once more the explanation of the difference given before for the other
polar glass-formers.
3.2 Weakly Polar Glass-formers
There is a great opportunity to test the explanation of the broadening of the -relaxation of
polar glass-formers when probed by shear modulus and PCS in lieu of dielectric permittivity (f). It is the opposite behavior expected from glass-formers not having any secondary relaxation or
conformational transition located nearby the dielectric -relaxation, a condition which is usually
fulfilled by weakly polar glass-formers with low . Moreover, according to Eq.(3) the separation
of the JG -relaxation from the -relaxation is proportional to (1-����), the test is best carried out
in weakly polar glass-formers with smaller ���� or wider dielectric -loss peak. Since the JG -
relaxation is the slowest among secondary relaxations, the condition guarantees the non-JG -relaxation if present will be further away from the -relaxation. With the JG -relaxation far away
from the -relaxation, the change in representation of dielectric data from (f) to M(f) will not
alter the frequency dispersion of the -loss peak. This is because the JG -relaxation has either no
or minimal effect on the frequency dispersion of the -loss peak on changing from (f) to M(f), by contrast with polar glass-formers. The G(f) from shear modulus measurement and (f) from
PCS are expected to have approximately the same frequency dispersion as (f) and M(f). We
carried out the test of the expected behavior of weakly polar glass-formers by analyzing dielectric,
shear modulus, and PCS data of some weakly polar glass-formers. The results are reported in the
subsections to follow. Körber et al. [19] had already shown the dielectric ���� is comparable in
value to either the PCS ����� or the NMR ����� in the better known non-polar glass-formers
including OTP, trinaphthal benzene, and toluene. All these three weakly polar glass-formers have
smaller ���� of about 0.50 and the JG -relaxation is widely separated from the -relaxation. Hence
it does not broaden the -relaxation when probed by PCS and NMR.
3.2.1 1,1-bis (p-methoxyphenyl) cyclohexane (BMPC)
BMPC was also known before as bis-phenol-C-dimethylether (BCDE) has =1.45 not as
low as the ideal non-polar glass-formers like OTP, tri-naphthyl benzene (TNB), and toluene. The
(f) data were taken from Hensel-Bielowka et al. [55], and not from the earlier work by Meier et
al. [56] This is because in the later work, the Kohlrausch fit to the data was done in the same way
as the other glass-formers in this paper, giving the value of ����=0.60. On the other hand, the fit in

11
the earlier work was not shown and a smaller value of 0.51 was reported, and used by Körber et
al. [19]. The calculated M(f) at 246 K are presented in Fig. 8A. The M(f) data are shifted vertically
to have the excess loss in M(f) coalescing with that in (f) like done before for KDE in Fig.1D.
The difference in the height of the -loss peak between the shifted M(f) and (f) is a factor of
1.5 compared to 10 in the case of KDE. The width of the -relaxation in M(f) is still larger than
in (f) as reflected by ���=0.53 compared to ����=0.60 [55]. The PCS data we consider are not
from Meier et al. but from a later work published by the same group in Mainz by Patkowski et al.
[57], again because the more accurate data and analysis performed. The value of ����� for PCS
decreases on lowering temperature and by extrapolation of the trend its value at Tg=247 K is
estimated to be 0.52-0.53 [57]. Hence there is good agreement between ���=0.53 and �����=0.52-
0.53 of BMPC, in accord with the prediction.
3.2.2 1,1-bis(p-methoxyphenyl) cyclohexane (BMMPC)
The glass-former BMMPC, also referred to in the literature as bis-kresol-C-dimethylether (BKDE)
is closely related in chemical structure to BMPC and its Tg is 263 K. It has =0.82 and the value
of 0.55 for the dielectric Kohlrausch exponent ���� at 264.1 K [58]. The smaller value of ����=0.55
implies the JG -relaxation is widely separated from the -relaxation. The dielectric loss (f) at
271 K is shown in Fig. 8B together with the calculated M(f). The vertically shifted M(f) remarkably has the same frequency dependence as (f) except for the slight horizontal shift due
to change from susceptibility to modulus. This feature validates the prediction of no broadening in
going from (f) to M(f) because the JG -relaxation is well separated from the -relaxation and
has no effect in broadening the -relaxation in M(f). PCS data of BMMPC were published by
Patkowski et al.[57]. The PCS Kohlrausch exponent ����� is temperature dependent with values
decreasing with falling temperature in the range 0.53 – 0.62. There is good agreement between ����= 0.55 and �����=0.53 at temperatures near Tg=263 K, and this result provides strong support
of the prediction.
3.2.3 Polyphenyl ether (PPE)
The value =1.45 of PPE is nearly the same as BMPC. The frequency dispersions of the
-loss peaks in (f), M(f), and G(f) are compared in Fig. 8C. From the Kohlrausch fits, the
values of the exponents ���� , ��� , and ��� are 0.62, 0.56, and 0.58 respectively. Thus the -
relaxations in M(f), and G(f) have effectively the same frequency dispersion, and it is slightly
narrower in (f). The situation is similar to BMPC.
3.2.4 Tetramethyltetraphenyltrisiloxane (DC704)
The value =0.2 of DC704 is an order of magnitude smaller than BMPC and PPE, and
should be a better candidate to test the expected behavior. The frequency dispersions of the -loss
peaks in (f), M(f), and G(f) from Ref.[59] are compared in Fig. 8D. The frequency dispersions
of (f) and M(f) are identical, and the exponents ����and ���are equal to 0.57. The equality is
testament to the prediction of no change in the frequency dispersion in going from (f) to M(f) when the JG -relaxation is far away from the -relaxation. Moreover, the frequency dispersion
in G(f) is only slightly broader with the exponent ���=0.53, a bit lower than 0.57 of ����and ���.

12
By the way, the -loss peak in (f) from PCS measurements on DC704 has the same frequency
dispersion as in (f) and G(f) [60]. Thus we have overwhelming evidences from DC704 to validate
the predicted difference in the behavior of non-polar glass-formers than polar glass-formers when
probed by methods different from dielectric susceptibility.
3.2.5 Polybutadiene
The polymer polybutadiene (PB) with molecular weight of 5000 g/mol has =0.15 was
studied by dielectric and shear modulus. [50] The frequency dispersion of the -loss peaks in (f) and G(f) are shown in Fig. 9B together with M(f) we calculated from *(f). The frequency
dispersions of (f) and M(f) are identical, and the exponents ����and ���are equal to 0.35. Such
a small value of ���� leads to JG -relaxation widely separated from the -relaxation, and is ideal
for testing the prediction. It follows that the JG -relaxation has no effect in changing the frequency
dispersion of the -relaxation in going from (f) to M(f). Moreover, the frequency dispersion in
G(f) is only slightly narrower with the exponent ���=0.40, slightly larger than 0.35 of ����and ���.
Like DC704, the data of polybutadiene provide strong support for the prediction for weakly polar
glass-formers.
3.2.6 Poly(methylphenylsiloxane) (PMPS)
PMPS is another weakly polar polymer. Dielectric permittivity measurements on a sample
with a molecular weight of 23360 g/mol were made by Paluch et al. [61]. PCS measurements on a
slightly higher molecular weight of 28500 g/mol were made by Boese et al. [62]. The (f) data at
247 K and the calculated M(f) are shown in Fig. 9A together with the vertically shifted M(f). The
frequency dispersions of the -relaxation in (f) and M(f) are almost the same as evidenced by
the Kohlrausch fit to (f) and M(f) with exponents ����=0.51 and ���=0.50 respectively. The
maximum of the shifted M(f) is reduced from that of (f) by a small factor of 0.88. The PCS
Kohlrausch exponent ����� reported by Boese et al. at the lowest temperature of 253 K has the
value of 0.52 close to ���� =0.51 and ��� =0.50 from (f) and M(f). Hence the frequency
dispersion of the -relaxation is practically unchanged in (f), M(f), and PCS in PMPS. This is
consistent with our prediction since the Kohlrausch exponents are smaller and the JG -relaxation
is widely separated from the -relaxation as suggested by the location of the primitive relaxation
frequency f0 in Fig.9A.
3.2.7 Perhydrosqualene (Squalane)
Squalane has the smallest among the examples given. The value is 0.009 according to
Richert et al. [63] and 0.015 from Jakobsen et al. [50]. The frequency dispersions of the -loss peaks
in (f) and G(f) from Ref.[50] are compared in Fig. 8E together with M(f) we calculated from
*(f). On first look, it seems the -loss peaks in (f), M(f), and G(f) are all the same. Indeed the
frequency dispersions of (f) and M(f) are identical, and the exponents ����and ���are equal to
0.52. The one in G(f) is almost the same with ���=0.50. Like DC704 and polybutadiene, the data
of squalene fully verify the prediction that the frequency dispersion of weakly polar glass-formers
with smaller dielectric ���� is not broadened when probed by shear modulus or PCS.

13
4. DISCUSSION AND CONCLUSION
A serious challenge to the verity of the dynamics of polar glass-formers obtained by dielectric
permittivity spectroscopy (DS) was issued by the recent publications by Körber et al. [19], Gabriel
et al. [43], and Pabst et al. [46]. The basis of the challenge is the narrow frequency dispersion of
the intense dielectric -loss peak in (f) becomes much broader when the same material is probed
by other spectroscopies including PCS (depolarized light scattering) and NMR [19,46] and also
shear mechanical modulus G(f) in the case of glycerol [43]. The exponent ���� of the Kohlrausch
fit to the dielectric loss peak in (f) is significantly larger than the exponents, �����, �����, and ��� of the other spectroscopies. We confirmed the observation of this discrepancy in polar glass-
formers by more examples from the literature as well as by making our own dielectric *(f) and
G*(f) measurements on additional compounds. On the other hand, the relaxation times ���� of DS,
though different from ����� and ��� due to the difference in correlation functions, all have similar
temperature dependence. Moreover, this discrepancy does not occur in non-polar glass-formers
where the width of the dielectric is approximately the same as those of the others, i.e., ���� is about
the same as the other exponents.
As it stands, the general finding casts serious doubt on the verity of the narrow frequency
dispersion and the large value of ���� of polar glass-formers taken by dielectric spectroscopy.
Potentially it also questions the worth of dielectric spectroscopy in the study of the dynamics of
glass-formers, and validity of the results from DS accumulated over the past hundred years, as well
as the recently found correlation of ���� with found by Paluch et al. [15] and repeatedly verified
by others [19,18]. The seriousness of the situation requires an in-depth consideration of the
dynamics of polar glass-formers, not only the structural -relaxation but also the presence of the
accompanying and universal JG -relaxation. Empirically the excess loss/excess wing in (f) data
of polar glass-formers indicates the JG -relaxation is present although unresolved, and it is located
nearly the -relaxation on its high-frequency flank. This property of the JG -relaxation as seen
by DS is consistent with the correlation of log(/JG) with (1-K) given by Eq.(3) from the
Coupling Model (CM). The dielectric strength of the unresolved JG -relaxation is small compared
to the -relaxation. Thus it has no effect on the full-width at half-maximum of the frequency
dispersion of the -relaxation or the value of the exponent ���� of the Kohlrausch fit. Thus the
larger value of ���� from dielectric permittivity truly characterizes the dynamics of the -
relaxation of polar glass-formers.
It is important to consider not just the change of the -relaxation alone but also the JG -
relaxation altogether when going from (f) of dielectric permittivity of polar glass-formers to G(f) of shear modulus or (f) of PCS and NMR. The changes in the relaxation strengths of the two
processes are not necessarily uniform. Thus the narrow frequency dispersion of the -relaxation
seen in (f) can change substantially when probed by the other spectroscopies. We substantiate
this possibility by changing the representation of dielectric measurements from (f) to the electric
modulus M(f). For the polar glass-formers, we found the narrow frequency dispersion of the -
loss peak in (f) becomes a broad peak in M(f). The cause is traced to the larger reduction of the
dielectric strength of the -relaxation relative to that of the JG -relaxation. Since the two
relaxations in polar glass-formers are not widely separated already in (f), the disparity in the
changes of their relaxation strengths in conjunction with the additional decrease in the separation
of their relaxation time give rise to the broadening of the -loss peak in M(f). This explanation of
broadening of the -relaxation in M(f) applies verbatim to G(f) since both are modulus and is

14
supported by M(f) and G(f) from experiment having either nearly the same frequency dispersion
in a number of glass-formers shown in Figs.1-7. So is the good agreement of (f) from PCS with
M(f), or the Kohlrausch exponents ����and ����� being about the same, in some glass-formers. By
explaining the broadening of the dielectric -loss peak of polar glass-formers when probed by
other techniques, we have two crucial conclusions. The narrow width of the dielectric loss peak in
(f) and the associated larger ���� truly reflect the heterogeneous and cooperative molecular
dynamics of the -relaxation in polar glass-formers because it is unaffected by the much weaker
JG -relaxation despite it is nearby. Thus there is nothing wrong with dielectric spectroscopy in
applying it to study the dynamics of polar glass-formers. By contrast, the broadened ‘’-relaxation
observed by G(f) or by PCS and NMR has the -relaxation admixed with the JG -relaxation,
and its smaller exponents, ��� , �����, and �����do not characterize the genuine -relaxation of
polar glass-formers. In other words, for polar glass-formers having narrow dielectric -loss peak
and larger ����, the broader frequency dispersion of the -relaxation deduced from shear modulus,
PCS, and NMR are not factual. Needless to say, the correlation of ����with found by dielectric
spectroscopy and the theoretical rationalization [15] remain valid.
We can show the large value of ���� =0.70 for glycerol from dielectric permittivity is
realistic by comparing it with the values of ���� of the higher members of the polyalcohols, threitol,
xylitol, and sorbitol. The systematic decrease of the dielectric ���� from 0.70 for glycerol, 0.64 for
threitol, 0.54 for xylitol, and 0.48 for sorbitol correlates with the increase in fragility index m
(glycerol: m=57, threitol; m=79, xylitol; m=94, and sorbitol: m=128) [64] in accord with that
proposed by Böhmer et al. [65]. However, the correlation is lost if one replaces ����=0.70 for
glycerol by �����=0.55 from DDLS or ���=0.44 from G(f) for glycerol.
The -relaxation is dynamically heterogeneous as demonstrated by multidimensional
NMR, which also determined the length scale of dynamic heterogeneity ξhet [ 66 , 67 , 68 ]. It is
reasonable to expect a correlation of ξhet with the width of the frequency dispersion of the -
relaxation or the size of (1-K). Indeed the correlation was borne out by considering ξhet for glycerol,
o-terphenyl, sorbitol, and poly(vinyl acetate) obtained by multidimensional 13C solid-state
exchange NMR experiments from Reinsberg et al. [69] The values of ξhet are 1.3, 2.2, and 3.7 nm
for glycerol, o-terphenyl, and poly(vinyl acetate), respectively, all determined uniformly at T = Tg
+ 9 K. These values of ξhet correlate with the corresponding values of (1-����) from dielectric
permittivity, which are 0.30, 0.50, and 0.55, all obtained by fitting dielectric measurements by the
Fourier transform of the Kohlrausch function when τα 1 s for the three glass-formers. If the vaue
of ����=0.70 were replaced by ���=0.44 or 0.40 of G(f) from Schröter and Donth [70] and Gabriel
et al.[43] respectively, the correlation no longer exists.
Our explanation of the effect found in polar glass-formers with narrow -loss peak implies
the dielectric -relaxation is not broadened in glass-formers having the JG -relaxation widely
separated from the -relaxation, whether polar or not. According to Eq.(3), the separation distance,
log(/JG), is proportional to (1-����). Hence a corollary of the explanation is the absence of a
significant change of the frequency dispersion in glass-formers with larger (1- ����) or smaller ����.
Molecular glass-formers having smaller ���� and larger log(/JG) are usually non-polar like OTP,
TNB, and toluene, studied before by DS [71,72,73,74], PCS [75,76], shear compliance J(t) [77]. The
dielectric ���� of these three glass-formers have values of about 0.51 close to those of ����� and ��� , and thus verifying the prediction directly. We have more non-polar glass-formers with smaller ����in showing first the broad frequency dispersion of (f) is either unchanged or hardly changed

15
when replaced by M(f). Furthermore, ���� and ��� are nearly the same as ����� or ���, whichever
is available. The amount of data confirm the predicted behavior of weakly polar glass-formers with
smaller ���� to be different from the polar glass-formers with larger ���� , and strengthens the
explanation for the polar glass-formers.
The ubiquitous presence of the JG -relaxation and the inseparable relations of its
relaxation times to that of the -relaxation (Eq.3) supported by many corroborative evidences such
as given in Refs.[33,78,79,80,81,82,83] are critical in restoring the verity of the dynamics obtained by
using dielectric permittivity spectroscopy of polar glass-formers. On the other hand, the presence
of the JG -relaxation and its relations to the -relaxation were not recognized in the papers of
Körber et al. [19,84], Gabriel et al. [43], and Pabst et al. [46], and the consequence is that they were
not able to reach the same conclusion.
ACKNOWLEDGMENTS
We thank Ranko Richert and Manoj K. Saini for sharing their experimental data with us. M.P. is
deeply grateful for the financial support by the National Science Centre of Poland within the
framework of the Maestro10 project (Grant No. UMO2018/30/A/ST3/00323).
Figure 1. Collection of data of cresolphthaleine-dimethyl-ether (KDE). Panel A shows the
frequency dispersions of M(f) and the scaled G(f) are nearly the same and broader than that found
in (f), and explains why the Kohlrausch exponents ��� =0.58 and ��� =0.58 are smaller than ����=0.76. Panel B shows the M(t) data of KDE from Richert and Wagner [36] having time
dependence well described by the Kohlrausch function with ��� =0.57. Panel C shows the
exponents �����(�) of the light scattering intensity autocorrelation functions from Kahle et al. [38]
and assume the value of �����=0.51 at 318 K. Panel D shows the (f), and the vertically shifted
data of M(f), and scaled G(f) data of KDE at 318 K from Ref.[37] showing the large strength of
the -relaxation in (f) is significantly reduced in M(f).

16
Figure 2. Panel A shows data of (f) and M(f) (red and blue scatters, respectively), and the
vertically shifted M(f) data (solid line) of phenylphthalein-dimethylether (PDE) at T=301 K. In
Panel B data are normalized by the loss maxima and the frequencies to show the broader dispersion
in M(f) than in (f) and the ���=0.53-0.55, �����=0.53 (see inset from Ref.[38]), and ����=0.79
at 301 K.
Figure 3. Panel A shows the normalized (f) and M(f) vs. normalized frequency of Aroclor 1242
at a higher temperature of 249.1 K. The exponents ����=0.70 and ���=0.63 from the Kohlrausch
fits are compare with �����=0.64 from PCS data from Rizos et al [41] at about the same temperature.
Panel B compares the frequency dispersions of the normalized (f), M(f) and G(f) at a lower
temperature of 224 K. The exponents from the Kohlrausch fits are ���� =0.68 for (f), and ���=0.55= ��� the same for M(f) and G(f). Panel C shows the imaginary part of the complex
dynamic compliance (red line), �" − 1/��, fitted by the Fourier transform of the Kohlrausch
function with ��� =0.54 (blue line). [40] There is good agreement of ��� =0.54 with ��� and ���=0.53.

17
Figure 4. The normalized M(f) at 189 K from Paluch and the normalized shear modulus G(f) at
192.5 K from Schröter and Donth [42] and the Kohlrausch fit with exponents ���and ��� having the
value of 0.44. The exponents ���� and ����� from dielectric permittivity and PCS at 189 K are 0.71
and 0.52 respectively at 189 K. The comparison made by Gabriel et al. [43] of the narrow DS -
relaxation with ����=0.70 and the broader PCS one with ����=0.55 at 200 K is reproduced by the
inset of Fig.4. The arrow indicates the location of the dielectric primitive relaxation frequency
f0fJG calculated by Eq.(2) with ����=0.70.
Figure 5. Panel A shows the normalized (f) and M(f) vs. frequency at two temperatures 146
and 144 K, and the Kohlrausch fit of (f) at 146 K with ����=0.84. The arrow indicates the location
of the dielectric primitive relaxation frequency f0fJG calculated by Eq.(2) with ����=0.84. Panel B
shows excellent agreement in frequency dependence between the normalized M(f) and (f) from
PCS (or DLS) obtained by Pabst et al. [46], which has �����=0.49.
18
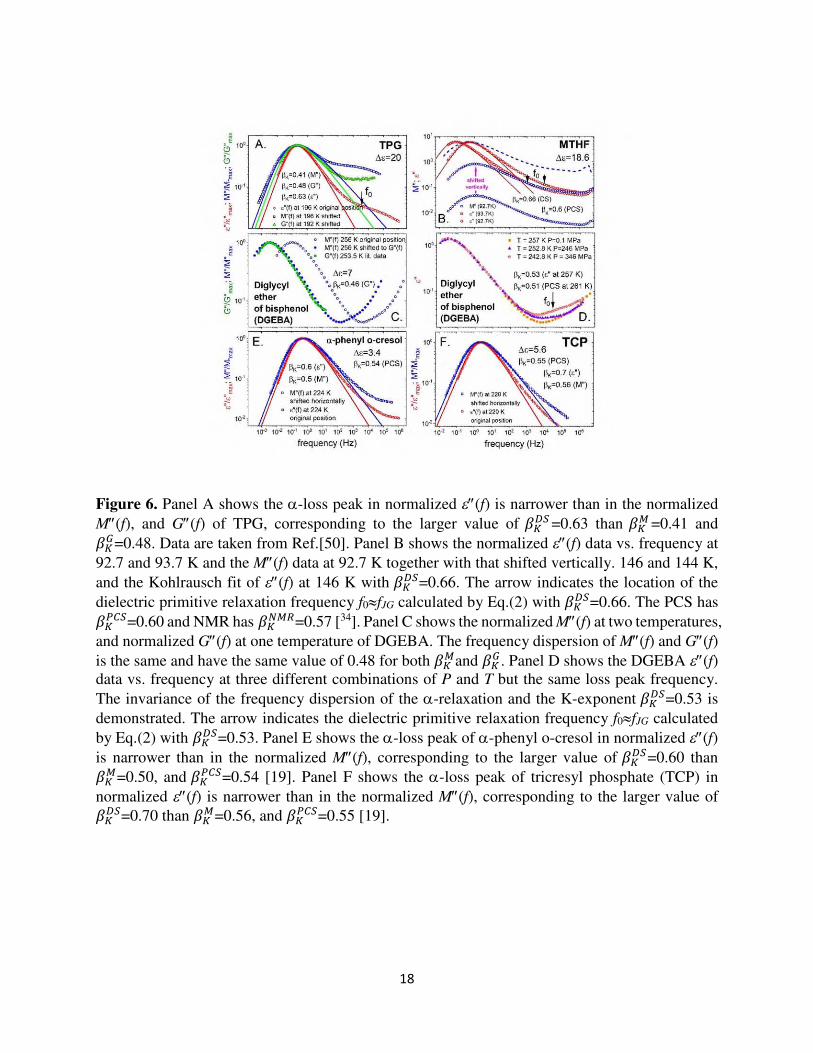
Figure 6. Panel A shows the -loss peak in normalized (f) is narrower than in the normalized
M(f), and G(f) of TPG, corresponding to the larger value of ���� =0.63 than ��� =0.41 and ���=0.48. Data are taken from Ref.[50]. Panel B shows the normalized (f) data vs. frequency at
92.7 and 93.7 K and the M(f) data at 92.7 K together with that shifted vertically. 146 and 144 K,
and the Kohlrausch fit of (f) at 146 K with ����=0.66. The arrow indicates the location of the
dielectric primitive relaxation frequency f0fJG calculated by Eq.(2) with ����=0.66. The PCS has �����=0.60 and NMR has �����=0.57 [34]. Panel C shows the normalized M(f) at two temperatures,
and normalized G(f) at one temperature of DGEBA. The frequency dispersion of M(f) and G(f) is the same and have the same value of 0.48 for both ���and ���. Panel D shows the DGEBA (f) data vs. frequency at three different combinations of P and T but the same loss peak frequency.
The invariance of the frequency dispersion of the -relaxation and the K-exponent ����=0.53 is
demonstrated. The arrow indicates the dielectric primitive relaxation frequency f0fJG calculated
by Eq.(2) with ����=0.53. Panel E shows the -loss peak of -phenyl o-cresol in normalized (f) is narrower than in the normalized M(f), corresponding to the larger value of ����=0.60 than ���=0.50, and �����=0.54 [19]. Panel F shows the -loss peak of tricresyl phosphate (TCP) in
normalized (f) is narrower than in the normalized M(f), corresponding to the larger value of ����=0.70 than ���=0.56, and �����=0.55 [19].

19
Figure 7. Panel A shows the narrow dielectric -loss peaks of propylene carbonate (PC) and the
PC derivatives, S metoxy-PC, EPC, and VPC. The Kohlrausch fits have ���� falling within the
range from 0.75 to 0.86 and correlate with . Panel B shows the normalized M(f) at 186 K, and
the normalized G(f) at 189 K of S metoxy-PC, and the Kohlrausch fits with ���=0.50 and ���=0.60.
Panel C shows the normalized M(f) at 155 K, and the normalized G(f) at 158 K of EPC, and the
Kohlrausch fits with ���=0.41 and ���=0.58. Panel D shows the normalized M(f) at 169 K, and
the normalized G(f) at 171 K of VPC, and the Kohlrausch fits with ���=0.58 and ���=0.58. Panel
E shows the normalized M(f) at 186 K, and the normalized G(f) at 189 K of PC, and the
Kohlrausch fits with ��� =0.45 and ��� =0.60. Panel F shows data of (f) and M(f), and the
vertically shifted M(f) data of the pharmaceutical novivamide at T=255 K, and the Kohlrausch
fits with ����=0.79, ���=0.60 and ���=0.48.

20
Figure 8. Panel A shows the (f) and M(f) data of BMPC at 246 K, and the vertically shifted
M(f). The K-exponents are ����=0.60, ���=0.56, and �����=0.52-0.53 for the -relaxation in (f), M(f), and PCS respectively. Panel B shows the data of BMMPC. Similar to Panel A, and ����=0.55, ���0.55, and �����=0.53. Panel C shows the normalized (f), M(f), and G(f) data of
PPE at 250 K and 248 K, and the Kohlrausch fits with ����=0.62, ���0.56, and ���=0.58. Panel D
shows the normalized (f), M(f), and G(f) data of DC704 at 219.5 K and 217.5 K, and the
Kohlrausch fits with ����=0.57, ���=0.57, and ���=0.53. Panel E shows the normalized (f), M(f), and G(f) data of squalane at 172 K and 170 K, and the Kohlrausch fits with ����=0.52, ���=0.52,
and ���=0.50.
Figure 9. Panel A shows the (f) and M(f) data of the polymer PMPS at 247 K, and the vertically
shifted M(f). The K-exponents are ����=0.51, ���=0.50, and �����=0.52 for the -relaxation in
(f), M(f), and PCS respectively. The arrow indicates the dielectric primitive relaxation
frequency f0fJG calculated by Eq.(2) with ����=0.51. Panel B shows the normalized (f), M(f), and G(f) data of the polymer polybutadiene at 184 K and 180 K, and the Kohlrausch fits with ����=0.35, ���=0.35, and ���=0.40.

21
REFERENCES
1 R. Kohlrausch, Theorie des elektrischen Rückstandes in der Leidener Flasche; von R.
Kohlrausch, Pogg. Ann. Phys. Chem. 91, 179-214 (1854) 2 P. Debye, Ber. Deut. Phys. Ges. 55, 777 (1913) 3 P. Debye, Polar Molecules, Dover, New York, NY (1929) 4 D.W. Davidson, R.H. Cole Dielectric Relaxation in Glycerol, Propylene Glycol, and n‐Propanol J. Chem. Phys. 19 1484 (1951) 5 F. Kremer, A. Schönhals (eds) Broadband dielectric spectroscopy, Springer, Berlin (2003) 6 Lunkenheimer,P.; Schneider, U.; Brand, R.; Loid, A. Glassy dynamics, Contemporary Physics,
41:1, 15-36 (2000) 7 G. P. Johari, M. Goldstein, Viscous Liquids and the Glass Transition. II. Secondary Relaxations
in Glasses of Rigid Molecules J. Chem. Phys. 53, 2372, (1970) 8 S. Hensel-Bielowka, M. Paluch, K.L. Ngai, Emergence of the genuine Johari-Goldstein
secondary relaxation in m-fluoroaniline after suppression of hydrogen-bond-induced clusters by
elevating temperature and pressure J. Chem. Phys. 123, 014502 (2005) 9 K. L. Ngai, R. Casalini, S. Capaccioli, M. Paluch, C. M. Roland Do Theories of the Glass
Transition, in which the Structural Relaxation Time Does Not Define the Dispersion of the
Structural Relaxation, Need Revision? J. Phys. Chem. B 109, 17356 (2005) 10 K. L. Ngai Do theories of glass transition that address only the α-relaxation need a new paradigm? J. Non-Cryst. Solids 351, 2635 (2005) 11 K. L. Ngai and M. Paluch, Classification of secondary relaxation in glassformers based on
dynamic properties, J. Chem. Phys. 120, 857 (2004) 12 S. Capaccioli, D. Prevosto, K. Kessairi, M. Lucchesi, P. Rolla, Relation between the dispersion
of α-relaxation and the time scale of β-relaxation at the glass transition J. Non-Cryst. Solids
353, 3984 (2007); 13 S. Capaccioli, K. Kessairi, M. Shahin Thayyil, D. Prevosto, M. Lucchesi The Johari–Goldstein
β-relaxation of glass-forming binary mixtures, J. Non-Cryst. Solids 357, 251-257 (2011) 14 K. L. Ngai, Relation between some secondary relaxations and the -relaxations in glass-
forming materials according to the coupling model, J. Chem. Phys. 109, 6982−6994 (1998) 15 M. Paluch, J. Knapik, Z. Wojnarowska, A. Grzybowski, and K. L. Ngai, Universal behavior of
dielectric responses of glass formers: Role of dipole-dipole interactions, Phys. Rev. Lett. 116,
025702 (2016). 16 A. Jedrzejowska, K. L. Ngai, and M. Paluch, Modifications of structure and intermolecular
potential of a canonical glassformer: Dynamics changing with dipole-dipole interaction, J. Phys.
Chem. A 120, 8781 (2016). 17 A. Jedrzejowska, Z. Wojnarowska, K. Adrjanowicz, K. L. Ngai, M. Paluch, Toward a better
understanding of dielectric responses of van der Waals liquids: The role of chemical structures,
J. Chem. Phys. 146, 094512 (2017). 18 M. Sahra, M. S. Thayyil, A. K. Bansal, K.L. Ngai, M.K. Sulaiman, G. Shete, S. Hussan K.P.,
Dielectric spectroscopic studies of three important active pharmaceutical ingredients -clofoctol,
droperidol and probucol, J. Non-Cryst. Solids 505, 28-36 (2019). 19 T. Körber, R. Stäglich, C. Gainaru, R. Böhmer, E. A. Rössler, Systematic differences in the
relaxation stretching of polar molecular liquids probed by dielectric vs magnetic resonance and
photon correlation spectroscopy, J. Chem. Phys. 153, 124510 (2020).
22
20 C. Leon and K. L. Ngai, Rapidity of the Change of the Kohlrausch Exponent of the r-
Relaxation of Glass-Forming Liquids at TB or T and Consequences, J. Phys. Chem. B, 103,
4045-4051 (1999) 21 R. Richert, On the dielectric susceptibility spectra of supercooled o-terphenyl, J. Chem. Phys.
123, 154502 (2005) 22 W. Steffen, A. Patkowski, H. Glaesser, G. Meier, E.W. Fischer, Depolarized-light-scattering
study of orthoterphenyl and comparison with the mode-coupling model Phys. Rev. E 49, 2992
(1994). 23 K. L. Ngai, Relaxation and Diffusion in Complex Systems, Springer, N.Y. (2011). 24 K. L. Ngai and M. Paluch, Inference of the Evolution from Caged Dynamics to Cooperative
Relaxation in Glass-Formers from Dielectric Relaxation Data, J. Phys. Chem. B, 107, 6865-
6872 (2003) 25 U. Schneider, P. Lunkenheimer, R. Brand, and A. Loidl, Dielectric and far-infrared
spectroscopy of glycerol J. Non-Cryst. Solids 235-237, 173 (1998). 26 K. Kessairi, S. Capaccioli, D. Prevosto, S. Sharifi, P. Rolla, Effect of temperature and pressure
on the structural (a-) and the true Johari–Goldstein (b-) relaxation in binary mixtures, Journal of
Non-Crystalline Solids 353 4273–4277 (2007) 27 T. Blochowicz and E. A. Rössler, Beta Relaxation versus High Frequency Wing in the
Dielectric Spectra of a Binary Molecular Glass Former, Phys. Rev. Lett. 92, 225701 (2004) 28 P. Lunkenheimer, R. Wehn, U. Schneider, and A. Loidl, Glassy Aging Dynamics, Phys. Rev.
Lett. 95, 055702 (2005) 29 P. Lunkenheimer, R. Wehn, A. Loidl, Dielectric spectroscopy on aging glasses, Journal of
Non-Crystalline Solids 352, 4941–4945 (2006) 30 X. Li, M. Wang, R. Liu, K. L. Ngai, Y. Tian, L-M. Wang, S. Capaccioli, Secondary relaxation
dynamics in rigid glass-forming molecular liquids with related structures, The journal of
chemical physics 143, 104505 (2015) 31 S.V. Adichtchev, N. Bagdassarov. S. Benkhof, T. Blochowicz, V. N. Novikov, E. A. Rössler,
Evolution of the dynamic susceptibility of paradigmatic glass formers below the critical
temperature Tc as revealed by light scattering Journal of Non-Crystalline Solids 307-310, 24–31
(2002) 32 M. S. Thayyil, K.L. Ngai, D. Prevosto, and S. Capaccioli, Revealing the rich dynamics of
glass-forming systems by modification of composition and change of thermodynamic conditions
J. Non-Cryst. Solids, 407. 98–105 (2015). 33 K.L. Ngai, S. Capaccioli, Reconsidering the Dynamics in Mixtures of Methyltetrahydrofuran
with Tristyrene and Polystyrene J. Phys. Chem. B, 119, 5677−568 (2015) 34 F. Qi, T. El Goresy, R. Bohmer, A. Doß, G. Diezemann, G. Hinze, and H. Sillescu, T.
Blochowicz, C. Gainaru, and E. Rossler, H. Zimmermann, Nuclear magnetic resonance and
dielectric spectroscopy of a simple supercooled liquid: 2-methyl tetrahydrofuran, J. Chem. Phys.
118, 7431 (2003); 35 H. Wagner and R. Richert, Dielectric relaxation of the electric field in poly(vinyl acetate): a
time domain study in the range 10-3-106 s, Polymer, 38, 255-261 (1997). 36 R. Richert and H. Wagner, The dielectric modulus: relaxation versus retardation, Solid State
Ionics 105, 167–173 (1998) 37 M. Paluch, C. M. Roland, and A. Best, Dielectric and mechanical relaxation of
cresolphthalein–dimethylether, J. Chem. Phys. 117, 1188 (2002).

23
38 S. Kahle, J. Gapiński, G. Hinze, A. Patkowski, G. Meier, A comparison of relaxation
processes in structurally related van der Waals glass formers: The role of internal degrees of
freedom, J. Chem. Phys. 122 (7), 074506, (2005) 39 R. Casalini, M. Paluch and C. M. Roland, Correlation between the relaxation and the excess
wing for polychlorinated biphenyls and glycerol, J.Thermal Analysis and Calorimetry, 69 947–
952 ((2002) 40 D. J. Plazek, C. A. Bero, I.-C. Chay, The recoverable compliance of amorphous materials
Journal of Non-Crystalline Solids 172-174, 181-190 (1994) 41 A. Rizos, G. Fytas, T.P. Lodge and K.L. Ngai, Solvent rotational mobility in
polystyrene/aroclor and polybutadiene/aroclor solutions. II. A photon correlation spectroscopic
study, J. Chem. Phys. 95, 2980-2987 (1991). 42 K. Schröter and E. Donth, Viscosity and shear response at the dynamic glass transition of
glycerol, J. Chem. Phys. 113, 9101 (2000). 43 J. P. Gabriel, P. Zourchang, F. Pabst, A. Helbling, P. Weigl, T. Bohmer, and T. Blochowicz,
Intermolecular cross-correlations in the dielectric response of glycerol, Phys. Chem. Chem.
Phys. 22, 11644 (2020). 44 R. Kahlau, T. Dorfler, and E. A. Rossler, Secondary relaxations in a series of organic
phosphate glasses revealed by dielectric spectroscopy, J. Chem. Phys. 139, 134504 (2013). 45 M. K. Saini, K.L. Ngai, X. Jin, L-M Wang, Change in molecular dynamics with structures of
the trialkyl phosphates and in mixtures with ortho-terphenyl J. Non-Cryst. Solids, 530, 119804
(2020). 46 F. Pabst, A. Helbling, J. Gabriel, P. Weigl, and T. Blochowicz, Dipole-dipole correlations and
the Debye-process in the dielectric response of non-associating glass forming liquids, Phys. Rev.
E 102, 010606 (2020) 47 S. Pawlus, M. Paluch, M. Sekula, K. L. Ngai, S. J. Rzoska, and J. Ziolo, Changes in dynamic
crossover with temperature and pressure in glass-forming diethyl phthalate, Phys. Rev.E 68,
021503 (2003). 48 M. Sekula, S. Pawlus, S. Hensel-Bielowka, J. Ziolo, M. Paluch, and C. M. Roland, Structural
and Secondary Relaxations in Supercooled Di-n-butyl Phthalate and Diisobutyl Phthalate at
Elevated Pressure, J. Phys. Chem. B 2004, 108, 4997-5003 49 A. Kudlik, S. Benkhof, T. Blochowicz, C. Tschirwitz, and E. Rossler, The dielectric response
of simple organic glass formers, J. Mol. Struct. 479, 201 (1999). 50 B. Jakobsen, K. Niss, N. Boye Olsen, Dielectric and shear mechanical alpha and beta
relaxations in seven glass-forming liquids, J. Chem. Phys. 123, 234511 (2005). 51 S. Corezzi, M. Beiner, H. Huth, and K. Schroeter, S. Capaccioli and R. Casalin, D. Fioretto, E.
Donth, Two crossover regions in the dynamics of glass forming epoxy resins, J. Chem. Phys.
117, 2435-2448 (2002). 52 A I. Nielsen, T. Christensen, B. Jakobsen, K. Niss, N. Boye Olsen, R. Richert, J. C. Dyre
Prevalence of approximate√t relaxation for the dielectric α process in viscous organic liquids
J. Chem. Phys 130 154508 (2009) 53 L. Comez, D. Fioretto, L. Palmieri, and L. Verdini, P. A. Rolla. J. Gapinski, T. Pakula, A.
Patkowski, W. Steffen, and E. W. Fischer, Light-scattering study of a supercooled epoxy resin,
Phys. Rev. E, 60, 3086 (1999). 54 M. Mierzwa, S. Pawlus, M. Paluch, E. Kaminska and K. L. Ngai, Correlation between primary
and secondary Johari–Goldstein relaxations in supercooled liquids: Invariance to changes in
thermodynamic conditions, J. Chem. Phys. 128, 044512 (2008).

24
55 S. Hensel-Bielowka and J. Ziolo, M. Paluch and C. M. Roland, The effect of pressure on the
structural and secondary relaxations in 1,1-bis .p-methoxyphenyl cyclohexane, 117, 2317-2323
(2002) 56 G. Meier, B. Gerharz, D. Boese, and E. W. Fischer, Dynamical processes in organic
glassforming van der Waals liquids, J. Chem. Phys. 94, 3050 (1991). 57 A. Patkowski, J. Gapinski, and G. Meier, Dynamics of supercooled van der Waals liquid under
pressure. A dynamic light scattering study, Colloid Polym. Sci. 282, 874 (2004). 58 R. Casalini, M. Paluch, and C. M. Roland, Influence of molecular structure on the dynamics of
supercooled van der Waals liquids Phys. Rev.E 67, 031505 (2003). 59 T. Hecksher, N. Boye Olsen, K. A. Nelson, J. C. Dyre, T. Christensen, Mechanical spectra of
glass-forming liquids. I. Low-frequency bulk and shear moduli of DC704 and 5-PPE measured
by piezoceramic transducers, The Journal of Chemical Physics 138, 12A543 (2013) 60 T. Blochowicz, Communication on International Dielectric Society Meeting 2020. And to be
published. 61 M. Paluch, C.M. Roland, and S. Pawlus, Temperature and pressure dependence of the a-
relaxation, in polymethylphenylsiloxane, J. Chem. Phys. 116, 10932-10937 (2002). 62 D. Boese, B. Momper, G. Meier, F. Kremer, J.-U. Hagenah, and E. W. Fischer, Molecular
Dynamics in Poly(methylphenylsi1oxane) As Studied by Dielectric Relaxation Spectroscopy and
Quasielastic Light Scattering, Macromolecules 22, 4416-4421 (1989) 63 R. Richert, K. Duvvuri, L-T Duong, Dynamics of glass-forming liquids. VII. Dielectric
relaxation of supercooled tris-naphthylbenzene, squalane, and decahydroisoquinoline, J. Chem.
Phys. 118, 1828 (2003). 64 A. Döß, M. Paluch, H. Sillescu, and G. Hinze, From Strong to Fragile Glass Formers:
Secondary Relaxation in Polyalcohols, Phys. Rev. Lett. 88, 095701 (2002). 65 R. Böhmer, K. L. Ngai, C. A. Angell. and D. J. Plazek, Nonexponential relaxations in strong
and fragile glass formers J. Chem. Phys. 99, 4201 (1993). 66 K. Schmidt-Rohr, H.W. Spiess, Nature of nonexponential loss of correlation above the glass
transition investigated by multidimensional NMR Phys. Rev. Lett. 66, 3020 (1991) 67 A. Heuer, M. Wilhelm, H. Zimmermann, H.W. Spiess, Phys. Rev. Lett. 75 (15) (1995) 2851. 68 U. Tracht, M. Wilhelm, A. Heuer, H. Feng, K. Schmidt-Rohr, H.W. Spiess Rate Memory of
Structural Relaxation in Glasses and Its Detection by Multidimensional NMR Phys. Rev. Lett.
81, 2727 (1998) 69 S. A. Reinsberg, A. Heuer, B. Doliwa, H. Zimmermann, H. W. Spiess, Comparative study of
the NMR length scale of dynamic heterogeneities of three different glass formers, J. Non-Cryst.
Solids, 307–310, 208–214 (2002) 70 K. Schröter and E. Donth, Viscosity and shear response at the dynamic glass transition of
glycerol J. Chem. Phys. 113, 9101 (2000). 71 H. Wagner, and R. Richert, Equilibrium and non-equilibrium type beta-relaxations: D-sorbitol
versus o-terphenyl, J. Phys. Chem. B 4071-4077 ,103 (1999). 72 C. Leon and K. L. Ngai, Rapidity of the Change of the Kohlrausch Exponent of the r-
Relaxation of Glass-Forming Liquids at TB or T and Consequences, J. Phys. Chem. B, 103,
4045-4051 (1999). 73 R. Richert, K. Duvvuri, and L.-T. Duong, Dynamics of glass-forming liquids.VII. Dielectric
relaxation of supercooled tris-naphthylbenzene, squalane, and decahydroisoquinoline, J. Chem.
Phys. 118, 1828 (2003).

25
74 A. Kudlik, S. Benkhof, T. Blochowicz, C. Tschirwitz, and E. Rossler, The dielectric response
of simple organic glass formers, J. Mol. Struct. 479, 201 (1999). 75 G. Fytas, T. Dorfmuller, and C. H. Wang, Pressure- and temperature dependent homodyne
photon correlation studies of liquid o-terphenyl in the supercooled state, J. Phys. Chem. 87,
5041 (1983). 76 X. R. Zhu and C. H. Wang, Homodyne photon-correlation spectroscopy of a supercooled
liquid: 1,3,5-tri-α-naphthyl benzene, J. Chem. Phys. 84, 6086 (1986) 77 D.J. Plazek, J.H. Magill, Physical properties of aromatic hydrocarbons .i. Viscoelastic
behavior of 1.3.5-tri-alpha-naphthyl benzene, J. Chem. Phys. 45, 3038 (1996). 78 K. L. Ngai and M. Paluch, Corroborative evidences of TVγ-scaling of the α-relaxation originating from the primitive relaxation/JG β relaxation J. Non-Cryst. Solids, 478, 1–11 (2017) 79 S. Capaccioli, M. Paluch, D. Prevosto, Li-Min Wang, and K. L. Ngai, Many-Body Nature of
Relaxation Processes in Glass-Forming Systems J. Phys. Chem. Lett. 3, 735−743 (2012)
80 K. L. Ngai, Marian Paluch, and Cristian Rodríguez-Tinoco, Why is surface diffusion the same in
ultrastable, ordinary, aged, and ultrathin molecular glasses? Phys.Chem.Chem.Phys. 19, 29905
(2017). 81 K. L. Ngai, S. Valenti and S. Capaccioli, Molecular dynamic in binary mixtures and polymer
blends with large difference in glass transition temperatures of the two components: A critical
review, Journal of Non-Crystalline Solids, 119573 (2019) 82 B. Wang, Z. Y. Zhou, P. F. Guan, H. B. Yu, W. H. Wang, and K. L. Ngai, Invariance of the
relation between α relaxation and β relaxation in metallic glasses to variations of pressure and temperature Phys. Rev. B 102, 094205 (2020). 83 K. L. Ngai, Accounts of the changes in dynamics of hydrogen-bonded materials by pressure,
nanoconfinement, and hyperquenching Phys. Rev. E 102, 032606 (2020). 84 Th. Körber, R. Minikejew, B. Pötzschner, D. Bock, and E.A. Rössler, Dynamically asymmetric
binary glass formers studied by dielectric and NMR spectroscopy Eur. Phys. J. E 42: 143 (2019)

Figures
Figure 1
Please see the Manuscript PDF �le for the complete �gure caption.

Figure 2
Please see the Manuscript PDF �le for the complete �gure caption.

Figure 3
Please see the Manuscript PDF �le for the complete �gure caption.

Figure 4
Please see the Manuscript PDF �le for the complete �gure caption.

Figure 5
Please see the Manuscript PDF �le for the complete �gure caption.

Figure 6
Please see the Manuscript PDF �le for the complete �gure caption.

Figure 7
Please see the Manuscript PDF �le for the complete �gure caption.

Figure 8
Please see the Manuscript PDF �le for the complete �gure caption.

Figure 9
Please see the Manuscript PDF �le for the complete �gure caption.
Supplementary Files
This is a list of supplementary �les associated with this preprint. Click to download.

Supportinginformation.docx