Embed Size (px)
Citation preview

INSTITUTE OF MARRIAGE AND
FAMILY CANADA
1912 - 130 ALBERT ST.
OT TAWA ON, K1P 5G4
TEL : 613 -565 -3832
FA X: 613 -565 -3803
TOLL-FREE: 1- 866 -373 - IMFC
W W W.IMFCANADA .ORG
INFO@IMFCANADA .ORG
by helen ward president of kids f irst parents association of canada april 2015
Is there really a daycare shortage? A Toronto case study shows vacancies despite waiting lists and subsidies
executive summary
Canadians often hear about the apparent need for more licensed daycare spaces.
News stories about waitlists in big cities give the impression of a daycare crunch.
Even when additional spaces are announced, the public is reminded that it’s never
enough.1 But what if the daycare shortage is not so much a shortage of spaces as
a shortage of children in them?
In this report, we examine daycare demand and availability using the city of
Toronto as a case study. Vacancy data shows that rather than a shortage of spaces
in Toronto, there has actually been a surplus.
This evidence is routinely obscured through use of three proxy measures of daycare
demand that overstate true demand. In response, government funding for daycare
has risen faster than enrolment.
All children need early learning and child care (ELCC) twenty-four hours
a day, seven days a week. That need is met in a variety of ways including by
parents themselves. Public policy, however, usually focuses on one type of care—
institutional daycare—to the disadvantage of those who prefer other forms of
ELCC.
Helen Ward is the President of Kids First Parents Association of Canada, a volunteer parent-run charity supporting children’s optimal well-being and parental childcare. She is a low-income single mother and holds a Bachelor of Arts with First Class honours and a Bachelor of Music. She is a frequent media commentator on child and parent issues including articles published in the Vancouver Sun, National Post and Ottawa Citizen, among others.
d e f i n i n g t e r m s
early learning and child care (elcc) encompasses all forms of care for children including parental care.
preschool (nursery school) includes group settings for children under school age that are part-day and part-week unaccompanied by a parent/guardian
daycare is licensed group care in a daycare centre excluding preschool.
regulated child care is a broader category that includes all care regulated by provincial government. Of note, all ELCC is parent-regulated.

1. For example see Hammer, K. (2014, June 23). Daycare demand soaring in Toronto region as YMCA adds more spaces. The Globe and Mail. Retrieved from http://www.theglobeandmail.com/news/toronto/ymca-to-expand-daycare-services-in-the-gta/article19304470/
2. See Canadian Labour Congress (©2009). Childcare [website]. Retrieved from http://www.canadianlabour.ca/issues/child-care 3. Ferns, C. & Friendly, M. (2014, June 20). The state of early childhood education and care in Canada 2012. Toronto: Childcare Resource
and Research Unit. p. 2. Retrieved from http://www.childcarecanada.org/sites/default/files/StateofECEC2012.pdf
the problem with measuring daycare demand
Proponents of more government-funded institutional
daycare argue that demand for daycare centres remains
high. Three proxy measures are often cited to support this
claim, but each of these measures is problematic.
First, proponents argue there is a shortage of daycare because
there are “regulated spaces” for only 20 percent of children
under six years old.2 This includes spaces in daycare centres,
preschools, and regulated home daycares.
Proponents argued in a recent report: “In 2012, there were
full- or part-time centre-based childcare spaces for only
22.5% of Canadian children 0-5 years... Although the
coverage rate has been creeping up steadily, there is still a
very sizeable gap between need and provision.”3 The problem
with this logic is that, while it is true that all children need
ELCC, it does not follow that all children need a space in a
daycare centre. ELCC takes many forms, including parental
care, but daycares garner the most policy attention and
public funding. Daycare proponents sometimes go so far as
to use the term “child care” interchangeably with daycare.
This is inaccurate and ignores the fact that parental care
and other forms of family care are indeed “child care” too.
Unions help create hype around the purported lack of spaces by sponsoring public awareness campaigns like the one pictured above at bus shelters. This ad suggests, using teddy bears in glass cases, that only one in five children have access to licensed daycare. (Photo credit: Eloise Cataudella)
4. For the number of children five and under: Statistics Canada CANSIM Table 051-0001 Estimates of population, by age group and sex for July 1, Canada, provinces and territories. Retrieved from http://www5.statcan.gc.ca/cansim/a26?lang=eng&retrLang=eng&id=0510001&paSer=&pattern=&stByVal=1&p1=1&p2=37&tabMode=dataTable&csid=
5. “About 50 percent” was derived using the Ontario 2014 population estimates by age group and sex for July 1, Canada, provinces and territories, link in footnote four, the number of students enrolled in full day kindergarten in 2014 and the Ontario 2012 number of regulated daycare spaces. Sources: Ontario Ministry of Education, Education Facts, 2013-2014 (Preliminary). Retrieved from http://www.edu.gov.on.ca/eng/educationFacts. html#enrol and Friendly, M., Halfon, S., Beach, J. & Forer, B. (2013). Early childhood education and care in Canada (9th ed.). Toronto: Childcare resources and research unit. p. 28. Retrieved from http://www.childcarecanada.org/sites/default/files/CRRU_ECEC_2012_revised_dec2013.pdf
6. See Canadian Labour Congress (©2009). Childcare [Website]. Retrieved from http://www.canadianlabour.ca/issues/child-care “Almost 70% of mothers with children under five are working.”
7. Ferns, C. & Friendly, M. (2014). The state of early childhood education, p.2.8. Statistics Canada (2013). Guide to the Labour Force Survey, 2013, pp. 7-9. Retrieved from www.statcan.gc.ca/pub/71-543-g/71-543-g2013001-eng.
pdf See also economics professor Chris Sarlo on labour force dynamics in Institute of Marriage and Family Canada (2013, Oct). Canadian daycare desires Part III. Ottawa: IMFC. p. 4. Retrieved from http://www.imfcanada.org/sites/default/files/DaycaredesiresIII_Education.pdf
9. Calculations by the author based on Table 7, p.61 & Table 8, p. 62 from Friendly, M., Halfon, S., Beach, J. & Forer, B. (2013). Early childhood education.
10. Canadian Broadcasting Corporation (2014). The second shift. Thoroughly modern motherhood. Doc Zone. Retrieved from http://www.cbc.ca/doczone/features/thoroughly-modern-motherhood
11. Ibid.
3
T O R O N T O D AY C A R E v A C A N C I E S · A P R I L 2 0 1 5
The estimate that there are regulated spaces for only 20
percent of children is therefore not terribly meaningful. It
is also a low estimate when you consider the impact of full-
day kindergarten. In Ontario, when full-day kindergarten
spaces are added to the daycare centre spaces for children
approximately five and under,4 there are institutional ELCC
spaces for roughly 50 percent of 0 to 5 year olds.5
Second, proponents point to the significant percentage
of mothers in paid work as an indicator of demand for
daycare.6 They assume without factual basis that all require
centre-based care.
Daycare proponent Martha Friendly and coauthors write,
“In 2012, the labour force participation rate was 69.7% for
mothers whose youngest child was 0-2 years, 76.6% for
mothers with a youngest child 3-5 years, and 84.0% for
those whose youngest child was 6-15 years.”7
The implication is that there is a high demand for centre-
based care. The problem is that “labour force participation”
is a broad term that does not equate with demand for day-
care. Statistic Canada’s labour force participation measure
captures individuals who:
• areonpaidorunpaidleavefromajob
• workpart-time
• dounpaidworkinafamilyfarmorbusiness
• areunemployedandlookingforwork
• dopaidworkwhilecaringfortheirchildren
• dopaidworkoutsideofdaycarecentrehours
• dopaidworkfullorpart-timebutdonot
prefer centre-based care.8
Over one third - 38% - of Ontario children age 0 to 5 years
old in 2012 have a mother who is not employed and is not
included in the labour force participation measure.9
Mothers who participate in paid labour do so 16 hours per
week less on average than fathers.10 Many mothers in the
labour force are working part-time or for part of the year.11
It is also important to note that many mothers have more
than one child. Therefore, the percentage of children with
a mother in the labour force is lower than the labour force
participation rate for mothers. The bottom line? Many
parents, including mothers in paid work, do not seek out
daycare spaces because they prefer other forms of child care.
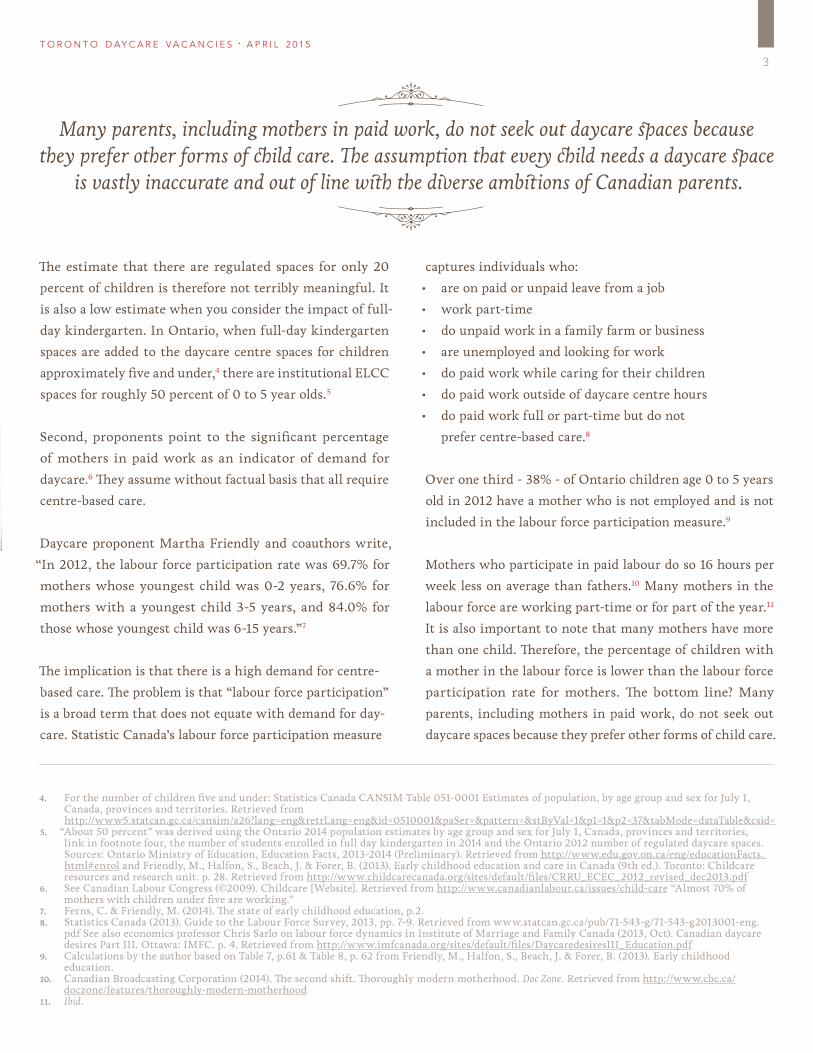
Many parents, including mothers in paid work, do not seek out daycare spaces because they prefer other forms of child care. The assumption that every child needs a daycare space
is vastly inaccurate and out of line with the diverse ambitions of Canadian parents.

Newfoundland & Labrador
3332,948
Prince Edward Island
6433,078
Nova Scotia 3772,495
NewBrunswick
3701,613
Quebec 2,2315,958
Manitoba 7174,388
Saskatchewan 3895,104
Alberta 3512,283
BritishColumbia
3982,207
Nunavut 3292,742
Yukon Territory
1,4455,320
Canada includingQuebec
8384,070
Canada without Quebec
4362,775
Northwest Territories
N/AN/A
Ontario 4572,952
12. SeeMojtehedzadeh,S.(2014,Nov.10).GTAchild-carecoststopsinnationalstudy.Toronto Star. Retrieved from http://www.thestar.com/news/gta/2014/11/10/gta_childcare_costs_tops_in_national_study.html The City of Toronto also uses waitlists to measure demand: “The size of the waiting list for a subsidized space also provides an indication of demand.” See City of Toronto (2012). Children’s services 2012 performance measurement and benchmarking report. p. 5. Retrieved from www1.toronto.ca/City%20Of%20Toronto/City%20Managers%20Office/Toronto%20Progress%20Portal/Files/pdf/OMBI%20Reports/2012%20OMBI%20Service%20Areas/Children%27s%20Services.pdfKirby, D.B., Laris, B.A., & Rolleri, L.A. (2007). Sex and HIV education programs: Their impact on sexual behaviors of young people throughout the world. Journal of Adolescent Health, 40, pp. 206-217.
13. Childcare Resource and Research Unit, and the Canadian Union of Postal Workers (n.d.). Do’s and don’ts. Finding quality child care [website]. Retrieved from http://findingqualitychildcare.ca/index.php/do-s-and-don-ts
14. See City of Toronto (2015). Applying for fee subsidy. Children’s Services [website]. Retrieved from http://www1.toronto.ca/wps/portal/ contentonly?vgnextoid=198b5f2bda51f310VgnVCM10000071d60f89RCRD&vgnextchannel=bcd25e0076113410VgnVCM10000071d60f89RCRD
“Child care fee subsidy- Frequently asked questions”http://www1.toronto.ca/wps/portal/ 15. Dare, P. (2009, Nov. 26). Subsidize families, not care agencies; Current system can't ensure help goes to most deserving. Ottawa Citizen, p. C3.16. City of Toronto (2015). Toronto city budget 2015: Operating analyst notes, children’s services. p. 3. Retrieved from http://www1.toronto.ca/City%20
Of%20Toronto/Strategic%20Communications/City%20Budget/2015/PDFs/Operating%20Analyst%20Notes/ChildrenServices_op_Jan18.pdf
t o r o n t o d ay c a r e v a c a n c i e s
4
The assumption that every child needs a daycare space is
vastly inaccurate and out of line with the diverse ambitions
of Canadian parents.
Third, proponents often cite long waitlists for centre-based
care as an indication of space shortages.12 The problem is that
parentsareencouragedtojoinmultiplewaitlists,oftenas
soon as they learn they are expecting. One source states, “As
soon as possible after finding out you are pregnant…Check
out the options in your area for regulated child care and
put your name on multiple waiting lists.”13 Toronto’s much
talked about fee subsidy waitlist accepts unborn children,
those intending to move to Toronto, those now in daycare
who would like to change centres, and those who want it in
the future - with no limit on how far in advance.14
Ottawa’s civic Auditor General commenting on that city’s
daycare waiting list in 2009 said the list does not provide
an accurate picture of daycare demand “because it is not
routinely updated and includes children who are not yet
born.”15 Inflated lists are a problem for parents and for
daycare providers who don’t have updated information.
the rise in daycare spending
Proponents’ claim that we need more daycare spaces has
resulted in substantially more public funding, which
continues to grow.
Daycares receive considerable funding that goes not to
children, but to spaces. Government funding also goes toward
fixed capital costs, monitoring, administration, training, and
janitorialservicesrequiredforthecareoflargenumbersof
children.
In Toronto, user fees cover only a fraction of the costs.
According to a 2015 city budget document, user fees cover
a mere 5 percent of space-system costs excluding capital
expenditures.16
Today in Canada, public funding for daycare spaces comes
primarily from the provinces but also includes federal support.
Many municipal governments provide additional funds or
in-kind support in the form of land or free rent. Publicly
funded institutions such as universities and hospitals can
also provide cash or in-kind support.
Directing massive subsidies towards institutional daycare spaces is inequitable and ignores the majority of low-income Canadian families and their specific child care needs.
Newfoundland & Labrador
3332,948
Prince Edward Island
6433,078
Nova Scotia 3772,495
NewBrunswick
3701,613
Quebec 2,2315,958
Manitoba 7174,388
Saskatchewan 3895,104
Alberta 3512,283
BritishColumbia
3982,207
Nunavut 3292,742
Yukon Territory
1,4455,320
Canada includingQuebec
8384,070
Canada without Quebec
4362,775
Northwest Territories
N/AN/A
Ontario 4572,952
a p r i l 2 0 1 5
5
Sources:
(i) Figure 7 in Ferns, C. and Friendly, M. (2014). The state of early childhood education and care in Canada 2012. Moving Childcare Forward Project (a joint initiative of the Childcare Resource and Research Unit, Centre for Work, Families and Well-Being at the University of Guelph, and the Department of Sociology at the University of Manitoba). Toronto, p. 12.
(ii) Table 14 in Friendly, M., Halfon, S., Beach, J. & Forer, B. (2013). Early childhood education and care in Canada 2012. Toronto: Childcare Resource and Research Unit. p. 68.
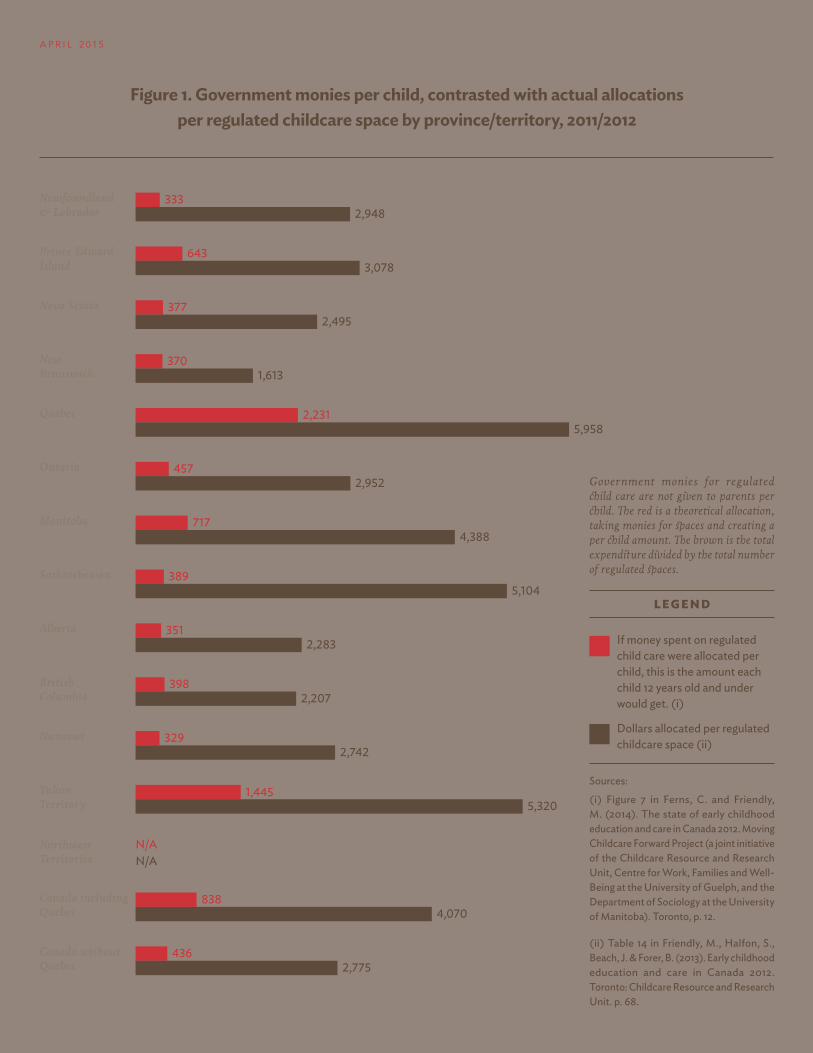
Government monies for regulated child care are not given to parents per child. The red is a theoretical allocation, taking monies for spaces and creating a per child amount. The brown is the total expenditure divided by the total number of regulated spaces.
If money spent on regulated child care were allocated per child, this is the amount each child 12 years old and under would get. (i)
Dollars allocated per regulated childcare space (ii)
legend
Figure 1. Government monies per child, contrasted with actual allocations per regulated childcare space by province/territory, 2011/2012

17. See Figure 7 in Ferns, C. and Friendly, M. (2014). The state of early childhood education and care in Canada 2012.MovingChildcareForwardProject(ajointinitiative of the Childcare Resource and Research Unit, Centre for Work, Families and Well-Being at the University of Guelph, and the Department of Sociology at the University of Manitoba). p. 12. Retrieved from http://childcarecanada.org/sites/default/files/StateofECEC2012.pdf Note: substantial provincial funding in the province of Québec significantly increases the Canadian average.
18. See chart 4.2 in City of Toronto (2012). Children’s services 2012 performance measurement and benchmarking report. p. 3. Retrieved from http://www1.toronto.ca/City%20Of%20Toronto/City%20Managers%20Office/Toronto%20Progress%20Portal/Files/pdf/OMBI%20Reports/2012%20OMBI%20Service%20Areas/Children%27s%20Services.pdf
19. See chart 4.10 in City of Toronto (n.d.). Children’s services 2012 performance measurement and benchmarking report. p.6. Retrieved from http://www1.toronto.ca/City%20Of%20Toronto/City%20Managers%20Office/Toronto%20Progress%20Portal/Files/pdf/OMBI%20Reports/2012%20OMBI%20Service%20Areas/Children%27s%20Services.pdf
t o r o n t o d ay c a r e v a c a n c i e s
6
When looking at provincial funding alone, the average spent
annually on regulated child care in 2011/2012 by the provinces
is $838 per child under 12 years old. This amount falls to $436
when excluding Quebec where daycare is heavily subsidized.
The average for Ontario is $457 per child.17 Ontario’s highest
cost was in Toronto at $1090 per child.18
Of course, not every child in Toronto receives $1090 in
funding each year. Funding does not go to children at all
but is funneled to daycare spaces. Each subsidized daycare
space in Toronto receives an average of $5894 annually.19 If
1992 2001 2009/2010 2011/2012
ontario $604,664,000 $566,233,000 $855,956,667 $865,100,000
canada (average) $1,096,609,000 $2,370,032,000 $3,732,696,996 $4,016,815,891
*excludes municipal and federal support and funding and has been adjusted to 2012 numbers Source: Table 11 from Friendly, M., Halfon, S., Beach, J. & Forer, B. (2013). Early childhood education and care in Canada 2012. Toronto: Childcare Resource and Research Unit, p. 65.
Table 1. Estimate of provincial expenditures on regulated childcare spaces, 2012 Dollars*
1994/1995i 2000/2001i 2011ii
canada 8%* 12%* 18%**
*children 6 months to 5 years old ** children 0 to 4 years old Source: (i) Bushnik, T. (2006, April). Child Care in Canada. Children and Youth Research Paper Series. Ottawa: Statistics Canada. p. 97. Retrieved from http://publications.gc.ca/Collection/Statcan/89-599-MIE/89-599-MIE2006003.pdf (ii) Calculations by author based on data from Sinha, M. (2014, Oct). Child Care in Canada. Ottawa: Statistics Canada, Table 1, pg. 7. The calculation of the 18% is based on all children including those who are in parental care. According to the Sinha report, 54% of parents with children aged 4 and under used regulated child care (pg. 4). Sinha’s Table 1, pg. 7 says 33% of children ages four and under whose parents use child care are in a day care centre. Retrieved from http://www.statcan.gc.ca/pub/89- 652-x/89-652-x2014005-eng.pdf Note: Child care in Bushnik 2006 means care stipulates care while respondents were working or studying. Child care in Sinha 2014 means non parental care without stipulating whether care occurred while respondents were working or studying.
Table 2. Percentage of children in centre-based daycare, Canada, 1994/95, 2000/01, 2011
all children used daycare spaces equally there would be no
gap between funding averaged per space and per child. The
largegapdemonstratesthatthevastmajorityofchildren-
including low income children - are not in the funded spaces
andreceivenoneofthisfundingfortheircare.Themajority
of this funding supports the minority of families who use
daycare centres.
The inequity is stark. Many children under age 12 don’t benefit
from ELCC funding because they are not in regulated daycare.
The minority of children who are in daycare centres access
20. See table 14 in Friendly, M., Halfon, S., Beach, J. & Forer, B. (2013). Early childhood education, p.68. Retrieved from http://www.childcarecanada.org/sites/default/files/CRRU_ECEC_2012_revised_dec2013.pdf
21. Sinha, M. (2014, Oct). Child Care in Canada. Ottawa: Statistics Canada, p.6. Retrieved from http://www.statcan.gc.ca/pub/89-652-x/89-652-x2014005-eng.pdf
22. Friendly, M., Halfon, S., Beach, J. & Forer, B. (2013). Early childhood education, p. 26.23. Calculations by author based on Table 11 in Friendly, Halfon, Beach, & Forer (2013). Early childhood education, p. 65.24. Calculations based on Table 1 and Table 2.25. Vacancy rates calculated by the author using daycare capacity and vacancy data in the city of Toronto.
Capacity data retrieved from, City of Toronto (2015). Children’s services division: facts and figures [website]. Fact sheets Summer 2008 to January 2015. Retrieved from http://www1.toronto.ca/wps/portal/contentonly?vgnextoid=4b2ad25ed83ae310VgnVCM10000071d60f89RCRD&vgnextchannel=d80e8ed34ce9e310VgnVCM10000071d60f89RCRD Vacancy data retrieved from City of Toronto (2015). Number of vacant licensed spaces and wait list for child care fee subsidy. Toronto Open Data [website]. Retrieved from opendata.toronto.ca/city.manager/performance.management/PM_Childrens_Services.xls
26. Canadian Mortgage and Housing Corporation (2015). At a glance: Toronto. Housing Market Information Portal [website]. Retrieved from https://www03.cmhc-schl.gc.ca/hmiportal/en/#Profile/2270/3/Toronto
a p r i l 2 0 1 5
7
the bulk of government funding. Regulated spaces across
Canada receive an average of $4,070 a year from provincial
funds alone.20 Since wealthier families are more likely to
have their children in daycare, not only does the system pick
winners and losers, government subsidies do not necessarily
help those who need it most.21
Regulated home-daycares and most preschools/nursery
schools are counted as “regulated childcare,” but they receive
far less funding than daycare centre spaces.22 Thus, daycare
centre spaces actually receive more public funds than the
above numbers indicate.
Despite this inequitable support, funding for daycare centres
has been increasing for years. Consider that between 1992
and 2012, provincial daycare funding in Canada increased
by $2,920,206,891 – almost three billion dollars. It appears
that government funding for ELCC is increasingly being
funneled inequitably to a select minority of children.
Funding in Ontario increased during the same period by 43
percent,23 but this excludes the estimated $1.5 billion now
spent annually on full-day kindergarten.
rise in daycare spending outpacing enrolment
Determining enrolment in daycare centres can be difficult,
as the data is collected but not publicized. Three Statistics
Canadareportsthatrelyonmajorsurveysprovidedataon
enrolment in different forms of child care. While provincial
funding for centre-based care has increased an estimated 266
percent over approximately two decades, enrolment in such
centres as a percentage of all young children has increased
only an estimated 125 percent.24
toronto's daycare vacancies: hidden evidence
This brings us to the problem of daycare vacancies. Here the
city of Toronto serves as a case study. Vacancies in daycare
are a well-guarded secret. The City of Toronto collects and
publishes vacancy data and other information monthly from
over 900 childcare centres in the city. Previously the data was
easily accessible on the City’s child services website. Detailed
information on vacancies in each centre was updated at least
twice a month. This data was intended to help parents easily
find available spaces.
Currently vacancy data is difficult to access. The City now
advises parents to contact each centre individually. Vacancy
rates can be calculated, however, by combining information
from the children’s services website and data published
through Toronto’s Open Data website.
Between January 2009 and October 2014, the total number of
vacancies among all age groups in Toronto daycare fluctuated
from a low of 3.58 percent to a high of 6.64 percent.25 By
way of comparison, the rental apartment vacancy rate in
Toronto as of October 2014 was 1.6 percent.26

20132,3792,1811,9892,0962,0511,9832,188
2,8573,486
January
February
March
April
May
June
July
August
September
October
November
December
3,6663,6663,583
20143,488
2,8432,748
2,2442,0711,9231,9052,116
2,952
January
February
March
April
May
June
July
August
September
October
November
December
3,456n/an/a
2,7502,733
2,3622,2592,2442,2682,3012,3412,465
January
February
March
April
May
June
July
August
September
October
November
December
2,9092,7132,630
2010
2,0281,8771,8781,9672,4162,8323,181
2,248January
2,218February
March
April
May
June
July
August
September
October
November
December
3,1792,9012,942
2009
2,2522,2302,1622,1131,9901,9652,0992,3862,881
January
February
March
April
May
June
July
August
September
October
November
December
2,9732,8182,736
2012
2,8162,613
2,2632,1172,1292,0062,1852,0872,300
January
February
March
April
May
June
July
August
September
October
November
December
2,3662,3082,264
2011
t o r o n t o d ay c a r e v a c a n c i e s
8
Figure 2. Number of vacant licensed childcare spaces in Toronto, 2009 to 2014
Source: City of Toronto (2015). Number of vacant licensed spaces and wait list for child care fee subsidy. Toronto Open Data [website].

27. Calculated using the Toronto Child Services Fee Subsidy Calculator at http://www1.toronto.ca/wps/portal/contentonly?vgnextoid=976c2ea35be3f310VgnVCM10000071d60f89RCRD&vgnextchannel=6d3e8ed34ce9e310VgnVCM10000071d60f89RCRD
28. Doherty, G., Lero, D. S., Goelman, H., LaGrange, A. & Tougas, J. (2000). You Bet I Care! Report 1 - A Canada-wide study on Wages, Working Conditions, and Practices in Child Care Centres. Guelph: Centre for Families, Work, and Well-Being, University of Guelph. pp. 167-68. Retrieved from http://www.ccsc-cssge.ca/sites/default/files/uploads/Projects-Pubs-Docs/ybic_report.pdf
a p r i l 2 0 1 5
9
In terms of actual vacant spots, a low of 1,877 spots were
available in April 2009 and a high of 3666 spots were open
in October and November of 2013. These numbers do not
include vacancies in the 1,100 city regulated family home
daycares because the data is not available.
It is in the best interest of the city to fill its daycare spaces.
Vacancy means lost revenue. If vacancy rates in Toronto are
persistently evident, why is so much media coverage about
waiting lists and shortages?
It is difficult to quantify how many parents have trouble
finding ELCC or are unable to find ELCC altogether. As
indicated, waitlists are a problematic measure of need.
It may be finding ‘high quality’ care is difficult because much
care is deemed mediocre. Parents might not receive the
preferred care they are looking for and timing of entry into
care is unnecessarily complicated because of the inefficient
waitlist system.
Waitlists for subsidized spaces remains high. It could be
argued that increasing funding for subsidized care would
lower both the subsidy waiting lists and vacancy rates. Again,
these lists are problematic, but if lowering the subsidy waitlist
is a challenge, it hasn’t been a priority.
In the wake of the full-day kindergarten rollout, some
daycares were forced to restructure or close because of the
sudden decline in older children. The province opted to
compensate centres for lost revenue created by the full-day
kindergarten program. This funding could have been directed
to subsidizing spaces.
The subsidy system could be restructured. Currently a family
with one child under 18 months and with income under
$20,000 a year could receive a subsidy of $1,348.50 a month
in Toronto.27 Restructuring would mean some parents would
have to cover more of the cost of their child’s care, but
more parents could participate in the program. If a single
parent making only $20,000 a year in Toronto wanted
access to daycare, he or she would certainly need help and
restructuring could open up more subsidies for those who
truly need it.
A federally funded report entitled You Bet I Care! was published
in 2000. While the information is now dated, some of
Canada’s leading proponents for institutional daycare came
to the conclusion that 53.7 percent of daycare centres
Canada-wide reported vacancies. Of those, 30.6 percent
had vacancy rates of over 10 percent. Operators cited high
fees, less demand for centre-based care and increased market
competition amongst factors contributing to the vacancies.28
Vacancy rates in daycares are a well-guarded secret.

29. Doherty, Lero, Goelman, LaGrange & Tougas, (2000). You Bet I Care! p.167.30. Zukewich, N. (2003). Unpaid informal caregiving. Canadian Social Trends, Autumn 2003. Ottawa: Statistics Canada. p. 15. Retrieved from http://
www.statcan.gc.ca/ pub/11-008-x/2003002/article/6622-eng.pdf
t o r o n t o d ay c a r e v a c a n c i e s
10
The report bluntly notes, “Vacancy rates of this magnitude
make it extremely difficult to sustain financial viability.”29
Unfortunately, daycare vacancy rates, enrollment, and quality
data are not readily available to parents or to the policymakers
who make funding decisions. This information must be made
more easily available to both.
honouring parental preference
All children need ELCC. This takes many forms, including
parental ELCC. The emphasis on centre-based care does not
respect parental preferences.
The preferential funding granted to centre-based daycare
discriminates against parents using other forms of ELCC, and
makes parental care the most expensive option. It is as if, at
massive taxpayer expense, the government built subsidized
cafeterias. No doubt ‘demand’ for cafeteria food would rise as
people opted for cheap or free cafeteria food. But what people
actually prefer is completely ignored. And many paying for
the service through taxes would be left out due to dietary
concerns, diverse values, and scheduling challenges.
Likewise, subsidizing daycare centres artificially lowers
the very high price of that form of ELCC. Daycare centres
are the most costly form of care because of considerable
capital,administrative,training,regulatoryandjanitorial
requirements. Parents paying full fees may rightly feel fees
are high, but their fees still do not cover costs.
In contrast, the cost of parental ELCC is paid by the parents
themselves. Parental ELCC results in substantial lost income
due to reduced time spent at paid work. The amount of
this “opportunity cost” in wages, benefits, promotions, and
pensions is a real cost. The opportunity cost for a parent
to care for a child at home is typically far higher than the
price paid by other parents on daycare fees. A 2003 Statistics
Canada report estimated the value of the opportunity cost
of unpaid parental ELCC to be at least $59 billion.30 Yet this
form of ELCC receives no targeted government financing.
Therefore, preferential government support for daycare comes
at the expense of other families’ diverse, intimate, and
complex ELCC decisions.
A 2014 Statistics Canada study illustrates the income
disparity among parents based on the type of ELCC they
use. Those relying on parental ELCC are more likely to have
a comparatively lower income. The author reports, “about
two-thirds (65%) of parents with an annual household income
of at least $100,000 used [non-parental] child care for their
preschooler. This was nearly double the rate recorded for
households with an income below $40,000 (34%). Along
the same lines, 46% of the highest income households used
Directing massive subsidies towards institutional daycare spaces is inequitable and ignores the majority of low-income Canadian families and their specific child care needs.

31. Sinha, M. (2014, Oct). Child Care in Canada, p.6.32. Results from a poll by SIFO published April 2006 in Varlden Idag as reported in “Let the children stay at home until they turn four.” (2006, April 28). Barnens Rätt
Till Föräldrarnas Tid (Children’s Right to their Parents Sweden) Retrieved from http://www.barnensratt.se/enclosures/archv-news.htm#060428-1Simons, P. (2014, July 10). Simons: Christian sex ed in public schools an infringement of human rights, says Edmonton mother, daughter. Edmonton Journal. Retrieved from http://www.edmontonjournal.com/Simons+Christian+public+schools+infringement+human+rights+Edmonton+mother+daughter/10015901/story.html
33. See Tables 5.5 in Bibby, R.W., (2004). A survey of Canadian hopes and dreams. The Future Families Project. Ottawa: Vanier Institute of the Family. p. 54. Retrieved from http://www.reginaldbibby.com/images/The_Future_Families_Project_MASTER.pdf
34. Ibid.35. See Table 5.8 in Bibby, R.W., (2004). A survey of Canadian. p. 55.36. Institute of Marriage and Family Canada (2006, Spring). Canadians make choices on childcare. Canadian Family Views. Ottawa: IMFC. p. 2. Retrieved
from http://www.imfcanada.org/sites/default/files/canadiansmakechoicesaboutchildcare.pdf37. Institute of Marriage and Family Canada (2013, May). Canadian daycare desires. Ottawa: IMFC. p. 1. Retrieved from http://www.imfcanada.org/
sites/default/files/monthly_release/DaycareDesiresMay2013.pdf
a p r i l 2 0 1 5
11
child care for school-aged children, compared to 32% of the
lowest income households.”31 Daycare funding is more likely
to offset costs for wealthier families.
Despite public perception, most children in ELCC are not in
centre-based care – a fact that speaks to parental preferences
for care. The distorted perception has led to policy choices
thatdirectthemajorityofpublicfundingtowardaformof
care only a minority of children receive.
Pollsconsistentlyfindthatamajorityofparentsprefer
parental ELCC. Even in Sweden with its heavily funded
daycare system, 64 percent agree government should support
parents financially to look after their children. Support
was even stronger – 76 percent - for members of the labour
union federation.32
In Canada, the Vanier Institute of the Family found that
nine out of 10 respondents say a parent should be at home
with preschool child.33 Over 60 percent say the same for
elementary age child.34 Where both parents are employed
outside the home parent care was still ranked number one
compared to daycare centres at number five.35
The Institute of Marriage and Family Canada poll done in
2006 found that 78 percent of parents preferred that "a parent
stays at home" over a "competent caregiver."36 A follow-up poll
in 2013 found that 76 percent of Canadians still believe it is
“best for children under six to be at home with a parent.”37
The pursuit of universal daycare does not reflect the ELCC
arrangements parents make or the preferences they have
for their child’s care. Directing massive subsidies towards
institutional daycare spaces is inequitable and ignores the
majorityoflow-incomeCanadianfamiliesandtheirspecific
childcare needs.
The minority of children who are in daycare centres access the bulk of government funding…Since wealthier families are more likely to have their children in daycare, not only does the system pick winners and losers,
government subsidies do not necessarily help those who need it most.

38. Canada, Parliament, House of Commons. Standing Committee on Finance, Sub-Committee on Tax Equity for Canadian Families with Dependent Children. (1999). Some principles and considerations guiding the committee. For the benefit of our children: Improving tax fairness. 36th Parl., 1st sess. Retrieved from http://www.parl.gc.ca/HousePublications/Publication.aspx?DocId=1031602&Mode=1&Parl=36&Ses=1&Language=E&File=57#cmtee
t o r o n t o d ay c a r e v a c a n c i e s
12
recommendation
Policymakers should consider the following recommendations
to better serve parents.
2Allow public funding to follow parental preference
All children require ELCC. Parents meet this need in diverse
ways,butthemajorityoffundinggoestoonlyoneform;
centre-based care. This coerces parents seeking financial
assistance to use the type of care that is being funded. Public
funding “should be fair and equitable and neither encourage
nor penalize caregiving choices” as per recommendations
from the 1999 Finance committee report For the Benefit of
Our Children.38 Funding empowers parents to make the best
ELCC choice for their family’s needs.
2Increase transparency on vacancy rates
Provincial governments should make vacancy rates for all
publicly-funded daycare centres easily accessible to the
public. Publishing vacancy rate data would inform decisions
regarding the allocation of public funds for ELCC. Greater
transparency would better serve taxpayers and parents.
2Taxpayer-funded research on childcare policy should be reliable, transparent and made entirely public.
Reliable data on parental preference, enrollment, funding,
cost, quality and childcare outcomes would better inform
policymakers. Increased access to data would contribute
to policy that is equitable and responsive to the variety of
forms of ELCC parents demand.
conclusion
Childcare policy concerns are overwhelmingly focused
on one form of care that many parents choose not to use.
While vacancy rates ebb and flow, the constant presence of
available daycare spaces in cities like Toronto exposes the
tired narrative that drives ELCC policymaking. Daycare
data should be made accessible to both policymakers and to
parents. Proponents will continue to press for more funding
and more centre-based spaces. However, ELCC funding
should be distributed equitably and without discrimination
to Canadian parents, responding to the variety of ELCC
forms that parents demand.