Embed Size (px)
Citation preview

1
Is there enough water in the Vientiane Plain? A water balance
assessment of the Lower Nam Ngum Basin
Lacombe G1, Douangsavanh S1, Thepphavong B2, Hoanh CT1, Bounvilay B3, Noble A1, Ongkeo
O3, Johnston R4 and Phongpachith C3
1: International Water Management Institute, Southeast Asia Regional Office, Vientiane, Lao PDR
2: Faculty of Engineering, National University of Laos, Vientiane, Lao PDR
3: Water Resources & Environment Research Institute, Ministry of Natural Resources and Environment, Vientiane, Lao PDR
4: International Water Management Institute. Headquarters. 127, Sunil Mawatha, Pelawatte, Battaramulla, Sri Lanka
Abstract
In Lao PDR, one of the less developed countries, water represents a valuable natural resource via the
development of hydropower dams and irrigation schemes. In the lower part of the Nam Ngum River
Basin, the Vientiane plain is one of the largest food production areas of the country and the largest
irrigated area in Lao PDR. While food demand is expected to continue to increase in the future,
hydropower dams are under rapid development in the upper part of the basin, modifying the
seasonal distribution of the river flow regimes. This study aims at assessing the current water supply
and agricultural water demand in the Vientiane Plain and concluding whether the water resource is
or may become a limiting factor for food production. The agricultural water demand is assessed
from two types of data (characteristics of large-scale pumping stations and official statistics on
irrigated areas) and using remote sensing analyses. Flow measurements of the Nam Ngum River
were used to quantify the water supply. A 43-year time series (1962-2004) of daily river discharge
was reconstructed from actual discontinuous data recorded in the river reach where most of the
pumping stations are found. Distinctions in the water resource assessment were made between
pristine conditions (before the construction of the hydropower dams) and current conditions of
water infrastructure development. A comparison of the water supply and demand indicates that
during the 4 driest months of the year (January to April) when the river reaches its minimum level
and the irrigation water demand is the highest, pumped volumes represent less than 30% of the
river discharge. This ratio should decrease as new hydropower dams are built, storing and releasing
more water during the wet and the dry season, respectively. These figures indicate that the
availability of water in the Nam Ngum River is not a limiting factor for irrigation, even during the dry
seasons of exceptionally dry years. The water demand could exceptionally exceed the water supply
in the case of an extreme scenario of irrigation development with irrigated areas 3-fold larger than
the current ones. Next analyses will consist in assessing how this water balance will be altered by the
development of new hydropower dams and irrigation projects. Possible uses of water surplus will be
prioritized, depending on their economic viability and benefits.
2
Index
Introduction………………………………………………………………………………………………………………………..………..3
I description of the study area…………………………………………………………………………………….…………........4
II review of previous studies…………………………………………………………………………..……………………………..5
III Assessment of the water demand in the Nam Ngum Basin………………………………………………………..8
III-1 Estimation of the water demand, based on the characteristics of pumping stations…………….…….9
III-2 Estimations of the water demand, based on statistics of irrigated areas………………………………..…10
III-3 Estimation of the water demand, based on delineated irrigated areas using satellite images…..11
III-4 Comparison of dry season irrigation water demands obtained from the 3 methods…………………12
IV Assessment of the water supply in pristine and current conditions of water infrastructure
development………………………………………………………………………………………………………………………….……13
IV-1 Data quality assessment……………………………………………………………………………………………………………14
IV-2 Reconstruction of a historical flow time series………………………………………………………………….………16
IV-3 Inter-and intra-annual variations of the water supply………………………………………………………………18
Part V: Comparison of the water demand and water supply in the Vientiane Plain………………………20
Summary and conclusions……………………………………………………………………………………………………………21
Acknowledgements…………………………………………………………………………………………………………………….22
References…………………………………………………………………………………………………………………………………..22
Annex…………………………………………………………………………………………………………………………………..……..25

3
Introduction
Although Lao PRD covers only one fourth of the Mekong River Basin, it contributes to more than one
third of the Mekong River flow. With the on-going increase of food and energy demands in this
under-developed country, several hydropower dams are under construction in the mountainous
areas while many irrigation schemes are rehabilitated or even expanded in the plains. The number of
households connected to the power grid (560,000 in 2007) increased by 2.5 times over the past 10
years and is expected to increase in the near future (SD & XP consultants Group and Nippon Koei,
2009). The number of hydropower dams in Laos (>10MW) is expected to increase from 6, in 2008, to
39, according to the number of MOUs on feasibility studies signed (Middleton et al., 2009). Dry
season irrigated areas have increased from 29,000ha in 1996, to 197,000ha in 2000 (Khamhung,
2002). Although the development of irrigations projects has slowed down during the early 2000s,
because of the lack of maintenance and the prohibiting cost of pumping (Phengphaengsy, 2005),
irrigated areas are expected to increase up to 450,000 ha with the development of new irrigation
projects over the coming decade (MRC, 2011). Most of previous studies which assessed the
environmental impacts of hydropower dams have focused on fisheries (Sarkkula et al., 2009) and
human livelihoods (Grumbine and Xu, 2011). The impact of hydropower dams on irrigated
agriculture remains poorly studied.
The Nam Ngum Basin is one of the most important in Lao PDR, in terms of size (7% of the country
area), annual flows (14% and 40% of the Mekong River flow and country’s contribution to the
Mekong River flow, respectively) and population (9% of the country’s population). In its lower part,
the Vientiane Plain is one of the largest food production areas in the country: it includes one third of
the national irrigated areas (DOI and JICA, 2009). While food demand is expected to continue to
increase in the future with several irrigation projects planned in the Vientiane Plain, hydropower
dams are under rapid development in the upstream part of the Nam Ngum Basin (WREA et al., 2009;
AFD and ADB, 2008). These rapid changes are modifying the seasonal availability of water resources,
and increasing the water demand for agricultural production. Previous studies (see details in Part II),
focusing on the Nam Ngum Basin, investigated either the environmental and social impacts of the
new hydropower dams or possible development scenarios (including hydropower and irrigation
development) and their likely impacts on the water resources. However, these studies did not
provide an assessment of the current water supply and water demand and of the impact of the main
hydropower dam (Nam Ngum 1) on the basin’s water balance.
This study assesses the water balance of the Nam Ngum Basin in the current conditions of water
infrastructure development. It investigates how the balance between water supply and water
demand varies between different types of meteorological years (wet and dry) and how it has been
altered by the Nam Ngum 1 hydropower dam (NN1). The study area is first presented (Part I).
Previous environmental and impact assessment studies of the Nam Ngum Basin are reviewed (Part
II). The agricultural water demand and the water supply in the Vientiane plain are quantified (Part III
and Part IV, respectively) and compared for different categories of hydrological years (dry, wet),
under pristine and current conditions of hydropower development (Part V). This water balance
assessment in the first stage of the project “Exploring Mekong Region Futures”. The next stage will
consist in assessing how this water balance will be altered by the development of new hydropower
dams and irrigation projects. Possible uses of water, in excess of environmental flows and existing
agricultural water demand will be prioritized, depending on their economic viability and benefits.

4
I Description of the study area
The Nam Ngum River Basin (16,700 km2) gathers 9% of the country’s population. Elevation in the
Nam Ngum Basin ranges from 155m above sea level at the confluence of the Nam Ngum River with
the Mekong River to 2,820m in Phou Bia Mountain. The basin is mostly hilly and mountainous and
includes two main flat areas: i/ the Vientiane Plain in the lower part of the basin where the Nam
Ngum River forms numerous meanders before flowing into the Mekong and ii/ the Xiengkhouang
Plateau, including the Plain of Jars located in the upper part of the basin. The Nam Ngum River has a
total length of 415.5 km. Climate of the Nam Ngum River Basin is tropical with two distinct seasons:
the wet season starts in June and ends in October and the dry season from November to May. Mean
annual rainfall ranges from 1,500 to 3,500mm and about 80% of annual precipitation is concentrated
during the wet season. In 2008, forest covered about 47% of the total basin area. One third of the
basin is covered by bamboo, shrub land and re-growing young forest (WREA, 2008). Cropped areas
cover about 10% of the basin’s surface area. Hydropower and mining are major contributors to the
national economy. In 2011, 3 hydropower dams are operating in the Nam Ngum Basin: the Nam
Ngum 1 dam (NN1), built in 1972, the Nam Ngum 2 dam and the Nam Lik 1&2 dam completed in
2010. Until 1977, NN1 was equipped with 2 turbines (15 MW/unit). Two and one additional turbines
of 40 MW, installed in 1978 and 1984, increased the total capacity to 155 MW. In addition, the Nam
Leuk and the Nam Mang hydropower dams, located outside of the Nam Ngum Basin, which started
operating in 2000 and 2005, respectively, are diverting water from the Nam Leuk and Nam Mang
Basins (South-east of Nam Ngum Basin) into the NN1 reservoir and the Vientiane plain, respectively.
Although these basins are relatively small (274 km2 and 82 km2, respectively), the installed capacity
of their hydropower plants is relatively high (60 MW and 40 MW, respectively), due to the high
water head. The Nam Song diversion is a run-of-river dam (not producing power), diverting water
from the Nam Song River into the NN1 reservoir (Figure 1).
Figure 1. Location of hydropower dams, water transfers and pumping stations in the Nam Ngum Basin

5
II Review of previous studies
Several environmental and hydrological studies have been undertaken in the Nam Ngum Basin. They
aimed at i/ assessing environmental and social impacts of future proposed dams (ADB, 1996, 2007;
China International Water & Electric Corp, 2007a,b,c; Vattenfall Power Consultant AB, 2008; SD & XP
consultants Group and Nippon Koei, 2009), ii/ detailing the project component of future hydropower
dams (Sinohydro corporation and Dongsay Company, 2007), and defining development scenarios
likely to influence water resource availability (Sanyu Consultants, 2004; AFD and ADB, 2008; WREA
et al, 2009).
In 1996, SOGREAH Ingénierie prepared an environmental impact assessment for the Nam Leuk dam
located outside the Nam Ngum Basin, whose turbine outflows (15 m3/s, in average) are diverted into
the reservoir of NN1 (with an average inflow of 382 m3/s). The objective was to assess impacts of the
dam on fisheries, hydrology, aquatic ecology and wild life. They found that additional discharge from
Nam Leuk dam during the dry season will raise the water level in Nam Ngum 1 reservoir by only a
few centimeters, far below the magnitude of the current water level fluctuations observed in the
reservoir. During the rainy season, the flows will be slightly reduced as a consequence of the dam
reservoir filling (ADB, 1996). China International Water & Electric Corp (2007a) assessed the
environmental impacts of Nam Lik 1 and 2 dams. These 2 dams were planned to be built along the
Nam Lik River, a tributary which joins the Nam Ngum River downstream of NN1 (only 1 dam, named
Nam Lik 1&2, was finally built 2010). This analysis includes water quality, aquatic systems, air quality,
inundation zones and fisheries assessments. The company suggested several measures to mitigate
negative effects such as erosion problems related to deforestation. China International Water &
Electric Corp (2007b) reviewed the institutional and legal framework, the international agreement
and conventions and the socio-economic conditions (public health, education, market,
transportation, tourism) at the sites where Nam Lik 1 and 2 dams have been planned. The impacts of
the dams on socio-economic conditions were assessed and mitigation measures were proposed.
China International Water & Electric Corp (2007c) proposed village, forest and land use planning and
allocation. They suggested crop and livestock development strategy, education program and tourism
development. ADB (2007) indicated that the construction of Nam Ngum 2 and 3 hydropower dams
may perturb the fishing industry taking place in the NN1 reservoir. This industry yields about 1,500
tons of fish per year, equivalent to USD 3 million annually and provides subsistence livelihood to the
villages around the NN1 reservoir and immediately upstream. By reducing the sediment input into
the NN1 reservoir and by modifying the inflow regime, the sustainability of this industry is uncertain.
Sinohydro Corporation and Dongsay Company (2007) detailed the Nam Ngum 5 dam project
components, the implementation schedule, mitigations plans, and institutional arrangements. Based
on secondary information, Vattenfall Power Consultant AB (2008) assessed the cumulative impact of
the Nam Ngum 3 dam on water quality and aquatic ecology. SD & XP Consultants Group and Nippon
Koei (2009) assessed the potential social and environmental impacts associated with the proposed
expansion of NN1 which consists in adding one additional turbine to the existing 5-turbine dam built
in 1971. The authors found that the major environmental impact would be induced by larger daily
water level fluctuations in the downstream Nam Ngum River.

6
AFD and ADB (2008) evaluated the hydrological impacts of 14 development scenarios in the Nam
Ngum Basin, for the year 2027. These scenarios account for hydropower development, re-
vegetation, irrigation development, out of basin transfers and climate change. They used the
Integrated Quantity Quality Model (IQQM) (Podger and Beecham, 2003) in combination with the Soil
Water Assessment Tool (SWAT) hydrological model, part of the Mekong River Commission’s Decision
Support Framework (DSF) (MRC, 2001). This analysis concluded that, while mean annual outflow of
the Nam Ngum Basin is about 21 km3, mean annual water use is about 0.273 km3 for irrigation and
0.063 km3 for domestic and industrial use. Irrigation development scenarios indicate that future
annual water demand will be about 0.459 and 1.067 km3, depending on which of the 61,000 ha and
100,000 ha irrigation development scenarios is considered. Current water use represents 1% of the
mean annual flow production in the basin. This percentage will increase up to 3% and 6% percent,
respectively, under the 2 irrigation scenarios, and up to 10% if a water transfer to Northeast
Thailand is also considered. Although this analysis concluded that water demand may exceed water
supply in extremely dry years, it did not estimate the frequency of occurrence of such events. Not
surprisingly, it was concluded that Nam Ngum 1 dam has the largest hydrological impact as it is the
largest dam in the basin, in term of power production and water storage capacity. The re-vegetation
scenario, considering that 70% of the basin would be covered by forest, resulted in reduced flows by
6% which in turn reduces power production by 5%. Climate change impacts remain uncertain as
projected flow either decrease or increase with a range varying from -2% to + 3%. It was finally
concluded that the installation of new gauging stations to measure inflow into the dams should
improve hydrological analyses, as well as SWAT and IQQM calibration. Further analyses are also
required to more confidently assess the hydrological impact of reforestation and assess how Nam
Ngum 1 and Nam Lik 1&2 dams should be operated to supply water for dry season irrigation in the
case of extreme dry years.
WREA et al (2009) undertook a modelling of the Nam Ngum River Basin with the aim to create a
decision support system to be used by the Nam Ngum River Basin committee. This modelling
approach includes a preliminary assessment of hydro-meteorological data, the parameterization of
hydrological and water balance models and the definition of development scenarios. Two models
were used:
- Mordor (Paquet, 2004) is a conceptual rainfall-runoff model used to simulate inflow into the
dam reservoirs of the Nam Ngum Basin. Developed in the 1990s for basins ranging from 100
to 10,000 km2, it works at hourly and daily time step. It consists of 4 reservoirs representing
stored water into the sub-surface soil and deep soil layers (groundwater). 17 parameters
need to be calibrated against observed hydro-meteorological time series. Model outputs are
river flow and evapotranspiration. The modelling activities, for the Nam Ngum Basin,
resulted in the following conclusions: the poor coverage and insufficient quality of rainfall
and flow data impeded a good model calibration. Simulated flows allowed accurate
representation of stored volumes in the reservoirs but were not reliable enough to forecast
daily river flow variations. According to the authors, improvement of modelling results
would require upgrading the network of hydro-meteorological measurements.
- Parsifal is a decision support system including a water balance model using the Mordor
simulated flow as input. Parsifal includes an optimization routine which theoretically aims at
minimizing operating costs while respecting several constraints such as satisfying the
7
electricity demand, the drinking water supply, the irrigation demand and environmental
flows constraints. This model also accounts for the power demand variations. Parsifal can be
used to optimize the reservoir management in order to provide sufficient storage to control
floods but this kind of study was not carried out during the project. Parsifal was mainly used
to study the impact of Nam Ngum 2 dam on NN1 hydropower production. It was concluded
that the operating rules of NN1, based on a target curve which assumes inflows for the next
year, cannot help in forecasting power production given the large variability of the rainy
season inflows.
Sanyu Consultants (2004) defined a conceptual plan to utilize the water resources of the Nam Ngum
Basin for agricultural development in the Vientiane Plain of Lao PDR and in the Khong-Chi Basin of
Northeast Thailand. They assessed the average runoff of Nam Ngum River in the Vientiane plain over
3 time periods: i/ before the completion of NN1, ii/ after the completion of NN1 and iii/ after the
completion of Nam Ngum 2, Nam Ngum 3, Nam Lik hydropower dams and Nam Lik irrigation dam.
They found that over these 3 successive periods, mean wet season (June to November) flow at the
Nam Ngum Basin outlet will successively be equal to 17,600 Mm3, 14,600 Mm3 and 12,500 Mm3,
while mean dry season (December to May) flow will successively be equal to 2,400 Mm3, 5,400 Mm3
and 7,500 Mm3. Based on the development projects of the Lao department of irrigation, Sanyu
Consultants (2004) found that about 150,000 ha could be irrigated in the Vientiane plain, equivalent
to a water demand of about 900 Mm3 and 1,500 Mm3 during the wet season and the dry season,
respectively. From these water volumes, 780 Mm3 and 1,300 Mm3 respectively, will be withdrawn
from the Nam Ngum River, the remaining part being pumped in the Mekong River. According to the
Mekong Agreement concluded by the Mekong riparian countries in 1995, a sufficient flow should be
maintained in the Nam Ngum River during the dry season to preserve environmental flows. This
requirement could be set at a minimum of 1,500 Mm3 corresponding to an exceptional dry year
before the completion of NN1. From this water balance assessment, the authors concluded that a
surplus of 4,700 Mm3 (i.e. 7,500 Mm3– 1,300 Mm3– 1,500 Mm3) could be diverted to irrigate the
Northeast region of Thailand during the dry season.
III Assessment of the water demand in the Nam Ngum Basin
The water demand in the Nam Ngum Basin is diverse and unequally distributed over the basin area
and between sectoral usages. WREA (2008) and AFD and ADB (2009) estimated that irrigation,
industry and domestic activities represent 99%, 0.95% and 0.05% of the water demand in the Nam
Ngum Basin, respectively. Therefore, this study is assessing the agricultural water demand only as
other water usages remain minor. About 75% of irrigated areas in the Nam Ngum Basin are
concentrated in the Vientiane Plain, most of the remaining 25% being found in the Xiengkhouang
plateau (DOI and JICA, 2009). As no measurements are available to quantify water resource in the
Xiengkhouang plateau, our water balance analysis is focusing on the Vientiane plain were most of
the water uses and river gauging stations are found. However, a possible expansion of irrigated
areas in the Xiengkhouang plateau and their impact on the water resources will be discussed in the
next stage of the project.
In the Nam Ngum Basin, as well as in the whole country of Laos, crops, mostly rice, are either
exclusively irrigated during the dry season, partly irrigated or exclusively rainfed during the wet
season. Our water balance assessment is focusing on the dry season only since our objective is to

8
identify periods with possible water supply shortages. During the dry season, crop water
requirements are fully covered by irrigation input as rainfall is nearly inexistent. The agricultural
water demand in the Vientiane Plain is assessed using 3 methods:
- As most of irrigation schemes in the Vientiane Plain are using water from the Nam Ngum
River, a first assessment of the agricultural water demand is based on the characteristics of
the pumping stations (Figure 2) and their irrigation calendar,
- Irrigated surface areas and mean crop water demand in the Vientiane plain are calculated
from available information collected at provincial and governmental administrative offices
as well as from foreign cooperation agencies,
- Actual dry season irrigated areas are delineated on satellite images from DigitalGlobe,
available on Google Earth web site.
Figure 2. Irrigated areas from the stations pumping in the Nam Ngum River in the Vientiane plain. Pumping station S23 is shown in Figure 3
III-1 Estimation of the water demand, based on the characteristics of pumping stations
The characteristics of the pumping stations in the Vientiane plain were obtained from the Irrigation
Divisions of the Provincial Department of the Lao Ministry of Agriculture and Forestry. A total of 42
pumping stations were installed along the Nam Ngum River in the Vientiane plain, mainly from 1995
to 2005 (the first one was installed in 1983). Each pumping station includes 2 to 9 pumping units.
The pumping capacity of each pumping unit ranges from 150 to 1,100 Liters/s. Detailed
characteristics of each pumping station are provided in Table 3 in the Annex. Total supplied water
from the pumping stations for the whole Vientiane plain was assessed by using irrigation calendars
and schedules of daily operations of 3 irrigation projects previously studied by Phengphaengsy
(2005): the Pak Khagnoung Irrigation project located in the Vientiane Plain, in the Prefecture of
Vientiane, the Kao Leo 2 project in Vientiane province and the Ton Hen project in Savannakhet
9
province. These 3 irrigation projects were surveyed during the 2003-04 dry season, from mid-
November to mid-April. In each of the 3 projects, irrigation calendars and daily pump operating time
were found to be similar: dry season rice was irrigated during 152 days, with an average of 12 hours
of pumping operating time per day. Those 152 days correspond to 3 cropping stages: nursery, land
preparation and transplanting (57 days), fertilizing period (49 days), flowering and grain filling (46
days). As nurseries require much less water than other cropping stages, the pumped volumes were
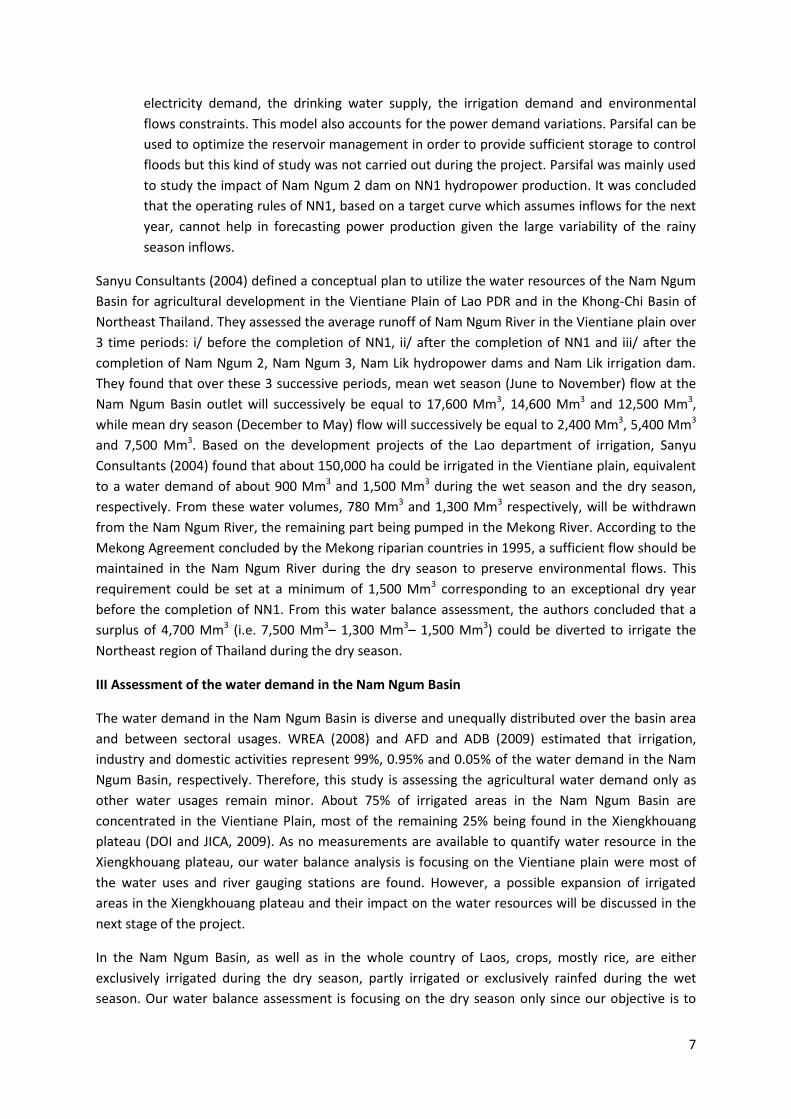
approximated based on a cropping duration of 137 days. Assuming that the pumping stations
operate at 80% of their full capacity (to account for the lack of maintenance of the pumping units,
and the prohibiting cost of electricity irrigation (Phengphaengsy, 2005)), the mean pumping
discharge (E1) was estimated from the maximum pumping capacity of 48m3/s corresponding to the
sum of pumping capacities of all pumping units of the 42 pumping stations (cf. Table 3 in Annex):
E1 = 48 × 3600 × 12 × 137 × 0.8 = 227 Mm3/year.
Figure 3. S23: one of the 42 pumping stations along the Nam Ngum River, built in 2003 and including 6 pumping units, each of them having a capacity of 1100 L/s
III-2 Estimations of the water demand, based on statistics of irrigated areas
Two estimations were calculated using statistics of irrigated areas.
The first one is based on available official statistics provided by the Department of Irrigation and the
Provincial Departments of Agriculture and Forestry of the Lao Government. For each of the 42
pumping stations, maximal and actual irrigated areas for rice and vegetable, during the wet and the
dry season are provided in Table 3 (in Annex). This table indicates that during the dry season,
maximum irrigated areas are equivalent to 7,871 ha of rice and 2,053 ha of vegetable and actual
irrigated areas are 5,352 ha of rice and 1,821 ha of vegetable. According to the theoretical statistic of
the Regulation on the Management and Use of Irrigation System in Lao (MAF, 1993), water demands
for dry season rice and vegetable are about 15,000 m3.ha-1.year-1 and 5,000 m3.ha-1.year-1,
respectively. From these figures, the total actual water demand E21 for the dry season irrigation is
estimated as follow:
E21 = (5,352 ha × 15,000 m3.ha-1.year-1) + (1,821 ha × 5,000 m3.ha-1.year-1) = 89 Mm3/year
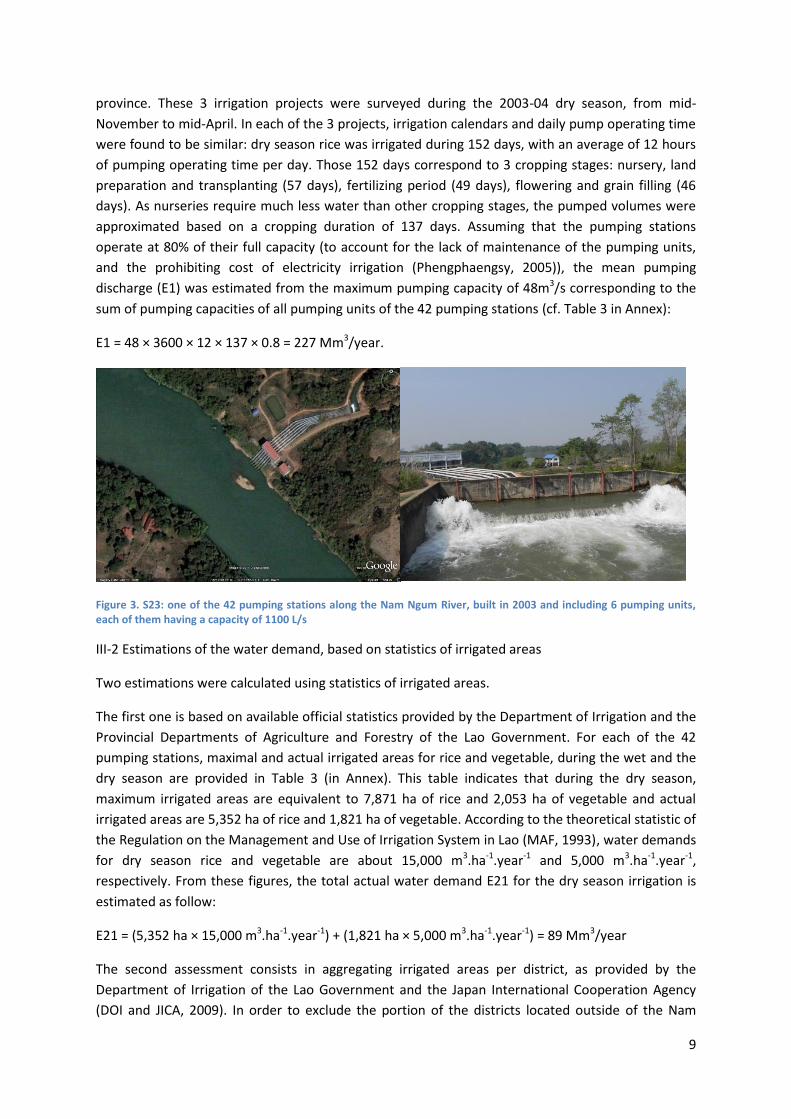
The second assessment consists in aggregating irrigated areas per district, as provided by the
Department of Irrigation of the Lao Government and the Japan International Cooperation Agency
(DOI and JICA, 2009). In order to exclude the portion of the districts located outside of the Nam
10
Ngum Basin, irrigated surface areas were scaled down, using the ratios of districts’ areas included in
the Nam Ngum Basin (right column of Table 1). Table 1 indicates that actual dry season irrigated
areas in the Vientiane plain are about 12,096 ha, higher than the estimations based on actual
irrigated areas per pumping station (i.e. 7,173 ha: 5,352 ha of rice and 1,821 ha of vegetable). This
difference is probably explained by the inclusion of areas irrigated by water resources other than the
Nam Ngum River (tributaries, groundwater) in this second calculation. Since these statistics do not
differentiate irrigated areas per crop types, same proportions of vegetable and rice as those used
previously (calculation of E21) are applied to assess the water demand: 12,096 ha of irrigated areas
is supposed to consist of 9,025 ha of rice and 3,071 ha of vegetable. Using the same dry season
water demands (15,000m3.ha-1.year-1 for rice and 5,000m3.ha-1.year-1 for vegetable), we estimated
the dry season irrigation water demand in the Vientiane plain as follow:
E22 = (9,025 ha × 15,000 m3.ha-1.year-1) + (3,071 ha × 5,000 m3.ha-1.year-1) = 151 Mm3/year
Table 1.Planed and actual irrigated areas per district. Districts overlapping the Vientiane plain are indicated in grey. Sub-total: sum from districts overlapping the Vientiane plain. Total: sum from all districts
III-3 Estimation of the water demand, based on delineated irrigated areas using satellite images
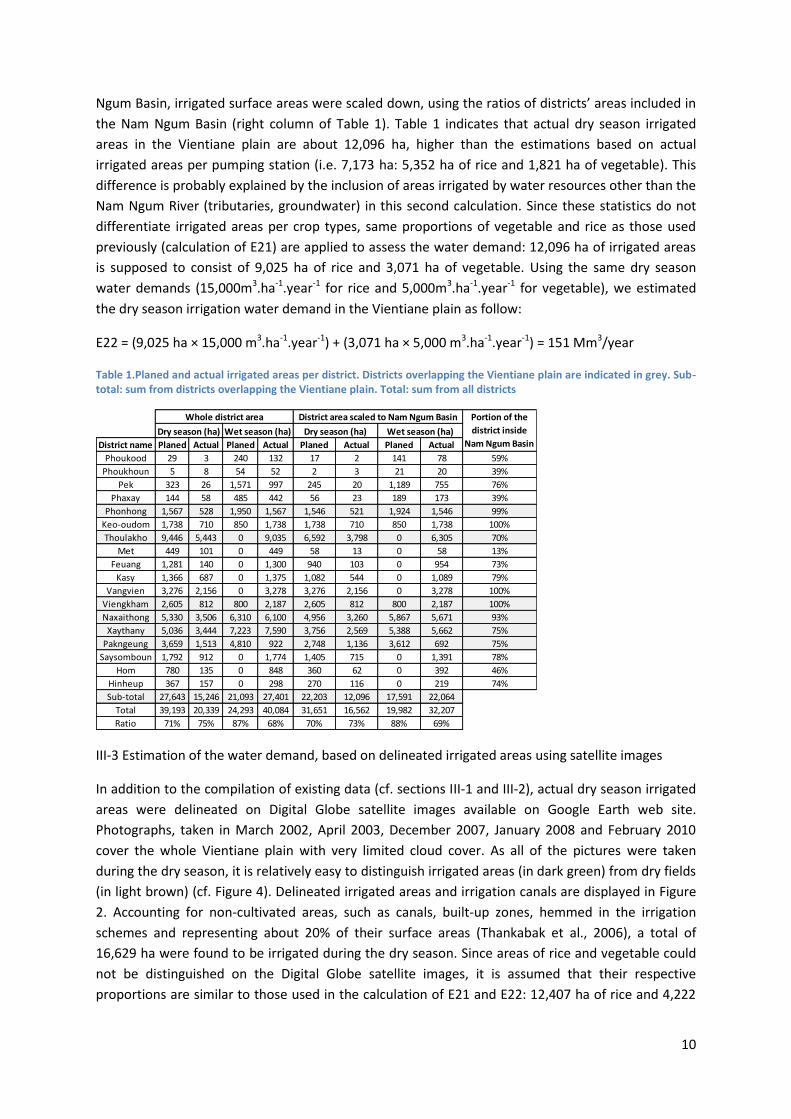
In addition to the compilation of existing data (cf. sections III-1 and III-2), actual dry season irrigated
areas were delineated on Digital Globe satellite images available on Google Earth web site.
Photographs, taken in March 2002, April 2003, December 2007, January 2008 and February 2010
cover the whole Vientiane plain with very limited cloud cover. As all of the pictures were taken
during the dry season, it is relatively easy to distinguish irrigated areas (in dark green) from dry fields
(in light brown) (cf. Figure 4). Delineated irrigated areas and irrigation canals are displayed in Figure
2. Accounting for non-cultivated areas, such as canals, built-up zones, hemmed in the irrigation
schemes and representing about 20% of their surface areas (Thankabak et al., 2006), a total of
16,629 ha were found to be irrigated during the dry season. Since areas of rice and vegetable could
not be distinguished on the Digital Globe satellite images, it is assumed that their respective
proportions are similar to those used in the calculation of E21 and E22: 12,407 ha of rice and 4,222
District name Planed Actual Planed Actual Planed Actual Planed Actual
Phoukood 29 3 240 132 17 2 141 78 59%
Phoukhoun 5 8 54 52 2 3 21 20 39%
Pek 323 26 1,571 997 245 20 1,189 755 76%
Phaxay 144 58 485 442 56 23 189 173 39%
Phonhong 1,567 528 1,950 1,567 1,546 521 1,924 1,546 99%
Keo-oudom 1,738 710 850 1,738 1,738 710 850 1,738 100%
Thoulakho 9,446 5,443 0 9,035 6,592 3,798 0 6,305 70%
Met 449 101 0 449 58 13 0 58 13%
Feuang 1,281 140 0 1,300 940 103 0 954 73%
Kasy 1,366 687 0 1,375 1,082 544 0 1,089 79%
Vangvien 3,276 2,156 0 3,278 3,276 2,156 0 3,278 100%
Viengkham 2,605 812 800 2,187 2,605 812 800 2,187 100%
Naxaithong 5,330 3,506 6,310 6,100 4,956 3,260 5,867 5,671 93%
Xaythany 5,036 3,444 7,223 7,590 3,756 2,569 5,388 5,662 75%
Pakngeung 3,659 1,513 4,810 922 2,748 1,136 3,612 692 75%
Saysomboun 1,792 912 0 1,774 1,405 715 0 1,391 78%
Hom 780 135 0 848 360 62 0 392 46%
Hinheup 367 157 0 298 270 116 0 219 74%
Sub-total 27,643 15,246 21,093 27,401 22,203 12,096 17,591 22,064
Total 39,193 20,339 24,293 40,084 31,651 16,562 19,982 32,207
Ratio 71% 75% 87% 68% 70% 73% 88% 69%
Dry season (ha) Wet season (ha)
Whole district area District area scaled to Nam Ngum Basin Portion of the
district inside
Nam Ngum BasinDry season (ha) Wet season (ha)

11
ha of vegetable. Using the same dry season rice water demand as that used in section III-2
(15,000m3.ha-1.year-1 for rice and 5,000 m3.ha-1.year-1 for vegetable), the dry season irrigation water
demand E3 was estimated as follows:
E3 = (12,407 ha × 15,000 m3.ha-1.year-1) + (4,222 ha × 5,000 m3.ha-1.year-1) = 207 Mm3/year
Figure 4. Example of irrigated areas along the Nam Ngum River in the Vientiane plain. Photograph taken on the 26 March 2002
III-4 Comparison of dry season irrigation water demands obtained from the 3 methods
Table 2 compiles the 4 assessments of the dry season irrigation water demand in the Vientiane plain.
The discrepancy between the values corresponding either to irrigated areas or irrigation volumes
(coefficients of variation = 32%) reflects the high uncertainty associated to the methods used in this
analysis. However, it is worth noting that the irrigation volumes calculated with the 1st and the 3rd
method are close to each other, suggesting that the capacity of the pumping stations is consistent
with the extension of irrigated areas.
Table 2. Assessment of dry season irrigated areas and irrigation volumes in the Vientiane Plain
Several uncertainties, due to the lack of accurate data, are listed below:
Irrigated areas (ha) Irrigation volume (Mm3)
1. Water Volumes pumped in the Nam Ngum River 227
2.1 Irrigated area per pumping station 7,173 89
2.2 Irrigated per administrative division 12,096 151
3. Delination of irrigated areas using satellite imagery 16,629 207
11,966 169
Standard deviation 3,861 54
Coefficient of variation 32% 32%
Met
ho
ds
Average
12
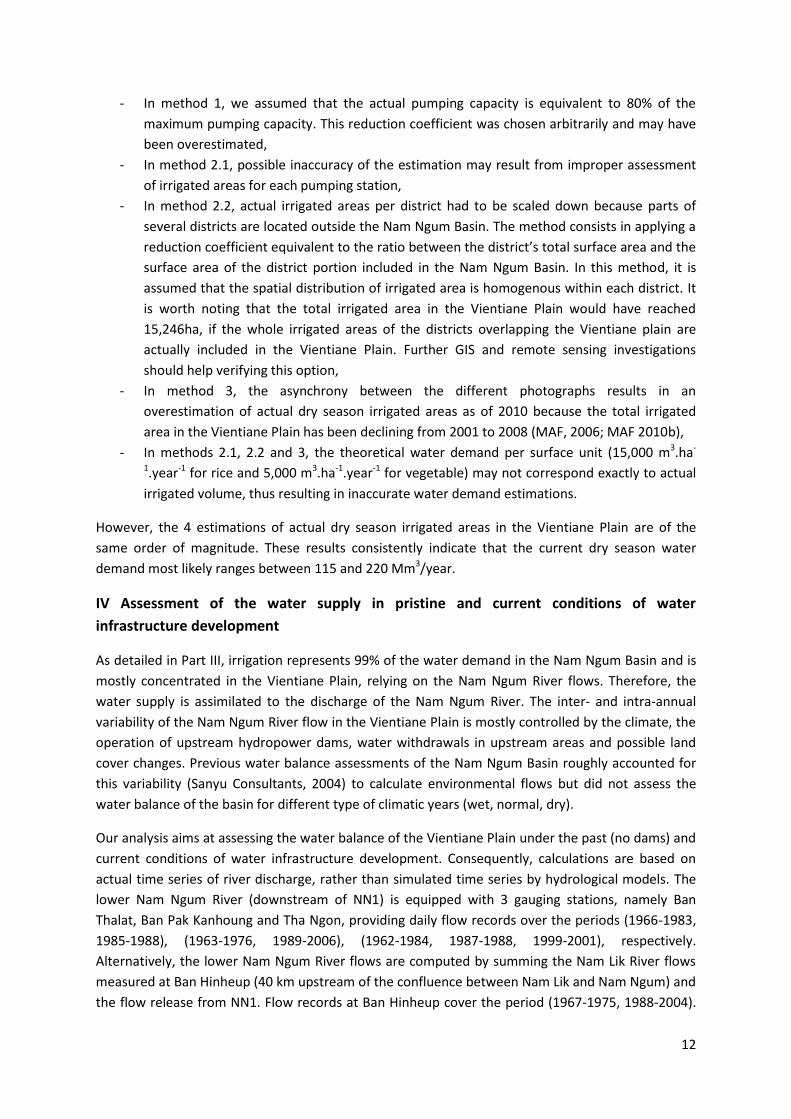
- In method 1, we assumed that the actual pumping capacity is equivalent to 80% of the
maximum pumping capacity. This reduction coefficient was chosen arbitrarily and may have
been overestimated,
- In method 2.1, possible inaccuracy of the estimation may result from improper assessment
of irrigated areas for each pumping station,
- In method 2.2, actual irrigated areas per district had to be scaled down because parts of
several districts are located outside the Nam Ngum Basin. The method consists in applying a
reduction coefficient equivalent to the ratio between the district’s total surface area and the
surface area of the district portion included in the Nam Ngum Basin. In this method, it is
assumed that the spatial distribution of irrigated area is homogenous within each district. It
is worth noting that the total irrigated area in the Vientiane Plain would have reached
15,246ha, if the whole irrigated areas of the districts overlapping the Vientiane plain are
actually included in the Vientiane Plain. Further GIS and remote sensing investigations
should help verifying this option,
- In method 3, the asynchrony between the different photographs results in an
overestimation of actual dry season irrigated areas as of 2010 because the total irrigated
area in the Vientiane Plain has been declining from 2001 to 2008 (MAF, 2006; MAF 2010b),
- In methods 2.1, 2.2 and 3, the theoretical water demand per surface unit (15,000 m3.ha-
1.year-1 for rice and 5,000 m3.ha-1.year-1 for vegetable) may not correspond exactly to actual
irrigated volume, thus resulting in inaccurate water demand estimations.
However, the 4 estimations of actual dry season irrigated areas in the Vientiane Plain are of the
same order of magnitude. These results consistently indicate that the current dry season water
demand most likely ranges between 115 and 220 Mm3/year.
IV Assessment of the water supply in pristine and current conditions of water
infrastructure development
As detailed in Part III, irrigation represents 99% of the water demand in the Nam Ngum Basin and is
mostly concentrated in the Vientiane Plain, relying on the Nam Ngum River flows. Therefore, the
water supply is assimilated to the discharge of the Nam Ngum River. The inter- and intra-annual
variability of the Nam Ngum River flow in the Vientiane Plain is mostly controlled by the climate, the
operation of upstream hydropower dams, water withdrawals in upstream areas and possible land
cover changes. Previous water balance assessments of the Nam Ngum Basin roughly accounted for
this variability (Sanyu Consultants, 2004) to calculate environmental flows but did not assess the
water balance of the basin for different type of climatic years (wet, normal, dry).
Our analysis aims at assessing the water balance of the Vientiane Plain under the past (no dams) and
current conditions of water infrastructure development. Consequently, calculations are based on
actual time series of river discharge, rather than simulated time series by hydrological models. The
lower Nam Ngum River (downstream of NN1) is equipped with 3 gauging stations, namely Ban
Thalat, Ban Pak Kanhoung and Tha Ngon, providing daily flow records over the periods (1966-1983,
1985-1988), (1963-1976, 1989-2006), (1962-1984, 1987-1988, 1999-2001), respectively.
Alternatively, the lower Nam Ngum River flows are computed by summing the Nam Lik River flows
measured at Ban Hinheup (40 km upstream of the confluence between Nam Lik and Nam Ngum) and
the flow release from NN1. Flow records at Ban Hinheup cover the period (1967-1975, 1988-2004).

13
Turbine and spillway outflows from NN1, about 4 km upstream from the confluence between Nam
Lik and Nam Ngum River, have been measured continuously since January 1972. The estimation of
the Nam Ngum River flow is hereafter referred to as “NN1+Ban Hinheup”. The location of these flow
stations is detailed in Figure 5.
Figure 5. Location of river flow stations in the Lower Nam Ngum Basin
IV-1 Data quality assessment
The poor quality and reliability of flow data in the Nam Ngum Basin have been repeatedly
mentioned to justify the difficulty in obtaining reliable water assessments. After having visited nearly
all hydro-meteorological stations of the Nam Ngum Basin, WREA et al. (2009) concluded that the
monitoring network is in fair to poor condition, due to the lack of maintenance and of spare parts.
Some river flow stations were found to be installed in inappropriate locations such as flat sandy
banks, subject to erosion or material deposit modifying the river cross section, resulting in unreliable
water level – flow rating curves and inaccurate discharge estimations. Consequently, our
hydrological analysis first attempts to assess the reliability of flow data at the above-mentioned
stations (Ban Thalat, Ban Pak Kanhoung, Tha Ngon and NN1+Ban Hinheup). The reliability of the 4
flow time series is assessed by comparing their respective mean annual values for the wet season
(June to November) and the dry season (December to May). Figure 6 displays these values for the
period 1962-2004.

14
Figure 6. Evolution of dry and wet season flows in the lower Nam Ngum River basin according to available gauging stations’ records. Discrepancies are highlighted by red ellipses. Calendar of water infrastructure developments is indicated in parallel to the flow time series
Figure 6 shows that inter-annual flow variations at the different stations follow the same trends,
thus indicating the relatively good quality of flow measurements, either during the dry season or
during the wet season. Flows values are generally higher at downstream stations, in response to the
accumulation of inflow from tributaries, surface runoff (during the wet season) and water table
drainage (during the dry season). This natural trend is clear from the relative positions of the flow
curves from the beginning of the records until 1972 and until 1983 for the dry season and for the
wet season, respectively (cf. Figure 6): the respective positions of the flow curves follow the order of
the stations along the river, with the highest discharge values corresponding to the topographically
lowest station.
During the dry season, from 1973 to 1976, only Ban Thalat and Tha Ngnon flows follow this trend
while NN1+Ban Hinheup exhibit doubtful values, especially in 1975, as highlighted by the red ellipse.
In 1977, another discrepancy is observed at Ban Thalat station as dry season flow is much lower than
that from Tha Ngon and NN1+Ban Hinheup. From 1979 to 1986, flow values are not ranked in a
realistic way, the upstream discharge values being much higher than those observed downstream.
During this period, relative differences between flow values range from 5% to 24%, suggesting that
possible errors of flow measurements are of about the same magnitude. Although it is not possible
to conclude which station provides the most/least reliable data, the comparison of flow data over

15
the initial period (1962-1972) suggests that Tha Ngon is the most reliable. However, this station may
have been damaged later on. Flow data observed in 1987 and 1988 at Tha Ngon, Ban Thalat and
NN1+Ban Hinheup are similar, thus providing credence on the reliability of these measurements.
From 1989 onward, there are unrealistic gaps observed between the different stations,
corresponding to relative errors ranging from 4% to 22%. It must be pointed out that over the period
1999-2001, flow measured at the stations Tha Ngon, Ban Pak Kahnoung and NN1+Ban Hinheup are
extremely consistent. This comparative analysis shows that the discrepancies between flow data
recorded at different stations are not uniform over time, meaning that specific stations are not
systematically underestimating or overestimating values. Thus errors most likely result from
inaccurate measurements.
During the wet season, except for NN1+Ban Hinheup, curves of annual flows exhibit realistic
behaviours in most years. Similar to the dry season, there are anomalies in 1977 at Ban Thalat where
flow (293m3/s) is much lower than that recorded at Tha Ngon and NN1+Ban Hinheup (708m3/s and
512m3/s, respectively). In general, the flow curves of downstream stations generally display the
greatest flow values. It is therefore not possible to assimilate difference of flow volumes at different
stations to errors as these differences may rather reflect the natural positive gradient of river
discharge from upstream to downstream areas. These observations indicate that flow
measurements are much more reliable during the wet season. The likely reason for this is that the
measurement of dry season flows is impeded by the instability and irregularity of the cross river
sections making the water level – flow discharge relationship curve less reliable.
The main results of this assessment are:
- Flow data are, in general, of good quality, with relative error of discharge measurements not
exceeding about 24%. Although not quantified here, errors are likely to be much lower
during the wet season. A further uncertainty analysis (not reported here) would consist in
analysing correlation of flows between different stations and identifying outliers.
- As records for specific years were found to be doubtful at Ban Thalat and Ban Pak Kanhoung
stations (cf red ellipses in Figure 6), Tha Ngon appears to be the most reliable station.
IV-2 Reconstruction of a historical flow time series
Because of their greater reliability, data measured at Tha Ngon station are used to characterize the
variability of the water supply in the Vientiane plain. Record gaps in the flow time series of Tha Ngon
(Figure 7) were filled in through linear regression using the Ban Pak Kahnoung flow time series: dry
and wet season flow at Tha Ngon are approximated using dry and wet season flow records of Ban
Pak Kahnoung station, multiplied by 1.02 and 1.12 coefficients, respectively, as determined in Figure
8.
Figure 7. Availability of flow data in the Lower Nam Ngum Basin. Black: data are available. Grey: data are not available
1962
1963
1964
1965
1966
1967
1968
1969
1970
1971
1972
1973
1974
1975
1976
1977
1978
1979
1980
1981
1982
1983
1984
1985
1986
1987
1988
1989
1990
1991
1992
1993
1994
1995
1996
1997
1998
1999
2000
2001
2002
2003
2004
NO DAM 2 TURBINES 4 TURBINES 5 TURBINES
NO WATER DIVERSION 1 DIVERSION 2 DIVERSIONSNam Ngum 1 dam
Ban Hinheup
Tha Ngone
Ban Pak Kanhoung
Thalat
16
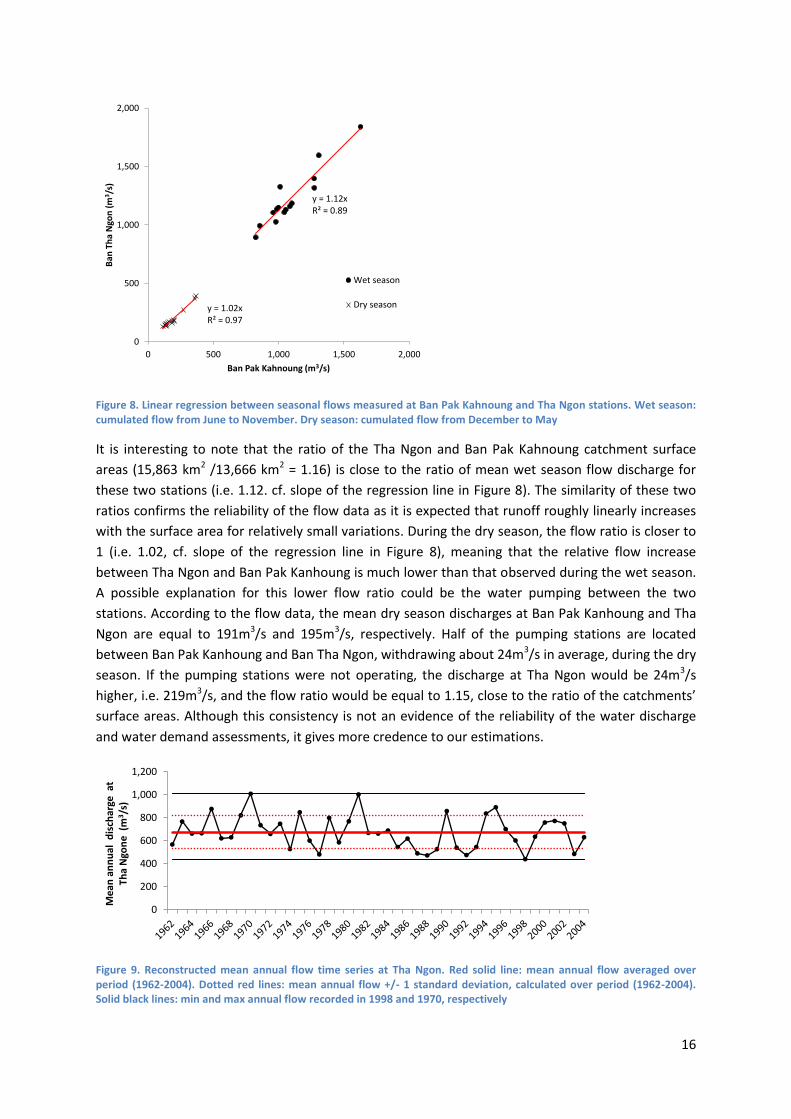
Figure 8. Linear regression between seasonal flows measured at Ban Pak Kahnoung and Tha Ngon stations. Wet season: cumulated flow from June to November. Dry season: cumulated flow from December to May
It is interesting to note that the ratio of the Tha Ngon and Ban Pak Kahnoung catchment surface
areas (15,863 km2 /13,666 km2 = 1.16) is close to the ratio of mean wet season flow discharge for
these two stations (i.e. 1.12. cf. slope of the regression line in Figure 8). The similarity of these two
ratios confirms the reliability of the flow data as it is expected that runoff roughly linearly increases
with the surface area for relatively small variations. During the dry season, the flow ratio is closer to
1 (i.e. 1.02, cf. slope of the regression line in Figure 8), meaning that the relative flow increase
between Tha Ngon and Ban Pak Kanhoung is much lower than that observed during the wet season.
A possible explanation for this lower flow ratio could be the water pumping between the two
stations. According to the flow data, the mean dry season discharges at Ban Pak Kanhoung and Tha
Ngon are equal to 191m3/s and 195m3/s, respectively. Half of the pumping stations are located
between Ban Pak Kanhoung and Ban Tha Ngon, withdrawing about 24m3/s in average, during the dry
season. If the pumping stations were not operating, the discharge at Tha Ngon would be 24m3/s
higher, i.e. 219m3/s, and the flow ratio would be equal to 1.15, close to the ratio of the catchments’
surface areas. Although this consistency is not an evidence of the reliability of the water discharge
and water demand assessments, it gives more credence to our estimations.
Figure 9. Reconstructed mean annual flow time series at Tha Ngon. Red solid line: mean annual flow averaged over period (1962-2004). Dotted red lines: mean annual flow +/- 1 standard deviation, calculated over period (1962-2004). Solid black lines: min and max annual flow recorded in 1998 and 1970, respectively
y = 1.12xR² = 0.89
y = 1.02xR² = 0.97
0
500
1,000
1,500
2,000
0 500 1,000 1,500 2,000
Ban
Th
a N
gon
(m
3/s
)
Ban Pak Kahnoung (m3/s)
Wet season
Dry season
0
200
400
600
800
1,000
1,200
Mea
n a
nn
ual
dis
char
ge a
t
Tha
Ngo
ne
(m
3/s
)
17
The reconstructed flow time series at Tha Ngon is displayed in Figure 9. It indicates that multi-annual
average flow is about 673 m3/s. Inter-annual variability can be characterized by the coefficient of
variation (standard deviation/average) which is equal to 21%, meaning that in average, annual flows
are either 21% higher or lower than the multi-annual average. Figure 9 also indicates that during
extreme years, mean annual flow can reach values equivalent to 65% (in 1998) or 150% (in 1970) of
the multi-annual average. This pronounced inter-annual variability indicates that the multi-annual
average of the river flow discharge is not sufficient to characterize the water resource availability.
The flow variability displayed in Figure 9 results from the combination of i/ the natural climate
variability, ii/ the inter-annual variations of the water storage of NN1 at the beginning of the
monsoon, iii/ the new diverted flow to the reservoir of NN1, originating from the Nam Leuk River
since 2000, although diverted flow volumes remain minor. The water diversion from the Nam Song
River into NN1 reservoir, which started in 1996, has slighter impact on observed flow variability
observed at Tha Ngon since it is an intra-basin water transfer.
IV-3 Inter-and intra-annual variations of the water supply
The reconstructed time series of historical flows at Tha Ngon, although useful to investigate inter-
annual variability of annual flow, is not appropriate to assess the current multi-annual variability of
seasonal flows (i.e. wet and dry season flows) as the seasonal regime of the river has been altered by
the successive installation of equipment of NN1. For instance (cf. Figure 6), mean multi-annual dry
season flow measured at Tha Ngon increases by 100%, in average, after 1978 (i.e. multi-annual dry
season flow at Tha Ngon before and after 1978 is about 160m3/s and 328 m3/s, respectively). This
flow increase is attributable to the installation of two additional turbines in NN1 in 1978. In contrast,
wet season flow discharge has been regularly decreasing from the early 1970s (about 1200 m3/s) to
the 1990s (about 700 m3/s), as a result of enhanced available storage capacity of the dam caused by
higher dry season release. To account for and characterize these changes in the seasonal flow
regime, the reconstructed time series of historical flows at Tha Ngon is split into 2 sub-periods: the
period 1962-1971 is considered as a reference period used to characterize the flow variability in
natural conditions (no dams and no water diversions). For the second sub-period, mean monthly
flow diverted from Nam Leuk dam (averaged over the period 2001-2007) were added to the monthly
flow of Nam Ngum River at Tha Ngon over the periods (1985-1999). In that way, the period 1985-
2004 represents the current conditions of water infrastructure development (NN1 equipped with 5
turbines + water diversion). Flows diverted from Nam Song River were not added to the Nam Ngum
flow measured at Tha Ngon as it is a diversion within the Nam Ngum Basin. Figure 10 displays the
frequency distribution of monthly flow of the Nam Ngum River at Tha Ngon, under the current
conditions of water infrastructure development (based on the modified 1985-2004 flow time series).
It indicates that, during a normal year, mean monthly flows range from 285m3/s, in February, to
1,360 m3/s, in September. Bold and light dotted curves correspond to extreme years (either dry or
wet) with return probabilities equivalent to 5 and 100 years, respectively. These curves indicate that
4 years out of 5, the dry season is greater than 238m3/s, or lower than 400m3/s. During extreme dry
years (non-exceedence probability = 1%), the mean dry season discharge is about 194m3/s. In
contrast, during extreme wet years (exceedence probability = 1%), maximum discharge observed in
August is about 2,462m3/s.

18
Figure 10. Frequency distribution of monthly flow of Nam Ngum River at Tha Ngon station under current water infrastructure development (as of 2010). Percentage values correspond to non-exceedence frequencies
The impact of the existing water infrastructure development (NN1 equipped with 5 turbines + 2
water diversions) on the seasonal distribution of the Nam Ngum River flows is assessed by
comparing the frequency distribution of flows in current and pristine conditions (i.e. before NN1
started operating). Figure 11 displays mean and extreme monthly flows of Nam Ngum River at Tha
Ngon in pristine conditions (based on the 1962-1971 flow time series) and in current conditions
(based on the modified 1985-2004 flow time series). Thanks to its storage capacity, NN1 is
moderating seasonal variations of the river flow. In average, peak flow in current conditions are
equivalent to 60% of peak flow observed under pristine conditions. In contrast, dry season flows
have increased by about 66% for extreme dry years (117m3/s to 194m3/s, corresponding to a 100-
year return period) up to 160% for extreme wet years (187m3/s to 486m3/s, corresponding to a 100-
year return period). This comparison highlights the benefits of the dam in limiting the risk of floods
during the wet season and increasing the water resource and water level for irrigation and
navigation, respectively, during the dry season. This strong influence of NN1 dam on the Nam Ngum
River regime is explained by the exceptionally high storage capacity of this dam, in comparison with
other dams in the Mekong Basin: the full storage capacity (9 km3) of NN1 is equivalent to its mean
cumulative annual inflow. It is also worth noting that the mean dry season flow of extreme dry years
(100-year return period) under current conditions (194 m3/s) is close to the dry season flow of the
wettest years (100-year return period) in pristine conditions (187 m3/s). This comparison exemplifies
the greatest anthropogenic impacts on flow regime, in comparison with the influence of climate
variability and the positive impact of the dam in terms of water resources availability during the dry
season. It could be argued that the calculation of the extreme flow return periods is biased as it was
calculated using a 20-year flow record (from 1985 to 2004) not long enough to capture extreme
years. However, Figure 9 shows that the period 1962-1984 is wetter (mean annual flow = 713m3/s)
than the period 1985-2004 (mean annual flow = 628m3/s), thus indicating that the flow discharges
corresponding to exceptional dry years, displayed in Figure 10, Figure 11, Figure 12 and Error!
Reference source not found. are most likely underestimated. Therefore, our calculations are
conservative.
0
500
1,000
1,500
2,000
2,500
3,000
Jan Feb Mar Apr May Jun Jul Aug Sep Oct Nov Dec
Dis
char
ge a
t Th
a N
gon
e (m
3/s
) 1% 20% Mean 80% 99%

19
Figure 11. Comparison of mean monthly flow at Tha Ngon under pristine conditions (no dams and no water diversion) in red, and under current conditions of water infrastructure development (as of 2010), in black. Solid curves: normal year. Dotted curves: extreme years with a return period of 100 years
V Comparison of the water demand and water supply in the Vientiane Plain
Lowest and highest values of the current water demand (i.e. 115 and 220 Mm3/year), assessed in
part III, are converted to cubic meters per second, assuming that the pumping stations are operating
12 hours/day and 137 days/year (Phengphaengsy, 2005). This pumps’ operation calendar is not
based on the actual water demand of the crops, which would result in varying monthly demands
depending on the crop development stages, but rather on a uniform water supply calendar as
observed in the field. Total pumping rates (20 to 37m3/s) are compared to the water supply, either
under pristine conditions (Figure 12 A) or under current conditions of water infrastructure
development (Figure 12 B). These graphs indicate that, throughout the dry season, the water
demand is much lower than the water supply, even during the driest months (February, March and
April) of the driest years. Before NN1 construction, the lowest river discharge (with a return period
of 100 years) was reached in April, with a minimum value of 82m3/s. In the current conditions, the
lowest river discharge (with a return period of 100 years) is reached between January and March,
with an average value of 169m3/s. These 2 discharge values are much higher than the maximum
water demand of 37m3/s.
Figure 12. Comparison of the current irrigation water demand with water supply in pristine conditions (A) (no upstream dam and no water diversion) and current water infrastructure development (NN1 equipped with 5 turbines and water diversion) (B)
0
500
1000
1500
2000
2500
3000
3500
Jan Feb Mar Apr May Jun Jul Aug Sep Oct Nov Dec
Dis
char
ge a
t Th
a N
gon
e (m
3/s
)

20
Error! Reference source not found. shows the water balance of the Nam Ngum Basin in the extreme
case of a maximal water demand (all pumping units are operating simultaneously, i.e. the pumping
discharge is about 48m3/s) and a minimal water supply corresponding to the dry season during an
extreme dry year (100-year return flow period). Environmental river flows are set either according to
the 1995 Mekong Agreement indicating that the Nam Ngum River flow should be maintained above
1,500 Mm3 during the dry season (Sanyu Consultants 2004) (equivalent to the mean dry season flow
observed at Tha Ngon under pristine conditions: 96m3/s) or equivalently to the minimum natural dry
season flows with a 100-year return period (i.e. 82m3/s). Depending on the selected environmental
flow value (82 or 96m3/s), the river flow should remain greater than 82+48=130m3/s or
96+48=144m3/s to allow the pumping stations operating at their full capacity. Figure 12 and Error!
Reference source not found. indicate that actual river flows remain higher than these values even
during the driest months of the driest years: the minimal river flow is about 169m3/s. The maximal
pumping capacity could increase by 52% (up to 73m3/s) with no risk of water shortages. Another
option could consist in diverting part of the water surplus to Northeast Thailand for irrigation, as
suggested by Sanyu Consultants (2004), the remaining portion being allocated to future additional
water demand, as suggested.
Figure 13. Water balance of the Nam Ngum Basin in extreme conditions (highest water demand and lowest water supply), under current conditions of water infrastructure development. Lower blue line: environmental flow (lower bound). Dotted blue line: environmental flow (upper bound). Upper blue line: dry season river flow of the Nam Ngum River for a dry year with a 100-year return period
Summary and conclusion
This study is the first stage of the project “Exploring Mekong Region Futures”. The main objective of
this analysis was to provide an assessment of the current water demand and water supply in the
Nam Ngum Basin, which has been subject to intense water infrastructure development over the last
30 years: the Nam Ngum 1 hydropower dam, with a storage capacity of 9km3, was built in 1972 to
provide electricity sold to Thailand. This dam was successively equipped with additional turbines in
1978 and 1984. Two river water diversions were designed in 1996 and 2000 to increase water
volumes flowing into the Nam Ngum 1 hydropower dam, thus increasing the power production.
From 1983 to 2005, 42 large-scale pumping stations, with a total capacity of 48m3/s were installed
21
along the Nam Ngum River in the Vientiane plain, to irrigate about 20,000 ha of rice and vegetable.
Although the impact of each of these hydraulic works had been assessed individually, their
cumulative impact on the water balance of the Nam Ngum Basin remained unknown. Our results
indicate that, even during extreme dry years, the dry season water supply remains much greater
than the agricultural water demand which represents 99% of the total water demand in the basin.
The excessive amount of the water supply during the dry season results from the NN1 flow release
enhancing the natural flow of the Nam Ngum River by about 70%. This case study exemplifies one of
the positive effects that hydropower dams can have, beside the production of hydropower. This
secondary effect of hydropower development on dry season flow may continue being beneficial as
irrigated areas are expected to increase in the near future in the Vientiane plain with the
development of new irrigation projects. The next stage of the project “Exploring Mekong Region
Futures” will consist in assessing how this water balance will be altered by the development of new
hydropower dams and irrigation projects. Possible uses of water surplus will be prioritized,
depending on their economic viability and benefits.
Acknowledgements
This study was supported by the Commonwealth Scientific and Industrial Research Organisation
(CSIRO) - Australian Agency for International Development (AusAID) Research for Development
Alliance. The authors are grateful to the Department of Irrigation, Ministry of Agriculture and
Forestry of the Lao Government (MAF), to the Irrigation Divisions of Provincial Departments of
Vientiane Prefecture and Vientiane Capital, MAF, to the National Agricultural and Forestry Research
Institute (NAFRI), MAF, to the Department of Meteorology and Hydrology, Ministry of Natural
Resources and Environment of the Lao Government (MoNRE) and to the Nam Ngum River Basin
Committee (NNRBC), MoNRE, for the provision of data and fruitful discussions.
References
Agence Francaise de Développement (AFD) and Asian Developing Bank (ADB). 2008. Hydrological
Analysis of Development Scenarios, Nam Ngum River Basin. Published by Water Resources and
Environment Administration (WREA), Vientiane, Lao PDR
AFD and ADB. 2009. Nam Ngum River Basin Integrated Water Resources Management Plan.
Published by WREA, Vientiane, Lao PRD
ADB. 1996. Summary Environmental Impact Assessment for the Nam Leuk Hydropower Project in
Lao PDR. Excerpts from Project Performance Audit Report on the Nam Leuk Hydropower Project in
the Lao PDR, ADB, Operations Evaluation Department, 2004, compiled by International Rivers
Network
ADB, 2007. Lao People’s Democratic Republic: Preparing the Cumulative Impact Assessment for the
Nam Ngum 3 Hydropower Project. Project Number 40514, Technical Assistance Report. February
2007
22
China International Water & Electric Corp, National Consulting Company. 2007a. First Draft Final:
Environmental Impact Assessment – Nam Lik 1-2 Hydropower Project. China
China International Water & Electric Corp, National Consulting Company. 2007b. First Draft Final:
Social Impact Assessment and Social Action Plan. NamLik 1-2 Hydropower Project. Vientiane
Province Lao PDR
China International Water & Electric Corp, National Consulting Company. 2007c. First Draft Final:
Watershed Management Plan Nam Lik 1-2 Hydropower Project. Vientiane, Lao PDR.
DOI (Department of Irrigation) and JICA (Japan International Cooperation Agency), 2009. Proposal on
Improvement for IMT Legal framework. Output 1 of Irrigation Development Advisor, JICA
Grumbine RE and Xu J 2011. Mekong Hydropower Development. Science, 332, policy forum
Khamhung A 2002. Land and water investment in the Lao PDR. In: Investment in Land and Water.
Food and Agriculture Organization of the United Nations. RAP publication 2002/09. Proceedings of
the Regional Consultation. Bangkok, Thailand, 3-5 October 2001
Middleton C, Garcia J and Foran T. 2009. Old and new hydropower players in the Mekong Region:
agendas and strategies. In: contested waterscapes in the Mekong Region: hydropower, livelihoods
and governance. Molle F, Foran T and Käkönen M (Edts). Earthscan, London
Ministry of Agriculture and Forestry, 1993. Regulation on the management and use of irrigation
system in the Lao PDR. No 0593/MAF, Vientiane. Lao PDR
Ministry of Agriculture and Forestry. 2006. Agricultural statistics. 30 years: 1976-2005.Vientiane, Lao
PDR
Ministry of Agriculture and Forestry. 2010a. Government investment plan to supply water in
Vientiane Prefecture Province for years 2011 to 2015. Provincial Agriculture and Forestry Office,
Division of Irrigation, Vientiane Province. Lao PDR
Ministry of Agriculture and Forestry. 2010b. Agricultural Statistics. Year book 2009.Department of
planning, Vientiane capital, Lao PDR
MRC, 2011. Assessment of Basin-wide Development Scenarios. Basin Development Plan Program,
Phase 2. Mekong River Commission (MRC), Vientiane, Lao PDR
Paquet, E. 2004. A new version of the hydrological model MORDOR: snowpack model at different
elevations. La Houille Blanche
Phengphaengsy F 2005 Sustainable irrigation projects in Laos, effective water management of pump
irrigation projects in the Mekong River and its tributaries. Master thesis, Tokyo University of
Agriculture and Technology, Japan
Podger, G. and Beecham, R. 2003. IQQM User Guide Version v7.29.0, Department of Infrastructure,
Planning and Natural Resources (DIPNR), Australia.

23
Sanyu Consultants 2004. Nam Ngum Water Management Project for Vientiane Plain of Lao PDR and
Northeast Thai Region. Sanyu Consultants Inc. in association with Sanyu Consultants (Thailand) Ltd.
Bangkok
Sarkkula J, Keskinen M, Koponen J, Kummu M, Richey JE and Varis O. 2009. Hydropower in the
Mekong Region: What are the likely impacts upon fisheries? In: Contested waterscapes in the
Mekong Region: hydropower, livelihoods and governance. Molle F, Foran T and Käkönen M (Edts).
Earthscan, London
SD & XP consultants Group and Nippon Koei. 2009. Final report: initial environmental and social
examination of Nam Ngum 1 hydropower station expansion. Vientiane, Lao PDR
Sinohydro corporation and Dongsay Company. 2007. Nam Ngum 5 Hydropower project. Update of
environmental management plan. Sinohydro corporation LTD. Dongsay Company LTD, China
Thenkabail PS, Biradar CM, Turral H, Noojipady P, Li YJ, Vithanage J, Dheeravath V, Velpuri M, Schull
M, Cai XL, Dutta R 2006. An irrigated area map of the world (1999) derived from remote sensing.
Research Report 105. Colombo, Sri Lanka: International Water Management Institute
Vattenfall Power Consultant AB. 2008. Lao People’s Democratic Republic: preparing the Cumulative
Impact Assessment for the Nam Ngum 3 Hydropower Project. Technical Assistance Consultant’s
Report. Project Number: 40514. February 2008. Vattenfall Power Consultant AB in association with
Ramboll Natura AB and Earth Systems Lao
WREA. 2008. Nam Ngum River Basin Profile. Nam Ngum River Basin Development Sector Project.
ADB and AFD
WREA, ADB – AFD, Governement of Lao PDR, Ministry of Agriculture and Forestry, Ministry of Energy
and Mines. 2009. Component 2 – Reservoir Management and River Basin Modeling. Project
Completion Report and the Technical Reports. Hydrosult Inc, STS Consultants, EDF-CIH Electricité de
France, ISL Bureau d’Ingénieurs Conseils

24
ANNEX
Table 3. Characteristics of the 42 pumping stations installed along the Nam Ngum River in the Vientiane plain and respective maximum and potential irrigated areas. Total discharge is calculated, based on 12 operating hours per day and 152 days per dry season, as reported by Phengphaengsy (2005). Values of irrigated areas were compiled in 2009 (Vientiane province) and 2010 (Vientiane capital). Zero values indicate that there was no irrigation during the specified years.
Wet
season
Wet
season
(103 m3/d) (106m3/dry season) vegetable vegetable
Naxaythong Ban Sendinh 2000 CAMC 2 90 233 20.2 3.1 250 80 90 250 80 90
Ban Hay-Thangon 1996 Kirloska 3 75 270 35.0 5.3 300 127 78 300 127 78
Ban Vernkham 1996 Kirloska 4 75 270 46.7 7.1 300 160 40 300 160 40
Ban Chalernxay-Vernkham 1997 Kirloska 2 75 270 23.3 3.5 500 200 35 500 0 0
Ban Latkhuay-kao 1997 Kirloska 2 75 270 23.3 3.5 150 100 85 150 100 85
Ban Latkhuay-thonghap 1998 Ebara 2 75 150 13.0 2.0 70 40 0 0 0 0
Lak 6-Thangon 1994 Kubota 4 320 800 138.2 21.0 1,200 745 0 0 0 0
Thonghap-Thangon-keanghai 1986 Ebara 3 135 540 70.0 10.6 600 500 0 0 0 0
Ban Savang-Namkhon 2000 Kirloska 2 75 270 23.3 3.5 250 120 0 0 0 0
Ban Nongkheng 1997 Kirloska 2 75 270 23.3 3.5 170 90 97 170 0 0
Ban Nongno 1997 Kirloska 3 75 270 35.0 5.3 160 100 20 160 51 20
Ban Nathae 2000 CAMC 2 75 195 16.8 2.6 150 45 0 150 45 0
Ban Thachampa 1990 Kirloska 3 75 270 35.0 5.3 200 50 0 200 50 0
Ban Dongbung 1996 Kirloska 3 75 270 35.0 5.3 300 250 3 300 102 3
Ban Douangboutdy 1996 Kirloska 3 75 270 35.0 5.3 300 75 75 300 75 75
Ban Thadindeng 1998 Kirloska 2 75 270 23.3 3.5 350 45 0 350 45 0
Ban Nakoung-Thongmang 2003 WPIL 6 410 1100 285.1 43.3 1,050 680 250 1,050 730 250
Ban Hatkieng 1997 Kirloska 6 75 270 70.0 10.6 220 100 19 220 100 19
Ban Vernthone-Naphork 1983 Toshiba 3 250 520 67.4 10.2 500 250 3 500 250 3
Ban Huaychium 1994 WEIR 4 110 600 103.7 15.8 550 350 150 550 350 50
Ban Hatviengkham 1988 Ebara 2 75 222 19.2 2.9 100 50 2 100 50 2
Ban Nabong 2001 WPIL 6 410 1100 285.1 43.3 511 731 100 511 731 100
Ban Thaxang 2000 CAMC 2 75 195 16.8 2.6 143 156 2 143 156 2
Ban Nasone/Phao1 2000 CAMC 9 165 233 90.7 13.8 513 420 15 513 420 15
Ban Phao 1997 Kirloska 2 75 270 23.3 3.5 501 230 5 501 230 5
Ban Thakokhai 1996 Kirloska 2 75 270 23.3 3.5 385 65 4 385 65 4
Ban Xienglaetha 2000 CAMC 2 75 195 16.8 2.6 195 124 1 195 124 1
Ban Cheang Kirloska 2 75 270 23.3 3.5 459 234 350 459 280 350
Ban Chumh Kirloska 2 75 270 23.3 3.5 159 84 70 159 80 70
Ban Pakkayoung Australia 4 75 300 51.8 7.9 411 150 0 411 45 0
Ban Phonpheang Kirloska 2 75 270 23.3 3.5 179 109 85 179 90 85
Ban Lingsun Kirloska 2 75 270 23.3 3.5 227 227 43 227 100 43
Ban Hatsuan Kirloska 2 75 270 23.3 3.5 159 34 20 159 60 20
Ban Boungphao 2 Kirloska 2 250 250 21.6 3.3 159 100 22 159 25 22
Ban Tarnpiew France 2 250 520 44.9 6.8 1,035 150 50 1035 250 50
Ban Nakhong Kirloska 4 75 270 46.7 7.1 300 300 99 300 200 99
Ban Donekuad Kirloska 2 75 270 23.3 3.5 150 100 35 150 30 35
Ban Pakcheang Australia 3 90 300 38.9 5.9 250 90 30 180 3 30
Ban Thinyoung China 2 90 300 25.9 3.9 100 50 30 100 38 30
Ban Thalat Australia 2 300 500 43.2 6.6 300 120 110 300 45 110
Ban Vernsarn Australia 3 90 300 38.9 5.9 200 160 0 0 0 0
Ban Vienkham-tai Kirloska 2 75 270 23.3 3.5 120 80 35 120 65 35
DistrictProvinceTotal discharge
Maximum irrigated area (ha)
rice rice
Dry seasonVillage
Power
per Unit
(kW)
Model
Dat
a n
ot
avai
lab
le
Capacity
per unit
(L/s)
Pakngum
Vie
nti
ane
Pro
vin
ce
Thoulakhom
Viengkham
Vie
nti
ane
Cap
ital Xaythany
Actual irrigated area (ha)
Dry seasonNb
Units
Start year
of
operation
Pumping station