Embed Size (px)
Citation preview

Environment International, Vol. 18, pp. 117-151, 1992 0160-4120/9255.00 +.00 Printed in the U.S.A. All rights reserved. Copyright 01992 Pergamon Press plc
IS THERE A LARGE RISK OF RADIATION? A CRITICAL REVIEW OF PESSIMISTIC CLAIMS*
Adnan Shihab-Eldin** Visiting Scholar from Kuwait Institute for Scientific Research and Lawrence Berkeley Laboratory, Berkeley, CA 94720 USA
Alexander Shlyakhter and Richard Wilson Department of Physics, Harvard University, Cambridge, MA 02138 USA
El 9104-130M (Received 17 April 1991; accepted 1 December 1991)
A number of situations where it has been claimed that moderate radiation doses cause leukemia or other cancers are carefully reviewed. We look at cases in the United States and Great Britain. Usually, it can be demonstrated that there is an alternative, more probable, explanation for the effect seen. In several cases, the authors of the papers have fallen into statistical traps. The most frequent is a posteriori selection of cohort boundaries in both space and time: a trap illustrated dramatically by Feynman. The next most common trap is to arbitrarily select one out of many ways of looking at the data, against which we were warned by Tippett. Several cohorts are compared with respect to the number of persons at risk, average dose, and the number of cancers expected. Of these, only the cohort of A-bomb survivors in Japan provides evidence of clearly visible excess cancers.
INTRODUCTION
Radiation is still perceived by the public as one of the major health hazards. Although x-rays have been with us since the 1890s, and radioactivity was dis- covered soon thereafter; and while there was some fear of the usual x-rays, the widespread public fear did not arise until 1945 when the first atomic bomb exploded. Fear is a common response among the public - - an irrational fear that can prevent rational
*An expanded version of this paper will be published as Argonne National Laboratory Report.
**Present address: UNESCO/ROSTAS, 8 Abdul-Rahman Fahmy St., Garden City, 11511, Cairo, Egypt.
action to achieve the desired benefits and reduce hazards, while introducing a minimum of new hazards.
When fear exists, there will, in a free society, be those who exploit the fear for their own ends, who feed it and nourish it. The exaggerated claims and predictions of doom appear in the newspapers (or the Congressional Record), but rarely in scientific jour- nals. This whole issue of fear has been discussed by Weart (1988).
Some people make a sharp distinction between natural and man-made radiation. But in practice, this distinction is arbitrary. The natural background can be reduced or increased by our actions. We can build houses to avoid radon gas or to trap it.
In this paper, we review some of the pessimistic claims about radiation. We attempt to discover what,
117

118 Shihab-Eldin et al.
if anything, that is useful these claims tell us. Ideally, we would only consider data and claims made in journals which have peer review. However, public policy is often made using reports and papers that have not been so published. One ignores these at the price of being irrelevant. However, in the references, we try to make the distinction clear when it is not obvious. For example, newspapers and the congres- sional record are not peer reviewed, nor are scientific newspapers such as the New Scientist. However, Na- ture and Science are peer reviewed.
Any discussion and review of the effects of radia- tion on health is necessarily incomplete. It has been estimated that there are over 100 000 references on the subject. In making this review, we have just begun to address many of the claims and have only read a fraction of the papers. However, we hope and believe that we show how to address the main issues.
In addition to the reports of scholarly and interna- tional organizations (BEIR 1972, 1980, 1990; ICRP 1982; NCRP 1980, 1989; UNSCEAR 1986, 1988, Shimizu et al. 1988), there are a number of other review papers and books by distinguished authors. Some of them address the issues considered here, and we list them for convenience (Yalow 1986; Webster 1980; Bond 1970, 1981; Hamilton 1983; Cohen 1980, 1981, 1986; Pochin 1983; Archer 1980; Goldman 1989; Shleien et al. 1991).
There are also a number of books and papers which are written in a less restrained manner by various persons (e.g., McCracken 1982; Grant 1988). These are useful as sources of information, but are, in general, too partisan to present a proper case.
FROM INDIVIDUAL CASE TO CONTROLLED STUDY
When a physician notices an unusual problem among his patients, he looks for a pattern. The litera- ture is, properly, full of such case reports by obser- vant physicians. It was the observation by Percival Pott that most chimney sweeps died prematurely of cancer of the scrotum that led to the realization that the soot causes cancer. This observation was so clear that no fancy epidemiological procedures were necessary. However, when effects are small, more elaborate procedures are needed.
There is some confusion about the terms used by different authors. Sir Austin Bradford Hill (1965) uses the word association to describe a situation when two phenomena are known to occur at the same time or place. A statistician often refers to a correla- tion between two observables in the same sense and insists that a correlation may not always be causal;
However, this distinction between a causal and a non-causal correlation is not always realized, and correlation is often automatically exaggerated into causal correlation. We here use the word association instead of correlation in order to emphasize this dis- tinction, and to reject any implication of causality, although an association may sometimes be a causal correlation.
Hill (1965) outlined nine criteria that have to be considered when attempting to attribute a cause to an effect. He emphasizes that they need not all be simul- taneously necessary. For example, the strength of the association observed by Percival Pott was so great that the association forced attention, even though there was little biology to make the causality plausible and nothing with which to make an analogy. The nine criteria are as follows:
1. The strength of the association. If the strength of the association is large, then common sense usual- ly makes it outweigh other considerations. Nonethe- less, cigarette smoking gives a large effect, but the delayed nature of the effect meant that 50 years passed before it was generally accepted that most lung cancers are caused by cigarettes.
2. The consistency of the results. If the same data set is analyzed by different people, they should all find similar results.
3. The specificity of the results. If a specific health condition is associated with the claimed cause, it is usually more believable than a general claim of in- creased mortality.
4. Temporality. The effect must follow the claimed cause and never precede it. If there is a delay (latency period), it must be plausible and understood.
5. Existence of a biological gradient. The effect should increase as the pollution increases.
6. Biological plausibility. The effect should be plausible biologically. This need not mean that there is a detailed explanation, but that the effect should not violate known biological laws.
7. Coherence. Various studies should be correlated in a coherent picture; one isolated study is hard to believe if it seems to contradict others.
8. Experimentation. In some cases, the epidemio- logical study can be supported by experiments on animals where doses are given in a controlled way. It is such experiments, for example, that led to the Linear Quadratic model of BEIR (1980).
9. Analogy. Sometimes we can make an analogy between two carcinogenic agents. For example, ben- zene causes acute myeloid leukemia with a short latent period. Thus, one might reasonably expect a short latent period for radiation-induced leukemia.

Risk of radiation 119
These may seem sophisticated criteria, but they are just simple logical requirements. Hill (1965) em- phasizes that the attribution of cause to an effect does not need all the items to be present; however it is clear that there must be no disproof. Each of these nine criteria are here considered in conjunction with unusual claims of effects of radiation.
If a phenomenon does not fit with existing scien- tific understanding, it requires more, rather than less, evidence to prove its reality. If, for example, it was claimed that a dog ran down 5th Avenue in the city of New York at noon, not many people would be surprised. But if it was claimed that a lion ran down 5th Avenue at noon, there would be considerable proof required. The required proof would be less if other information made it more plausible--if it were known, for example, that a lion had escaped from the Bronx Zoo, in New York City. However, if it were claimed that a pterodactyl ran down 5th Avenue at noon, most auditors would be skeptical because pterodactyls are extinct.
Anyone who claims that low doses of radiation give large effects must overcome a weight of prior evidence; this demand might be reduced if it could be shown that the instruments measuring the dose or the calculations thereof were faulty, and the dose might not be low after all. In most of the cases we discuss here, the evidence provided is insufficient to challenge the well-established facts.
Associated with this need for increased proof in unusual situations, is the need to create a plausible model to describe the event. This model , which presumably should be valid at other places and times, should be tested to see whether it indeed makes such valid predictions. For example, if occupational ex- posure to radiation is claimed to cause an excess of cancer, and a background of environmental and medi- cal exposures gives 10 times the radiation dose, one should easily be able to find an excess of cancers from these environmental and medical exposures. If one cannot, then the model must be incorrect. Any claim of unusual association which does not go on to describe a plausible model is incomplete; it will, however, be seen that few authors make such models.
TECHNICAL TERMS
Statistical significance is used to quantify the out- comes of random events (e.g., a throw of a die), by reporting the mean value plus the standard deviation within a certain probability or confidence limit. For normal distributions, if the mean value is N, then the standard deviation is ~/-N-. The 95% confidence limit corresponds to the range of values not exceeding
(N + 1.64 • q-if). If the expected number of cancers among a group of residents is N and the number observed exceeds (N + 1.64 • ~/-N-), then one can claim that a cluster is observed and there is less than a 5% chance that the observed excess is due to a statistical fluctuation above the normal rate.
Infant mortality rate is 1000 multiplied by the ratio of number of deaths of infants <1 y to the number of live births during same year (MacMahon 1970).
The Standard Mortality Ratio (SMR), sometimes called the Total Mortality Ratio (TMR), in a given group is the number of deaths expressed as a per- centage of the number of deaths that would have been expected if the age-and-sex-specific rates in the general populations were obtained. The Cancer Mor- tality Ratio (CMR) is the same, with deaths replaced by cancer deaths. Infant mortality ratio (IMR) is the same as SMR, but restricted to infants.
STATISTICAL TRAPS
Hill (1965) did not state the two most elementary criteria--and the criteria most frequently ignored. There must be a statistically significant effect to consider, and secondly, the statistical analysis must not be biased.
Many errors in pessimistic claims considered in this paper are statistical. The most important of these is biased selection of initial data. Errors associated with such data selection are also some of the hard- est to explain to those unacquainted with statistical methods.
The late Richard Feynman had a dramatic way of demonstrating that a biased selection of data can invalidate standard statistical tests. Coming into class, he said, "You know, the most amazing thing hap- pened to me tonight. I was coming here, on the way to the lecture, and I came in through the parking lot. And you won't believe what happened. I saw a car with the license plate ARW 357! Can you imagine? Of all the millions of license plates in the state, what was the chance that I would see that particular one tonight?" (Goodstein 1989). We can easily work it out: 3 is one out of 10 numbers, 5 is one out of 10 numbers, 7 is one of 10 numbers, A is one of 26 letters, R is one out of 26 letters, and W is one out of 26 letters. If we multiply these numbers together, we find a low probability of 1 in 18 000 000. Yet Feyn- man saw it. This commonplace experience does not seem that improbable. What is the answer to this paradox?
As presented, the answer to this paradox is ob- vious: Feynman did not ask the question about the particular license plate until he knew the answer.
120 Shihab-Eldin et at.
However, in epidemiological studies, the paradox is often disguised. This trap is far from unique to epidemiology, nor is it unusual. Physicists fall into it with surprising regularity. In honor of our friend, the late Professor Richard Feynman, we call it the Feynman Trap.
The importance of using unbiased data in any epidemiological study can hardly be overemphasized. The ideal procedure in epidemiology would be to select a cohort (group of persons) for study while they are young and follow them into the future. Such a study can only be complete after several decades, and even then is not immune from genetic bias or bias due to pre-existing environmental effects.
In practice, what is called a prospective study does not do this; the epidemiologist defines a cohort of interest that existed in the past and then goes through records to find out what happened to the members of the cohort. The epidemiologist must make every ef- fort to be sure that he/she is not influenced by any prior knowledge of the final result in selection of the cohort. This is hard to do; it is not sufficient that the investigator not have prior knowledge. His superior and his funding agency may have such knowledge and have an influence upon the choice of cohort.
This is so difficult, yet so important, that it is preferable that every prospective epidemiological paper starts with a discussion of this point, especially if the numbers are small and the effect of bias most serious. Unfortunately, this is not done in many epidemiological studies, even by some of the best authors and even in some studies using small num- bers upon which major societal decisions depend.
For example, if a small, possibly unusual, cluster of cancer cases is found in a certain location, con- cerned citizens will properly search for possible causes. They might find an abandoned well or dump site containing some chemical known to be toxic, but with no specific known adverse chronic health effects. It is proper to postulate this chemical as a possible cause. This is sometimes called the hypo- thesis-generating event. This can be related to the automobile in the Feynman example.
The hypothesis generating event can then trigger an epidemiological study; the epidemiologist must search for other similar wells or dump sites also containing the chemical of concern. The people must be similar to the general population in all respects except their proximity to the well or dump site and possess no other di f ference in common with the people around the original well. Having found such a cohort, and not before (or he/she might be in- fluenced in his/her choice by the result), he/she can
then search the records to find out whether the same type of cancer appears at the new location.
Finally, in establishing statistical significance, the epidemiologist must omit the original group of people, with their cancer cases, that brought the sub- ject to his attention in the first place. We see that this then will satisfy the requirements of reproducibility and specificity outlined by Hill (1965). In many of the discussions below of the claims of large effects of radiation, the requirement of the strength of as- sociation is met, but the others are not.
There are numerous, well-established, epidemio- logical studies that show that large radiation doses to people cause an increase in leukemia rates, and we know roughly how much. Moreover, radiation- induced leukemias appear after a moderately short latent period, so that they are easier to identify than radiation-induced cancers with a long latent period. It seems obvious, therefore, to search for possible increases in leukemia near nuclear power plants, or any other known radiation sources. It seems espe- cially appropriate to use leukemia as a marker for chronic effects of radiation. Thus, it would appear that the hypothesis has already been generated. However, this is only true if there is enough radioac- tivity from the source to cause a statistically sig- nificant increase in the leukemias. In several of the cases below, we are discussing a new hypothesis: "radiation causes leukemias at several hundred t imes the rate expec ted from the known and pub l i shed radiation measurements assuming linear dose-response curve." This could happen either be- cause the actual radiation levels are several hundred times the known and published ones, or because of a new, and most scientists would say unlikely, biological phenomenon.
One of the most common temptations for any epidemiologist or other student of statistics, is to decide upon groups of data, or decide upon statistical tests, after the preliminary results of the study are known. It must always be remembered that if 20 independent biological endpoints (such as cancer in 20 separate organs) are studied, and each tested ac- cording to separate statistical tests, then one will appear to be statistically significant with P < 0.05 by chance alone.
Again, in practice, it is rarely possible to be ab- solutely pure in this regard. When a new idea for a test arises after the study has started and the data collected, some correction can be made by increasing the level of statistical significance demanded. In the case above, where 20 tests are examined, and it is not known in advance which test is to be examined, one

Risk of radiation 121
should demand P < 0.05/20 = 0.0025 instead of the usual P < 0.05. A failure to do this is sometimes called Tippett 's Trap, because the well-known statistician Tippett called attention to this problem (Tippett 1937).
The reader can often tell whether basic statistical errors such as these have been made. If an author of a paper has data which are just significant, and does not discuss these potential problems, it can usually be assumed that he or she was unaware of them and may have fallen into one of the traps.
DOES RADIATION CAUSE INFANT MORTALITY?
Ernest Sternglass published a paper (Sternglass 1963) alleging a link between fallout from nuclear bomb tests and the infant mortality rate. This was based on the experimental evidence by Stewart and
Kneale (1970) and by MacMahon (1963) that x-rays given to pregnant women increased the incidence of childhood leukemias. Fitting these data to a linear dose-response relationship he argued that fallout from bomb tests should increase childhood leukemias, and then extended the argument to other infant mortality. This paper made a number of arbitrary assumptions which were criticized by Dunham (1963), Bennett (1963) and MacMahon (1963). In 1969, Sternglass produced a number of other papers and reports (Sternglass 1969a, 1969b, 1969c, 1969d, 1969e, 1969f). In these papers, he made a number of sugges- tions that fallout from nuclear bomb tests was respon- sible for a number of infant leukemias. These claims were made on the basis of a plot of infant mortality versus time (Fig.la).
1,(];
1 .4-
1.2 -
1-
0.8 1960 lgC:)4
1.6
1.4-
1,2-
1-
Original Sternglass statement
m
m
O.8 I~5o I~ 1~e I~e2 1~e Io7o
year
Statistical errors added
I
Fig. la and b. Infant mortality near Indian Point, New York.
1~e Ig~z 1~e ~97o
year
122 Shihab-Eldin et al.
0 E
E
1,6"
1.4"
1.2-
Other years added
Q8
year
J.
I g7CI
"0 t--
0
8oo
6o0-
400-
Noble gas r e l e a s e s
J ,
year
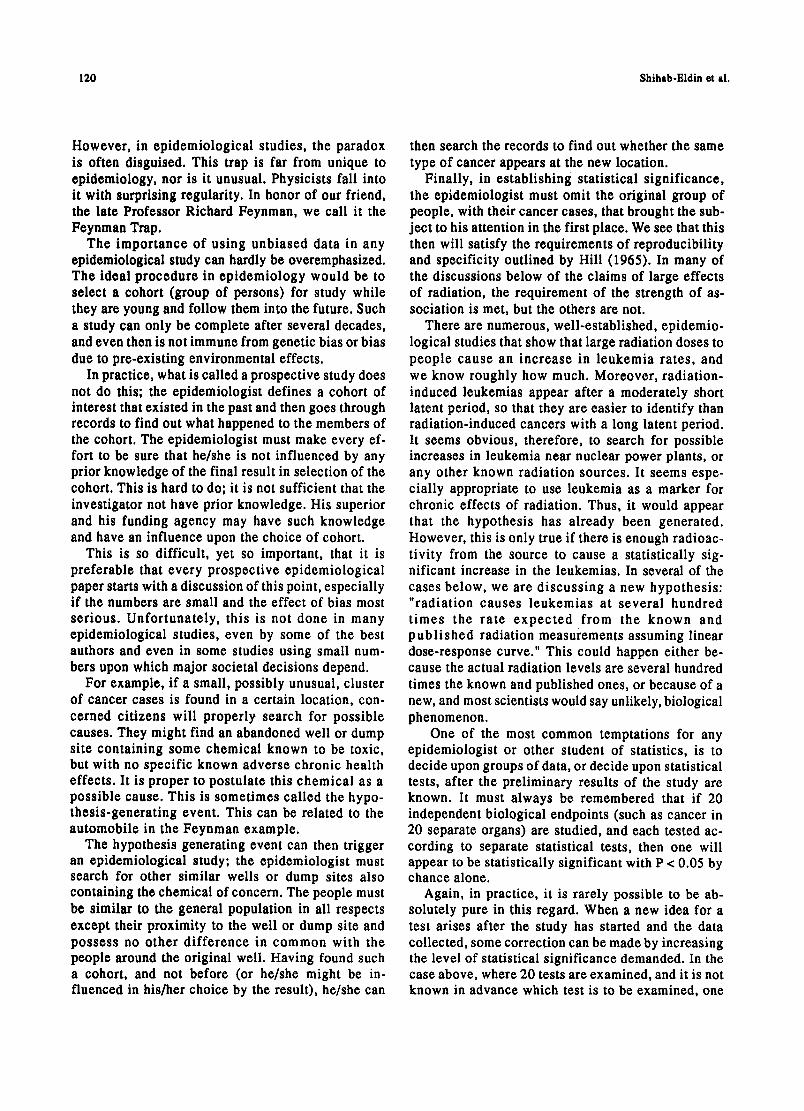
Fig. lc and d. Infant mortality near Indian Point, New York.
1970
It was tempting at the time for scientists to believe Sternglass' claims without looking carefully at them. By 1963, a majority of scientists had successfully persuaded the major countries of the world to stop tes t ing of nuclear bombs in the a tmosphere . Sternglass appeared to provide extra ammunition to justify this. Rotblat (1970, private communication), a leader in urging nuclear test bans, asked that this temptation be rejected; sooner or later, he argued, the acceptance of bad science, even for a good reason, would backfire. He was particularly concerned that it would be used against peaceful uses of nuclear energy.
Sternglass then extended the arguments about fall- out from nuclear bomb tests to study infant mortality (and sometimes leukemia) near nuclear power plants. A number of persons have reviewed various of his claims; one of the most specific is that of Hull and Shore (1971) . S te rnglass has s ince p roduced a
string of about ten reports a year, none of which has been accepted in the community as having any validity.Sternglass' claims met with a storm of criticism (Graham and Thro 1969; Boffey 1969; Stewart 1969; Wrenn 1969; Sagan 1969; Eisenbud et al. 1969; Heller 1970). This then led to an unprecedented state- ment read by the current and signed by all living past presidents of the Health Physics Society (Moeller 1971). "We, the President and Past Presidents of the Health Physics Society, do not agree with the claim of Dr. Sternglass that he has shown that radiation exposure from nuclear power operations has resulted in an increase in infant mortality."
An example of one of these is his claim that infant mortality increased near Indian Point I Nuclear Power Plant just after it began operation in 1961. Figure 1 shows how these claims, made for one specific pair of years, show selection bias. The top figure ( la) shows Sternglass' two points. They look

Risk of radiation 123
less significant when statistical errors are shown ( lb) . When the whole graph is shown (Hull and Shore 1971), it is clear that the points were arbitrarily selected in time. Figure ld shows that the increase was not correlated with radioact ivi ty releases as original ly claimed, but preceded them. This was a selection bias in time. There also maybe a biased selection of place.
In one of the more recent reports, Sternglass (1986) claims that a release of radioactive material to the environment from the Pilgrim Nuclear Power plant in Plymouth, MA, in June 1982 caused an increase in infant mortality in the counties nearby. As reported to the Nuclear Regulatory Commission (NRC), the release was a solid material and was confined to the power plant property. Nonetheless, it is, of course, plausible to look for effects near the power plant. Sternglass claimed an increase in infant mortality from 1981 to 1982.
In Fig. 2, we show the full data on infant mortality for var ious years co l l ec ted by the Massachuse t t s Department of Public Health (Massachusetts 1987). In Fig. 2a are Sternglass' two points for the town of Plymouth for 1981 and 1982. These indeed suggest an increase. When the statistical errors are added in (Fig. 2b), the claim already looks less impressive. In Fig. 2c, the data for many years are included, show- ing that the overall trend is opposite to that implied by Sternglass. When the data are collected for the whole county and the whole state, in Figs. 2b and 2c, the fluctuations are reduced because of the larger statistical sample. Finally, we note that the measured radioactivity releases from the power plant were larger during the early years of operation--before a graphite filter was installed and while there was a period of leaking fuel pins. However, at no time would these releases have suggested a large excess of cancers, and indeed no such excess has been found. We call attention to the similari ty of the claim of infant mortality around Indian Point, and its refutation, to the claim of infant mortality around Pilgrim. Figure 3 shows the same argument for the recent low birthweight around Pilgrim Power Plant.
Not content with the claim that there was increased infant mortality near Pilgrim in 1982 caused by the 1982 release, Sternglass attributed an increase in infant mortality in southwest New Hampshire, 100 miles (160 km) away, to a combination of Pilgrim and two other nuclear power plants--Vermont Yankee and Yankee Rowe. The smog in Boston is closer, thus providing a more likely potential culprit to study.
LEUKEMIA CLUSTERS
It is self-evident that people dying of infectious diseases do not die uniformly throughout the world, but in clusters, either in space or in time, where the infection has taken hold. Diseases which are not infectious are not expected to cluster, except in so far as there might be exogenous causes. Cancer is generally believed to be a non-infectious disease.
Only 3% of cancers are leukemias; but about 15% of cancers that are induced by radiation in the first 30 y after exposure seem to be leukemias (BEIR 1990). This is because of the relatively short latent period for leukemia. This suggests looking for leukemias--particularly acute myeloid leukemias-- as an indicator or marker of radiation exposure. Moreover, leukemia has a short latent period, a causal association with an event becomes easier to prove than for other cancers. But there are several other causes of leukemia; such as benzene and possibly other solvents. Leukemias are bel ieved to cluster in such a way that statistical deviations from ex- pected rates exceed the standard deviation (Glass et al. 1968).
There are four major types of leukemia that are hematological ly distinct: acute lymphatic (ALL), chronic lymphatic (CLL), acute myeloid(AML) and its variants, and chronic myeloid (CML). Of these, CLL is not known to be caused by radiation. Indeed the progression of the disease is slow, as evidenced by a doubling time of white blood cells of two to three years after diagnosis. Extrapolating back to a single cell division suggests that CLL is caused early in life, and perhaps has a genetic origin. Therefore, in studies of leukemia caused by an external agent such as radiation, it is usual to exclude CLL (BEIR 1990; Cartwright and Bernard 1987).
However , there have been many searches for clusters, particularly of leukemia, from a suggestion that leukemia, and in particular childhood leukemia, might have a viral origin (Smith 1982). Darby and Doll (1987) also addressed this idea. For a long time, leukemias have been known to cluster without an obvious cause, an effect that suggests that the origin might be an infectious disease. For example, the first child in a family is much more likely to get childhood leukemia than later ones. A particularly interesting phenomenon was noted by Smith, et al. (1985). One way of curing leukemia is to destroy blood cells and bone marrow by heavy radiation exposure. Then, new blood can be provided by a blood transfusion, preferab- ly from a twin. Smith et al. (1985) noted the occur- rence of leukemia in a patient with new bone marrow well after the treatment by whole body irradiation.

124 Shihab-Eldin et al.
20"
"~ 15 !
3 10
o " 0
e -
1968
A
1970 19'72 1974 ' 1976 1978 19:80 19~2 I ~ I year
211
15
v,-
~ 10 ¢s
o
-e
1968 1970 1972 19'74 1 976 19'78 1 ~0 1 ~ . 19~4 year
20-
.t!_ o 1,5 .z
@ '1o
0 1968
\ ', ,, , : , ~ . . . . . Q ; ,
stal]sl]cal uncertainty given by size of the error bars
' 19'70 ' 19'72 1974 ' 19'76 ' 19'78 ' 19~0 1 ~ . ' 1~34 year
I ---~-. Massachuse~s - -B- Plymouth County ~ Town of Plymouth ]
Fig. 2. Infant mortality rate in Plymouth, Plymouth County, and Massachusetts (1968-1984).

Risk of radiation 125
i r -
U t
v
.CI
1968 1970 ' 1972 ' 1974
A
A
year
v -
v
; ' ~ e 1 ;70 1972 1 ~74 ' 1 ~Te year
C2~t. . . . "e2~. . . . . . --*-"E22~ " ' " " ~ 2 ~ - . .
, " ' 1 1 ~ , - i ~ . , l m " " ~ . . . . . . . . . . . . D
r~
v -
v
° ~ e 1~70 ' 1~72 ' 1~/74 ' l d 7 e ' 1~7e year
' l~eO ' 1~e2 ' 1~e4
--~-- Massachuselts - ~ - PMnoutl~ County ~ Town of Pb/mouU3 [
FiB. 3. Percent of low birthweight in Plymouth, Plymouth County, and Massachusetts (1969-1984).
126 Shihab-Eldin et al.
This is consistent with a viral origin for the leukemia. Some earlier suggestions that clustering occurred are usually attributed to biased post hoc selection of boundaries for the grouping of leukemias (Glass et al. 1968).
Few clusters of cancer or leukemia survive as real (i.e., not due to stat ist ical f luctuat ion) clusters when the data was subjected to careful screening and analysis. Jablon et al. (1990) of the National Cancer Insti tute (NCI) of the U.S. have carried out a comprehensive analysis of leukemia and cancer in- cidence at the county level around all nuclear plants in the U.S. and found no significant effect. They noted a deficit of leukemias in Plymouth county which contains the Pilgrim Nuclear Power Plant.
Finally, we reiterate that real (nonstatistical fluc- tuations) leukemia or cancer clusters can occur randomly without an apparent cause. Such random clusters, it appears, do not discriminate between nuclear or non-nuclear facilities. In a blind attempt to study leukemia c lus ters , leukemia around 14 military sites in England was studied. Clusters were found around two of them. When the identity of the two military sites was released to the study group, it turned out that the sites were medieval castles. (Cehn and Sagan 1988). It is unclear whether the study group was influenced by the statement that they were military sites.
LEUKEMIAS NEAR PLYMOUTH, MASSACHUSETTS
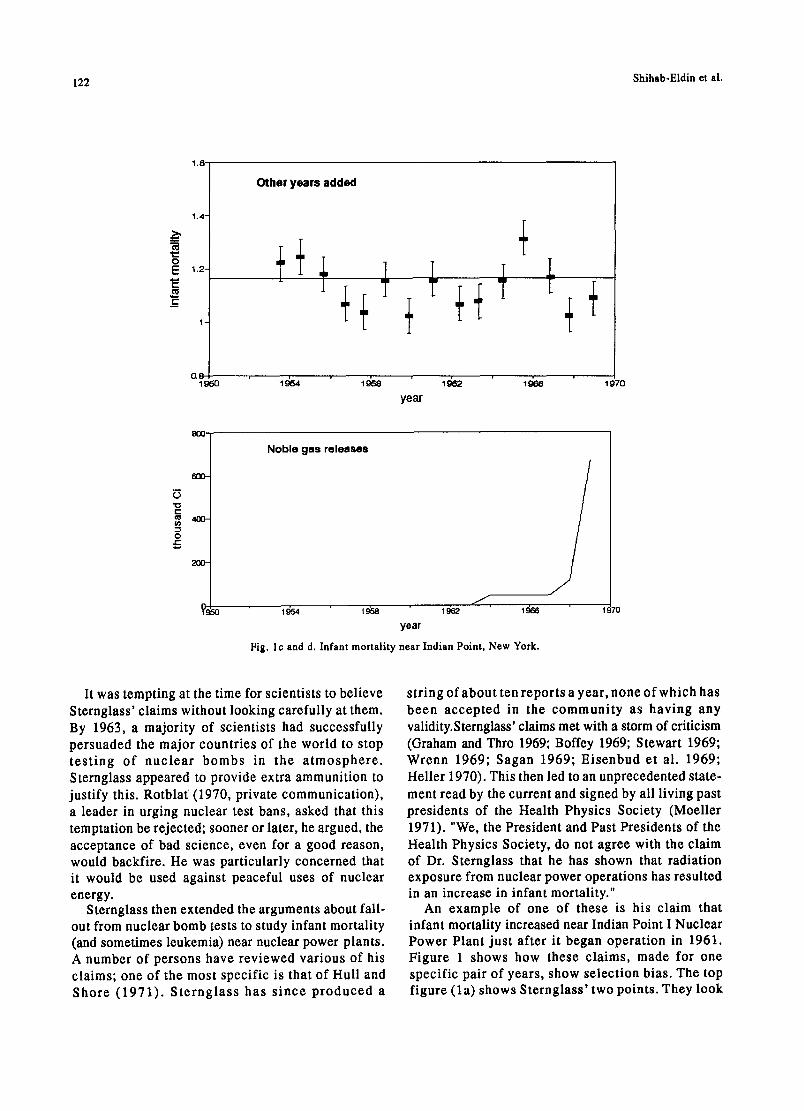
Cobb (1987) noted that the number of leukemias in certain counties in southeastern Massachusetts was larger than expected. He asked whether they could have been caused by the Pilgrim Nuclear Power Plant. Cobb postulated a certain pattern of coastal circula- tion of the air within 2-4 miles (3-4 km) of the coastline (Clapp et al. 1987). In his testimony in front of the Joint Committee of Energy of the Common- wealth of Massachusetts, he stated that, "It is easy to imagine how an injection of pollutants to the middle of such a pattern might be contained and carried along the coast." However, detailed measurement shows that winds do not follow the postulated pattern (Stone and Webster 1988). A more detailed listing of leukemias in Plymouth county has been carried out by Rothman et al. (1988) (Tables 1 and 2). In these tables, the expected number is based upon state-wide statistics.
Table 1 shows a small excess of leukemia (exclud- ing CLL which, as noted, is not caused by radiation) for the years 1982-84 in the five coastal towns closest to Plymouth. This is barely statistically significant, and the significance vanishes when more years are included. This is shown more clearly in Table 2 from Rothman et al. Moreover, we know of no postulated reason, other than the impossible one, that they are due to the wind-borne radioactivity. However, an
Table 1. Observed and expected incidence of Leukemias other than chronic lymphocytic leukemia in three groups of Massachusetts towns, 1982-1986'. Data from Rothman et al. (1988).
Five Coastal Towns b Five Towns
Closest to Plymouth c Plymouth County d
Years Obs Exp. SMR 95% CI Obs. Exp. SMR 95% CI Obs. Exp. SMR 95% CI
1982-84 27 17.0 1.59 1.05-2.31 13 12.2 1.06 0.59-1.78 63 73.8 0.85 0.66-1.09
1985-86 6 11.8 0.51 0.21-1.06 6 8.6 0.70 0.28-1.45 36 47.5 0.76 0.53-1.05
1982-86 33 28.8 1.14 0.79-1.61 19 20.8 0.91 0.57-1.40 99 121.3 0.82 0.66-0.99
" Abbreviations: Obs., observed cases; Exp., expected cases; SMR, standardized mortality ratio
(Obs./Exp.); CI, confidence interval (by exact method).
b Duxbury, Kingston, Marshfield, Plymouth and Scituate.
c Carver, Duxbury, Kingston, Plympton and Plymouth.
d 27 towns, including all those in the other two groups.

Risk of radiation 127
Table 2. Observed and expected mortality from leukemias other than chronic lymphocytic leukemia in three groups of Massachusetts towns, 1969-1986'. Data from Rothman et al. (1988).
Five Coastal Towns b Five Towns
Closest to Plymouth ¢ Plymouth Count~ less 5 Towns
Obs. Exp. SMR 95% CI Obs. Exp. SMR 95%CI Obs. Exp. SMR 95%CI Obs. Exp. SMR
Years 1969-72 17 17.3 0.98 0.59-1.54 I0 10.9 0.91 0.47-1.64 86 87.1 0.99 0.79-1.22 76 76.2 1.00
Years 1973-76 14 19.3 0.72 0.41-1.19 7 12.9 0.54 0.24-1.07 80 90.7 0.88 0.70-1.10 73 77.8 0.94
Years 1977-80 18 21.2 0.85 0.52-1.32 13 14.6 0.89 0.50-1.48 79 94.2 0.84 0.66-1.05 66 79.6 0.83
Years 1981-86 34 35.5 0.96 0.66-1.34 26 25.0 1.04 0.68-1.52 128 152.0 0.84 0.70-1.00 102 127 0.80
Years 1977-86 168 206.6 0.81
' Abbreviations: Obs., observed cases; Exp., expected cases; SMR, standardized mortality ratio (Obs./Exp.); CI, confidence interval (by exact method).
b Duxbury, Kingston, Marshfield, Plymouth and Scituate.
c Carver, Duxbury, Kingston, Plympton and Plymouth.
a 27 towns, including all those in the other two groups.
interesting fact emerges upon which Rothman et al. did not comment. If we add a fourth group of three columns to Table 2 for Plymouth County less the five towns close to Plymouth, a marked deficit appears after 1977. For the period 1977-86, 168 leukemias were observed, with 207 expected. The deficit of 39 is over twice the standard deviation of 2"~~'= 14, and therefore significant (Wilson 1991). In a nationwide study of leukemias near nuclear power plants, carried out at a country level, Jablon et al. (1990) also noticed the deficit of leukemias in Plymouth County.
Morris and Knori (1990) performed a case-control study of leukemias near Plymouth, using a complex score of closeness to Pilgrim as a surrogate for ex- posure level. Table 3 shows the data for cases diag- nosed between 1978 and 1986. Since these are the same cases already discussed, a similar difference between close to Plymouth and far from Plymouth is expected. A statistically significant difference is in- deed found. Since the previous data and reports al- ready suggested an effect of the same magnitude as found in this study, it is hard to understand the state- ment on page (vi) of the summary of Morris and Knori, "These (earlier) findings are somewhat incon- sistent with those of this investigation."
Morris and Knori further subdivided the data into the periods 1978 to 1981, 1982 and 1983, and 1984 to 1986, and find an effect only in the first two. This is surprising, because our simple calculation in Table 2 shows an ef fec t persist ing in 1984-86. Moreover, the Pilgrim plant only began operating after 1973. If it is hypothesized that the radiation from the plant immediately after startup caused leukemias, they would be expected to continue to occur from 1978 through 1993; and there is no valid reason for excluding the years 1984 to 1986 in this analysis. To make such an exclusion without a valid reason makes the statistical calculations invalid.
Even if it is accepted that there is an association between leukemias and something in Plymouth, a causal connection can only be accepted if there is a cause. The reported release of radioactivity materials from Pilgrim were never enough to cause measurable rad ia t ion leve ls above the natural backg round radiation level and could not therefore have caused measurable cancer increase above background can- cer levels. This is a robust conclusion and is inde- pendent of any particular relationship that is assumed between radiation dose and leukemia incidence. Anyone suggesting that Pilgrim was the cause of any of these leukemias must therefore postulate unreported

128 Shihab-B1din et al.
Table 3. Results of matched case-control analyses: Estimated relative risks' ofleukemia by exposure level; both sexes combined; cases 1978-1986.
Exposure Score Cases Controls O.R. (CI)
low (<.030) 18 56 1.00 (0)
medium (.030-.199) 50 106 1.97 (0.99, 3.95)
high (.2+) 37 46 3.89 (1.74, 8.68)
Total 105 208
chi square trend - 11.38 p-O.O01
aOdds ratios presented are controlled for age, sex, vital status, year of death, socioeconomic status, smoking status, occupation and industry
(Table 2 of Morris and Knori, 1990)
and unmeasured release of radioactivity far exceed- ing the reported levels. Indeed, an examination of the BEIR V report (BEIR 1990), suggests that the ex- posure must be 200 rein to each individual to quad- ruple the leukemia rate. If such unreported releases occurred (and that is very doubtful), they should be stopped. But they would not be stopped by the DPH recommendation to reduce the regulatory limit from its present value of 25 mrem. They must also postu- late another reason for leukemia to be decreased overall (independent of location), so that the releases appear to leave the number of leukemias near Plymouth unchanged, while reducing them further away.
In this example, Dr. Sydney Cobb should be praised for raising the question and postulating an explana- tion, even though this explanation was subsequently shown to be invalid (see also peele 1988). However, the report by Morris and Knori was publicly released by the Massachusetts Department of Health in a press conference and television appearances by the Deputy Commissioner of Health (not the authors) just after his budget was cut. The budget was quickly restored.
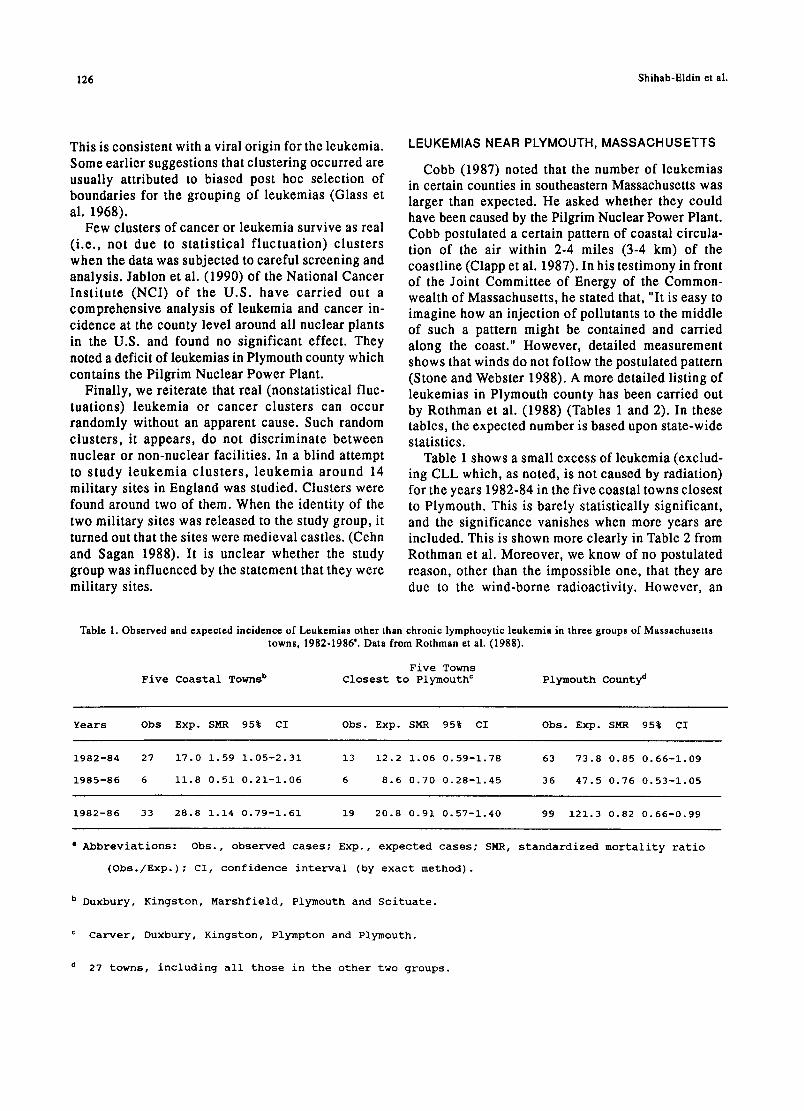
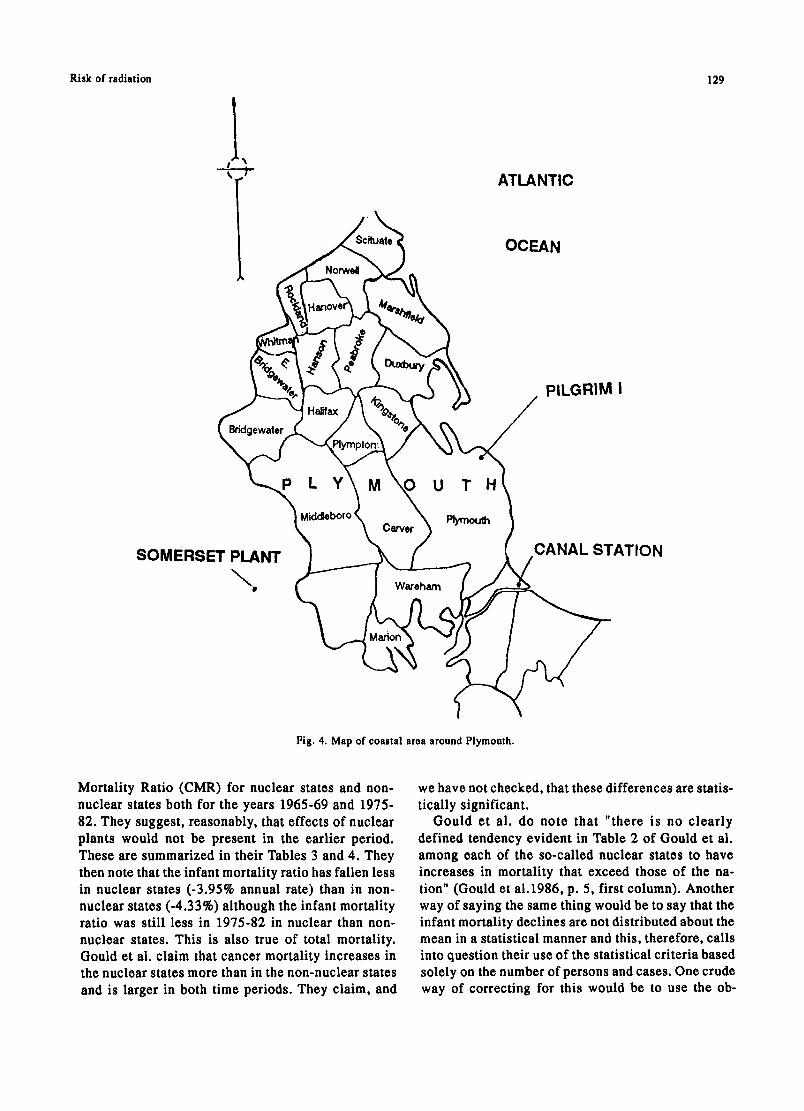
We must also be aware that another large power plant exists nearby, contrary to one of Stornglass' claims that the only industrial facility near Plymouth is the Pilgrim Nuclear Power Plant. This is the Canal Station, which is fossil fuelled (see Fig. 4). The releases from the Canal Station are of a different type of material, but there is as much reason for attribut-
ing the increase in leukomias to them as to Pilgrim. A little further away is another large coal-burning power plant at Somerset. This is upwind. It is well known that coal-burning plants emit radioactive material. The Somerset plant spews more long-lived radioactivity over the counties around Plymouth than does the Pilgrim plant (see, for example, Tables 5-6 and 5-7 of Wilson etal. 1981).
DID THE CHERNOBYL ACCIDENT INCREASE U.S. MORTALITY?
Two reports by Gould (1986; 1988) have boon widely publicized. In the first of these reports, Gould e ta l . (1986) endeavor to see whether increases in overall mortality, total cancer mortality, and changes in fetal or infant mortality can be related, firstly to the presence of nuclear power plants in the state, and secondly to the radioactivity releases from these power plants. As an exploratory study, this is ap- propriate; but the words imply that the study is more than exploration. We shall assume that the arithmetic calculations are correct, and discuss whether or not they make their case. A statement such as "it is clear that emissions in the nuclear counties have an ad- verse effect on mortality particularly among the very young and very old" implies causality. We believe that neither this statement, nor the title "Nuclear emissions take their toll" is close to being justified.
Gould ot al. first compare Infant Mortality Ratio (IMR), Total Mortality Ratio (TMR), and Cancer
Risk of radiation
ATLANTIC
OCEAN
129
PILGRIM I
SOMERSET PLANT \
\ Plymouth Carver
Wareham
CANAL STATION
Fig. 4. Map of coastal area around Plymouth.
Mortality Ratio (CMR) for nuclear states and non- nuclear states both for the years 1965-69 and 1975- 82. They suggest, reasonably, that effects of nuclear plants would not be present in the earlier period. These are summarized in their Tables 3 and 4. They then note that the infant mortality ratio has fallen less in nuclear states (-3.95% annual rate) than in non- nuclear states (-4.33%) although the infant mortality ratio was still less in 1975-82 in nuclear than non- nuclear states. This is also true of total mortality. Gould et al. claim that cancer mortality increases in the nuclear states more than in the non-nuclear states and is larger in both time periods. They claim, and
we have not checked, that these differences are statis- tically significant.
Gould et al. do note that "there is no clearly defined tendency evident in Table 2 of Gould et al. among each of the so-called nuclear states to have increases in mortality that exceed those of the na- tion" (Gould et ai.1986, p. 5, first column). Another way of saying the same thing would be to say that the infant mortality declines are not distributed about the mean in a statistical manner and this, therefore, calls into question their use of the statistical criteria based solely on the number of persons and cases. One crude way of correcting for this would be to use the ob-
130 Shihab-Eld ine t al.
served fluctuations in these parameters among nuclear states and the observed fluctuation in non-nuclear states instead of the square root of the number of cases. Then the statist ical s ignif icance probably vanishes. Thus, the only valid conclusion from the data that make up their Tables 3 and 4 is that while the data are consistent with the assumption made, they are very far from proving it.
Presumably because they recognize this, Gould et al. go on to look in closer detail at counties within 30 miles (50 kin) of a nuclear power plant. Again a slight difference is found. It is just significant (the probability that it is due to chance is less than one in 20), but Gould et al. do not ask how consistent this difference is among the various counties and we must again ask whether there are other causes of fluctuation than the square root of the number of cases. Thus the statement "it is clear that emissions in the nuclear counties have an adverse effect on mortality" is patently false.
Gould has been selective in his choice of items to consider. Just one illustrates a fluctuation in the op- posite direction from Gould 's argument. BWRs release more radioactive xenon than do PWRs (as noted in Gould's Table 5). Yet the increase in cancer mortality from 1965-69 to 1975-82 (1.140) is less than that for PWRs (1.230) and less than the increase for non-nuclear counties.
In the report, Gould et al. mention the radioactive noble gas releases, but do not discuss them or use them in a correlation. Yet, in any assumed relation of health effects to nuclear power plants, the releases must be more directly related to the health effects than the mere existence of the power plant itself.
Even if consistency and statistical significance were clear, all the other issues in Hill's list would have to be addressed. There may be a real correlation between one of the public health parameters and nuclear power plant location, but it is not necessarily a causal correlation.
If, for example, we compare the number of nuclear power plants in the country with expectation of life in that country, it is obvious that the expectation is higher in the U.S. with its many power plants than in Africa which has none. A priori, this increase of life expectancy near nuclear plants is as likely to be a direct causal relationship as the one Gould et al. propose. Few people believe that the nuclear power plants are a direct cause of the longer life expecta- tion, however, and attribute the causal relationship to nutrition and good health care. These are related to prosperity, just as nuclear power plants are related
to prosperity, and prosperity is closer to being the true cause.
As one delves more deeply, Gould's case becomes even weaker. Although not explicitly stated by Gould, it seems that he is endeavoring to attribute the cause of mortality to an assumed radiation dose to human organs. Ideally, therefore, one would correlate can- cer incidence with radiation dose. This information is hard to get, but one can imagine using human exposure, and calculate the dose to various human organs from the exposure. Radioactivity releases have been measured, and we know how to calculate ex- posure from releases. It is then easy to see that the radiation exposure will in all cases be much less than the natural background and less than the fluctuation and changes in natural background. Unless Gould et al. are prepared to claim and substantiate that the radioactivity releases have been grossly understated, or that we do not know how to calculate exposure from release, any case for causality stops at once.
Having shown that the statistical case Gould et al. present is weak and inconsistent, and that it's not plausible based upon the comparison of dose and background dose, we now complete the picture by suggesting a number of other possible causes for the effects which are much more plausible than radia- tion.
1. For infant mortality, fetal mortality, and total mortality, Tables 4 and 5 of Gould et al. show that the rates in non-nuclear counties and states are now close to those in nuclear counties. This could be due to medical care catching up in rural states.
2. The larger cancer rates in nuclear states can be due to general industrialization.
In the second report, Gould (1988) was even less specific. He noticed that 33.06% of the 1986 deaths occurred in the U.S. during the months of May to August 1986 compared to 31.97% in earlier years. The difference claimed is small (although statistical- ly significant). It might have any of a number of causes. Gould chose to suggest iodine releases from Chernobyl Nuclear Power Plant.
Taking Gould's specific suggestion of the cause first, we note that this suggestion satisfies almost none of Hill's requirements. The only one satisfied is temporality; the suggested cause does precede the effect.
Taking just one other requirement, we note that the iodine doses and doses from other radionuclides around the world from the Chernobyl plant release have been measured. The average first year dose to the U.S. was about 1.3 mrem compared with 60 mrem average in Italy and 40 rem for the 24 000 between

Risk of radiation 131
Table 4. Consequences of a linear biological gradient in Gould's predictions.
United States
ist year dose
1.3 mrem(Gould)
Factor to multiply by if effect proportional~ increase
to dose 1.09 9
Italy 60 mrem i 5.2 420
Persons 3-15 km from the plant (not including Pripyat)
40 rein I 2770 277,000
* all in i week before evacuation. I Calculated here
3 and 15 km from the power plant (excluding Pripyat) (Goldman et al. 1987). The difference of the 1986 mortality in the US (33.06%) and the 1985 mortality (31.97%) is about 3%. If this was due to radioactivity from Chernobyl, and we assume linearity with dose, there would have to be a 415% (5.2 times the natural rate) effect in Italy and 2770 times bigger (2770 times the natural rate) in the area immediately downwind of the Chernobyl power plant. As shown in Table 4, these have not been seen. Thus, the claim fails com- pletely on the question of "existence of a biological gradient." This argument by itself should be enough to discredit the whole discussion. However, it was not enough to stop the Wall Street Journal dignifying Gould's claim by saying, in a column, that it had caused scientific controversy.
A Seattle newspaper was better (News Tribune 1987). It discussed a part of this claim--that cancers in the state of Washington were caused by Cher- n o b y l n a n d clearly made the above point. Starzyk (1987) noted that mortality only rose 2% in summer 1986, not 9% as was alleged. This was not an unusual increase. Moreover, five traditional medical causes for summer increases have been identified: infec- tious disease, arteriosclerosis, chronic lung disease, suicide, and diabetes.
However, a more direct refutation of Dr. Gould's claim came from a Los Angeles Times reporter (Steinbrook 1988) who noted that Gould had used incomplete numbers. The 33.06% that Gould had stated as the fraction of U.S. deaths between May and August 1986 was incorrect. A more precise number is 32.2%, which is "identical to the data for the summer of 1984, and consistent with normal seasonal mortality patterns. The 1985 rate was 31.6%."
Another study (Brancker 1988) found no effect in Canada, although the effect on Canada should have
been similar to that on the U.S. if Gould et al. were correct. In Canada, deaths from infectious diseases remained steady, while death rates among 25-34 y olds and among infants fell.
THE PORTSMOUTH SHIPYARD PROBLEM
In 1977, a Boston physician became concerned that there was an unusual number of cases of leukemia among workers from the Portsmouth Naval Base and suspected that radiation might be the cause. With the help of reporters from the Boston Globe, he searched through over 100 000 death certificates. He con- cluded that there were 22 leukemia deaths, whereas 5 should be expected using ordinary death rates. In a later scientific report (Najarian and Colton 1978), he changed this to 20 cases of leukemia and other neoplasms of lymphatic and hematopoietic tissue with 10 expected. Dividing these into cases among nuclear workers and non-nuclear workers on the basis of whether the worker wore a radiation badge, the difference in cases between the two groups is 10 with 2.9 expected from the numbers in the groups (Table 5).
Later it appeared that of the ten nuclear cases, two had no radiation exposure. The effect was getting smaller as the data collect ion improved. Finally, Greenberg et al. (1985) showed that there was considerable under-reporting and misreporting of cases.
Najarian's observation was published in the medi- cal literature (Najarian and Colton 1978), as is ap- propriate, even for case reports where statistical relevance has yet to be determined. But, he also publicized his findings in the press (Boston Globe 1978) in a way to arouse anxiety rather than infor- mation, and in Congress in a way that aroused disapproval, even of liberal representatives. Con- gress requested a study by the National Institute for

132 Shihab-Eldin et at.
Table 5. Observed and expected cancer deaths among nuclear and non-nuclear workers by type of c a n c e r .
Nuclear Non-Nuclear Malignancy O E O/E O E O/E
Leukemia 6 i.i 5.62 2 2.8 0.71 Other neoplasms of lymphatic and haematopoletlc tissues 4 1.8 2.26 6 4.3 1.41
All other malignant 46 28.6 1.61 80 72.6 i.i0 neoplasms
T o t a l 56 31 .5 1 .78 88 7 9 . 7 1 . 1 0
(from Table II of Najarian and Colton, 1978)
O - Observed cases E - Expected cases
Occupational Safety and Health (NIOSH). A detailed study was made (Rinsky et al. 1981) which found no statistically significant increase of leukemia among the shipyard workers. No effect was found in a sub- sequent case-control study either (Stern et al. 1986).
A number of possible sources of bias were dis- cussed in a later paper by Greenberg et al. (1985). These include:
1. The healthy worker effect. Workers are more healthy than the average member of the population, so that comparing the deaths with those expected can understate the effect.
2. Selection bias--which could occur in the selec- tion of cases.
3. Measurement bias--which could result from a misclassification of the occupational exposure of those who died.
A more recent follow-up (Rinsky et al. 1988) found a slight increase of lung cancer among the workers that was not statistically apparent in the first study. Many questions still arise. Can the increase be at- tributed to the Portsmouth shipyard7 If it can, what about the shipyard could have caused the effect? Ninety percent of lung cancers are attributable to cigarette smoking, and cigarette smoking history is not detailed on death certificates, so that corrections for variation are hard to make. Rinsky et al. con- eluded "This... suggests that radiation workers were more heavily exposed to asbestos and/or welding fumes than were other workers and that these exposures confounded the observed association between radia- tion and lung cancer."
Radiation per se is not known to be a major cause of lung cancer (although inhaled radon gas is), so that the original suggestion that radiation releases caused
the cancers is not biologically plausible. Asbestos exposure does cause lung cancer, especially syner- gistically with cigarette smoking, and asbestos is common around ships and shipyards, so that asbestos may be a likely cause of the increase. This raises a question; why did Najarian immediately claim radia- tion as a cause of lung cancer when there were other, more plausible, causes?
Najarian has not accepted the criticisms implied in the NIOSH reports, nor those explicitly made by Hamilton (1983). His last comment there suggests a reason for the concern which led to the article. "One wonders also how these risk estimates (if confirmed with other studies on similarly exposed people) might alter the thinking of those who are planning survival
from nuclear war with similar product exposures." After the Boston Globe article, there was testimony
in Congress and the NIOSH investigation which cost over $I 000 000. When the results of this became known, Senator Kennedy, not known for his support of either military or civilian uses of radiation, publ ic ly condemned Dr. Najarian for unduly alarming shipyard workers and their families (Wermiell 1979). Other scientists were also critical (Hamilton 1983).
Cohen (1983) has discussed the way in which this case was discussed in the press. He noted that in 1977-8 there were 14 articles in the New York Times (several on the front page), mostly reiterating that there were a large number of excess cancers among the shipyard workers. In 1981, after the first NIOSH study was published, the New York Times published just one article.

Risk of radiation 133
LEUKEMIA AMONG THE HANFORD WORKERS
In three papers, Mancuso, Stewart, and Kneale (1977) and Kneale, Mancuso, and Stewart (1981; 1984) claimed that there was an increase in leukemia and other cancers among those workers exposed to radiation (see also Stewart and Kneale 1991). They compared the estimated (occupational) radiation dose which had been accumulated for patients who died of cancer, with the radiation dose of those who died of other causes. The null hypothesis that these doses are the same was tested. They found that the mean radia- tion dose for those dying of cancer was 1.38 rad and that for those dying of other causes was 0.99 rad. The implication was that the increase of 0.39 rad over about 10 years was the cause of cancer. This held for eight categories of malignant cancers, namely: mul- tiple myeloma, pancreas cancer, brain tumors, kidney tumors, lung tumors, tumors of the large intestine, myeloid leukemia, and lymphomas. This increase was said to be statistically significant. (The probability is less than 0.05 that it could occur by chance.) From these data they derived very small doubling doses for these c a n c e r s .
Their work was reviewed by Gilbert and Marks (1979, 1980) Hutchinson et al. (1979), Hamilton (1980), BEIR (1980), Kleitman (1978), Mole (1977), Sanders (1978), and Speirs (1979), and more recently by Gilbert e t a l . (1989) who also studied mortality over an extended period 1945 to 1981. For example, Hutchinson et al. (1979) found a statistical bias in the estimation of doubling dose; and made several important corrections to the data for various associated variables; calendar year of exposure, interval be- tween beginning employment and exposure, interval between exposure and death, and age at exposure to age at death. When this was done, there wore two significant effects left; for myeloma and pancreas cancer , but not for other cancers thought to be radiogenic.
Kneale et al. (1984) grouped cancers into two groups; group A which are claimed to be cancers in tissues where previous studies had found that radia- tion produces cancers (radiosensitive tissues), and group B in tissues where radiation is not known to cause cancer (non-radiosensitiv¢ tissues). The ob- served number of cancers was smaller than expected at high doses for group B and more than expected at high doses for group A. Does this mean that radiation is sometimes good for you7 This unlikely conclusion is obviated by noting that there are several biases which can be collected together and are called the healthy worker effect. It is well known that employed people are healthier and have a lower mortality rate
than unemployed people. Employers tend to employ healthy workers and someone with a job eats better than someone without a job.
It was plausibly suggested (but without proof) that those who had high radiation doses were often professionals with higher income and probably better health. Then, it is the difference in the trend with dose between the A cancers and the B cancers that is important. Kneale ct al. related the reductions in group B with increased radiation, to a similar, more significant reduction in total death rate.
There may be another possible reason for finding spuriously significant results. The radiation exposure was measured by dosemcters and film badges, which were worn only at work, and therefore exclude most of the natural background exposures. If we omit radon exposure, and ignore any discussion of the lung can- cer that radon might produce, the average radiation exposure at sea level is about 100 mrcm, plus 95 mrem x-ray exposure (Table 7 below). In a typical ten-year period, this is 2 rem; comparable to the typical oc- cupational radiation exposure and greater than the 0.39 rem difference between cancer victims and others. Kneale et al. believe they made proper correction for this using the socioeconomic indices. In principle, the comparison of exposed with noncxposed workers corrects for this, if the background and medical ex- posures are the same in each group.
One obvious correlat ion exists. Lawyers and bureaucrats have often insisted on extra medical checks for radiation workers. One of us (RW) for example, was asked to take an extra chest x-ray for a summer job involving radiation. His film badge (deliberately worn during the x-ray) showed the highest reading for anyone in that laboratory. It is not possible to correct accurately for effects such as these now. But an estimate can be made that in the early days of Hanford, photofluorographic exposures of about 600 mrem per year were given (presumably to those working in radiation areas). This exceeds 15-fold the increase in radiation doses. In such cir- cumstances, it would seem mandatory to discuss whether these background environmental and medi- cal exposures are indeed correlated with the workers' exposure and can bias the data.
We plot their data in Figs. 5 and 6. Figures 5 a and b show the ratio O/E (observed cancers/expected cancers). The statistical uncertainty is also plotted. The computer-fitted line was calculated without con- sidering these error bars, and assuming that all points arc equally weighted--which is approximately true. Although this line goes through more than 2/3 of the error bars (which is all that is required of an adequate

134 Shihab-Eldin et al.
1.5
19 ~ 1"375]
0 c 1.25]] I
nO 1,12 19
- l r "10 0.875 I 19 P 0.75
..Q
0 0 . 6 2 5 1
0.5t 0 5 1'0 i~ ~0 25 ~0 35
dose, rem
1.5
o) =- 1.25- (1) 0 t'- O5 0 1
"0 19 i
"~ 0.75 Q. X 19
nO 19 0.5 P 19
...0 0.25- 0
0 o ~ lb 1'5 2'0 2'5 3'0 35
dose, rem
Fig. 5a and b. Cancers a m o n g Hanford workers : a) Rat io of the obse rved cancers of r a d i o s e n s i t i v e t i s s u e to e x p e c t e d vs . dose ; b) Ratio of the observed cancers of non- rad iosens i t ive t i ssue to expected vs. dose.
fit), we can see clearly the suggestion of Kneale et al. that the data points rise faster at low doses (Fig. 5a).
Figs. 6a and b plot the data corrected for latency and other factors. Again 6a shows a possible rapid increase at low doses. But on 6b, we replot the same data against total dose, and not merely the occupa- tional dose. The origin is shifted to 10 rem, being 5 rem extra medical x-rays and 5 rem lifetime en- vironmental background. Since the expected num-
bers come from people with similar environmental backgrounds, the fitted curve should go through (or at least close to) O/E = 1 at 5 rem. Also on the plot is a point with O/E = 1.39 + 0.04 from a fit to the data for all malignant neoplasms in atomic bomb sur- vivors (Shimuzu et al. 1988 Table 2A). The fitted line is not a bad fit to the data, but Kneale et al. 's rapid increase starting at 10 rem (shown in a dotted line) now seems less plausible because a simple plot would

Risk of radiation 135
2-
o t.-
o "0 G) g O. x
"0
P lID
.ID 0
1.75-
1.5-
1.25-
1
0.75
0.5 0 1'0 1'5 2'0 ;~5 3'0 35
dose, rem
.= ® to t -
o "10 G) "6 ~) n
"10 a) P
..Q 0
1.75-
1.5-
1.25-
1
0.75
0.5 0
O/E = 1.39 (A-bomb)
lb 2'0 3'0 45 50 ~0 7'0 80 ~'0 100 shifted dose, rem
Fig. 6a and b. Ratio of observed cancers of radiosensitive tissue to expected after correction: a) versus additional data; b) with dose scale shifted.
imply that half of all cancers are caused by radiation. However, we should consider this dotted line as a postulate for further study. Are other data consistent with this line? We return to this when we consider variation of cancer rate with natural background in Fig. 13.
There is one more feature of the Mancuso, Stewart, and Kneale analysis that deserves mention. The differences in Figs. 5a and b between cancers of radiosensitive tissue and non-radiosensitive tissue used an old, inaccurate, ICRP classif ication. If
the effect is really due to radiation, this difference should increase when a more modern classification is used. Oral statements have been made at conferen- ces that the effect vanishes. This should be docu- mented.
The residual effect of pancreas cancer is shown in Fig. 7 where the Mancuso analysis (open circles) is compared to data among Japanese atomic bomb sur- vivors. It is hard to relate it to radiation because pancreas cancers are only weakly caused by radiation (Shimuzu et al. 1988 Table 2a). As shown in Fig. 7a,

136 Shihab-Eldin et al.
0
E
5-
4"
3 -
2-
Mancuso st al.
Y
0 50 1 O0 150 200 additional dose, rem
>2O0
250 300 350 400 450 500
5-
0
E
Mancuso et al.
2- >200
J = i l i
Vo 5'0 250 3o0 350 400 45o 500 total dose, rem
Fig. 7a and b. Mortality from cancer of the pancreas among Japanese A-bomb survivors (open squares), among Hanford workers (filled circles), and according to Mancuso analysis. Points labeled 200 represents the average of all data above 200 rein from Cohen (1983).
the effect might be real but when the dose scale is shifted to give the total dose as in Fig. 7b, the dotted curve becomes even less plausible.
DOES PLUTONIUM FROM ROCKY FLATS CAUSE EXCESS CANCER?
The Rocky Flats facility, 15 miles (25 km) NW of Denver, is used to machine plutonium for manufac- ture of U.S. nuclear weapons. As plutonium metals are machined, fragments can catch fire and vaporize.
Extreme care must be, and is, therefore, taken. How- ever, two fires broke out in 1957 and 1969, and although they were contained, plutonium was found to have contaminated the soil in regions SE of the facil i ty towards, and including, Denver from an oil c leanup in 1968. Fig. 8 shows the distribution of this contaminat ion.
Johnson (1981) and Chinn (1981) examined cancer rates in these areas for the years 1969-1971, and found that total cancer rates in the areas closest to

Risk ofradiation 137
A
CANCER INCIDENCE IN RELATION TO ROCKY FLATS
O. I mCilKat II
. . . . . . . . b 'o mcosx,, t 0.:~ mCilKn
• "t AREA
i •
- , / J
t." I ~ nosy J'..:,Z__.AREA ~ ~"%'N~I FlitSplaM "" /
~'..%%N%.%1,.,...... AREA I ~ ~ [ ' 1 ~ " / ( ~ ~ - "
e l o e e o , e l e o o ~ • •
_ _ _ • D E N V E R ~"==" mb - ~ . 1 " e o e I Ib
K
• 8o. c~#sl ; AREA IV ,o . . /
/.
Ill
0 6 10 i i I .SCALE: Miles
Fig. 8. Map of area around Denver and the Rocky Flats plant showing plutonium-in-soil isoconcentration areas.
the plant (area 1) were 24% higher for males and 10% higher for females than in areas of the Den- ver area further away. He attributed the increase to plutonium.
Plutonium is an alpha emitter, and the cancers should, therefore, arise close to where the plutonium is absorbed--the lung, if it is inhaled, and the liver and bone, if it is absorbed. One should expect more plutonium in the bodies of those with cancer than in others. Also, we should expect the trends to be found at other time periods.
C rumpe t al. (1987) examined all of these ques- tions. Firstly, they confirmed the statistically sig- nificant trend found by Johnson for total cancer, digestive cancer, respiratory cancer, and cancers normally considered radiosensitive (for whole body radiation). However, they found less of a trend for the years 1979-1981. This is the opposite to what one would expect. The years1979-81 are after the laten- cy period for all cancers, whereas 1969-71 is in the latency period for some of them, if the initiating event was plutonium. No excess of bone cancer was found, contrary to the presumption.
Finally, Cobb et al. (1982) found no increase of plutonium in an autopsy of some (but not all) of the
cancer victims. None of these fit the hypothesis that plutonium from Rocky Flats was the cause of the cancer increase. However , another, much more plausible cause for the cancer excess can be found. Crump et al. (1987) noted that there is an increased rate of many cancers in urban areas (Goldsmith 1980). This is called the urban factor. Crumpet al. corrected the data for the urban factor by looking at the dis- tance from the Colorado State Capitol in Denver. Many persons in Group I are closer to the state capitol than persons in Group IV.
Johnson (1987), in response, called into question each one of Crumpet al.'s arguments. He pointed out that the autopsy results were only from a selection of the cancer victims and perhaps a biased selection. Crump found fewer cancers during 1979-81 in area I than area II, but Johnson noted that this was probably due to a large influx of new population into area I who had not been exposed.
But Johnson failed to describe an effective and complete model for the cause of the cancers and its relationship to other knowledge as Crump et al. have done.Therefore, Crumpet al.'s explanation must be preferred.

138 Shihab-Eldin et al.
IS THERE A PRECURSOR TO LEUKEMIA?
It is common to be l ieve that the cause -e f fec t relationship in disease etiology is unique; the effect will always be an outcome of the cause. When people are given a large dose of a strong poison like strych- nine, they will always die. If they are given a small dose, they will always live. In between, some will live and some will die, and the difference is assigned to a variation of individual sensitivities.
One might expect to find the same behavior with cancer-causing agents, but in general, it does not seem to be the case. Of heavy cigarette smokers, one out of five will develop cancer due to their habit; but four will be unaffected, and we do not know which. Does that mean that one of the five is especially susceptible, and the others are not? So far, we have not uncovered reasons for especial susceptibility, and for practical purposes, we can assume that the out- come is completely random.
This may appear callous in that it seems to ignore the need of the susceptible individuals. But an il- lustration shows that it is, in fact, in accord with a common-sense approach to risks that society often has. If we knew in advance that a Canadian car, license 423 KBT, will kill a pedestrian in Boston, we would stop the car at the Canadian border--and avert the accident. But we have no way of knowing in advance, which car (if any) will cause an accident. We, therefore, describe the possibility as a risk, and society accepts the risk, because prevention is not possible without draconian measures such as stop- ping all cars.
Physical scientists, accustomed to fundamental uncer ta in t ies of quantum mechanics , have li t t le trouble in accepting this argument. Medical scien- tists more often have problems and continue to search for precursors to these seemingly random eventsm such as the occurrence of cancer.
There are some precursors to cancer that can be taken into account. There is a synergistic relationship between cigarette smoking and asbestos; the prob- ability of getting lung cancer (at high doses) is re- lated to the product of number of cigarettes smoked and the asbestos exposure. Therefore, it is possible that anyone exposed to asbestos can reduce the chance of deve lop ing lung cancer if he s tops smoking. Retinoblastoma, a rare cancer of the eye, runs in families and presumably is genetically caused.
Whether some objective ailments are precursors to cancer has been discussed both for asbestos and ben- zene. This, however, is usually considered to give suggestions about the shape of the dose-response relationship. Thus the U.K. chief inspector of fac-
tories Dr. Merriman (1938) asked "Does silica, or asbestosis or the fibrosis of the lung they produce tend to inhibit cancer of the lung or to produce it? If the latter, do either of these substances act as specific carcinogenic agents like tar, or is it that the disease they produce only prepares the soil for the occur- rence of cancer? With asbestosis, among 103 fatal cases in which asbestosis or asbestosis with tuber- culosis were present, cancer of the lung was associated in 12 cases (11.6%)." If asbestosis is necessary for lung cancer incidence, the dose-response relationship might show a threshold. This question is still largely un- answered today.
In studying leukemias produced by benzene, Goldstein (1977) commented upon the fact that pan- cytopenia often precede leukemia, although some cases of leukemia have occurred without a preced- ing diagnosis of pancytopenia. But because of the limited medical information in the individual cases, und i agnosed p a n c y t o p e n i a cou ld a lways have preceded it (see also Lamm et al. 1989).
In a series of papers, Bross and Natarajan (1977), Bross et al. (1979), and Bross and Natarajan (1980) make a pioneering attempt to identify persons espe- cially susceptible to leukemia. They choose as a data base, the Tri-State Survey, carried out in certain specified areas of New York, Maryland, and Min- nesota (Graham et al. 1963; Gibson et al. 1968). They first concentrated on childhood leukemias.
Other authors have found an associat ion be- tween chi ldhood leukemias and x-ray exposure during pregnancy of the mother. (Stewart and Kneale 1970; MacMahon 1963). This association does not, in itself, tell whether x-ray radiation causes these leukemias, or whether another agent, which caused the leukemia made the x-ray more likely. Even now, this is disputed (MacMahon 1989). Such an effect was also found in the Tri-State Study (Gibson et al. 1968).
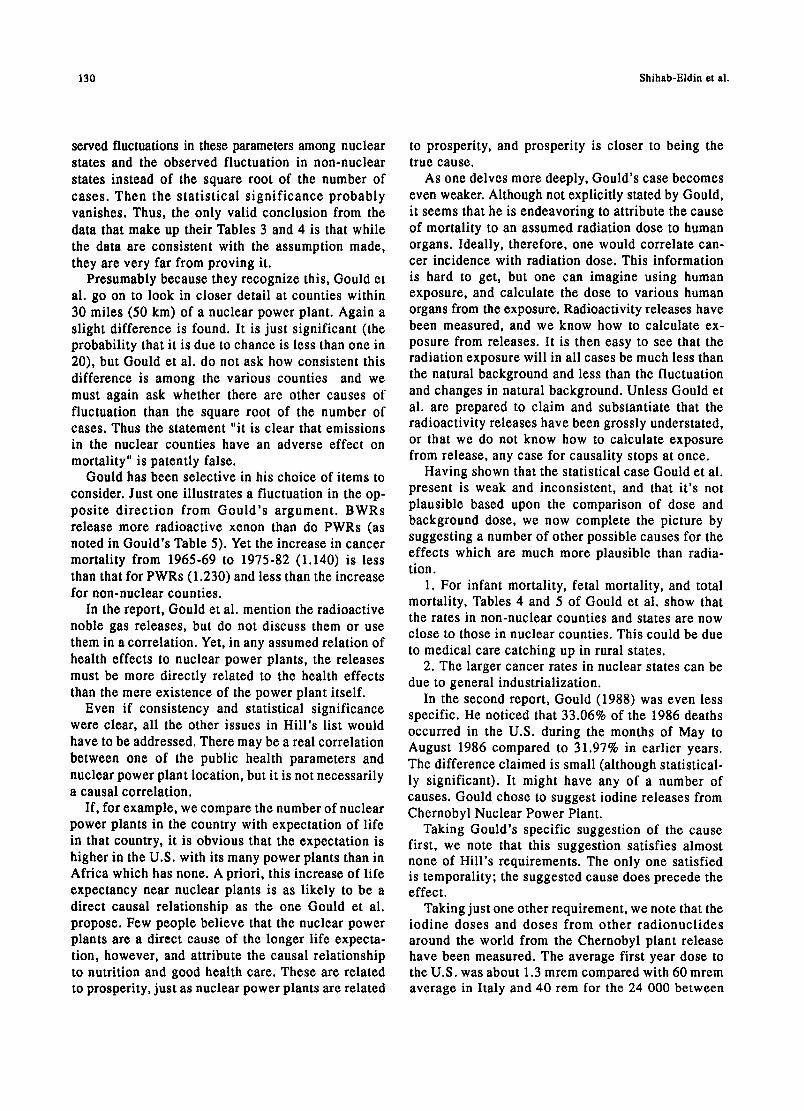
Assuming that the cause of these leukemias was intrauterine radiation, Bross and coworkers set out to discover whether there were precursors. They found that several ailments were associated with the leukemias; a virus (red measles or chicken pox); bacteria (whooping cough or dysentery); and allergy (asthma or hives). This is shown in Fig. 9.
The existence of an association in this data set, between two apparently unconnected end points such as virus and leukemia, does not prove causation; the correlation may not persist to other data sets. Moreover, even if it does, one cannot infer unequivo- cally that viruses cause leukemia, or make people more susceptible; it might be that a latent leukemia
Risk of radiation 139
100
E
"o 0 0 .,c "o r- o
>
10
0.1
none virus
report of disease
bacterial allergic t
no yes no yes no yes no yes intrauterine radiation
1 T T 1 T T ] T
disease and exposure status Fig. 9. Approximate confidence intervals on the relative risk of childhood leukemia (age-adjusted risks in relation to children not ex- posed to intrauterine radiation and without report of specified childhood disease): 1) None: no report of the specified diseases; 2) Virus: report of red measles or chicken pox; 3) Bacterial: report of pneumonia or whooping cough or dysentery; 4) Allergic: report of
asthma or hives.
makes one especially susceptible to viruses (Roth- man et al. 1988). It is also unclear that this associa- tion, even if a causal correlation, has any predictive ability.
The argument is similar to that of Feynman's ex- ample. There was an association (and as noted, some call it a correlation) between the particular license plate and the parking lot. Few believe that whenever one has a parking lot, one will see that license plate; or whenever one sees that license plate, it will shortly be in a particular parking lot. In Feynman's example, one can easily repeat the observation on other days and other places to verify that the association is unique to this particular parking lot or the particular time.
Bross and Natarajan must have been aware of these arguments when they stated "a formal objective test of the 'susceptibility' hypothesis requires exclusive information on medical history and exposure to poten- tial hazards on a large series of cases of leukemia and controls representatives of the general populations." Unfortunately, instead of looking at other situations, they put their effort into arguing for a change in radiation safety regulations, which most scientists
regard as premature. Apparently, no one else has tried to extend these studies to other cohorts.
Bross et al. (1979) claim that the Tri-State study also shows that diagnost ic x-rays affect adult leukemia and heart disease. They write down a model to evaluate a dose-response curve for those persons most affected by radiation. In one figure, they show the number of persons affected as a function of dose. It is not clear how this is derived since details are not provided. It seems likely that this is merely a plot of excess leukemias versus dose, with the ordinate changed by an arbitrary assumption that only a small fraction of persons are affected by radiation.
Even here, however, their claim that these de- monstrate a response relationship that is very non- linear near the origin, in the direction that there are more leukemias at low dose than calculated, cannot be sustained by the data; and they themselves com- ment that a linear fit cannot be excluded.
Boice and Land (1979) specifically review the work of Bross et al. (1979). They point out that conventional analyses find that radiation, and presumably x-rays, can cause adult leukemia; a causal connection with heart disease has not been established. Such an association
14o Shihab-Eldin et al.
could be due to leukemia and heart disease patients receiving more intense clinical examination.
Bross and Natarajan (1980) and Bross (1983) reanalyzed the work of Schull, Otake, and Neel (1980) on genetic effects of the atomic bomb explosions in Japan. Schull, et al. had concluded that "in no in- stance is there a statistically significant effect of parental exposure." Bross and Natarajan claimed the data shows that there is. Bross' claim was looked at in its turn by Hamilton (1983) and Hamilton et al. (1983). Hamilton shows that Bross used a post hoe grouping of data--a variant of the Feynman Trap. In particular, he included a zero dose group in among a group exposed to 0-9 rads.
We also note that all these authors discuss excess cancers due to x-ray doses. As noted in the preced- ing sections, the x-ray dose is superimposed upon a natural background, and the full b iological dose response curve must include the effect of natural background. A kink in the curve just above the dose that corresponds to the natural background does not, in this context, seem very plausible.
CANCERS NEAR THREE MILE ISLAND
After the accident on 28 March 1979 at the second unit of the power plant at Three Mile Island near Harrisburg, Pennsylvania, there was considerable public concern about a possible increase of cancer because of radioactivity releases. This concern was not allayed by the official report, agreed to by six federal agencies, that radioact ivi ty releases were primarily noble gases, and that the radiation doses were very small (NUREG 1979). The b io logica l plausibility of an effect due to radiation is small.
However, an accident of this nature causes unusual stress and stress, has often been claimed to be a cause of cancer. This is, for example, found in animal bioas- says where such trivial matters as size of cages, or possibly lighting, seems to affect the background cancer incidence (Crouch and Wilson 1987). The Kemeny Commiss ion (Kemeny et al. 1979) sug- gested that if any extra cancers appeared near Three Mile Island, stress would be the most likely cause. There is, therefore, a plausible reason for a search for cancers near Three Mile Island.
Most of the studies were anecdotal (Wasserman 1987). We comment here on one which was more detailed. Two persons, Aamodt and Aamodt (1985) claimed an excess of leukemias around Three Mile Island. They claim 20 cancers from 1979-1984 and 19 between 1980 and 1984 in a population of 443 (433 listed, but this was an addition error) for a ratio of cancer mortality to expected of 6.57 (corrected
from their 7.13) with an uncertainty of +1.5. This claimed effect is large enough that it led to a more detailed study by Public Health for the Common- wealth of Pennsylvania (Tokuhata and Dignon 1985). This study showed that Aamodt and Aamodt fell into the Feynman Trap: they surveyed an area of Newbery Township, but arbitrarily selected 4 out of 14 streets. They failed to show, and could not show, that these streets were selected before there was knowledge of leukemias, or that there was some objective way of selecting them (such as being all the streets within a given distance from the plant). In the ten streets not included, there were no cancers. This gave an artifi- cially large ratio. Tokuhata showed that if a proper selection of an area was made, then there was no excess of leukemia at all. Recent study confirms this conclusion (Tokuhata et al. 1991).
That the Aamodts found there are more cases in these streets than average then becomes a logical tautology and no more surprising than the fact that Feynman's car had the particular license plate it hap- pened to have. It is a lot of work to discover biases such as this; it often involves redoing the study com- pletely, but properly. We also note that radiation cancers manifest themselves with a 5-20 year latency after exposure, so that cancers so soon are doubly implausible. On the other hand, the absence of extra cancers also tells us little because they would not be expected for 25 y.
A review of health effects around TMI has been prepared by Behling and Hildebrand (1986). A new analysis of possible association between the accident rates and cancer was recently published by Hatch et al. (1990; 1991).
DID ATOMIC TESTS INCREASE CANCER IN UTAH?
Between the years 1950-1960, there were many atomic bomb tests in Nevada, and there was some exposure of communities downwind in Utah. Lyon et al. (1979) studied leukemia in children between 0 and 14 years of age, who lived in Utah between 1959 and 1967. They compared the leukemia rate with that expected in the general U.S. population. They par- ticularly looked at those children born between 1951 and 1958 (which they called a high exposure cohort) and who lived in counties where they claimed that the fallout was the greatest. Low exposures were defined as those born between 1944 to 1950 (before the tests), and 1959 to 1975 (after the tests were over).
Their analysis compared the leukemia rates in the exposed and the control group. They chose two con- trol groups; the pre-exposure cohort whose members
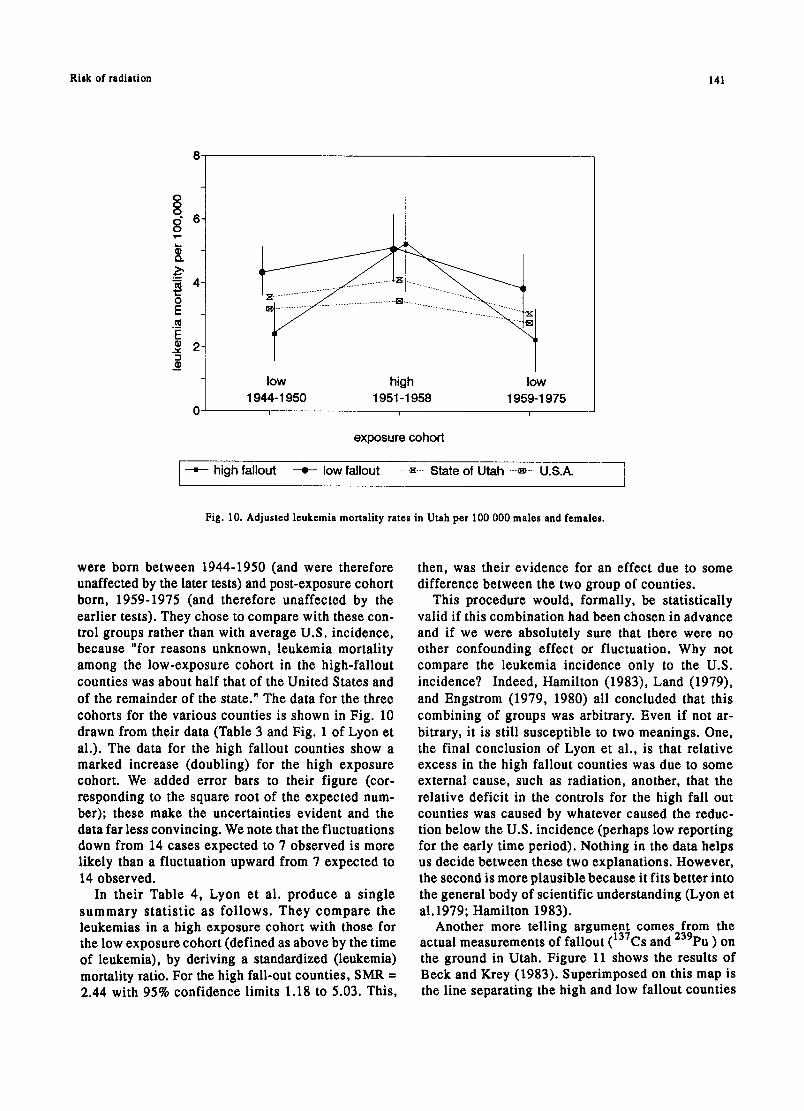
Risk of radiation 141
8
$ Q.
0 E ._¢ E
_¢ 2
ot low high low 1944-1950 1951-1958 1959-1975
exposure cohort
• high fallout - e - - low fallout ..... .~.--.. State of Utah ----~---. U.S.A. ]
Fig. 10. Adjusted leukemia mortality rates in Utah per 100 000 males and females.
were born between 1944-1950 (and were therefore unaffected by the later tests) and post-exposure cohort born, 1959-1975 (and therefore unaffected by the earlier tests). They chose to compare with these con- trol groups rather than with average U.S. incidence, because "for reasons unknown, leukemia mortality among the low-exposure cohort in the high-fallout counties was about half that of the United States and of the remainder of the state." The data for the three cohorts for the various counties is shown in Fig. 10 drawn from their data (Table 3 and Fig. 1 of Lyon et al.). The data for the high fallout counties show a marked increase (doubling) for the high exposure cohort. We added error bars to their figure (cor- responding to the square root of the expected num- ber); these make the uncertainties evident and the data far less convincing. We note that the fluctuations down from 14 cases expected to 7 observed is more likely than a fluctuation upward from 7 expected to 14 observed.
In their Table 4, Lyon et al. produce a single summary statist ic as fol lows. They compare the leukemias in a high exposure cohort with those for the low exposure cohort (defined as above by the time of leukemia), by deriving a standardized (leukemia) mortality ratio. For the high fall-out counties, SMR =
2.44 with 95% confidence limits 1.18 to 5.03. This,
then, was their evidence for an effect due to some difference between the two group of counties.
This procedure would, formally, be statistically valid if this combination had been chosen in advance and if we were absolutely sure that there were no other confounding effect or fluctuation. Why not compare the leukemia incidence only to the U.S. incidence? Indeed, Hamilton (1983), Land (1979), and Engstrom (1979, 1980) all concluded that this combining of groups was arbitrary. Even if not ar- bitrary, it is still susceptible to two meanings. One, the final conclusion of Lyon et al., is that relative excess in the high fallout counties was due to some external cause, such as radiation, another, that the relative deficit in the controls for the high fall out counties was caused by whatever caused the reduc- tion below the U.S. incidence (perhaps low reporting for the early time period). Nothing in the data helps us decide between these two explanations. However, the second is more plausible because it fits better into the general body of scientific understanding (Lyon et a1.1979; Hamilton 1983).
Another more telling argument comes from the actual measurements of fallout (137Cs and 239pu ) on the ground in Utah. Figure 11 shows the results of Beck and Krey (1983). Superimposed on this map is the line separating the high and low fallout counties

142 Shihab-Eldin et al.
0 U
~4
e"
0
~o
4J
0 U
0 ,...-I
0 , - I
0
,-.,1
129
Scale 0 Scale 0
U t a h
32.2 e4.4 20 40
oa.s km so miles
161 136
125 - - I I I
124 85
81
77 92
s3
lOSS
g!
7~
121,
67 74
8O
7 9 I ! - -
> 1 2
73
107
8 4 , -
g2
84 85 Iz 8 7
8 5
75 TI j
117
s9
Fig. 11. Fallout in Utah showing high and low counties defined by Lyon (1979).
8.3
of Lyon et al. (1979, from their Fig. 3). It appears that this was based on the single "smoky" shot of 31 August 1957). It is clear that some of Lyon's low fallout counties actually had a higher fall-out than many of the high fallout counties. Any assignment of the effect to radiation from fallout becomes harder to sustain.
This, however, is not the end of the story. Johnson (1984) looked at Washington county in SW Utah which is the closest to the test site (and includes the largest town of St. George, Utah). He found 19
leukemias in 1958-1966. This was more than ex- pected and gave a risk ratio of 5.28 (95% confidence 3.18-8.24). Machado et al. (1987) repeated this study and found a smaller effect; 62 leukemias between 1955 and 1980, and a smaller risk ratio of 1.45 (95% confidence 1.18-1.79). Johnson noted in an oral report that Washington county had the lowest leukemia rate in the state.
It appears, therefore, that there is a small cluster of childhood leukemia eases in SW Utah for the period 1951-1960 which was the cause of the original

Risk of radiation 143
Box Elder. 2.7 mGy (n=79)
Rich 2.9 raGv
(n'W~eber
Tooele 1"
3.6 mGy Salt Lake' (n =S4)
3.4 mGy (n=1264)
2.8 mGy 2.0 mGv
Ulntah 2.0 mGy (n =2s)
MIIImd 3.S mGy (n=47)
Beaver 2.8 mGy
2.1 mGy (nffi73)
Eme~/ 2.6 mGy (.--2~
Grand 2.5 mGy
(nfe)
Iron 3.1 rnGy (n =54)
19 mGy (n =aT)
Garfield 4.5 mGy (n=19)
Katie 9.1 mGy
(nfe)
San Juan 2.0 mGy
(n =e)
Fig. 12. Fallout map from Stevens et al. (1990).
claim. This conclusion comes out clearly in a most careful case-control study by Stevens et al. (1990). They considered 1177 victims of leukemia, who (a) died between 1952-1981, (b) were born before 1959, (c) were Mormons (members of the Church of Jesus Christ of Latter-day Saints) or spouse or one parent were Mormons, so that church records could be used. These cases were compared with 5330 controls. Total bone marrow dose was computed from residence informat ion and deposi t ion on external surfaces (primarily 137Cs) as measured by Beck and Anspaugh (1990) f o l l o w i n g the ear l ie r work by Beck and Krey (1983) and Beck (1984). This exposure analysis found a high average bone marrow dose for those in the SW corner of the state (Wartington County con- taining St. George), where the dose was 1.9 rein between 1952-58.
The bone marrow dose by county is shown in Fig. 12. This seems inconsistent with the map of Fig. 11. The principal result is that for 17 leukemia cases (except CLL) in this high exposure region, there was a risk ratio of 1.72 (95% confidence 0.94- 3.12). Five were cases of acute leukemia between 0-10 y, and for them the risk ratio was 7.82 (95% confidence 1.9-32), which is significant (p = 0.02). The significance increases (p = 0.009) when there is a restriction to acute lymphocytic leukemia. There was no elevated risk ratio for doses up to 5.9mGy (0.59 Rein).
At this altitude and in this general area, back- ground doses are high. The average background bone marrow dose is 70 mrem/y in SW Utah. Over a 20 y period, this gives as much radiation as the addition from the bomb tests. Fluctuation in back-

144 Shihab-Eldin et at.
ground should not a f fec t the resu l t s so long as they are not correlated with the study group. Stevens et al. (1990) looked for plausible reasons for higher background in Washington County than the rest of Utah, but found none.
A cohort study seems impossible here, but a care- ful connection to other data is necessary. In par- ticular, if there is a linear dose-response relation, and the risk ratio of 7.8 for acute leukemias 0-19 is to be believed, one should also find a marked increase in leukemias in those western states with a high background compared to eastern states, provided that other factors can be corrected. No such increase has been found, and indeed Washington county has a low background leukemia rate, but this may be due to other compensating factors of urban environment or life style (alcohol, tobacco, and coffee).
Finally, we should learn from this that Lyon incorrectly drew conclusions in his original paper; although, the conclusions were not necessarily incor- rect. The more careful look at the data by Stevens et al. pulls out a small group of people that need close examination. Such close examination might include measurement of the concentrations of 13TCs at each residence directly, and also measurement of other background doses both of radiation and chemicals.
One scientist, born and raised in the small town of St. George, noted that he was aware of most family names in that small town, and recognized none of the names of the leukemia victims (Everett 1991, private communication). This suggests a peculiarity that deser- ves investigation; perhaps they come from some farm- ing group exposed to some other agent.
The conclusion that there is an associat ion of leukemia with fallout therefore rests on the 17 cases in Washington county, and in particular the cluster of five who had acute leukemia at a young age.
LEUKEMIAS NEAR U.K. NUCLEAR FACILITIES
There are epidemiological reports on the incidence of leukemia near nuclear power plants and other nuclear facilities in the United Kingdom. The most detailed report is by Forman et al. (1987). They discuss many different cancers. They conclude that "there has been no general increase in cancer mor- tality near nuclear installations in England and Wales during the period 1959-80. Leukemia in young people may be an exception, though the reason remains un- clear." If the leukemias were due to radiation, why were other radiation-induced cancers not seen?
Forman et al. (1987) show that the Standard Mor- tality Ratios (SMR) for Local Authority areas near nuclear instal lat ions are s ignif icant ly less than
the SMRs for control areas more often than the reverse. Only for acute lymphoid leukemia, which occurs primarily in the age group up to 20 y, does there seem to be an increase. It is hard to explain these cases by either direct radiation exposure, or radionuclide releases. This has been studied in a detailed report by Strather et al. (1988), "These cases could not be explained by radiation alone, unless the release was 300 times that known" (Forman et al. 1987). Another possibility is that the carcinogenic effect at low doses of radiation is much higher than thought. But then, why don't the radionuclides from bomb test fallout, many of which are similar, produce a similar- ly large effect?
The effect seems to be primarily a reduction in the number of leukemias in the control areas compared with the number expected from national incidence figures. This strongly suggests to be a chance effect. We also note that the increase was not around nuclear power plants, but around experimental sites: Sel- lafield Fuel Processing Plant, Douneray Fast Breeder Reactor, and the Royal Ordnance Factory.
One other feature of interest comes out of this work. Usually epidemiologists, such as Forman et al. (1987) study cancer mortality. This is because mor- tality is an objective criterion, and recently has not been subject to reporting bias. Beral (1987) pointed out that there is an increase in cancer incidence near nuclear installations although no increase in mor- tality. This may be due to a tendency to report cases more frequently near nuclear installations but it may also be due to emigration of diagnosed cancer patients from areas with nuclear installations. The measured effect is small enough (10%) that biases are all important.
The paper of Forman et al. (1987) was misquoted in the U.S. press. The Boston Globe (Tye 1987) had a headline, "More cancers near nuclear plants," and combined this with a discussion of Gould's work to give a confusing picture; nowhere in the text was the main conclusion quoted.
The statistically significant increase of childhood leukemias has aroused a lot of attention. Clusters of childhood leukemia were originally reported near the experimental breeder reactor in Dounreay, North Scotland. Five leukemias in the age group 0-24 were observed, whereas 1.6 + 1.3 were expected (Heaseman et al. 1986). This is enough to generate a hypothesis that there is something about Dounreay that leads to childhood leukemias. Five leukemias were also found near the British Nuclear Fuel Services Chemical Plant at Sellafield (Taylor and Wilkin 1988; Darby and Doll 1987) (including one who had moved out of the

Risk of radiation 145
area and found later) with 0.5 expected (when the calculation gives a fractional expectation or a num- ber less than one for the expectation, means that both 0 and I are likely). Observation near the second plant seems to confirm the hypothesis that there is some- thing common to Douneray and Sellafield that leads to childhood leukemia. A slight excess in Berkshire, Barrington, and West Hampshire where there are three nuclear establishments, Atomic Energy Research Es- tablishment (AERE), Harwell, Atomic Weapons Re- search Establishment (AWRE), Aldermaston, and Royal Ordnance Factory (ROF) Burgfield (Roman et al. 1987), made the hypothesis even more likely. However, an examination of Roman et al.'s Table 8 shows that increased leukemias are only significant within 10 km of ROF Burgfield (38 cases ages 0-14 vs. 23.9 expected; 8 vs. 6.4 expected within I0 km of AWRE and 0 vs. 0.4 expected within 10 km of AERE). Inclusive reviews of these and other cancers have been made by Cook-Mozaffari et al. (1987), Forman et al. (1987), and Strather et al. (1988).
Many scientists have searched for a possible cause of these childhood leukemias. Darby and Doll (1987) found higher leukemia incidence near several nuclear power plant sites, even when no nuclear power plant had yet been built. This suggests that there must be another explanation unrelated to nuclear power or radiation itself.
Since Sellafield and Dounray are new communities, the young new population might have brought in viral diseases not common in the region from the outside. But this argument could not apply to Aldermaston which is a settled community. This hypothesis was tested by Kinlen (1988) in another new community in Scotland, Glenrothes, where there were no nuclear facilities. A cluster of childhood leukemias was foundDlO in the age group 0-24 (between 1951- 67) versus the 3.6 expected. However, this is a bigger cluster than either the one at Dounray or the one at Sellafield. It is also important to realize that this is not enough to prove a viral cause.
Still a third possibility was studied by Gardner et al. (1990a, 1990b) who identif ied 52 cases of childhood leukemia and 22 cases of non-Hodgkin's lymphoma which had been diagnosed between 1950 and 1985 in the county of West Cumbria, and com- pared them with I001 controls. They investigated four possible causes:
I. prenatal x-rays (which are known to cause leukemia);
2. infectious disease (which might have predisposed the victims to a leukemia infection);
3. eating shellfish (which might concentrate radio- nuclides); and
4. paternal occupation. The most complete information was available from
birth certificates which were available for 46 cases of childhood leukemia and 16 cases of non-Hodgkin's lymphoma. For leukemia alone, Gardner et al. found nine cases whose fathers worked at Sellafield. The risk ratio was 2.62 when area controls were used (95% confidence 1.07 to 7.40) which is just statisti- cally significant. If local controls were used, the risk ratio is reduced to 2.03 (95% confidence 0.69 to 5.93) which is not significant because risk ratio less than 1.0 cannot be excluded. When non-Hodgkin's lym- phoma is added, the risk ratio drops to 2.02 even with area controls (95% confidence 0.87 to 4.67) which is insignificant.
One interesting fact, that was not highlighted in press accounts, is that there were nine leukemias and non-Hodgkin's lymphomas among children whose fathers worked in the iron and steel industry. Using local controls, this gives a risk ratio of 3.20 (1.23 to 8.28 at 95% confidence), which is more significant than the relationship to Sellafield. Also elevated, but not significantly so, was the risk ratio for those whose fathers were farmers.
Since the results of the study by Gardner et al. are just statistically significant by only one of the measures, overall, the study cannot be considered significant by Tippett's Rule. Moreover, Gardner et al. do not tell us whether their nine cases overlap with the five cases found in previous studies; presumably, they do and the associations are not independent. Clearly, if a family moved to Sellafield because it is a new town, it is likely that the father worked at the nuclear facilities; the child could nonetheless be sub- ject to specific viral infection as Kinlen (1988) sug- gests; although Gardner et al. looked for nonspecific infections. If the idea that parental exposure caused the childhood leukemias is correct it is also correct at Dounreay. However, of the five chi ldren with leukemia, only one has a parent working at the plant. Clearly this work raises more fascinating questions than it provides answers.
Because of concerns raised by the reports about finding some increase in mortality from leukemia among young persons, especially under ten, living near nuclear facilities in the U.K., a comprehensive survey of cancer rates was conducted by the U.S. National Cancer Institute in the population living near nuclear facilities in the USA (Jablon et al. 1990). The survey evaluated over 900 000 cancer deaths oc- curring between 1950 through 1984 in 107 counties

146 Shihab-Eldin et el.
Tab•e6•Rati••fcanc¢rdeathsin••unti••n•arnuc••arp•antsandcanc•rd•athsin••ntr••••unti•s.
before startup after startup
Childhood leukemia 1.08 1.03 Leukemia at all ages 1.02 0.98
Jablon ee el. (1990)
with nuclear installations. This covered all 62 nuclear facilities that went into service prior to 1982, including commercial electricity-generating power plants and major Department of Energy (DOE) facilities. Each study county was matched for comparison to three similar control counties in the same region. Cancer deaths studied in the control counties over the same period amounted to more than 1 800 000 cases.
The study found no evidence to suggest higher occurrence of leukemia or any other form of cancer in the study counties than in the control counties after the start of the nuclear facilities, as can be clearly seen from Table 6. The study did reveal that some of the study counties had slightly higher ratio of certain cancers, and some had lower ratios. This pattern was also observed either before startup of some facilities or after startup of other facilities, and, therefore, no evidence for a cause-effect relationship between nuclear facilities and cancer occurrence in a nearby population could be established. Clearly, because the study was limited by the correlational approach and the large size of counties, it could not prove the absence of any effect; but such effect, if it exists, must be small or it would be detected by such a study.
CANCER FROM NATURAL BACKGROUND RADIA- TION
Other data can also address this question. In Wil- son and Jones (1974), modified here as Table 7, is a list of activities giving various radiation doses. At- tached to that list is the number of cancers that would be found if all the U.S. were exposed, on the assump- tion that the slope of the dose-response is 500 cancers per million person rein (2000 personrem/cancer).
The size and variation of the natural background suggests that there should be changes in cancer in- cidence associated with changes in the natural back- ground. This has been looked at by Frigerio and Stowe (1980) who compared the vital statistics by state with the natural background. They found that the cancer rate was lower (132/105) in the states with the highest background (170 mrem/y) compared with
that (147/105 ) in the states with the lowest back- ground (118 mrem/y) and 155/105 in states with 130 mrem/y. The data are shown in Fig. 13, taken from Goldman (1989). The fitted line is a decrease with increasing radiation dose. The statistical ac- curacy of such a comparison is excellent. Naively, one would say that radiation at these low doses reduces the cancer probability. But there was no discussion by Frigerio and Stowe of possible alternative ex- p lanat ions-absence of major industry or confound- ing effects of major lifestyle contributors to cancer such as cigarette smoking. A real decrease is probab- ly not likely. We suggest here that a comparison of lung cancer incidence can tell us whether smoking plays a major role, and a look at bladder cancer might tell us the role of industrial emissions. Cohen (1980) notes that a refusal to accept the data as indicative that radiation is good for you depends upon precon- ceptions, whether correct or not. He comments "The fact that states with high natural radiation have con- siderably lower cancer rates than average is general- ly discussed as indicating only that radiation is very far from being the principal cause of cancer, and this point is logically correct. However this author (Cohen) is highly skeptical over whether that attitude would be accepted if states with high natural radia- tion happened to have somewhat higher than average cancer rates."
We also note that there is no indication of the steep increase with radiation dose suggested by the dotted curve of Fig. 6b.
Other studies of natural background, with a smaller statistical sample, exist. For example, in an area of Guandong province, Peoples Republic of China, there exists a region with three times the normal level of exposure to radium and thorium products; yet, the lung cancer incidence is actually less in these areas than in nearby areas with normal exposure (Hoffman et el. 1985). In this instance, the increased dose is primarily to the lung and would be expected to cause an increase in lung cancer incidence. Instead, a small decrease was found.
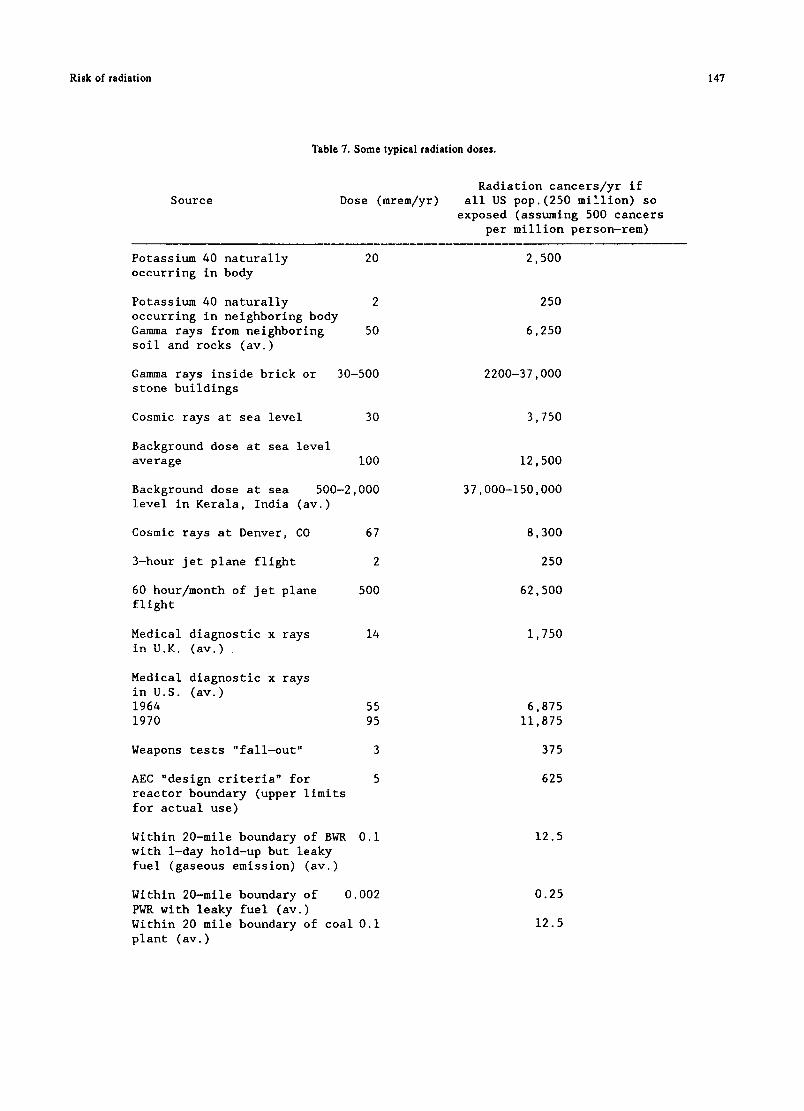
Ri Bk of radiation 147
Source
Table 7. Some typical radiation doses.
Dose (mrem/yr) Radiation cancers/yr if
all US pop.(250 million) so exposed (assuming 500 cancers
per million person-rem)
Potassium 40 naturally occurring in body
20
Potassium 40 naturally 2 occurring in neighboring body Gamma rays from neighboring 50 soil and rocks (av.)
Gamma rays inside brick or 30-500 stone buildings
Cosmic rays at sea level 30
Background dose at sea level average I00
Background dose at sea 500-2,000 level in Kerala, India (av.)
Cosmic rays at Denver, CO 67
3-hour jet plane flight 2
60 hour/month of jet plane 500 flight
Medical diagnostic x rays 14 in U.K. (av.)
55 95
3
5
Medical diagnostic x rays in U.S. (av.) 1964 1970
Weapons tests "fall-out"
AEC "design criteria" for reactor boundary (upper limits for actual use)
0.i Within 20-mile boundary of BWR with 1-day hold-up but leaky fuel (gaseous emission) (av.)
Within 20-mile boundary of 0.002 PWR with leaky fuel (av.) Within 20 mile boundary of coal 0.i plant (av.)
2,500
250
6,250
2200-37,000
3,750
12,500
37,000-150,000
8,300
250
62,500
1,750
6,875 11,875
375
625
12.5
0.25
12.5

148 Shihab-Eldin et al.
0 0 0
e~
r -
u e- u
co
2 5 0 [ [] [] [ ]
! 2254 [] []
[] []• 2 0 0 . _ [ ] m
175- []
1 5 0 - [] ~ [] [ ] ~
1 2 5 - [] [] ~ . ~
1 0 0 - [ ]
7 5 - [ ]
5O 00 oo 16o 12o I ,O
external radiation dose, mremly 1 6 0
Fig. 13. Cancer mortality vs. natural radiation by state (Goldman 1989).
A c k n o w l e d g m e n t m This project was stimulated by the late Dr. William Preston, who kept asking one of us how to respond to claims of radiation damage that seemed superficially plausible. The project began with a short report for, and funded by, DOE. It was extended and distributed with funds from US Council for Energy Awareness (USCEA) and gifts from Stone and Webster Corporation. This updated and corrected version was made pos- sible by a contract from Argonne National Laboratory, and a gift from General Electric Company. To all of these, we are grateful for their help. We gratefully acknowledge helpful comments and suggestions from many people and in particular Dr. Ralph Lapp, Dr. Arthur Upton, Mr. John Landis, Dr. Robert Budnitz, Dr. Victor Bond, Dr. Stan G. Prussin, Dr. R. Yalow, and Dr. B.B. Pochin. We have benefitted greatly from many conversations upon the general subject with many of the authors to whose work we refer, and in particular Dr. Ilyin and Dr. Pavlowski. In conclusion, the detailed help of Ms. S. Wey and Mr. R. McDonald in assembling the final report and graphs is much appreciated.
R E F E R E N C E S
Aamodt, N.L.; Aamodt, M. Aamodt motion for reconsideration of a commission (NRC) order CCI-84-22 and opening of a hearing. Docket No. 50-289; 1985. Available from: Nuclear Regulatory Commission, Washington, DC.
Archer, V.B. Bffects of low levels of radiation: A critical review. Nucl. Safety 21:68-82; 1980.
Beck, H.L. Report of estimates of fall-out from Nevada weapons testing in the Western United States, dased on Gummed-Film Monitoring Data, New York, NY, Environmental Measurements Lab.; 1984. Available from: U.S. Dept. of Energy (BML-433), Washington, DC.
Beck, H.L.; Krey, P.W. Radiation exposures in Utah from Nevada nuclear tests. Science 220(4592):18-24; 1983.
Behlin8, V.H.; Hildebrand, J.E. Radiation and health effects: A report on the TMI-2 accident and related health studies; 1986. Avai lable from: U.S. Nuclear Regula tory Commis- sion, Washington, DC.
BEIR (Biological Effects of Ionizing Radiation). The effects on populations of exposure to low levels of ionizing radiation. Report of the Advisory Committee on the Biological Effects of Ionizing Radiation; 1972. Available from: U.S. National Academy of Sciences, Washington, DC.
BEIR (Biological Bffects of Ionizing Radiation). The effects of popu la t ion of exposure to low leve l s of ionizing radiation. Report of the Advisory Committee on Biological Effects of Ionizing Radiation; 1980. Available from: U.S. Na- tional Academy of Sciences, Washington, DC.
BEIR (Biological Effects of Ionizing Radiation). Health effects of exposure to low levels of ionizing radiation. Report of the Advisory Committee on the Biological Effects of Ioniz- ing Radiation, Board on Radiation Effects Research, Com- mission on Life Sciences, National Research Council; 1990. Available from: National Academy of Sciences; Washington, DC.
Beral, V. Cancer near nuclear installations. Lancet 1(8532):556; 1987.
Boffey, P.M.; Sternglass, E.J. Controversial prophet of doom. Science 166:195-200; 1969.
Boice, J.D.; Land, C.B. Adult leukemia following diagnostic X- rays. Review of report by Bross, Ball, and Falen. Am. J. Public Health 69:137-145; 1979.
Bond, V.P. Radiation standards particularly as related to nuclear power plants. Talk to Council for the Advancement of Science
Risk of radiation 149
Writing, Raleigh, NC, 16 November, 1970. Available from: Brookhaven National Laboratory, Upton, NY.
Bond, V.P. The cancer risk attributable to radiation exposure: some practical problems, Health Phys. 40:108-111; 1981.
Boston Globe. The danger of radiation at the Portsmouth shipyard. February 19, 1978.
Brancker A. Quoted in: U.S. Council for Energy Awareness INFO; Issue 231; 1988. Available from: USCEA, Washington, DC.
Eross, I.D.J. Regarding genetic effects of the atomic bombs: A reappraisal. Health Phys. 44:283-285; 1983.
Bross, I.D.J.; Ball, M.; Fallen, S. A dosage-response curve for the one rad range: Adult risks from diagnostic radiation. Am. J. Public Health 69:130-136; 1979.
Bross, I.D.J.; Natarajan, N. Genetic damage from diagnostic radia- tion. J. Am. Med. Assoc. 237:2399-2401; 1977.
Bross, I.D.J.; Natarajan, N. Cumulative genetic damage in children exposed to preconception and intrauterine radiation. Invest. Radiol. 15:52-64; 1980.
Cartwright, R.A.; Bernard, S.M. Epidemiology. In: Whittaker, J.A.; Delamore, I.W. Leukemia. Oxford: Blackwell Scientific Publications; 1987.
Cehn, J.I.; Sagan, L. A review of reported cancer clusters near nuclear facilities. Health Phys. Newsletter September; 1988.
Chinn S. The relationship of the Rocky Flats plant and other factors to 1969-1971 cancer incidence in the Denver area. Denver, CO: Fairfield and Woods (In house publication); 1981.
Clapp, R.W.; Cobb, S; Chan, C.K.; Walker, B. Leukemia near Massachusetts nuclear power plant. Lancet 2:1324-1325; 1987.
Cobb, S. Testimony before Joint Committee on Energy (JCE): Commonwealth of Massachusetts; March 24, 1987. Available from: JCE, Boston, MA.
Cobb, S.; Eversole, C.; Archer, P.G. et al. Plutonium burdens in people living around Rocky Flats plant. Contract ##68-03-2217 for the Environmental Monitoring and Support Laboratory, U.S. Environmental Protection Agency, 1982. Available from: NTIS, Springfield, VA.
Cohen, B.L. The cancer risk from low level radiation. Health Phys. 39:659-678; 1980.
Cohen, B.L. Limitations and problems in deriving risk estimates from low level radiation exposure. Yale J. Biol. Med. 54:329- 338; 1981.
Cohen, B.L. Before it is too late. New York, NY: Plenum Press; 1983.
Cohen, B.L. A poll of radiation health scientists. Health Phys. 50:639; 1986.
Cook-Mozaffari, P.J.; Ashwood, F.L.; Vincent, T.; Foreman, D.; Alderson, M. Cancer incidence and mortality in the vicinity of nuclear installations: England and Wales 1950 to 1980. Studies on Med. and Population Studies No. 51. London: H.M. Station- ary Office; 1987.
Crouch, E.A.C.; Wilson, R. Risk assessment and comparisons: an introduction. Science 236:267; 1987.
Crump, K.S.; N8, T.H.; Cuddihy, R. Cancer incidence patterns in the Denver Metropolitan area in relation to the Rocky Flats plant. Am. J. Epidemiol. 126:127-135; 1987.
Darby, S.C.; Doll, R. Fallout, radiation doses near Dounreay and childhood leukemia. Br. Med. J. 294:603-607; 1987.
Dunham, C.L. Comments on statement of the Federation of Am. Scientists and the June 7th paper of Dr. Sternglass appearing in Science on Fallout, Radiation Standards and Countermeasures. JCAE (Joint Committee on Atomic Energy, U.S. Congress) 6/3- 6/6/63, part 1:418; 1963; Available from: U.S. Government Print- ing Office, Washington, DC.
Eisenbud, M. etal. Statement on the Assertions of E.J. Sternglass. Ad hoc committee of the Greater New York Chapter of the Health Phys. Soc., October 15, 1969. Available from: Health Physics Society, New York, NY.
Engstrom, J.E. Childhood leukemia and nuclear fallout. New England J. Med. 300:1491; 1979.
Engstrom, J.E. The non-association of fallout radiation with childhood leukemia in Utah. In: Banbury Report 4, Cancer incidence in defined populations; 1980. Available from: Cold Spring Harbor Laboratory, New York, NY.
Forman, D.; Cook-Mozzaffari, P.; Darby, S.; Davey, G.; Stratton, I.; Doll, R; Pike, M. Cancer near nuclear installations. Nature 329:499-505; 1987.
Frigerio, N.A.; Stows, R.S. Carcinogenic and genetic hazard from natural background radiation. In: Biological and environmental effects of low level radiation, IAEA. Vienna: International Atomic Energy Agency ; 1980:385.
Gardner, M.J.; Snee, M.P.; Hall, A.J.; Powell, C.A.; Downes, S.; Terell, J.D. Results of case-control study of leukemia and lym- phoma among young people near Sellafield nuclear plant in West Cumbria. Br. Med. J. 300:423-429; 1990a.
Gardner, M.J.; Hall, A.J.; Snee, M.P.; Downes, S; Powell, C.A.; Terrel, J.D. Methods and basic data of case-control study of leukemia and lymphoma among young people near SeUafield nuclear plant in West Cumbria. Br. Med. J. 300:429-434; 1990b
Gilbert, E.S.; Petersen, G.R.; Buchanan, J.A. Mortality of workers at the Hanford site: 1945-1981. Health Phys. 56:11-25; 1989.
Gilbert, E.S.; Marks, S. An analysis of the mortality of workers in a nuclear facility. Radiat. Res. 79:122-148; 1979.
Gilbert, E.S.; Marks, S. An updated analysis of workers in a nuclear facility. Radiat. Res. 83:740-741; 1980.
Gibson, R. et al. Leukemia in children exposed to multiple risk factors. New England J. Med. 279:906; 1968.
Glass, A.G.; Hill, J.A.; Miller, R.W. Significance of leukemia clusters. J. Pediatr. 73:101; 1968.
Goldman, M. Chernobyl: A radiological perspective. Science 238:622-623; 1987.
Goldman, M.; Catlin, R.J.; Anspaugh, L. Health and environ- mental consequences of the Chernobyl Nuclear Power Plant accident, DOE/ER-0332:7.18-7.19; 1987. Available from: U.S. Department of Energy, Washington, DC.
Goldman, M. Radioepidemioligical studies: History and status. Presented at U.S. Council for Energy Awareness (CEA) INFO89 Conference, New Orleans, LA. April 16-19; 1989. Available from: USCEA, Washington, DC.
Goldsmith, LR. The urban factor in cancer: Smoking, industrial exposures and air pollution as possible explanation. J. Environ. Path. Tox. 3:205-217; 1980.
Goldstein, B.D. Benzene toxicity: A critical evaluation: hematoxicity in humans. J. Toxicol. Environ. Health; Suppl. 2:69; 1977.
Goodstein, D.L. Richard P. Feynman, Teacher. Phys. Today. Feb:70-75; 1989.
Gould, J.M.; Jacobs, B.; Chen, C.; Cos, S. Nuclear emissions take their toll. Council on Economic Priorities, Publication N86-12. Dec; 1986. Available from: Council on Economic Priorities, New York, NY.
Gould, J.M. Significant U.S. mortality increases in the summer of 1986 (widely quoted article); 1988. Available from: author.
Graham, J.; Thro, E. The Sternglass phenomenon. Nucl. News: Oct; 1969.
Graham, S. et al. Methodological problems and design of the tri-state leukemia survey. Ann. N.Y. Acad. Sci. 107:557; 1963.
Grant, R.W. Trashing nuclear power. Available from: Quan- dary House, California; 1988.
Greenberg, E.R.; Rosner, B.; Hemekeus, C.; Rinsky, R.; Colton, T. An investigation of bias in a study of nuclear shipyard workers. Am. J. Epidemiol. 121:301-308; 1985.
Hamilton, L.D. Areas of uncertainty in estimation of health risks. In: Symposium on energy and human health: Human cost of electrical power generation. USEPA Report 600/9-80-030;
150 Shihab-Eldin et al.
1980. Available from: U.S. Environmental Protection Agency, Washington, DC.
Hamilton, L.D. Alternative interpretation of statistics on health effects of low level radiation. Am. Stat. 37:442-451; 1983.
Hamilton, L.D.; Nagy, J.; Robinson, C.V. Reanalysis of genetic effects of the atomic bombs: A reappraisal. Letter to the Editors. Health Phys. 44:435-437; 1983.
Hatch, M.C.; Beyea, J.; Nieves, J.W.; Susser, M. Cancer near the Three Mile Island nuclear plant. Am. J. Epidemiol. 132:397- 417; 1990
Hatch, M.C.; Wallenstern, S; Beyea, J.; Nieves, J.W.; Susser, M. Cancer rates after the Three Mile Island nuclear accident and proximity of residence to the plant. Am. J. Publ. Health 81:719- 724; 1991.
Heasman, M.A.; Kemp, I.W.; Urquhart, J.D.; Black, R. Childhood leukemia in nothern Scotland. Lancet 1:266; 1986.
Heller, M.B. Infant and fetal mortality caused by 9°Sr7 Am. Ass. Pediatr. Med. Quarterly Bulletin. March; 1970.
Hill, A.B,; The environment and diseases: Association and causa- tion. In: Proc. Roy. Soc. Med.; Soc. Occup. Med. 58:295; 1965.
Hoffman, W.; Katz, R.; Chunxiang, Z. Lung cancer incidence in a Chinese high background area--epidemiological results and theoretical interpretation. Chinese J. Radiol. Med. Rep. 2:140; 1985.
Hull, A.P.; Shore, F.J. Standards, statistics and Sternglass: Guilt by association. Presented at the 6th annual Health Phys. Soc., topical symp., Richland, WA, November 2-5; 1971. Available from: Health Physics Society, McLean, VA.
Hutchison, G.B.; MacMahon, B.; Jablon, S.; Land, C.E. Review of report by Mancuso, Stewart and Kneale of radiation ex- posure of Hanford workers. Health Phys. 37:207-220; 1979.
ICRP (International Commission on Radiological Protection). Limits for intake of radionuclides by workers. ICRP 30. Ox- ford: Pergamon Press; 1982.
Jablon, S.; Hrubec, Z.; Boice, J.D., Jr.; Stone, B.J. Cancers in populations living near nuclear facilities, No. 90-874, 1990. National Institutes of Health, Bethesda, MD.
Johnson, C.J. Cancer incidence in an area contaminated with radionuclides near a nuclear installation. Ambio 10:176-182; 1981.
Johnson, C.J. Cancer incidence in an area of radioactive fallout downwind from the Nevada test site. J. Am. Med. Assoc. 251:230- 236; 1984.
Johnson, C.J. Cancer incidence patterns in the Denver metropolitan area in relation to the Rocky Flats plant. Am. J. Epidemiol. 126:153-155; 1987.
Kinlen, L. Evidence for an infective cause of childhood leukemia: Comparison of a Scottish new town with nuclear reprocessing sites in Britain. Lancet 2:1323-1327; 1988.
Kemeny, J.G. etal. Report of the President's commission of the accident at Three Mile Island, November; 1979. Available from: U.S. Government Printing Office, Washington, DC
Kleitman, D.J. Critique of Mancuso-Stewart-Kneale Report. Report to the U.S. NRC. Available from: U.S. Nuclear Regulatory Commission, Washington, DC.
Kneale, G.W.; Mancuso, T.P.; Stewart, A.M. Hanford radiation study III. A cohort study of the cancer risks for radiation workers at Hanford (1944-1977 deaths) by the method of regres- sion models in life tables. Br. J. Ind. Med. 38:156-166; 1981.
Kneale, G.W.; Mancuso, T.F.; Stewart, A.M. Job related mortality risks of Hanford workers and their relation to cancer effects of measured doses of external radiation. Br. J. Ind. Med. 41:9-14; 1984.
Lamm, S.H.; Walters, A.S.; Wilson, R.; Byrd, D.M.; Gruenwald, H. Consistensies and inconsistencies underlying the quantita- tive assessment of leukemia risk from benzene exposure. En- viron. Health Persp. 82:289-297; 1989.
Land, C.E. The hazards of fallout or of epidcmiologic research. Editorial. New England J. of Med. 300:431; 1979.
Lyon, J,L.; Klauber, M.R.; Gardner, J.W.; Udall, K.S. Childhood leukemia associated with fallout from nuclear testing. New England J. Med. 300:397-402; 1979.
Machado, S.G.; Land, C.E.; MacKay, F.W. Cancer mortality and radioactive fallout in Southern Utah. Am. J. Epidemiol. 125:44- 61; 1987.
MacMahon, B. Statement, hearings on fallout, radiation stand- ards and countermeasures. Joint Comittee on Atomic Energy (JCAE), June 3-6, Part I:418; 1963. Available from: JCAE, Washington, DC.
MacMahon, B. Some recent issues in low-exposure radiation epidemiology. Environ. Health Persp. 9 h 131-135; 1989.
MacMahon, B.; Pugh, T.F. Epidemiology: Principles and methods. Boston, MA: Little, Brown and Company; 1970.
Massachusetts. Health surveillance of the Plymouth area. Mass. Dept. of Public Health. March 16; 1987.
Mancuso, T.; Stewart, A.; Kneale, G. Radiation exposure of Han- ford workers dying from cancer and other causes. Health Phys. 33:369-384; 1977.
McCracken, S. The war against the atom. New York, NY: Basic Books; 1982.
Merriman, et al. Report of the Chief Inspector of Factories to the Alkali Inspectorate. Available from: H. M. Stationary Office, London: 1938.
Metzenbaum, H.M. Statement of J. Gofman read into the Congres- sional Record S-8760, June 26. Washington, DC; 1986.
Moeller, D. etal. Statement by the President and Past Presidents of the Health Phys. Soc. with regard to presentations by Dr. Ernest Sternglass, 17th Annual Meeting of the Health Phys. Soc., NY, July 14; 1971. Available from: Health Physics Society, McLean, VA.
Mole, R. H. Anxieties and fears about plutonium. Br. Med. J. 2:743-745; 1977.
Morris, M.; Knori, R.S. South Eastern Massachusetts Health Study 1978-1990. Division of Environmental Health Assessment, Department of Public Health, Commonwealth of Massachusetts, Oct; 1990. Available from: Dept. of Public Health, Boston, MA.
Najarian, T. Alternative interpretations of statistics on health ef- fects of radiation. Comment. Am. Star. 37:455-457; 1983.
Najarian, T.; Colton, T. Mortality from leukemia and cancer in shipyard nuclear workers. Lancet 1:1018-1020; 1978.
Nature Editorial. When to believe the unbelievable. Nature 333:787; 1988.
NCRP (National Council on Radiation Protection). Influence of dose and its distribution in time on dose response relationships for low-let radiations; 1982. Available from: NCRP, Bethesda, MD.
NCRP (National Council on Radiation Protection). Comparative carcinogenicity of ionizing radiation and chemicals; 1989. Avail- able from: NCRP, Bethesda, MD.
News Tribune (Seattle) Editorial. Specious claims of fallout deaths. Oct; 1987.
NUREG (Nuclear Regulatory Commission Report). Population ex- posure and health impact of the Three Mile Island Nuclear Station; NUREG-0558; 1979. U.S. Nuclear Regulatory Commission, Washington, DC.
Pochin, E.E. Nuclear radiation: Risks and benefits. Oxford: Claren- don Laboratory; 1983.
Pools, C.; Rothman, K.J.; Dreyer, N.A. Leukemia near Pilgrim nuclear power plant, Massachusetts. Lancet 2:1308; 1988.
Rinsky, R.A.; et al. Cancer mortality at a naval nuclear shipyard. Lancet 1:231-235; 1981.
Rinsky, R.A.; Melius, J.M.; Homung, R.H. Case-control study of lung cancer in civilian employees at the Portsmouth

Risk of radiation 151
naval shipyard, Kittery, Maine. Am. J. Epidemiol. 127:55- 64; 1988.
Roman, E.; Beral, V.; Carpenter, L.; Watson, A.; Barton, C.; Ryder, H.; Aston, D.L. Childhood leukemia in the West Berkshire and Baringstable and North Hampshire district health authorities in relation to nuclear establishments in the vicinity. Br. Med. J. 294:597-602; 1987.
Rothman, K.J. Review of Dr. Irwin Bross ' presentation on radiation exposure and cancer risk. Report to the U.S. NRC, 1978. Available from: U.S.Nuclear Regulatory Commission, Washington, DC.
Rothman, K.J.; Poole, C.; Dreyer, N.A. Update on leukemia rates in towns near the Pilgrim nuclear power station; Oct 26, 1988. Available from: Epidemiology Resources Inc., Chestnut Hill, MA.
Sagan, L. A reply to Sternglass. New Sci. Oct 2; 1969. Sanders, B.S. Health Phys. 34:521-538; 1978. Schull, W.J.; Otake, M.; Noel, J.V. Genetic effects of atomic
bombs; a reappraisal. Science 213:1220; 1981. Shimizu, Y.; Kato, H.; SchuU, W.J. Cancer mortality in the years
1950-1985 based on the recently revised doses (DS86). Radia- tion Effects Research Foundation (RBRF). Life span study report #11, part 2; 1988. Available from: RBRF, Hiroshima.
Shleien, B.; Ruttenber, A.J.; Sage, M. Epidemiologic studies of cancers in populations near nuclear facilities. Health Phys. 61:699-713; 1991.
Smith EG. Spatial and temporal clustering. In: Scholffenfield, D.; Franmeni J.F., eds. Cancer epidemiology and prevent ion . Philadelphia, PA: Saunders; 1982.
Smith, J.L.; Heerema, N.A.; Provisor, A.J. Leukemic transforma- tion and engrafted bone marrow cells. Br. J. Haemotol. 60:415- 422; 1985.
Speirs, F.W. Background radiation and estimated risks from low- dose radiation. Br. J. Radiol. 52:508; 1979.
Starzyk, F. Letter to Wall Street Journal; 1987. Steinbrook, R. 20,000-40,000 Chernobyl deaths disputed. Los An-
geles Times, Feb. 27, 1988. Stern, F.B. et al. A case-control study of leukemia at a naval
nuclear shipyard. Am. J. Epidemiol, 123:980-992; 1986. Sternglass, E.J. Cancer, relation of prenatal radiation to develop-
ment of the disease in childhood. Science 140:1102-04; 1963. Sternglass, E.J. Evidence of low-level radiation effects on the
human embryo and the foetus. In: Proc. 9th annual Hanford symposium on radiation biology of the foetal and juvenile mam- mal. CONF-690510; 1969a. Available from: National Technical Information Service, Springfield, VA.
Sternglass, E.J. Can the infants survive? Bull. Atmos. Sci. 25:29; June 1969b.
Sternglass, E.J. Strontium-90 in ABM's. Letter to the Editor. New York Times, June 20, 1969c.
Sternglass, E.J. Infant mortality: The nuclear culprit. Med. Trib. Med. News. July 21, 1969d.
Sternglass, E.J. Has nuclear testing caused infant deaths? New Scientist. July 24, 1969e.
Sternglass, E.J. The death of all children. Esquire, September, 1969f. Sternglass, B.J.; Seshim, D.; Rocchio0 R. Strontium-90, evidence
for a possible genetic effect in man. Presented at the 14th annual meeting of the Health Phys. Society, Pittsburgh, PA. June 12; 1969. Available from: Health Physics Society, McLean, VA.
Sternglass, E.J. Secret fallout: Low level radiation from Hiroshima to Three Mile Island. New York: McGraw Hill; 1981.
Sternglass, E.J. Birth weight and infant mortality changes in Mas- sachusetts following releases from the Pilgrim Nuclear Power Plant. Unpublished, privately circulated report. June 10; 1986. Avail- able from: Dept. of Public Health, University of Pittsburgh, PA.
Stevens, W.; Thomas, D.C.; Lyon, J.L.; Till, J.E.; Kerber, R.A.; Simon, S.L.; Lloyd, R.D.; Eighany, N.A.; Preston-Martin, S. Leukemia in Utah and radioactive fallout from the Nevada test site. J. Am. Med. Ass. 264:585-591; 1990.
Stewart, A. The pitfalls of extrapolation. New Sci. July 24, 1969. Stewart, A.; Kneale, G. Radiation dose effects in relation to
obstetric X-rays and childhood cancers. The Lancet: 1185-88; June 6, 1970.
Stewart, A.; Kneale, G. A-bomb radiation and evidence of late effects other than cancer. Health Phys. 58:729-735; 1990.
Stewart, A.; Kneale, G. An overview of the Hanford controversy. Occupat. Med. Reviews 6: Oct-Dec 1991.
Stone and Webster Co. Evaluation of the coastal circulation con- tainment hypothesis in the vicinity of the Pilgrim nuclear power station. Jan; 1988. Available from: Stone and Webster En- gineering Corp., Boston, MA.
Strather, J.W.; Clarke, R.H.; Duncan, K.P. The risk of childhood leukemia near nuclear establishments. National Radiation Protection Board. London: H. M. Stationary Office; 1988.
Taylor; Wilkin, C. Drawing the line with leukemia. New Sci. 24:53; July 1988.
Tippett, L.H.C. The methods of statistics. An introduction main- ly for experimentalists. London: Williams and Norgate, Ltd.; 1937.
Tokuhata, G.K.; Dignon, E. Cancer mortality and morbidity (incidence) around TMI; September 1985. Available from: Pennsylvania Dept. of Public Health, Harrisburg, PA.
Tokuhata, G.K.; Bratz, J.; Ramaswamy, K.; Sheller, K.W. Cancer incidence among women of childbearing ages exposed to TMI accident radiation: 10-year cohort follow-up. Paper presented at the Society for Epidemiological Research annual meeting. June 12, 1991. Available from: Dept. of Public Health, Harris- burg, PA.
Tye, L. More cancers near nuclear plants. Boston Globe. Oct. 8, 1987.
UNSCEAR (United Nations Scientific Committee on the Effects of Atomic Radiation). Genetic and somatic effects of ionizing radiation. Report to the General Assembly, 1988. Available from: United Nations, New York, NY.
UNSCEAR (United Nations Scientific Committee on the effects of Atomic Radiation). Effects and risks of ionizing radiation. Report to the General Assembly; 1988. Available from: United Nations, New York, NY.
Wasserman, H. Three Mile Island did it: The fatal fallout from America's worst nuclear accident. Harrowsmith (May/June) 9:41; 1987.
Weart, S.R. Nuclear fear, a history of images. Cambridge, MA: Harvard University Press; 1988.
Webster, E.W. On the question of cancer induction by small X-ray doses. Garland Lecture. Am. J. Roentgenol. 137:647-666; 1981.
Wermiel, S. Doctors shift on shipyard. Kennedy chides Portsmouth researcher. Boston Globe, June 20, 1979.
Wilson, R.; Jones, W.J. Energy, ecology and the environment. New York: Academic Press; 1974.
Wilson, R.; Colome, S.; Spongier, J.; Wilson, D.G. Health effects of fossil fuel burning. Cambridge, MA: Ballinger Publishing Company; 1981.
Wilson, R. A visit to Chernobyl. Science 236:1636-1640; 1987. Wilson, R.; Crouch, E.A.C. Risk assessment and comparisons: An
introduction. Science 236:267-270; 1987. Wilson, R.; Leukemia in Plymouth, MA. Letter. Health Phys. 1991
(In press). Wrenn, M.E. Data on Strontium-90, Letter to the Editor. New York
Times. September 13, 1969. Yalow, R.S. Radioactivity in the service of humanity. Ala. J. Med.
Sci. 23:447; 1986.