Embed Size (px)
Citation preview
IS THERE A FUTURE FOR NUCLEAR POWER IN THE UNITED STATES?Jonathan A. Lesser Continental Economics
REPORT | July 2019

Is There a Future for Nuclear Power in the United States?
2
About the AuthorJonathan A. Lesser, president of Continental Economics, has more than 30 years of experience working for regulated utilities, for government, and as an economic consultant. He has addressed numerous economic and regulatory issues affecting the energy industry in the U.S., Canada, and Latin America. His areas of expertise include cost-benefit analysis applied to both energy and environmental policy, rate regulation, market structure, and antitrust. Lesser has provided expert testimony on energy-related matters before utility commissions in several states; before the Federal Energy Regulatory Commission; before international regulators; and in state and federal courts. He has also testified before Congress and many state legislative committees on energy policy and regulatory issues. Lesser is the author of numerous academic and trade-press articles and is an editorial board member of Natural Gas & Electricity. He earned a B.S. in mathematics and economics from the University of New Mexico and an M.A. and a Ph.D. in economics from the University of Washington.
3
Contents Executive Summary ..................................................................4 Introduction ..............................................................................5 I. A Short History of the U.S. Nuclear Power Industry ....................7 II. Wholesale Power Markets and the Economic Decline
of the Nuclear Industry After 2008 ..........................................11 III. The Economics of the U.S. Nuclear Industry Today ..................13 IV. Looking Ahead: Can the Nuclear Industry Survive? ..................16 V. Conclusions and Policy Recommendations ..............................24 Appendix: Price Formation in the PJM Wholesale
Electric Energy Market ...........................................................26 Endnotes ...............................................................................31
Is There a Future for Nuclear Power in the United States?
4
Is There a Future for Nuclear Power in the United States?
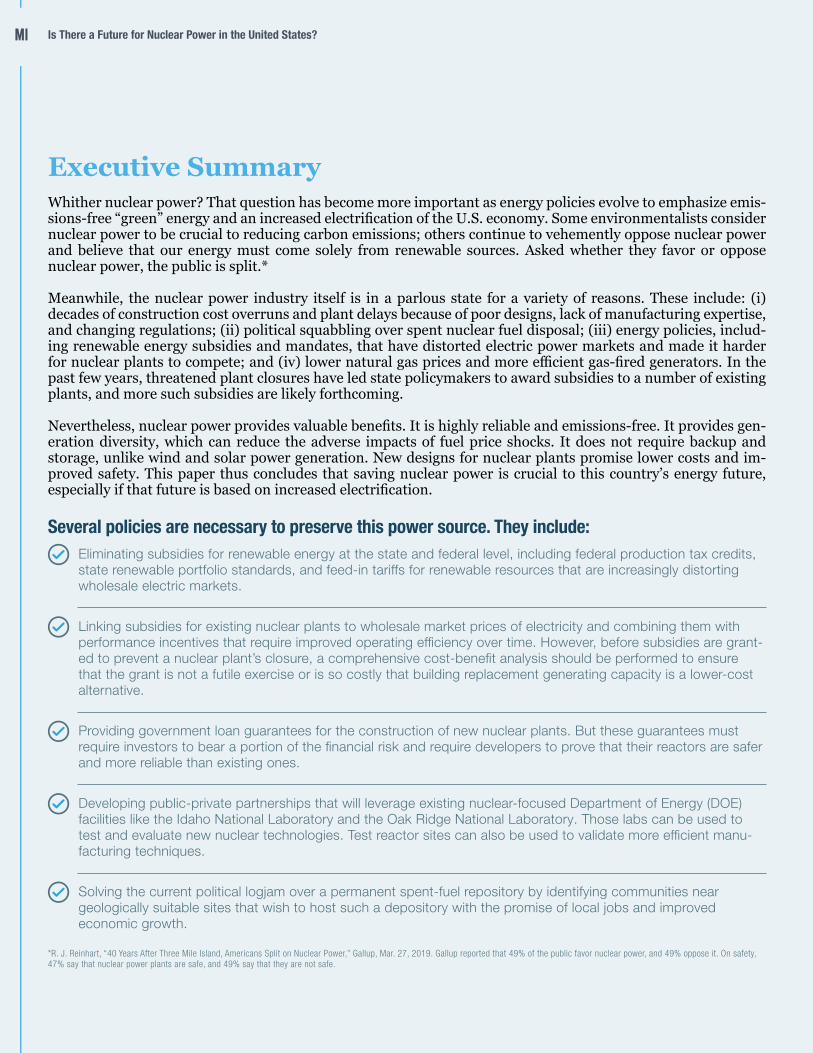
Executive SummaryWhither nuclear power? That question has become more important as energy policies evolve to emphasize emis-sions-free “green” energy and an increased electrification of the U.S. economy. Some environmentalists consider nuclear power to be crucial to reducing carbon emissions; others continue to vehemently oppose nuclear power and believe that our energy must come solely from renewable sources. Asked whether they favor or oppose nuclear power, the public is split.*
Meanwhile, the nuclear power industry itself is in a parlous state for a variety of reasons. These include: (i) decades of construction cost overruns and plant delays because of poor designs, lack of manufacturing expertise, and changing regulations; (ii) political squabbling over spent nuclear fuel disposal; (iii) energy policies, includ-ing renewable energy subsidies and mandates, that have distorted electric power markets and made it harder for nuclear plants to compete; and (iv) lower natural gas prices and more efficient gas-fired generators. In the past few years, threatened plant closures have led state policymakers to award subsidies to a number of existing plants, and more such subsidies are likely forthcoming.
Nevertheless, nuclear power provides valuable benefits. It is highly reliable and emissions-free. It provides gen-eration diversity, which can reduce the adverse impacts of fuel price shocks. It does not require backup and storage, unlike wind and solar power generation. New designs for nuclear plants promise lower costs and im-proved safety. This paper thus concludes that saving nuclear power is crucial to this country’s energy future, especially if that future is based on increased electrification.
Several policies are necessary to preserve this power source. They include: Eliminating subsidies for renewable energy at the state and federal level, including federal production tax credits,
state renewable portfolio standards, and feed-in tariffs for renewable resources that are increasingly distorting wholesale electric markets.
Linking subsidies for existing nuclear plants to wholesale market prices of electricity and combining them with performance incentives that require improved operating efficiency over time. However, before subsidies are grant-ed to prevent a nuclear plant’s closure, a comprehensive cost-benefit analysis should be performed to ensure that the grant is not a futile exercise or is so costly that building replacement generating capacity is a lower-cost alternative.
Providing government loan guarantees for the construction of new nuclear plants. But these guarantees must require investors to bear a portion of the financial risk and require developers to prove that their reactors are safer and more reliable than existing ones.
Developing public-private partnerships that will leverage existing nuclear-focused Department of Energy (DOE) facilities like the Idaho National Laboratory and the Oak Ridge National Laboratory. Those labs can be used to test and evaluate new nuclear technologies. Test reactor sites can also be used to validate more efficient manu-facturing techniques.
Solving the current political logjam over a permanent spent-fuel repository by identifying communities near geologically suitable sites that wish to host such a depository with the promise of local jobs and improved economic growth.
*R. J. Reinhart, “40 Years After Three Mile Island, Americans Split on Nuclear Power,” Gallup, Mar. 27, 2019. Gallup reported that 49% of the public favor nuclear power, and 49% oppose it. On safety, 47% say that nuclear power plants are safe, and 49% say that they are not safe.
5
IS THERE A FUTURE FOR NUCLEAR POWER IN THE UNITED STATES?
IntroductionThe domestic nuclear power industry is in the midst of a decades-long decline. The causes are many. Plant construction costs that spiraled out of control because of “one-off” designs and changing regulatory requirements, decreases in electricity demand growth that eliminated the need for planned units, and irrational fears of nuclear accidents have all taken their toll on the industry. More recently, environmental and political opposition has caused some nuclear plant owners to agree to retire plants prematurely—including Exelon’s Oyster Creek plant in New Jersey, Indian Point in New York, and Diablo Canyon in California—rather than face costly and protracted litigation. Lastly, the decline in natural gas prices and changes in wholesale electric market designs—including subsidies for wind and solar generation—have also adversely affected nuclear plant profitability, especially for smaller, single-reactor plants.
These factors have caused a number of U.S. nuclear plants to be shuttered before the end of their useful lives. Currently, 11 of the 60 operating plants, with a total capacity of 17,000 megawatts (MW) and producing about 125 terawatt-hours (TWh) of electricity annually (enough to power more than 12 million homes),1 are slated for closure by 2025. By comparison, in 2018, the 30,000 MW of utility-scale solar photovoltaics (PV) and 94,000 MW of wind power in the country pro-duced 63 TWh and 275 TWh, respectively.2 The total generating capacity of the nation’s nuclear plants is a little over 99,000 MW, about the same as wind power. Yet in 2018, nuclear generation totaled over 800 TWh, more than double the amount of wind and solar PV generation com-bined. (One key reason that nuclear produces so much more electricity than solar or wind for a given amount of capacity is that solar and wind are inherently intermittent energy sources while nuclear plants are designed to run all the time.)
Nuclear plant subsidies have been justified in order to recognize “unpriced” benefits, such as “zero-emissions credits” (ZECs) in Illinois and New York.3 Some states have also been keen to ensure that nuclear plants continue to operate because of the jobs and economic benefits they provide to local communities, many of which would suffer adverse economic impacts from clo-sures. Whether the benefits of such subsidies exceed their costs, which are paid by electric rate-payers and have their own adverse impacts, is an empirical question. (Ironically, while New York now subsidizes three upstate nuclear plants, Governor Andrew Cuomo led the efforts to shutter the Indian Point facility, about 40 miles north of Manhattan on the Hudson River. One of its two generating units is scheduled to be shut next year; the other is set to be closed in 2022.) Subsidies
Is There a Future for Nuclear Power in the United States?
6
for nuclear plants were recently approved in New Jersey4 and Connecticut.5 Legislation to subsidize nuclear plants in Ohio and Pennsylvania has also been introduced.
As for constructing new plants, despite regulatory reforms and promises of standardized designs, con-struction efforts have faltered because of crippling cost overruns, continuing a multidecade pattern. Overruns led to the abandonment of the uncompleted Santee Cooper plant in South Carolina in 2017. The estimat-ed cost of two new reactors at the Southern Company’s Vogtle plant in Georgia has roughly doubled, to over $27 billion, while the scheduled online completion date for the first of the new reactors has slipped from 2017 to 2022, at the earliest.6
In addition to the problems listed above, the nuclear sector has yet to resolve the issue of waste disposal.7 Fur-thermore, nuclear energy opponents have exploited the public’s fears of this power source—which arose from the accidents at Three Mile Island (TMI) in Pennsylvania in 1979, Chernobyl in Ukraine in 1986, and the tidal wave that engulfed Japan’s Fukushima-Daiichi plant in 2011.
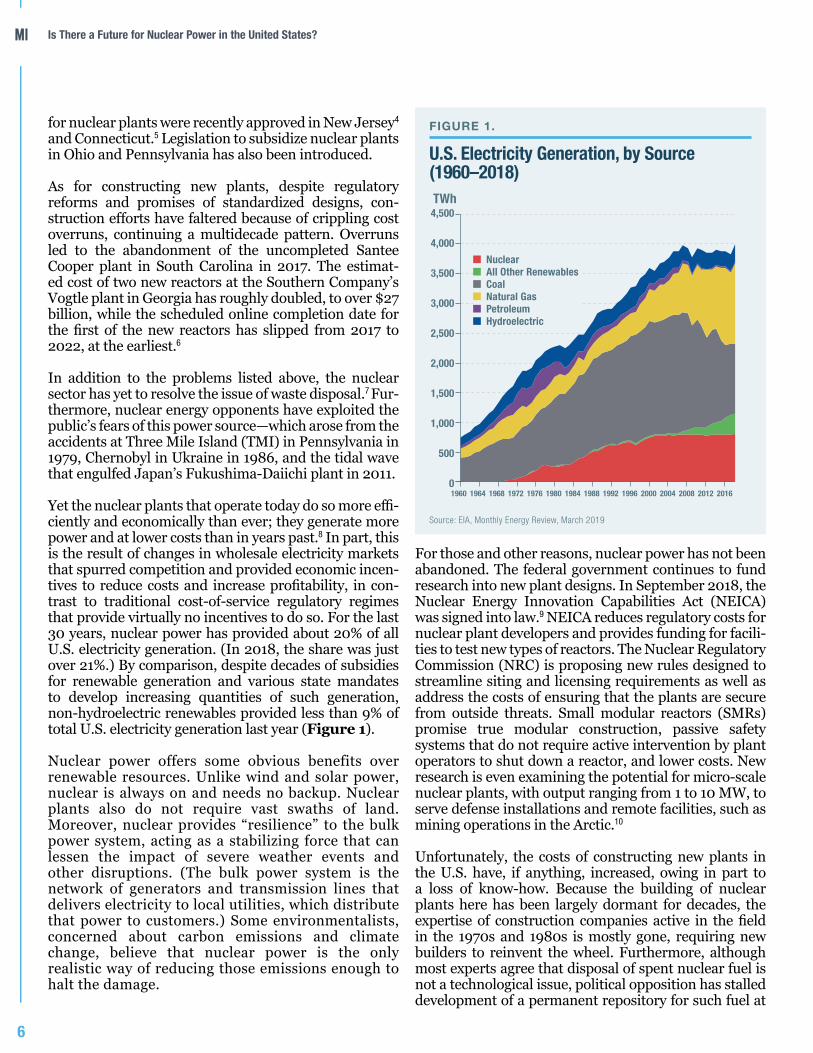
Yet the nuclear plants that operate today do so more effi-ciently and economically than ever; they generate more power and at lower costs than in years past.8 In part, this is the result of changes in wholesale electricity markets that spurred competition and provided economic incen-tives to reduce costs and increase profitability, in con-trast to traditional cost-of-service regulatory regimes that provide virtually no incentives to do so. For the last 30 years, nuclear power has provided about 20% of all U.S. electricity generation. (In 2018, the share was just over 21%.) By comparison, despite decades of subsidies for renewable generation and various state mandates to develop increasing quantities of such generation, non-hydroelectric renewables provided less than 9% of total U.S. electricity generation last year (Figure 1).
Nuclear power offers some obvious benefits over renewable resources. Unlike wind and solar power, nuclear is always on and needs no backup. Nuclear plants also do not require vast swaths of land. Moreover, nuclear provides “resilience” to the bulk power system, acting as a stabilizing force that can lessen the impact of severe weather events and other disruptions. (The bulk power system is the network of generators and transmission lines that delivers electricity to local utilities, which distribute that power to customers.) Some environmentalists, concerned about carbon emissions and climate change, believe that nuclear power is the only realistic way of reducing those emissions enough to halt the damage.
For those and other reasons, nuclear power has not been abandoned. The federal government continues to fund research into new plant designs. In September 2018, the Nuclear Energy Innovation Capabilities Act (NEICA) was signed into law.9 NEICA reduces regulatory costs for nuclear plant developers and provides funding for facili-ties to test new types of reactors. The Nuclear Regulatory Commission (NRC) is proposing new rules designed to streamline siting and licensing requirements as well as address the costs of ensuring that the plants are secure from outside threats. Small modular reactors (SMRs) promise true modular construction, passive safety systems that do not require active intervention by plant operators to shut down a reactor, and lower costs. New research is even examining the potential for micro-scale nuclear plants, with output ranging from 1 to 10 MW, to serve defense installations and remote facilities, such as mining operations in the Arctic.10
Unfortunately, the costs of constructing new plants in the U.S. have, if anything, increased, owing in part to a loss of know-how. Because the building of nuclear plants here has been largely dormant for decades, the expertise of construction companies active in the field in the 1970s and 1980s is mostly gone, requiring new builders to reinvent the wheel. Furthermore, although most experts agree that disposal of spent nuclear fuel is not a technological issue, political opposition has stalled development of a permanent repository for such fuel at
FIGURE 1.
U.S. Electricity Generation, by Source (1960–2018)
Source: EIA, Monthly Energy Review, March 2019
1960 1964 1968 1972 1976 1980 1984 1988 1992 1996 2000 2004 2008 2012 2016
4,500
4,000
3,500
3,000
2,500
2,000
1,500
1,000
500
0
Nuclear All Other Renewables Coal Natural Gas Petroleum Hydroelectric
TWh
7
Yucca Mountain, in Nevada. If the nuclear industry is to survive, the political and environmental opposition to siting a permanent repository must be addressed.
The more difficult policy questions are: (i) whether nuclear power should play a future role in supplying the nation’s electricity; and, if so, (ii) what market and policy changes are needed to reduce construction costs and restore the industry’s economic viability? These questions take on far greater importance in light of some states establishing zero-emissions mandates that will require electrifying their entire economies,11 as well as the recent proposal for a “Green New Deal,” which calls for “net-zero” carbon emissions within 10 years and ultimate abandonment of all fossil-fuel use, among other objectives.12
The short answer is that the goal of supplying the nation with sufficient amounts of zero-emission and reliable electricity cannot be met without nuclear power. The inherent intermittency of wind and solar generation—along with the huge land areas that would be required,13 both for the generating capacity itself and the battery storage needed to “firm up” these resources—makes that goal unrealistic without nuclear, even if wind, solar, and battery technologies continue to improve.14 The costs of providing backup battery storage and acquiring vast tracts to site utility-scale wind and solar generation are simply prohibitive. Thus, barring development and com-mercialization of entirely new emissions-free generation technologies, the nuclear industry must be revived.
But doing so will require overcoming two significant hurdles that have plagued the industry since its inception. First, the cost of new plants must be reduced. The most promising way to do so appears to be adoption of modular construction techniques, in contrast to the one-off designs of most existing U.S. plants. Second, the political roadblocks associated with siting a permanent spent-fuel depository must be removed. The former cannot be accomplished without government subsidies and loan guarantees. The latter likely cannot be accomplished unless the approach to siting a permanent depository is changed.
Reviving the nuclear industry also raises the question of what to do about existing plants, some of which cannot compete in wholesale energy markets. In part, this is due to subsidies provided to wind and solar generation. And, in some cases, it stems from the complexities of how wholesale power markets are designed.15 But it is primarily the result of low-cost natural gas supplies and improvements in gas-fired generation technology. Those improvements have benefited both the environment—because natural gas is cleaner than the coal-fired generation it has primarily replaced—and consumers,
through lower electric prices.
Thus, another key policy question is whether to subsidize existing nuclear plants that are unprofitable. Although economists generally disapprove of operating subsidies because they distort markets and reduce the incentive to innovate, subsidizing existing nuclear plants that are unprofitable is likely to be less costly than replacing those plants with renewable generation. The key is designing the most effective subsidies—namely, those that do not overcompensate existing generators and include incentives to operate efficiently.
The organization of this report is as follows:
• Section I provides a brief history of the nuclear power industry in the U.S.
• Section II examines the industry’s economic decline over the last decade, focusing on the impacts of market distortions, including subsidies for renewable generation.
• Section III looks at today’s economics. Faced with lower natural gas prices, subsidized renewables, and political and environmental opposition, nearly a dozen plants are set to close or are threatened with closure by 2025 while others are scrambling for operating subsidies.
• Section IV considers nuclear power’s future, including whether existing barriers to development can be overcome and what policy and structural changes may be needed to reshape the nation’s electric generating system. Nuclear power’s contribution to the system’s resilience is examined, as are prospects for reducing plant costs.
• Section V offers conclusions and policy recommendations.
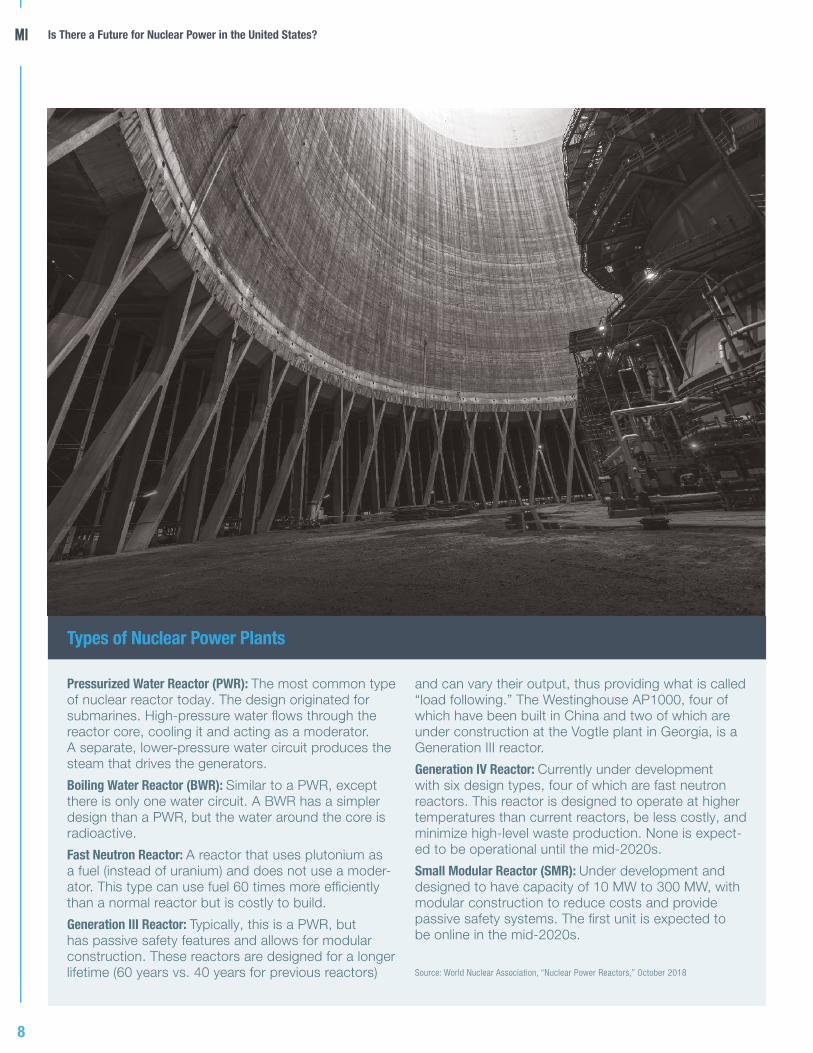
I. A Short History of the U.S. Nuclear Power IndustryThe first commercial nuclear power plant began generating electricity in December 1957 in Shippingport, Pennsylvania.16 (See sidebar, Types of Nuclear Power Plants) Originally intended for a nuclear-powered aircraft carrier, whose construction was vetoed by President Eisenhower, the plant’s 60-MW reactor was instead incorporated
Is There a Future for Nuclear Power in the United States?
8
Pressurized Water Reactor (PWR): The most common type of nuclear reactor today. The design originated for submarines. High-pressure water flows through the reactor core, cooling it and acting as a moderator. A separate, lower-pressure water circuit produces the steam that drives the generators.
Boiling Water Reactor (BWR): Similar to a PWR, except there is only one water circuit. A BWR has a simpler design than a PWR, but the water around the core is radioactive.
Fast Neutron Reactor: A reactor that uses plutonium as a fuel (instead of uranium) and does not use a moder-ator. This type can use fuel 60 times more efficiently than a normal reactor but is costly to build.
Generation III Reactor: Typically, this is a PWR, but has passive safety features and allows for modular construction. These reactors are designed for a longer lifetime (60 years vs. 40 years for previous reactors)
and can vary their output, thus providing what is called “load following.” The Westinghouse AP1000, four of which have been built in China and two of which are under construction at the Vogtle plant in Georgia, is a Generation III reactor.
Generation IV Reactor: Currently under development with six design types, four of which are fast neutron reactors. This reactor is designed to operate at higher temperatures than current reactors, be less costly, and minimize high-level waste production. None is expect-ed to be operational until the mid-2020s.
Small Modular Reactor (SMR): Under development and designed to have capacity of 10 MW to 300 MW, with modular construction to reduce costs and provide passive safety systems. The first unit is expected to be online in the mid-2020s.
Source: World Nuclear Association, “Nuclear Power Reactors,” October 2018
Types of Nuclear Power Plants
9
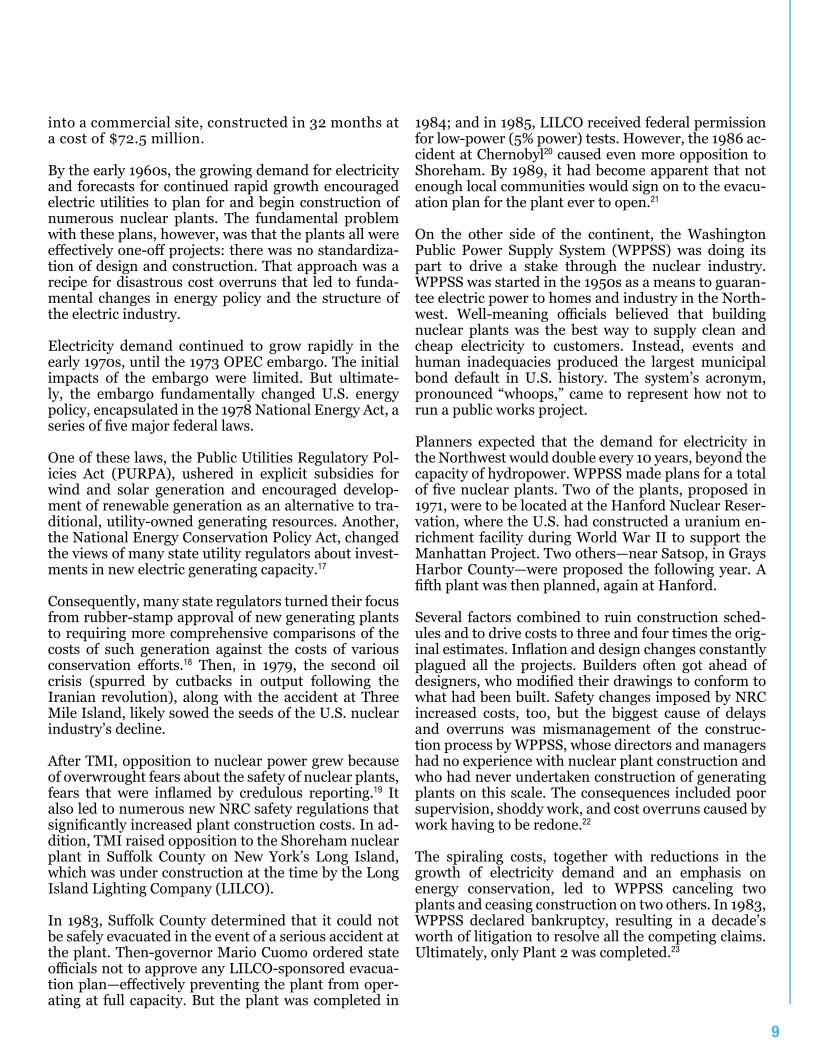
into a commercial site, constructed in 32 months at a cost of $72.5 million. By the early 1960s, the growing demand for electricity and forecasts for continued rapid growth encouraged electric utilities to plan for and begin construction of numerous nuclear plants. The fundamental problem with these plans, however, was that the plants all were effectively one-off projects: there was no standardiza-tion of design and construction. That approach was a recipe for disastrous cost overruns that led to funda-mental changes in energy policy and the structure of the electric industry.
Electricity demand continued to grow rapidly in the early 1970s, until the 1973 OPEC embargo. The initial impacts of the embargo were limited. But ultimate-ly, the embargo fundamentally changed U.S. energy policy, encapsulated in the 1978 National Energy Act, a series of five major federal laws.
One of these laws, the Public Utilities Regulatory Pol-icies Act (PURPA), ushered in explicit subsidies for wind and solar generation and encouraged develop-ment of renewable generation as an alternative to tra-ditional, utility-owned generating resources. Another, the National Energy Conservation Policy Act, changed the views of many state utility regulators about invest-ments in new electric generating capacity.17
Consequently, many state regulators turned their focus from rubber-stamp approval of new generating plants to requiring more comprehensive comparisons of the costs of such generation against the costs of various conservation efforts.18 Then, in 1979, the second oil crisis (spurred by cutbacks in output following the Iranian revolution), along with the accident at Three Mile Island, likely sowed the seeds of the U.S. nuclear industry’s decline.
After TMI, opposition to nuclear power grew because of overwrought fears about the safety of nuclear plants, fears that were inflamed by credulous reporting.19 It also led to numerous new NRC safety regulations that significantly increased plant construction costs. In ad-dition, TMI raised opposition to the Shoreham nuclear plant in Suffolk County on New York’s Long Island, which was under construction at the time by the Long Island Lighting Company (LILCO).
In 1983, Suffolk County determined that it could not be safely evacuated in the event of a serious accident at the plant. Then-governor Mario Cuomo ordered state officials not to approve any LILCO-sponsored evacua-tion plan—effectively preventing the plant from oper-ating at full capacity. But the plant was completed in
1984; and in 1985, LILCO received federal permission for low-power (5% power) tests. However, the 1986 ac-cident at Chernobyl20 caused even more opposition to Shoreham. By 1989, it had become apparent that not enough local communities would sign on to the evacu-ation plan for the plant ever to open.21
On the other side of the continent, the Washington Public Power Supply System (WPPSS) was doing its part to drive a stake through the nuclear industry. WPPSS was started in the 1950s as a means to guaran-tee electric power to homes and industry in the North-west. Well-meaning officials believed that building nuclear plants was the best way to supply clean and cheap electricity to customers. Instead, events and human inadequacies produced the largest municipal bond default in U.S. history. The system’s acronym, pronounced “whoops,” came to represent how not to run a public works project.
Planners expected that the demand for electricity in the Northwest would double every 10 years, beyond the capacity of hydropower. WPPSS made plans for a total of five nuclear plants. Two of the plants, proposed in 1971, were to be located at the Hanford Nuclear Reser-vation, where the U.S. had constructed a uranium en-richment facility during World War II to support the Manhattan Project. Two others—near Satsop, in Grays Harbor County—were proposed the following year. A fifth plant was then planned, again at Hanford.
Several factors combined to ruin construction sched-ules and to drive costs to three and four times the orig-inal estimates. Inflation and design changes constantly plagued all the projects. Builders often got ahead of designers, who modified their drawings to conform to what had been built. Safety changes imposed by NRC increased costs, too, but the biggest cause of delays and overruns was mismanagement of the construc-tion process by WPPSS, whose directors and managers had no experience with nuclear plant construction and who had never undertaken construction of generating plants on this scale. The consequences included poor supervision, shoddy work, and cost overruns caused by work having to be redone.22
The spiraling costs, together with reductions in the growth of electricity demand and an emphasis on energy conservation, led to WPPSS canceling two plants and ceasing construction on two others. In 1983, WPPSS declared bankruptcy, resulting in a decade’s worth of litigation to resolve all the competing claims. Ultimately, only Plant 2 was completed.23
Is There a Future for Nuclear Power in the United States?
10
Electric Industry Restructuring and the Nuclear Industry
In the mid-1990s, efforts began in earnest on the state level to restructure the electric industry. One purpose was to protect ratepayers from the effects of cost over-runs and inefficient operations, including nuclear plants. (See sidebar, Nuclear Plant Construction and “Prudent” Utility Decisions.) Under a tradi-tional cost-of-service (COS) regulatory regime, there is little economic incentive for a utility to improve the ef-ficiency of its operations and reduce costs. The reason is that efficiency improvements that reduce operating costs will be reflected in a reduction in a utility’s COS.
A second purpose of restructuring was to take advan-tage of improvements in generation technologies—specifically, high-efficiency gas-fired generators. Some customer groups, particularly large industrial ones, saw an opportunity in restructuring to avoid respon-sibility for paying the costs of existing, and expensive, generation by purchasing electricity directly from wholesale suppliers.
States pursuing industry restructuring needed to sep-arate their electric utilities’ generation operations, which were generally considered to be competitive, from transmission and distribution functions, which were considered to be natural monopolies. In some cases, states required utilities to spin off generation into separate, unregulated companies. In other cases, states required the utilities to sell their generating assets, including nuclear plants, to the highest bidders.
At the time, many nuclear plants were thought to be unprofitable. Some were operated poorly, resulting in high costs and frequent outages. Others were simply old. Consequently, many nuclear plants were sold off at prices far below their book values (i.e., the remaining undepreciated costs of the plants still carried on util-ities’ books).24 One reason for the low sale prices was expectations that restructuring would lead to lower wholesale electric prices, and hence, lower profitability for these plants.
But after the profit motive was restored to nuclear plant owners, the plants became profitable. Moreover, fore-casts of higher natural gas prices led to expectations of greater profitability. Nuclear plant owners, who had been able to purchase plants at low market prices, also found ways to reduce operating costs and improve plant utilization.25 Some owners began to expand the operating capacity of their plants with what are called “uprates,” as well as file to extend their operating li-censes. Nuclear plant ownership also consolidated to exploit economies of scale. Today, for example, Exelon
Nuclear owns 22 reactors at 13 sites and is the largest owner of nuclear plants in the U.S.26
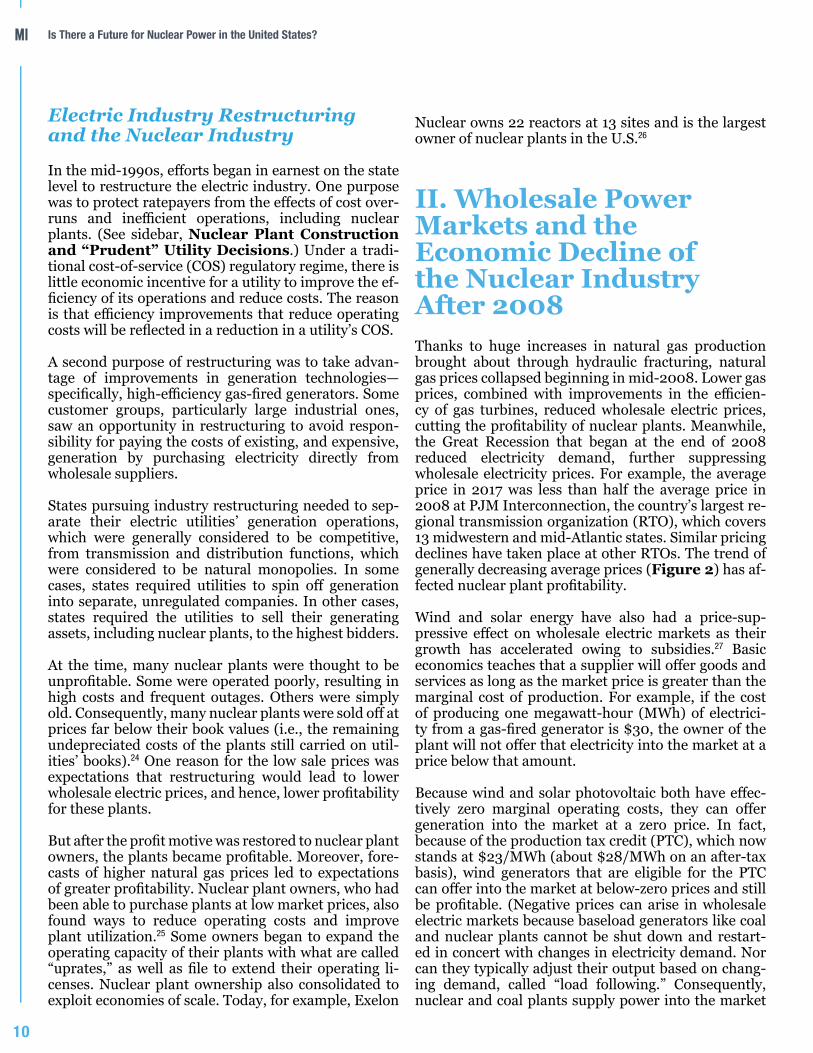
II. Wholesale Power Markets and the Economic Decline of the Nuclear Industry After 2008Thanks to huge increases in natural gas production brought about through hydraulic fracturing, natural gas prices collapsed beginning in mid-2008. Lower gas prices, combined with improvements in the efficien-cy of gas turbines, reduced wholesale electric prices, cutting the profitability of nuclear plants. Meanwhile, the Great Recession that began at the end of 2008 reduced electricity demand, further suppressing wholesale electricity prices. For example, the average price in 2017 was less than half the average price in 2008 at PJM Interconnection, the country’s largest re-gional transmission organization (RTO), which covers 13 midwestern and mid-Atlantic states. Similar pricing declines have taken place at other RTOs. The trend of generally decreasing average prices (Figure 2) has af-fected nuclear plant profitability.
Wind and solar energy have also had a price-sup-pressive effect on wholesale electric markets as their growth has accelerated owing to subsidies.27 Basic economics teaches that a supplier will offer goods and services as long as the market price is greater than the marginal cost of production. For example, if the cost of producing one megawatt-hour (MWh) of electrici-ty from a gas-fired generator is $30, the owner of the plant will not offer that electricity into the market at a price below that amount.
Because wind and solar photovoltaic both have effec-tively zero marginal operating costs, they can offer generation into the market at a zero price. In fact, because of the production tax credit (PTC), which now stands at $23/MWh (about $28/MWh on an after-tax basis), wind generators that are eligible for the PTC can offer into the market at below-zero prices and still be profitable. (Negative prices can arise in wholesale electric markets because baseload generators like coal and nuclear plants cannot be shut down and restart-ed in concert with changes in electricity demand. Nor can they typically adjust their output based on chang-ing demand, called “load following.” Consequently, nuclear and coal plants supply power into the market
11
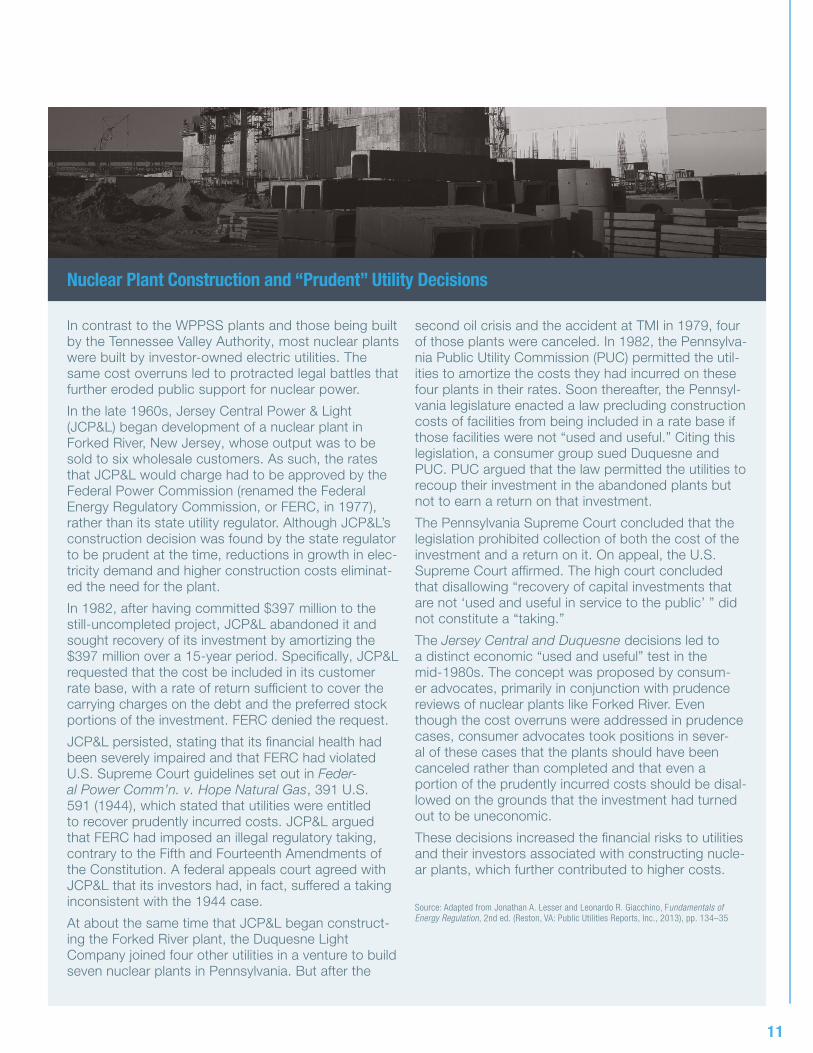
In contrast to the WPPSS plants and those being built by the Tennessee Valley Authority, most nuclear plants were built by investor-owned electric utilities. The same cost overruns led to protracted legal battles that further eroded public support for nuclear power.
In the late 1960s, Jersey Central Power & Light (JCP&L) began development of a nuclear plant in Forked River, New Jersey, whose output was to be sold to six wholesale customers. As such, the rates that JCP&L would charge had to be approved by the Federal Power Commission (renamed the Federal Energy Regulatory Commission, or FERC, in 1977), rather than its state utility regulator. Although JCP&L’s construction decision was found by the state regulator to be prudent at the time, reductions in growth in elec-tricity demand and higher construction costs eliminat-ed the need for the plant.
In 1982, after having committed $397 million to the still-uncompleted project, JCP&L abandoned it and sought recovery of its investment by amortizing the $397 million over a 15-year period. Specifically, JCP&L requested that the cost be included in its customer rate base, with a rate of return sufficient to cover the carrying charges on the debt and the preferred stock portions of the investment. FERC denied the request.
JCP&L persisted, stating that its financial health had been severely impaired and that FERC had violated U.S. Supreme Court guidelines set out in Feder-al Power Comm’n. v. Hope Natural Gas, 391 U.S. 591 (1944), which stated that utilities were entitled to recover prudently incurred costs. JCP&L argued that FERC had imposed an illegal regulatory taking, contrary to the Fifth and Fourteenth Amendments of the Constitution. A federal appeals court agreed with JCP&L that its investors had, in fact, suffered a taking inconsistent with the 1944 case.
At about the same time that JCP&L began construct-ing the Forked River plant, the Duquesne Light Company joined four other utilities in a venture to build seven nuclear plants in Pennsylvania. But after the
second oil crisis and the accident at TMI in 1979, four of those plants were canceled. In 1982, the Pennsylva-nia Public Utility Commission (PUC) permitted the util-ities to amortize the costs they had incurred on these four plants in their rates. Soon thereafter, the Pennsyl-vania legislature enacted a law precluding construction costs of facilities from being included in a rate base if those facilities were not “used and useful.” Citing this legislation, a consumer group sued Duquesne and PUC. PUC argued that the law permitted the utilities to recoup their investment in the abandoned plants but not to earn a return on that investment.
The Pennsylvania Supreme Court concluded that the legislation prohibited collection of both the cost of the investment and a return on it. On appeal, the U.S. Supreme Court affirmed. The high court concluded that disallowing “recovery of capital investments that are not ‘used and useful in service to the public’ ” did not constitute a “taking.”
The Jersey Central and Duquesne decisions led to a distinct economic “used and useful” test in the mid-1980s. The concept was proposed by consum-er advocates, primarily in conjunction with prudence reviews of nuclear plants like Forked River. Even though the cost overruns were addressed in prudence cases, consumer advocates took positions in sever-al of these cases that the plants should have been canceled rather than completed and that even a portion of the prudently incurred costs should be disal-lowed on the grounds that the investment had turned out to be uneconomic.
These decisions increased the financial risks to utilities and their investors associated with constructing nucle-ar plants, which further contributed to higher costs.
Source: Adapted from Jonathan A. Lesser and Leonardo R. Giacchino, Fundamentals of Energy Regulation, 2nd ed. (Reston, VA: Public Utilities Reports, Inc., 2013), pp. 134–35
Nuclear Plant Construction and “Prudent” Utility Decisions
Is There a Future for Nuclear Power in the United States?
12
regardless of market price.) Specifically, wind genera-tors that are eligible for the PTC can generate profit-ably as long as the market-clearing price is greater than about -$28/MWh.28
Although the overall impacts of zero and negative market prices on fossil fuel and nuclear plants have been debated, zero and negative prices have an obvious adverse impact on the profitability of all other genera-tors. When market prices fall below those units’ mar-ginal cost, they must absorb the financial losses.29
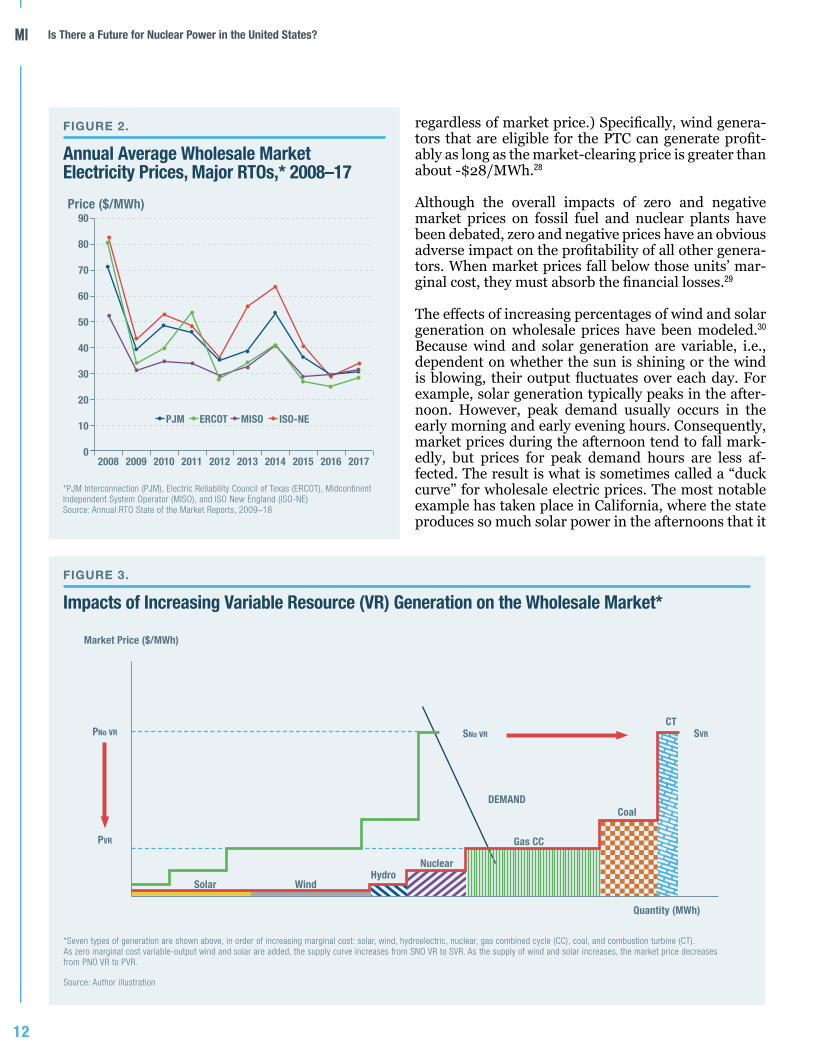
The effects of increasing percentages of wind and solar generation on wholesale prices have been modeled.30
Because wind and solar generation are variable, i.e., dependent on whether the sun is shining or the wind is blowing, their output fluctuates over each day. For example, solar generation typically peaks in the after-noon. However, peak demand usually occurs in the early morning and early evening hours. Consequently, market prices during the afternoon tend to fall mark-edly, but prices for peak demand hours are less af-fected. The result is what is sometimes called a “duck curve” for wholesale electric prices. The most notable example has taken place in California, where the state produces so much solar power in the afternoons that it
FIGURE 2.
Annual Average Wholesale Market Electricity Prices, Major RTOs,* 2008–17
*PJM Interconnection (PJM), Electric Reliability Council of Texas (ERCOT), Midcontinent Independent System Operator (MISO), and ISO New England (ISO-NE) Source: Annual RTO State of the Market Reports, 2009–18
90
80
70
60
50
40
30
20
10
02008 2009 2010 2011 2012 2013 2014 2015 2016 2017
ISO-NEPJM ERCOT MISO
FIGURE 3.
Impacts of Increasing Variable Resource (VR) Generation on the Wholesale Market*
*Seven types of generation are shown above, in order of increasing marginal cost: solar, wind, hydroelectric, nuclear, gas combined cycle (CC), coal, and combustion turbine (CT). As zero marginal cost variable-output wind and solar are added, the supply curve increases from SNO VR to SVR. As the supply of wind and solar increases, the market price decreases from PNO VR to PVR.
Source: Author illustration
Market Price ($/MWh)
Quantity (MWh)
PNo VR
PVR
Solar WindHydro
Nuclear
Gas CC
Coal
CTSVRSNo VR
DEMAND
Price ($/MWh)
13
must often pay neighboring states to take that power.31
In general, as more zero-marginal cost variable re-sources (VR) like wind and solar are added to the market, the more wholesale prices fall (Figure 3).
Taken to the limit, as wind and solar generation make up larger percentages of the wholesale market, at some point that market will start to collapse. The reason stems from the zero-marginal-cost nature of wind and solar. As more and more of those resources are added, market prices will plummet. Eventually, no generating resources will be able to compete. In fact, if the market were 100% wind and solar, market-clearing prices would be zero and the market would collapse entire-ly.32 The wind and solar resources could not themselves remain economically viable without additional out-of-market payments, or a return to some form of cost-based reimbursement similar to reimbursement under traditional COS utility regulation.33
This market dilemma, and the need for out-of-mar-ket payments to ensure that generating resources can remain economically viable, will need to be addressed if nuclear is to have any long-term future in the U.S.34
III. The Economics of the U.S. Nuclear Industry TodayThe 98 reactors at 60 commercially operating nuclear plants35 provided just over 21% of total U.S. electric generation in 2018.36 That percentage has remained relatively constant since 1990, despite the increase in non-hydroelectric renewable generation and natural gas-fired generation, primarily as a result of the de-crease in electricity generated from coal.
The U.S. fleet of nuclear plants is highly efficient. Overall availability (called “capacity factor”) was over 92% in 2018, far higher than any other type of gener-ating resource. Total operating costs for these plants averaged just under $32/MWh—about the same as average fuel costs for coal-fired power plants.37
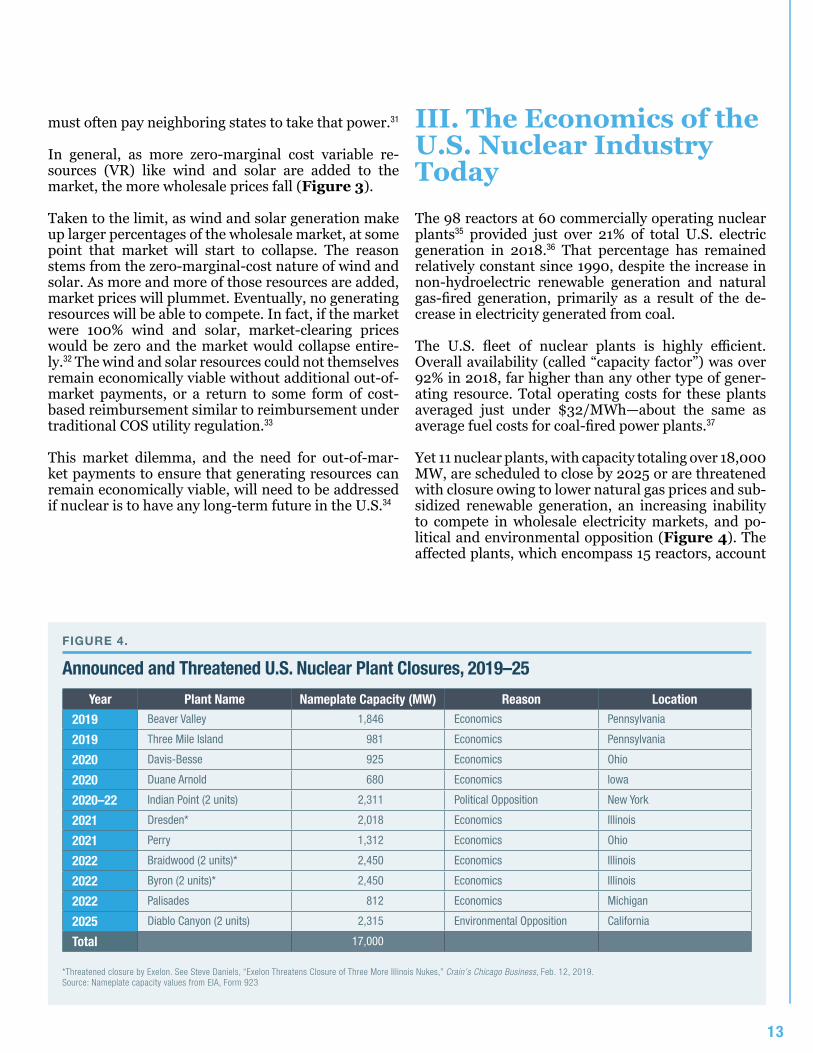
Yet 11 nuclear plants, with capacity totaling over 18,000 MW, are scheduled to close by 2025 or are threatened with closure owing to lower natural gas prices and sub-sidized renewable generation, an increasing inability to compete in wholesale electricity markets, and po-litical and environmental opposition (Figure 4). The affected plants, which encompass 15 reactors, account
FIGURE 4.
Announced and Threatened U.S. Nuclear Plant Closures, 2019–25
Year Plant Name Nameplate Capacity (MW) Reason Location
2019 Beaver Valley 1,846 Economics Pennsylvania
2019 Three Mile Island 981 Economics Pennsylvania
2020 Davis-Besse 925 Economics Ohio
2020 Duane Arnold 680 Economics Iowa
2020–22 Indian Point (2 units) 2,311 Political Opposition New York
2021 Dresden* 2,018 Economics Illinois
2021 Perry 1,312 Economics Ohio
2022 Braidwood (2 units)* 2,450 Economics Illinois
2022 Byron (2 units)* 2,450 Economics Illinois
2022 Palisades 812 Economics Michigan
2025 Diablo Canyon (2 units) 2,315 Environmental Opposition California
Total 17,000
*Threatened closure by Exelon. See Steve Daniels, “Exelon Threatens Closure of Three More Illinois Nukes,” Crain’s Chicago Business, Feb. 12, 2019. Source: Nameplate capacity values from EIA, Form 923
Is There a Future for Nuclear Power in the United States?
14
for about 18% of the country’s entire nuclear capacity.38
In 2018, these plants generated about 124 TWh of elec-tricity every year.39 By contrast, the combined output of all the nation’s wind generation and utility-scale solar PV plants in 2018 was about 340 TWh.40
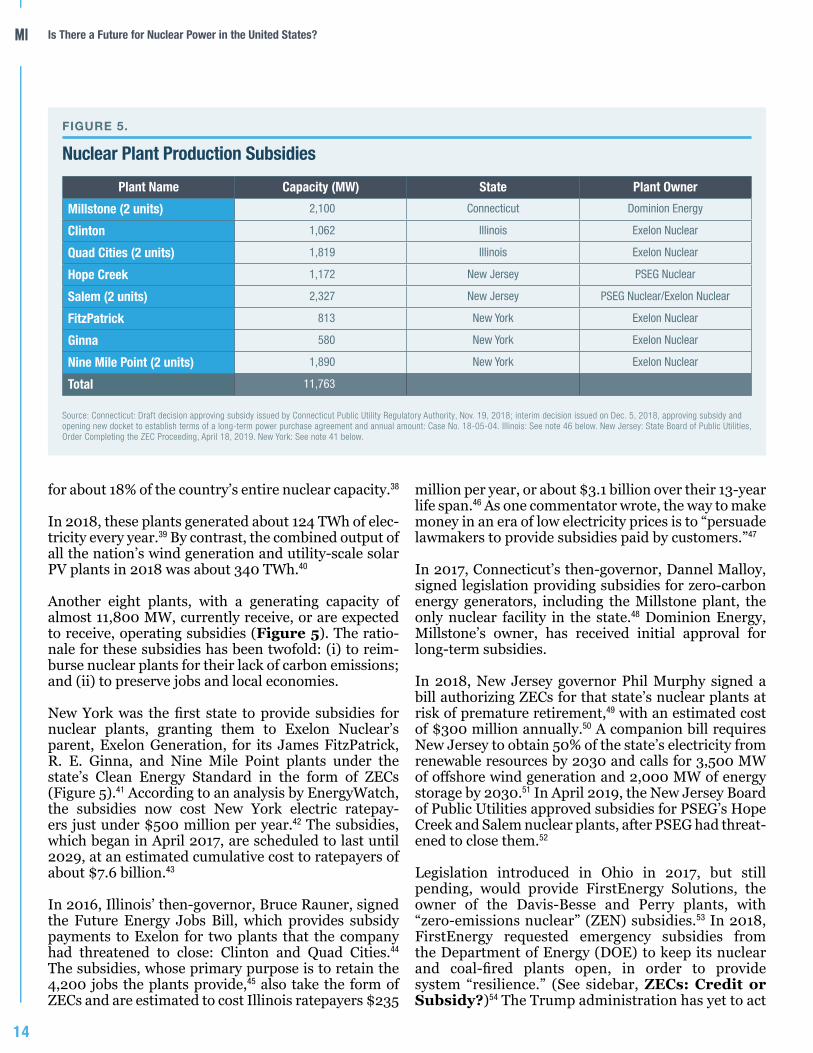
Another eight plants, with a generating capacity of almost 11,800 MW, currently receive, or are expected to receive, operating subsidies (Figure 5). The ratio-nale for these subsidies has been twofold: (i) to reim-burse nuclear plants for their lack of carbon emissions; and (ii) to preserve jobs and local economies.
New York was the first state to provide subsidies for nuclear plants, granting them to Exelon Nuclear’s parent, Exelon Generation, for its James FitzPatrick, R. E. Ginna, and Nine Mile Point plants under the state’s Clean Energy Standard in the form of ZECs (Figure 5).41 According to an analysis by EnergyWatch, the subsidies now cost New York electric ratepay-ers just under $500 million per year.42 The subsidies, which began in April 2017, are scheduled to last until 2029, at an estimated cumulative cost to ratepayers of about $7.6 billion.43
In 2016, Illinois’ then-governor, Bruce Rauner, signed the Future Energy Jobs Bill, which provides subsidy payments to Exelon for two plants that the company had threatened to close: Clinton and Quad Cities.44 The subsidies, whose primary purpose is to retain the 4,200 jobs the plants provide,45 also take the form of ZECs and are estimated to cost Illinois ratepayers $235
million per year, or about $3.1 billion over their 13-year life span.46 As one commentator wrote, the way to make money in an era of low electricity prices is to “persuade lawmakers to provide subsidies paid by customers.”47
In 2017, Connecticut’s then-governor, Dannel Malloy, signed legislation providing subsidies for zero-carbon energy generators, including the Millstone plant, the only nuclear facility in the state.48 Dominion Energy, Millstone’s owner, has received initial approval for long-term subsidies.
In 2018, New Jersey governor Phil Murphy signed a bill authorizing ZECs for that state’s nuclear plants at risk of premature retirement,49 with an estimated cost of $300 million annually.50 A companion bill requires New Jersey to obtain 50% of the state’s electricity from renewable resources by 2030 and calls for 3,500 MW of offshore wind generation and 2,000 MW of energy storage by 2030.51 In April 2019, the New Jersey Board of Public Utilities approved subsidies for PSEG’s Hope Creek and Salem nuclear plants, after PSEG had threat-ened to close them.52
Legislation introduced in Ohio in 2017, but still pending, would provide FirstEnergy Solutions, the owner of the Davis-Besse and Perry plants, with “zero-emissions nuclear” (ZEN) subsidies.53 In 2018, FirstEnergy requested emergency subsidies from the Department of Energy (DOE) to keep its nuclear and coal-fired plants open, in order to provide system “resilience.” (See sidebar, ZECs: Credit or Subsidy?)54 The Trump administration has yet to act
FIGURE 5.
Nuclear Plant Production Subsidies
Plant Name Capacity (MW) State Plant Owner
Millstone (2 units) 2,100 Connecticut Dominion Energy
Clinton 1,062 Illinois Exelon Nuclear
Quad Cities (2 units) 1,819 Illinois Exelon Nuclear
Hope Creek 1,172 New Jersey PSEG Nuclear
Salem (2 units) 2,327 New Jersey PSEG Nuclear/Exelon Nuclear
FitzPatrick 813 New York Exelon Nuclear
Ginna 580 New York Exelon Nuclear
Nine Mile Point (2 units) 1,890 New York Exelon Nuclear
Total 11,763
Source: Connecticut: Draft decision approving subsidy issued by Connecticut Public Utility Regulatory Authority, Nov. 19, 2018; interim decision issued on Dec. 5, 2018, approving subsidy and opening new docket to establish terms of a long-term power purchase agreement and annual amount: Case No. 18-05-04. Illinois: See note 46 below. New Jersey: State Board of Public Utilities, Order Completing the ZEC Proceeding, April 18, 2019. New York: See note 41 below.
15
on the request. FirstEnergy has said that if subsidies aren’t granted by either the state or DOE, the Davis-Besse and Perry plants will be closed in 2020 and 2021, respectively.
Similarly, legislation has been introduced in Pennsyl-vania to subsidize that state’s five nuclear plants. The legislation would add nuclear generation to the state’s Alternative Energy Portfolio Standard.55 According to the legislation’s sponsor, Rep. Tom Mehaffie, the annual cost of the subsidies to ratepayers would be $500 million.56 If this legislation is enacted, about 16,000 MW of U.S. nuclear generating capacity would be subsidized for the foreseeable future.
As more nuclear plants that compete in wholesale power markets are granted subsidies, the incentive in-creases for the remaining plants to obtain them as well, if only to level the playing field. (Nuclear plants owned by vertically integrated electric utilities are compen-sated based on their overall costs under the traditional COS regulatory framework.) As with all subsidies, such compensation is economically inefficient because it produces market distortions. For example, natural gas-fired generators emit less carbon than coal-fired plants to produce a MWh of electricity. Yet gas generators do not (currently) receive credits for less carbon emis-sions. Thus, one can argue that coal-fired generators are receiving an anticompetitive subsidy.
As noted earlier, despite the fact that existing nuclear plants are well run and more cost-efficient than ever,57
economic factors—reduced electricity demand, lower natural gas prices, and, increasingly, subsidies for wind and solar generation—are reducing their prof-itability, with many plants losing money. Moreover, construction of new nuclear plants has been affected by the same cost overruns and construction delays that have confounded the industry since the 1960s. Other issues, especially the need for permanent disposal of spent nuclear fuel, remain politically intractable.
In the near term, therefore, the nuclear industry does not seem capable of any renaissance. Barring an end to renewable-generation subsidies—both federal tax credits and individual state mandates—and to low natural gas prices made possible by hydraulic frac-turing and the resulting increases in gas supplies, wholesale electric prices are unlikely to see significant increases that will bolster the profitability of existing plants that operate in deregulated markets. (Nuclear plants owned by vertically integrated utilities likely will be unaffected.)
Thus, although some nuclear plants will continue to operate profitably, many will not. For example, nuclear
As discussed previously (Figure 5), subsidies have been granted to a number of nuclear plants. Proponents sometimes claim that zero-emissions credits (ZECs) are not subsidies but payments for a currently unpriced environmental attribute: nucle-ar energy’s lack of carbon emissions. It is for this reason that the basis for most ZEC values has been the social cost of carbon (SCC).a The SCC, howev-er, is highly controversial, and estimates of its value are fraught with uncertainty.b
But whether ZECs are a subsidy or a credit is a distinction without any appreciable difference. The federal production tax credit (PTC), which was introduced as part of the Energy Policy Act of 1992, was provided as an incentive to develop renewable generation, primarily wind. Similarly, the investment tax credit (ITC) for solar photovol-taics was enacted to support development of that resource. Neither the PTC nor the ITC was ever tied to any specific environmental attribute.
Unpriced attributes are associated with what economists call “public goods.” Because of a lack of property rights or because they can be consumed by all (called non-exclusive and non-ri-valrous consumption), public goods are insufficient-ly supplied by the market. (A private supplier will not supply a good if it cannot capture the profits from doing so.) For example, clean air is a public good, and my breathing crisp mountain air does not diminish your ability to do the same. On the other hand, because no one “owns” the atmo-sphere, there is an economic incentive to use it as a dumping ground for pollution. Pollution taxes are designed to set a price on the economic damages, as well as loss of economic welfare, that take place as a result.
In the case of ZECs, rather than establish a carbon tax that is applied to all carbon emissions, nucle-ar plants receive a specific payment, ostensibly based on SCC. (As for preserving nuclear plant jobs, which has also been a rationale for provid-ing ZECs—and likely the more politically relevant one—those are not “unpriced” attributes at all. Rather, employment subsidies benefit the few at the expense of everyone else.)
The electric system provides other unpriced—or, at least, incompletely priced—attributes. For example, system reliability—ensuring that there is sufficient electricity to meet demand at all times and that electricity is supplied within specific voltage and frequency limits—is not directly priced because
Continued on next page
ZECs: Credit or Subsidy?
Is There a Future for Nuclear Power in the United States?
16
scientist Geoffrey Haratyk has assessed the profitabili-ty of all 60 U.S. nuclear plants over the 2017–19 period, and estimated that two-thirds of the country’s nuclear capacity would be unprofitable, with average profits ranging between –$29/MWh and +$15/MWh.58 Curi-ously, Haratyk’s estimates projected that the Millstone plant in Connecticut, which the state Public Utility Regulatory Authority has determined is eligible for long-term subsidies, would be the most profitable of all 60 plants. He also estimated that plants operating in regulated markets had far worse profitability outlooks. Yet, few, if any, of those plants are likely to be retired because they do not face any competitive pressures to operate more efficiently.
IV. Looking Ahead: Can the Nuclear Industry Survive?While the U.S. nuclear industry has shrunk, reliance on nuclear power worldwide (along with coal) is increas-ing, and not just in developing nations. In Australia, for example, which contains significant uranium reserves but has no nuclear plants, Prime Minister Scott Mor-
rison has expressed an interest in developing nuclear power to reduce the costs of electricity.59 Those costs have doubled in the past decade in that country because of green energy policies emphasizing wind and solar development—current residential prices average over 31 Australian cents per kilowatt-hour (kWh).60 For its part, the Russian State Atomic Energy Corporation, or Rosatom, is expanding and building plants in a number of countries, including Bangladesh, Egypt, Finland, Hungary, India, and Iran.61
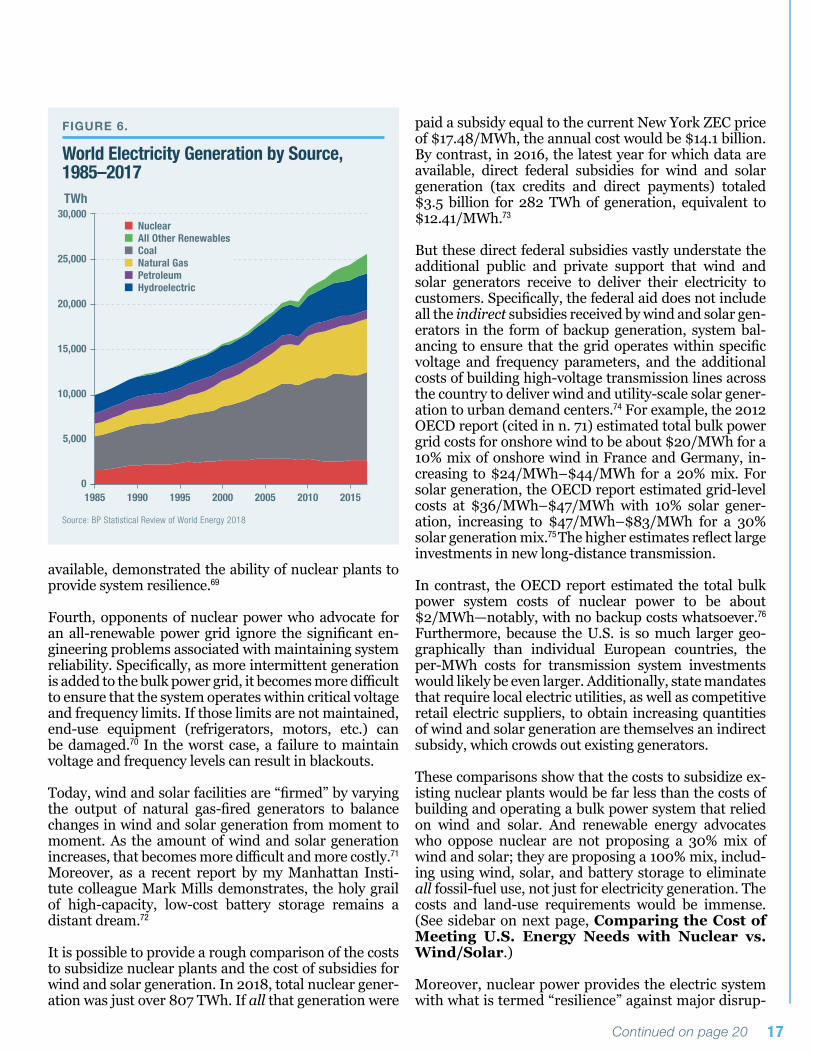
Worldwide, nuclear power accounts for over 10% of all electricity supply (Figure 6).62 By comparison, all non-hydroelectric renewables accounted for 8.5% of world supply in 2017, even with subsidies.
Nuclear power provides clear benefits. First, and per-haps most important, it is emissions-free. Whether or not one believes that carbon emissions are problematic, nuclear power emits no air pollutants, such as sulfur dioxide, oxides of nitrogen, and especially particulates, all of which are believed to cause adverse environmen-tal and health impacts.63
Second, of all commercial generating resources, nuclear has by far the highest power density, which means that it can generate a lot of power from a small footprint.64 For example, the Indian Point Energy Center in Westchester County, New York, sits on about 240 acres and provides 2,060 MW of capacity. That’s equivalent to a power density of over 2,100 watts per square meter (w/M2).65 In contrast, solar and, especially, wind generation have low power densities. Wind generation, for example, even with the largest and most modern turbines, is estimat-ed to have a power density between 0.5 and 1.5 w/M2.66 Thus, meeting U.S. electricity needs with nuclear power will require much less land than wind and solar power, as many politicians have mandated. Yet, a number of states have established goals to supply electricity solely from renewable energy resources by 2050 or earlier.67
Third, electric-grid resilience has been cited by nuclear proponents as one justification for providing subsi-dies to nuclear plants or, as advocates prefer, paying for another unpriced attribute. (See sidebar, “ZECs: Credit or Subsidy?”) One of these aspects relates to “fuel security”—specifically, the potential for disrup-tions to fuel supplies relied on by fossil-fuel generating plants. Because nuclear plants are refueled only every 18 months to two years, they are far less vulnerable to supply disruptions than gas-fired generators, which rely on continuous deliveries from natural gas pipelines, and coal plants, which often rely on deliveries via rail.68 The availability of nuclear generation during “polar vortex” events in the winters of 2014 and 2019, when signifi-cant quantities of fossil-fuel generation were often un-
“reliability” has many attributes and is provided by many types of resources. For example, some electric plants provide “frequency reserves” by allowing the system operator to increase or decrease output as total electricity demand changes from moment to moment. Although generators can be compensated for doing so, it is not clear that the compensation matches consumers’ willingness to pay for reliable electricity supplies.
In principle, it might be desirable to price all separate attributes (airlines attempt to do this, e.g., for differ-ent seating categories); but in practice, it can be a complex and costly undertaking, especially when a good or service consists of multiple attributes and where the value of each attribute is uncertain.
Tying the value of ZECs to SCC is likely wrong because SCC values are themselves arbitrary. Moreover, SCC values are averages worldwide, not marginal values based on specific levels of emis-sions reductions. It is marginal values that determine market prices, not average values.
a For a summary of New York and Illinois ZEC values, see Nuclear Energy Institute, “Zero Emissions Credits,” April 2018.
b See my earlier Manhattan Institute report, “Missing Benefits, Hidden Costs: The Cloudy Numbers in the EPA’s Proposed Clean Power Plan,” June 2016.
17
available, demonstrated the ability of nuclear plants to provide system resilience.69
Fourth, opponents of nuclear power who advocate for an all-renewable power grid ignore the significant en-gineering problems associated with maintaining system reliability. Specifically, as more intermittent generation is added to the bulk power grid, it becomes more difficult to ensure that the system operates within critical voltage and frequency limits. If those limits are not maintained, end-use equipment (refrigerators, motors, etc.) can be damaged.70 In the worst case, a failure to maintain voltage and frequency levels can result in blackouts.
Today, wind and solar facilities are “firmed” by varying the output of natural gas-fired generators to balance changes in wind and solar generation from moment to moment. As the amount of wind and solar generation increases, that becomes more difficult and more costly.71 Moreover, as a recent report by my Manhattan Insti-tute colleague Mark Mills demonstrates, the holy grail of high-capacity, low-cost battery storage remains a distant dream.72
It is possible to provide a rough comparison of the costs to subsidize nuclear plants and the cost of subsidies for wind and solar generation. In 2018, total nuclear gener-ation was just over 807 TWh. If all that generation were
paid a subsidy equal to the current New York ZEC price of $17.48/MWh, the annual cost would be $14.1 billion. By contrast, in 2016, the latest year for which data are available, direct federal subsidies for wind and solar generation (tax credits and direct payments) totaled $3.5 billion for 282 TWh of generation, equivalent to $12.41/MWh.73
But these direct federal subsidies vastly understate the additional public and private support that wind and solar generators receive to deliver their electricity to customers. Specifically, the federal aid does not include all the indirect subsidies received by wind and solar gen-erators in the form of backup generation, system bal-ancing to ensure that the grid operates within specific voltage and frequency parameters, and the additional costs of building high-voltage transmission lines across the country to deliver wind and utility-scale solar gener-ation to urban demand centers.74 For example, the 2012 OECD report (cited in n. 71) estimated total bulk power grid costs for onshore wind to be about $20/MWh for a 10% mix of onshore wind in France and Germany, in-creasing to $24/MWh–$44/MWh for a 20% mix. For solar generation, the OECD report estimated grid-level costs at $36/MWh–$47/MWh with 10% solar gener-ation, increasing to $47/MWh–$83/MWh for a 30% solar generation mix.75 The higher estimates reflect large investments in new long-distance transmission.
In contrast, the OECD report estimated the total bulk power system costs of nuclear power to be about $2/MWh—notably, with no backup costs whatsoever.76 Furthermore, because the U.S. is so much larger geo-graphically than individual European countries, the per-MWh costs for transmission system investments would likely be even larger. Additionally, state mandates that require local electric utilities, as well as competitive retail electric suppliers, to obtain increasing quantities of wind and solar generation are themselves an indirect subsidy, which crowds out existing generators.
These comparisons show that the costs to subsidize ex-isting nuclear plants would be far less than the costs of building and operating a bulk power system that relied on wind and solar. And renewable energy advocates who oppose nuclear are not proposing a 30% mix of wind and solar; they are proposing a 100% mix, includ-ing using wind, solar, and battery storage to eliminate all fossil-fuel use, not just for electricity generation. The costs and land-use requirements would be immense. (See sidebar on next page, Comparing the Cost of Meeting U.S. Energy Needs with Nuclear vs. Wind/Solar.)
Moreover, nuclear power provides the electric system with what is termed “resilience” against major disrup-
FIGURE 6.
World Electricity Generation by Source, 1985–2017
Source: BP Statistical Review of World Energy 2018
1985 1990 1995 2000 2005 2010 2015
Nuclear All Other Renewables Coal Natural Gas Petroleum Hydroelectric
Continued on page 20
30,000
25,000
20,000
15,000
10,000
5,000
0
TWh
Is There a Future for Nuclear Power in the United States?
18
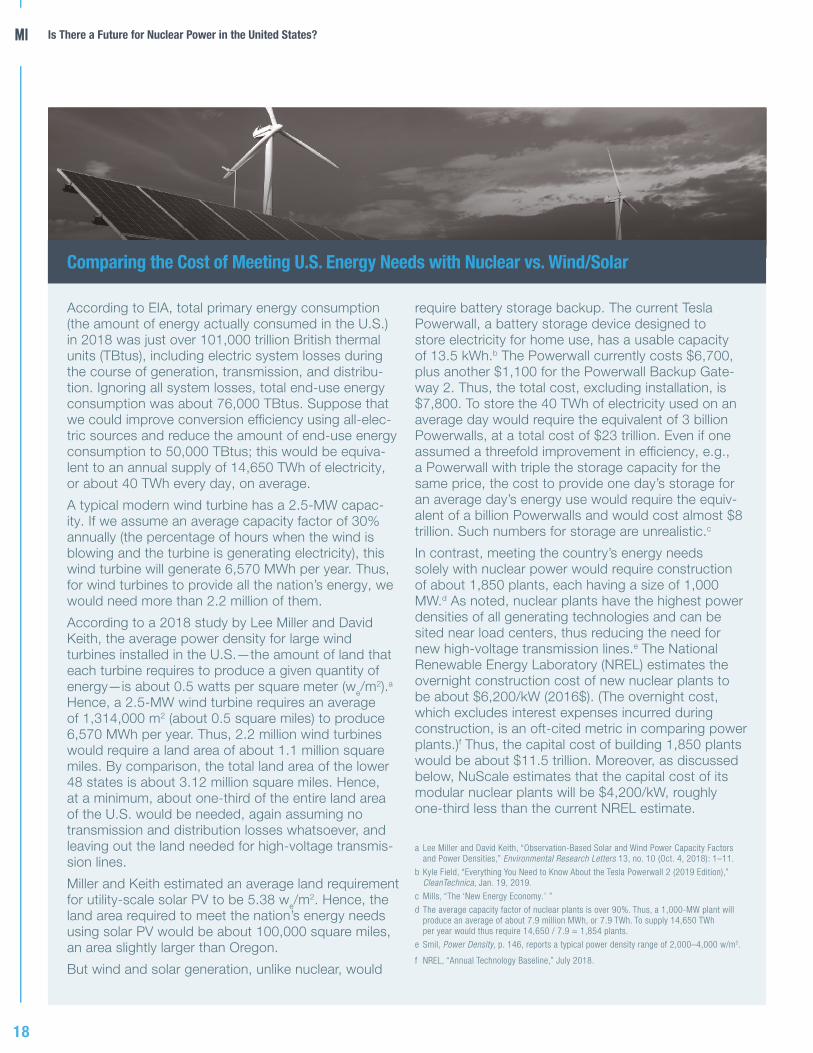
According to EIA, total primary energy consumption (the amount of energy actually consumed in the U.S.) in 2018 was just over 101,000 trillion British thermal units (TBtus), including electric system losses during the course of generation, transmission, and distribu-tion. Ignoring all system losses, total end-use energy consumption was about 76,000 TBtus. Suppose that we could improve conversion efficiency using all-elec-tric sources and reduce the amount of end-use energy consumption to 50,000 TBtus; this would be equiva-lent to an annual supply of 14,650 TWh of electricity, or about 40 TWh every day, on average.
A typical modern wind turbine has a 2.5-MW capac-ity. If we assume an average capacity factor of 30% annually (the percentage of hours when the wind is blowing and the turbine is generating electricity), this wind turbine will generate 6,570 MWh per year. Thus, for wind turbines to provide all the nation’s energy, we would need more than 2.2 million of them.
According to a 2018 study by Lee Miller and David Keith, the average power density for large wind turbines installed in the U.S.—the amount of land that each turbine requires to produce a given quantity of energy—is about 0.5 watts per square meter (we/m
2).a Hence, a 2.5-MW wind turbine requires an average of 1,314,000 m2 (about 0.5 square miles) to produce 6,570 MWh per year. Thus, 2.2 million wind turbines would require a land area of about 1.1 million square miles. By comparison, the total land area of the lower 48 states is about 3.12 million square miles. Hence, at a minimum, about one-third of the entire land area of the U.S. would be needed, again assuming no transmission and distribution losses whatsoever, and leaving out the land needed for high-voltage transmis-sion lines.
Miller and Keith estimated an average land requirement for utility-scale solar PV to be 5.38 we/m
2. Hence, the land area required to meet the nation’s energy needs using solar PV would be about 100,000 square miles, an area slightly larger than Oregon.
But wind and solar generation, unlike nuclear, would
require battery storage backup. The current Tesla Powerwall, a battery storage device designed to store electricity for home use, has a usable capacity of 13.5 kWh.b The Powerwall currently costs $6,700, plus another $1,100 for the Powerwall Backup Gate-way 2. Thus, the total cost, excluding installation, is $7,800. To store the 40 TWh of electricity used on an average day would require the equivalent of 3 billion Powerwalls, at a total cost of $23 trillion. Even if one assumed a threefold improvement in efficiency, e.g., a Powerwall with triple the storage capacity for the same price, the cost to provide one day’s storage for an average day’s energy use would require the equiv-alent of a billion Powerwalls and would cost almost $8 trillion. Such numbers for storage are unrealistic.c
In contrast, meeting the country’s energy needs solely with nuclear power would require construction of about 1,850 plants, each having a size of 1,000 MW.d As noted, nuclear plants have the highest power densities of all generating technologies and can be sited near load centers, thus reducing the need for new high-voltage transmission lines.e The National Renewable Energy Laboratory (NREL) estimates the overnight construction cost of new nuclear plants to be about $6,200/kW (2016$). (The overnight cost, which excludes interest expenses incurred during construction, is an oft-cited metric in comparing power plants.)f Thus, the capital cost of building 1,850 plants would be about $11.5 trillion. Moreover, as discussed below, NuScale estimates that the capital cost of its modular nuclear plants will be $4,200/kW, roughly one-third less than the current NREL estimate.
a Lee Miller and David Keith, “Observation-Based Solar and Wind Power Capacity Factors
and Power Densities,” Environmental Research Letters 13, no. 10 (Oct. 4, 2018): 1–11.
b Kyle Field, “Everything You Need to Know About the Tesla Powerwall 2 (2019 Edition),” CleanTechnica, Jan. 19, 2019.
c Mills, “The ‘New Energy Economy.’ ”
d The average capacity factor of nuclear plants is over 90%. Thus, a 1,000-MW plant will produce an average of about 7.9 million MWh, or 7.9 TWh. To supply 14,650 TWh per year would thus require 14,650 / 7.9 = 1,854 plants.
e Smil, Power Density, p. 146, reports a typical power density range of 2,000–4,000 w/m2.
f NREL, “Annual Technology Baseline,” July 2018.
Comparing the Cost of Meeting U.S. Energy Needs with Nuclear vs. Wind/Solar
19
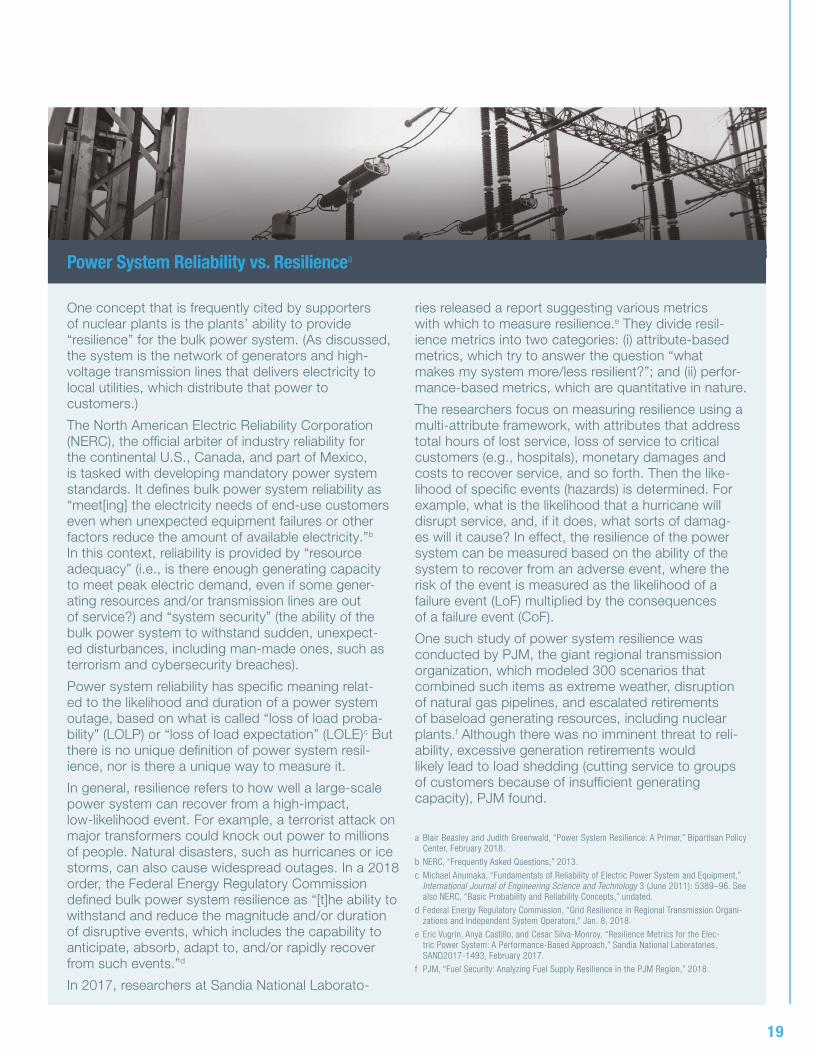
One concept that is frequently cited by supporters of nuclear plants is the plants’ ability to provide “resilience” for the bulk power system. (As discussed, the system is the network of generators and high-voltage transmission lines that delivers electricity to local utilities, which distribute that power to customers.)
The North American Electric Reliability Corporation (NERC), the official arbiter of industry reliability for the continental U.S., Canada, and part of Mexico, is tasked with developing mandatory power system standards. It defines bulk power system reliability as “meet[ing] the electricity needs of end-use customers even when unexpected equipment failures or other factors reduce the amount of available electricity.”b In this context, reliability is provided by “resource adequacy” (i.e., is there enough generating capacity to meet peak electric demand, even if some gener-ating resources and/or transmission lines are out of service?) and “system security” (the ability of the bulk power system to withstand sudden, unexpect-ed disturbances, including man-made ones, such as terrorism and cybersecurity breaches).
Power system reliability has specific meaning relat-ed to the likelihood and duration of a power system outage, based on what is called “loss of load proba-bility” (LOLP) or “loss of load expectation” (LOLE)c But there is no unique definition of power system resil-ience, nor is there a unique way to measure it.
In general, resilience refers to how well a large-scale power system can recover from a high-impact, low-likelihood event. For example, a terrorist attack on major transformers could knock out power to millions of people. Natural disasters, such as hurricanes or ice storms, can also cause widespread outages. In a 2018 order, the Federal Energy Regulatory Commission defined bulk power system resilience as “[t]he ability to withstand and reduce the magnitude and/or duration of disruptive events, which includes the capability to anticipate, absorb, adapt to, and/or rapidly recover from such events.”d
In 2017, researchers at Sandia National Laborato-
ries released a report suggesting various metrics with which to measure resilience.e They divide resil-ience metrics into two categories: (i) attribute-based metrics, which try to answer the question “what makes my system more/less resilient?”; and (ii) perfor-mance-based metrics, which are quantitative in nature.
The researchers focus on measuring resilience using a multi-attribute framework, with attributes that address total hours of lost service, loss of service to critical customers (e.g., hospitals), monetary damages and costs to recover service, and so forth. Then the like-lihood of specific events (hazards) is determined. For example, what is the likelihood that a hurricane will disrupt service, and, if it does, what sorts of damag-es will it cause? In effect, the resilience of the power system can be measured based on the ability of the system to recover from an adverse event, where the risk of the event is measured as the likelihood of a failure event (LoF) multiplied by the consequences of a failure event (CoF).
One such study of power system resilience was conducted by PJM, the giant regional transmission organization, which modeled 300 scenarios that combined such items as extreme weather, disruption of natural gas pipelines, and escalated retirements of baseload generating resources, including nuclear plants.f Although there was no imminent threat to reli-ability, excessive generation retirements would likely lead to load shedding (cutting service to groups of customers because of insufficient generating capacity), PJM found.
a Blair Beasley and Judith Greenwald, “Power System Resilience: A Primer,” Bipartisan Policy Center, February 2018.
b NERC, “Frequently Asked Questions,” 2013.
c Michael Anumaka, “Fundamentals of Reliability of Electric Power System and Equipment,” International Journal of Engineering Science and Technology 3 (June 2011): 5389–96. See also NERC, “Basic Probability and Reliability Concepts,” undated.
d Federal Energy Regulatory Commission, “Grid Resilience in Regional Transmission Organi-zations and Independent System Operators,” Jan. 8, 2018.
e Eric Vugrin, Anya Castillo, and Cesar Silva-Monroy, “Resilience Metrics for the Elec-tric Power System: A Performance-Based Approach,” Sandia National Laboratories, SAND2017-1493, February 2017.
f PJM, “Fuel Security: Analyzing Fuel Supply Resilience in the PJM Region,” 2018.
Power System Reliability vs. Resiliencea
Is There a Future for Nuclear Power in the United States?
20
tions. (See sidebar, Power System Reliability vs. Resilience.) For example, in January 2019, a polar vortex led to extremely cold weather in the Midwest and mid-Atlantic. The cold weather caused some coal plants to shut down because of frozen coal piles. Some natural gas generation was disrupted because of insuf-ficient pipeline capacity. Service at only one nuclear plant—Salem, in New Jersey—was disrupted, because of ice.77
Thus, from the standpoint of the benefits it provides, nuclear power is worth saving. Weighing against these benefits are high costs. Unless it can overcome its history of cost overruns and construction delays, the prospects for a thriving nuclear industry will be bleak.
The other issue most often raised by critics of nuclear power is permanent storage and disposal of spent fuel. For nuclear power to remain a viable energy technol-ogy, this issue must be addressed. In fact, 14 states, including many with nuclear plants currently oper-ating or retired, have prohibitions or restrictions on construction of new plants until a permanent reposi-tory for high-level waste has been identified.78 Minne-sota, for example, has an outright ban on new plant construction. Ironically, in states with nuclear plants, spent nuclear fuel is stored at the plants, initially in spent-fuel pools and then in dry casks.
Fortunately, as a number of studies have discussed, disposing of spent nuclear fuel is not a technological issue.79 Rather, it is a political one. Spent fuel, which remains radioactive for thousands of years, can be dis-posed of safely. Finland has taken the lead on the issue and is constructing a permanent underground depos-itory. The project has been supported by the govern-ment and, most important, by the local community.80
France, which relies on nuclear power for three-fourths of its electricity, has yet to develop a permanent under-ground depository, owing to opposition to siting such a facility. However, unlike the U.S., France reprocess-es spent nuclear fuel,81 which creates additional usable fuel, and puts the remaining nuclear waste in tempo-rary storage facilities.82
In its most recent budget plan, the Trump administra-tion has proposed to restart Yucca Mountain, the site that was designated by Congress in 1987 as a perma-nent repository in Nevada.83 However, the efforts to restart work are opposed by Nevada’s two senators and Democratic congressional leaders.84 Thus, efforts to develop a permanent repository, whether at Yucca Mountain or elsewhere, are sure to be opposed bitterly.
It seems that the only way the U.S. is likely to solve this political issue is to follow Finland’s approach, which
was to identify locations that are geologically suited and then discuss a repository with the local populace, who may view it as a booster for their economy. For example, the Waste Isolation Pilot Project (WIPP), which stores mid-level nuclear waste and is located just south of Carlsbad, New Mexico, is strongly sup-ported by the local community because of its economic benefits.85
Prospects for Reducing Nuclear Plant Costs
The primary cause of cost overruns in the past has been the lack of standardization in design and construction. Plants built in the 1960s through the 1980s became, in effect, one-off designs owing to changing design re-quirements. More recently, efforts to build new reac-tors, such as the two units being added to the Southern Company’s Vogtle plant and the SCANA Corporation’s now-abandoned Santee Cooper facility, have been hampered by a lack of manufacturing and construction expertise.86 The knowledge gained from building plants decades ago effectively was “lost” over time. Thus, in addition to design standardization, manufacturing and construction expertise must be regained.
The major effort toward standardization is the devel-opment of small modular reactors (SMRs). Current-ly, the most advanced SMR design is one developed by NuScale. The NuScale reactor is now undergoing design certification review by the Nuclear Regulato-ry Commission.87 That certification is expected to be completed in August 2020. The NuScale SMR houses a reactor, steam generator, and pressurizer in a single container, which is 76 feet long and 15 feet wide and weighs 700 tons.88 The pressurized water reactor (PWR) design has fully passive safety systems, preclud-ing the need for active intervention to shut the reactor down. This means, the designers say, that there can be no core meltdowns, such as those that took place at the TMI plant and at Fukushima Daiichi.89 The idea is to manufacture these units and transport them to the sites where they will be installed.90
The first NuScale SMRs are slated to be installed at the Idaho National Laboratory in Idaho Falls and to be op-erational by 2026.91 The plant will be owned by the Utah Associated Municipal Power Systems and operated by Energy Northwest, which runs the Columbia Nuclear Generating Station near Richland, Washington (the former WPPSS 2 plant). The new plant will consist of 12 60-MW NuScale SMRs. The current projected cost of the plant is about $3 billion, or about $4,200/kW.92
21
At this time, SMRs appear to be the best hope for a nuclear renaissance.93 But given the past history of nuclear power, one would be forgiven for doubting that the Idaho plant’s cost will come in anywhere close to the $3 billion estimate. A higher actual cost will not be surprising because, although the NuScale plant is supposed to reduce costs owing to its modular design, the plant will still be the first one built, and first-mov-er manufacturing costs are almost always higher than forecast because of unanticipated complexities.
If SMR technology can deliver on its promise of lower costs, the prospects for the economic viability of nuclear power will improve. Even so, private-sector investment in nuclear plants entails huge financial risk. The current structure of wholesale power markets in the U.S. discourages such “bet-the-company” in-vestments. (Consider what happened to SCANA: one reason that the company was recently purchased by Dominion Energy was that cost overruns at SCANA’s ill-fated Santee Cooper project and the diminishing prospects for recovering those costs from ratepayers had cratered its stock price.) If the nuclear industry is to survive, it will likely continue to require subsidies, at least for the next decade or so.
A comprehensive MIT study proposes a half-dozen ways to address concerns about cost overruns. The recommendations are: (1) using proven construc-tion management practices to increase the likelihood of success, including the use of manufacturers with a solid supply chain and skilled workers; (2) employ-ing modular construction techniques; (3) employing passive safety designs; (4) creating a level playing field to allow all low-carbon technologies, including nuclear, to compete on their own merits; (5) identifying govern-ment-approved sites where companies can build test reactors; and (6) initiating government-funded pro-grams to share regulatory licensing costs, along with research and development costs, and also to share pro-duction credits to reward successful demonstrations of new designs.94
The first three recommendations recognize that, as dis-cussed previously, the primary causes of nuclear plant cost overruns stem from complex one-off designs, built on-site, by companies that lack the expertise and expe-rience to construct such plants. Providing sites where test reactors can be built and evaluated is also import-ant, much as building prototypes of products can iden-tify design and manufacturing problems at an early stage, rather than in the middle of constructing a com-mercial facility.
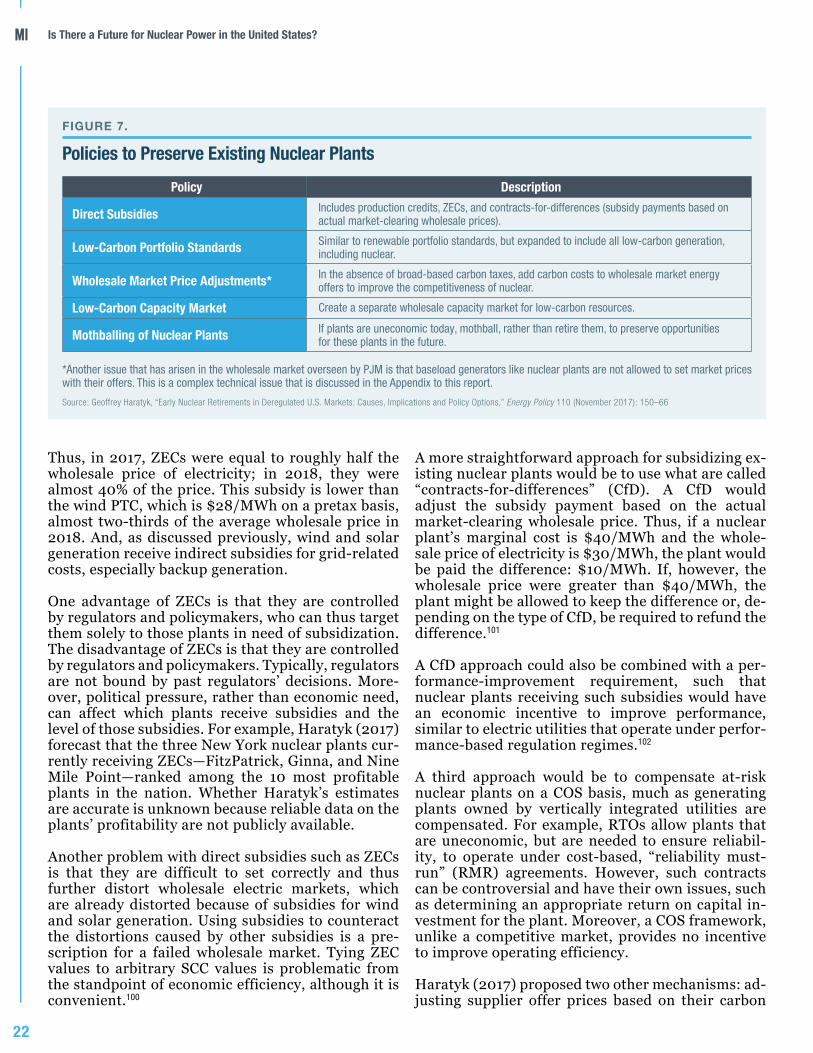
A level playing field for all low-carbon technologies, rather than the current hodgepodge of state and federal
policies and renewable energy tax credits, would improve the ability of nuclear power to be cost-com-petitive. However, it would not solve the fundamental problems facing wholesale electric markets created by growing quantities of renewable resources with zero marginal cost. Moreover, as discussed below, despite various claims that broad-based carbon taxes would either not harm or even benefit the U.S. economy, such taxes likely would have significant adverse impacts on the economy, would not “solve” the climate change issue at all, and would disproportionately harm low-er-income Americans and those living in rural areas.
As for government subsidies and tax credits, such policy instruments that are designed to be temporary are extremely difficult to end. The production tax credit (PTC), for example, was initially designed to assist re-newable energy development (primarily wind gener-ators), improve technology, and reduce costs. Today, more than a quarter-century later, there is no econom-ic rationale for continuing such credits. PTC has been slated to expire before, only to be resurrected by Con-gress.95
Evaluating Policy Alternatives to Preserve Existing Nuclear Power
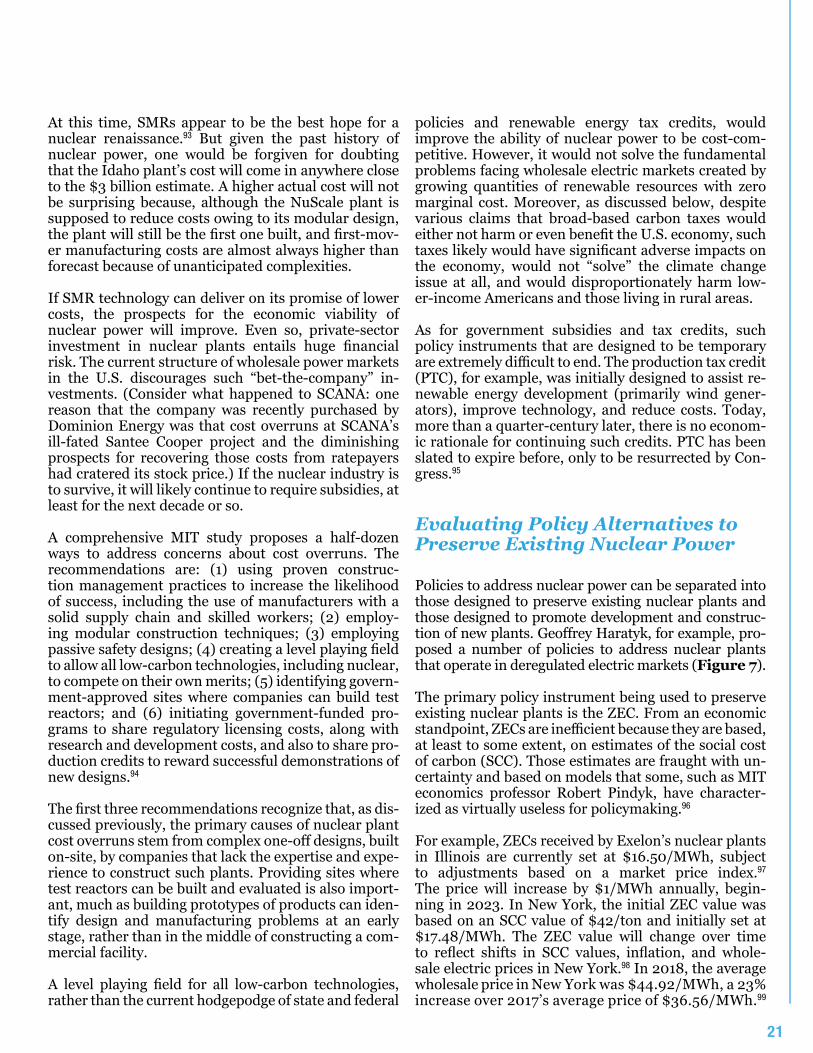
Policies to address nuclear power can be separated into those designed to preserve existing nuclear plants and those designed to promote development and construc-tion of new plants. Geoffrey Haratyk, for example, pro-posed a number of policies to address nuclear plants that operate in deregulated electric markets (Figure 7).
The primary policy instrument being used to preserve existing nuclear plants is the ZEC. From an economic standpoint, ZECs are inefficient because they are based, at least to some extent, on estimates of the social cost of carbon (SCC). Those estimates are fraught with un-certainty and based on models that some, such as MIT economics professor Robert Pindyk, have character-ized as virtually useless for policymaking.96
For example, ZECs received by Exelon’s nuclear plants in Illinois are currently set at $16.50/MWh, subject to adjustments based on a market price index.97 The price will increase by $1/MWh annually, begin-ning in 2023. In New York, the initial ZEC value was based on an SCC value of $42/ton and initially set at $17.48/MWh. The ZEC value will change over time to reflect shifts in SCC values, inflation, and whole-sale electric prices in New York.98 In 2018, the average wholesale price in New York was $44.92/MWh, a 23% increase over 2017’s average price of $36.56/MWh.99
Is There a Future for Nuclear Power in the United States?
22
Thus, in 2017, ZECs were equal to roughly half the wholesale price of electricity; in 2018, they were almost 40% of the price. This subsidy is lower than the wind PTC, which is $28/MWh on a pretax basis, almost two-thirds of the average wholesale price in 2018. And, as discussed previously, wind and solar generation receive indirect subsidies for grid-related costs, especially backup generation.
One advantage of ZECs is that they are controlled by regulators and policymakers, who can thus target them solely to those plants in need of subsidization. The disadvantage of ZECs is that they are controlled by regulators and policymakers. Typically, regulators are not bound by past regulators’ decisions. More-over, political pressure, rather than economic need, can affect which plants receive subsidies and the level of those subsidies. For example, Haratyk (2017) forecast that the three New York nuclear plants cur-rently receiving ZECs—FitzPatrick, Ginna, and Nine Mile Point—ranked among the 10 most profitable plants in the nation. Whether Haratyk’s estimates are accurate is unknown because reliable data on the plants’ profitability are not publicly available.
Another problem with direct subsidies such as ZECs is that they are difficult to set correctly and thus further distort wholesale electric markets, which are already distorted because of subsidies for wind and solar generation. Using subsidies to counteract the distortions caused by other subsidies is a pre-scription for a failed wholesale market. Tying ZEC values to arbitrary SCC values is problematic from the standpoint of economic efficiency, although it is convenient.100
A more straightforward approach for subsidizing ex-isting nuclear plants would be to use what are called “contracts-for-differences” (CfD). A CfD would adjust the subsidy payment based on the actual market-clearing wholesale price. Thus, if a nuclear plant’s marginal cost is $40/MWh and the whole-sale price of electricity is $30/MWh, the plant would be paid the difference: $10/MWh. If, however, the wholesale price were greater than $40/MWh, the plant might be allowed to keep the difference or, de-pending on the type of CfD, be required to refund the difference.101
A CfD approach could also be combined with a per-formance-improvement requirement, such that nuclear plants receiving such subsidies would have an economic incentive to improve performance, similar to electric utilities that operate under perfor-mance-based regulation regimes.102
A third approach would be to compensate at-risk nuclear plants on a COS basis, much as generating plants owned by vertically integrated utilities are compensated. For example, RTOs allow plants that are uneconomic, but are needed to ensure reliabil-ity, to operate under cost-based, “reliability must-run” (RMR) agreements. However, such contracts can be controversial and have their own issues, such as determining an appropriate return on capital in-vestment for the plant. Moreover, a COS framework, unlike a competitive market, provides no incentive to improve operating efficiency.
Haratyk (2017) proposed two other mechanisms: ad-justing supplier offer prices based on their carbon
FIGURE 7.
Policies to Preserve Existing Nuclear Plants
Policy Description
Direct Subsidies Includes production credits, ZECs, and contracts-for-differences (subsidy payments based on actual market-clearing wholesale prices).
Low-Carbon Portfolio Standards Similar to renewable portfolio standards, but expanded to include all low-carbon generation, including nuclear.
Wholesale Market Price Adjustments* In the absence of broad-based carbon taxes, add carbon costs to wholesale market energy offers to improve the competitiveness of nuclear.
Low-Carbon Capacity Market Create a separate wholesale capacity market for low-carbon resources.
Mothballing of Nuclear Plants If plants are uneconomic today, mothball, rather than retire them, to preserve opportunities for these plants in the future.
*Another issue that has arisen in the wholesale market overseen by PJM is that baseload generators like nuclear plants are not allowed to set market prices with their offers. This is a complex technical issue that is discussed in the Appendix to this report.
Source: Geoffrey Haratyk, “Early Nuclear Retirements in Deregulated U.S. Markets: Causes, Implications and Policy Options,” Energy Policy 110 (November 2017): 150–66
23
emissions; and creating a separate, low-carbon ca-pacity market.
There are several problems with the former. First, as discussed, it requires establishing a price on carbon, which may be arbitrary and have little to do with the actual external costs of carbon emissions. Second, adding a carbon price to supplier offers does nothing to address the market distortions created by sub-sidized wind and solar plants. Third, it will lead to higher electric prices that harm consumers, especially if the additional electricity costs paid by consumers exceeds the amount of the subsidy required by plants to be made whole.
As for a low-carbon capacity mechanism, its implemen-tation would be fraught with complexities and subject to debate. Since they were first introduced in the mid-2000s, electric capacity markets have been controver-sial and frequently changed. Adding yet another layer of complexity to these markets is unlikely to enhance their function. Arbitrarily limiting a capacity market to “low-carbon” resources—especially when wind and solar generation are inherently intermittent—is unlike-ly to succeed. And, as Haratyk notes, if such a mech-anism accelerated retirements of fossil-fuel resources, especially peaking units, system reliability could be compromised, which likely would require more out-of-market RMR contracts.
Finally, policymakers could impose broad-based carbon taxes or carbon cap-and-trade systems. Al-though such mechanisms would avoid the additional distortions to wholesale electric markets caused by ZECs, unilaterally imposing a carbon tax in the U.S. would raise prices on almost all goods and services and reduce economic growth. Even a “revenue-neutral” carbon tax would likely have adverse consequences, es-pecially on lower-income consumers and those living and working in rural areas.103 Moreover, a unilaterally imposed carbon tax would have no measurable impact
on world climate.104 And there is no assurance that a given carbon tax would “save” existing nuclear plants.
Evaluating Policy Alternatives to Encourage New Nuclear Plants
New nuclear plant development and construction in the U.S. likely will occur only with government assis-tance and changes in regulatory frameworks suggested in Figure 8. Government assistance can take the form of production and investment tax credits for nuclear plants, similar to those for renewable generation. It can also take the form of loan guarantees.
However, direct government assistance will do nothing to reduce cost overruns. In fact, it can reduce the in-centive to avoid them. As is well known to economists, providing direct subsidies reduces the incentive to lower costs and improve competitiveness, including through technological innovation.
It is doubtful that any new large nuclear plants will be built without government loan guarantees, even for plants proposed by vertically integrated and regulated electric utilities.105 The financial risks simply are too great for private investors.
The “bet-the-company” risks of large nuclear plants thus favor development of SMRs. If SMR costs can be controlled effectively and if manufacturing and con-struction expertise to build these plants can be devel-oped, then SMRs are likely to be the most promising nuclear path. SMR technologies therefore should be encouraged and supported.
Finally, it may be possible to develop new regulatory frameworks for building and operating nuclear plants that combine cost guarantees with performance in-centives. Some electric utilities already operate under
FIGURE 8.
Policies to Promote Development of New Nuclear Plants
Policy Description
Direct Subsidies Includes investment tax credits to reduce construction costs and PTCs to encourage development.
Government Loan Guarantees Because nuclear plant projects can become “bet-the-company” efforts, provide government loan guarantees for construction.
New Regulatory Framework For vertically integrated utilities, create shared-savings approaches that reward improvements in plant efficiency.
Is There a Future for Nuclear Power in the United States?
24
performance-based regulatory regimes (PBR), which allow those utilities to capture a portion of cost savings for their shareholders.
A similar approach could be applied to nuclear plant construction and operation. For example, a combina-tion of loan guarantees and backstop cost guarantees would allow the government to reduce, but not elim-inate, financial risks to investors. This could then be coupled with a regulatory regime that provided an eco-nomic incentive for reduced costs and improved oper-ations.
Nuclear Power and Electrification Policies
Several states, notably New York and California, have proposed to eliminate fossil-fuel use by electrifying their economies. This would entail replacing inter-nal combustion vehicles with electric vehicles, swap-ping out oil for natural gas furnaces, and so forth. The “Green New Deal” proposes to do the same for the entire country.
Regardless of the merits or economic reality of these proposals, such mandates will greatly increase the demand for electricity. In New York, for example, elec-tricity accounts for only about one-seventh of total end-use energy consumption.106
Meeting this increased demand for electricity by relying solely on wind and solar resources with low power densities is unrealistic. The land requirements would be staggering. It would require huge invest-ments in high-voltage transmission lines that criss-cross the country delivering electricity to urban load centers. And, as my Manhattan Institute colleague Robert Bryce has noted, opposition to siting large-scale renewable energy facilities continues to grow.107 What’s more, because wind and solar are intermittent, huge investments in battery storage will be required, costing billions, if not trillions, of dollars.108 Regardless of the merits of electrification policies, absent fundamental technological leaps, meeting these renewable-energy goals will be impossible without nuclear power.
V. Conclusions and Policy RecommendationsNuclear power provides valuable benefits. It is highly reliable, emissions-free, and offers far greater power densities than renewable resources. It has proved its value in extreme weather events, when fossil-fuel gen-eration has been unable to deliver because of supply constraints and operational issues. It also provides additional diversity, which can reduce the adverse impacts of fuel price shocks. And, unlike intermittent wind and solar, nuclear power does not require backup generation or storage. Large-scale implementation of wind and solar generation to meet emissions reduc-tion goals, especially if those goals include substituting electricity for fossil-fuel consumption, is simply not feasible, given the land requirements and the cost of battery storage needed to provide reliable supplies.109
Against that background, some nuclear plants cannot compete in wholesale electric markets, even though the industry as a whole has reduced costs and significantly improved operating efficiency. Low natural gas prices and highly efficient gas-fired generators have reduced market prices. So have subsidies for solar and, especial-ly, wind generation, which, because of the federal PTC, can operate profitably even when electricity prices fall below zero.
As noted in Figure 5, eight nuclear plants are or soon will be receiving subsidies. Other nuclear plant owners are clamoring for subsidies of their own, based on claims of an inability to compete as well as political appeals to save jobs and preserve local economies. These subsidies are inefficient and distort wholesale power markets. They likely will have adverse long-term consequences because subsidies distort market signals and affect supplier decisions to enter and exit markets. Nevertheless, the cost to directly subsidize all existing nuclear plants using the current subsidy being paid in New York would be far less than the costs of direct and, especially, indirect subsidies for wind and solar gener-ation.
The most efficient way to assist the nuclear industry would be to impose a nationwide carbon tax. But doing so would have adverse impacts on the U.S. economy, harm consumers—especially lower-income and rural consumers—and, if imposed unilaterally, have no impact on world climate. Thus, subsidizing some un-competitive nuclear plants is likely the least adverse solution to preserving emissions-free generation, maintaining expertise in nuclear plant operations, and ensuring a reliable and resilient power system.
25
Is There a Future for Nuclear Power in the United States?
26
As electricity becomes ever more important to the U.S. economy, especially with some politicians demanding electrification to combat climate change, nuclear takes on even more significance because it is both clean and reliable. Wind and solar generation will not be able to meet increased demand arising from electrification. The land and storage requirements are unrealistic. Also, the costs of expanding the high-voltage transmis-sion system grid and, especially, the costs of battery storage are prohibitive.
At this time, the best hope for the nuclear industry appears to be SMR technology. If this technology can be developed successfully and the cost savings from modular design and construction realized, the industry could experience a renaissance, while reducing carbon emissions significantly.
Recommendations• Eliminate renewable generation subsidies at the
state and federal level, including federal tax credits, state renewable portfolio standards, and feed-in tariffs for renewable resources. Such subsidies con-tinue to distort wholesale power markets. Because wind and solar proponents have proclaimed these resources are already, or will be, cost-competitive with fossil-fuel generation,110 all such subsidies should be allowed to expire.
• For owners of existing nuclear plants who are re-questing subsidies in order to remain competitive, two recommendations: first, tie those subsidies to wholesale market prices of electricity using con-tracts-for-differences; and second, combine them with performance incentives that require the owners to improve the operating efficiency of their plants over time. Moreover, before subsidies are granted for a nuclear plant, a comprehensive cost-benefit analysis should be performed to determine whether the magnitude of the subsidies needed to prevent closure makes sense, or instead is so large that building replacement generating capacity is a low-er-cost alternative.
• Policymakers should resist subsidizing existing nuclear plants solely to “save” jobs and local econ-omies. Such efforts, like most government econom-ic development programs, merely transfer wealth from large groups of consumers and taxpayers to other groups.
• To develop new nuclear capacity, provide govern-ment loan guarantees, along with performance in-
centives that require investors to bear a portion of the financial risk.
• Require the developers of new nuclear technologies who receive government money to prove that their reactors are safer and more reliable than existing re-actors. Furthermore, require them to meet well-de-fined cost and deployment goals.
• Develop public-private partnerships that will lever-age existing nuclear-focused DOE facilities like Idaho National Laboratory and Oak Ridge National Laboratory. Those labs can be used to test and eval-uate new nuclear technologies. Test reactor sites can also be used to explore new manufacturing tech-niques.
• Address the current political logjam over a perma-nent spent-fuel repository by identifying communi-ties near geologically suitable sites that wish to host such a depository with the promise of local jobs and improved economic growth.
Appendix: Price Formation in the PJM Wholesale Electric Energy MarketPJM Interconnection is the nation’s largest regional transmission organization (RTO), covering 13 mid-western and mid-Atlantic states. To appreciate the current problem with prices in PJM’s wholesale elec-tric market, and with PJM’s not allowing baseload gen-eration to set those prices, it helps to understand why electric markets are different from, say, the market for wheat.
In most markets, individual suppliers make their own decisions about what to produce and when. For example, Farmer Jones can decide how many acres of wheat to plant this year without first consulting Farmer Smith. Similarly, Farmer Smith can decide to overhaul his tractor today without first consulting Farmer Jones. They make all their decisions independently. The same is true for large manufacturers. Apple does not need to coordinate with Dell before deciding how many com-puters it will manufacture. In fact, in many markets, coordinating with one’s rivals can be unlawful.
Another characteristic of many competitive markets is that, as more goods and services are produced, the cost
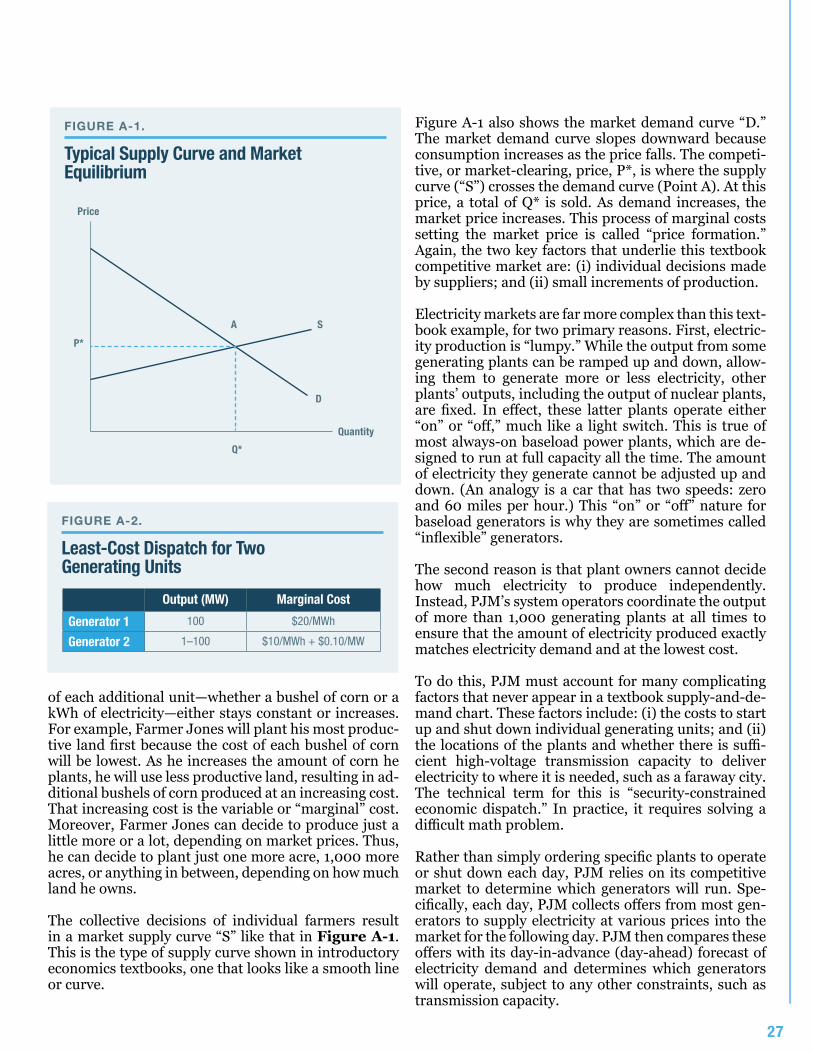
27
of each additional unit—whether a bushel of corn or a kWh of electricity—either stays constant or increases. For example, Farmer Jones will plant his most produc-tive land first because the cost of each bushel of corn will be lowest. As he increases the amount of corn he plants, he will use less productive land, resulting in ad-ditional bushels of corn produced at an increasing cost. That increasing cost is the variable or “marginal” cost. Moreover, Farmer Jones can decide to produce just a little more or a lot, depending on market prices. Thus, he can decide to plant just one more acre, 1,000 more acres, or anything in between, depending on how much land he owns.
The collective decisions of individual farmers result in a market supply curve “S” like that in Figure A-1. This is the type of supply curve shown in introductory economics textbooks, one that looks like a smooth line or curve.
Figure A-1 also shows the market demand curve “D.” The market demand curve slopes downward because consumption increases as the price falls. The competi-tive, or market-clearing, price, P*, is where the supply curve (“S”) crosses the demand curve (Point A). At this price, a total of Q* is sold. As demand increases, the market price increases. This process of marginal costs setting the market price is called “price formation.” Again, the two key factors that underlie this textbook competitive market are: (i) individual decisions made by suppliers; and (ii) small increments of production.
Electricity markets are far more complex than this text-book example, for two primary reasons. First, electric-ity production is “lumpy.” While the output from some generating plants can be ramped up and down, allow-ing them to generate more or less electricity, other plants’ outputs, including the output of nuclear plants, are fixed. In effect, these latter plants operate either “on” or “off,” much like a light switch. This is true of most always-on baseload power plants, which are de-signed to run at full capacity all the time. The amount of electricity they generate cannot be adjusted up and down. (An analogy is a car that has two speeds: zero and 60 miles per hour.) This “on” or “off” nature for baseload generators is why they are sometimes called “inflexible” generators.
The second reason is that plant owners cannot decide how much electricity to produce independently. Instead, PJM’s system operators coordinate the output of more than 1,000 generating plants at all times to ensure that the amount of electricity produced exactly matches electricity demand and at the lowest cost.
To do this, PJM must account for many complicating factors that never appear in a textbook supply-and-de-mand chart. These factors include: (i) the costs to start up and shut down individual generating units; and (ii) the locations of the plants and whether there is suffi-cient high-voltage transmission capacity to deliver electricity to where it is needed, such as a faraway city. The technical term for this is “security-constrained economic dispatch.” In practice, it requires solving a difficult math problem.
Rather than simply ordering specific plants to operate or shut down each day, PJM relies on its competitive market to determine which generators will run. Spe-cifically, each day, PJM collects offers from most gen-erators to supply electricity at various prices into the market for the following day. PJM then compares these offers with its day-in-advance (day-ahead) forecast of electricity demand and determines which generators will operate, subject to any other constraints, such as transmission capacity.
FIGURE A-2.
Least-Cost Dispatch for Two Generating Units
Output (MW) Marginal Cost
Generator 1 100 $20/MWh
Generator 2 1–100 $10/MWh + $0.10/MW
FIGURE A-1.
Typical Supply Curve and Market Equilibrium
Price
Quantity
P*
Q*
D
SA
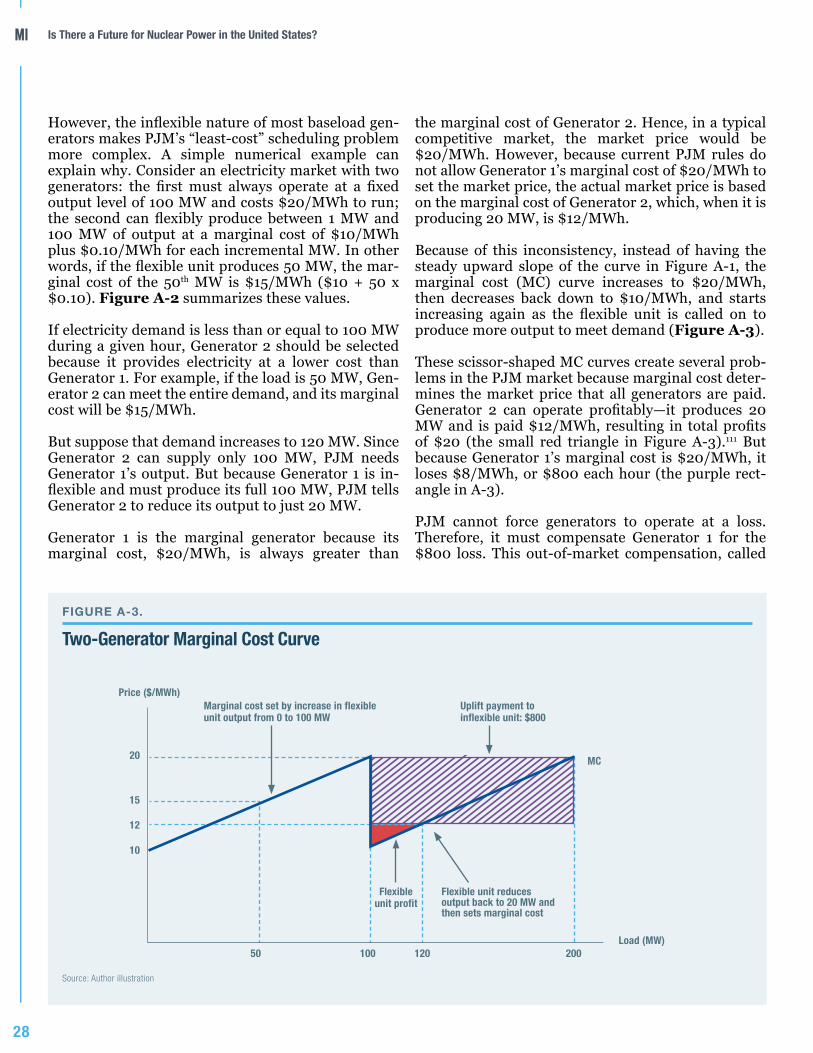
Is There a Future for Nuclear Power in the United States?
28
However, the inflexible nature of most baseload gen-erators makes PJM’s “least-cost” scheduling problem more complex. A simple numerical example can explain why. Consider an electricity market with two generators: the first must always operate at a fixed output level of 100 MW and costs $20/MWh to run; the second can flexibly produce between 1 MW and 100 MW of output at a marginal cost of $10/MWh plus $0.10/MWh for each incremental MW. In other words, if the flexible unit produces 50 MW, the mar-ginal cost of the 50th MW is $15/MWh ($10 + 50 x $0.10). Figure A-2 summarizes these values.
If electricity demand is less than or equal to 100 MW during a given hour, Generator 2 should be selected because it provides electricity at a lower cost than Generator 1. For example, if the load is 50 MW, Gen-erator 2 can meet the entire demand, and its marginal cost will be $15/MWh.
But suppose that demand increases to 120 MW. Since Generator 2 can supply only 100 MW, PJM needs Generator 1’s output. But because Generator 1 is in-flexible and must produce its full 100 MW, PJM tells Generator 2 to reduce its output to just 20 MW.
Generator 1 is the marginal generator because its marginal cost, $20/MWh, is always greater than
the marginal cost of Generator 2. Hence, in a typical competitive market, the market price would be $20/MWh. However, because current PJM rules do not allow Generator 1’s marginal cost of $20/MWh to set the market price, the actual market price is based on the marginal cost of Generator 2, which, when it is producing 20 MW, is $12/MWh.
Because of this inconsistency, instead of having the steady upward slope of the curve in Figure A-1, the marginal cost (MC) curve increases to $20/MWh, then decreases back down to $10/MWh, and starts increasing again as the flexible unit is called on to produce more output to meet demand (Figure A-3).
These scissor-shaped MC curves create several prob-lems in the PJM market because marginal cost deter-mines the market price that all generators are paid. Generator 2 can operate profitably—it produces 20 MW and is paid $12/MWh, resulting in total profits of $20 (the small red triangle in Figure A-3).111 But because Generator 1’s marginal cost is $20/MWh, it loses $8/MWh, or $800 each hour (the purple rect-angle in A-3).
PJM cannot force generators to operate at a loss. Therefore, it must compensate Generator 1 for the $800 loss. This out-of-market compensation, called
FIGURE A-3.
Two-Generator Marginal Cost Curve
Source: Author illustration
Price ($/MWh)
50 100 120
Marginal cost set by increase in flexible unit output from 0 to 100 MW
Uplift payment to inflexible unit: $800
200
MC
Load (MW)
20
15
12
10
Flexible unit profit
Flexible unit reduces output back to 20 MW and then sets marginal cost
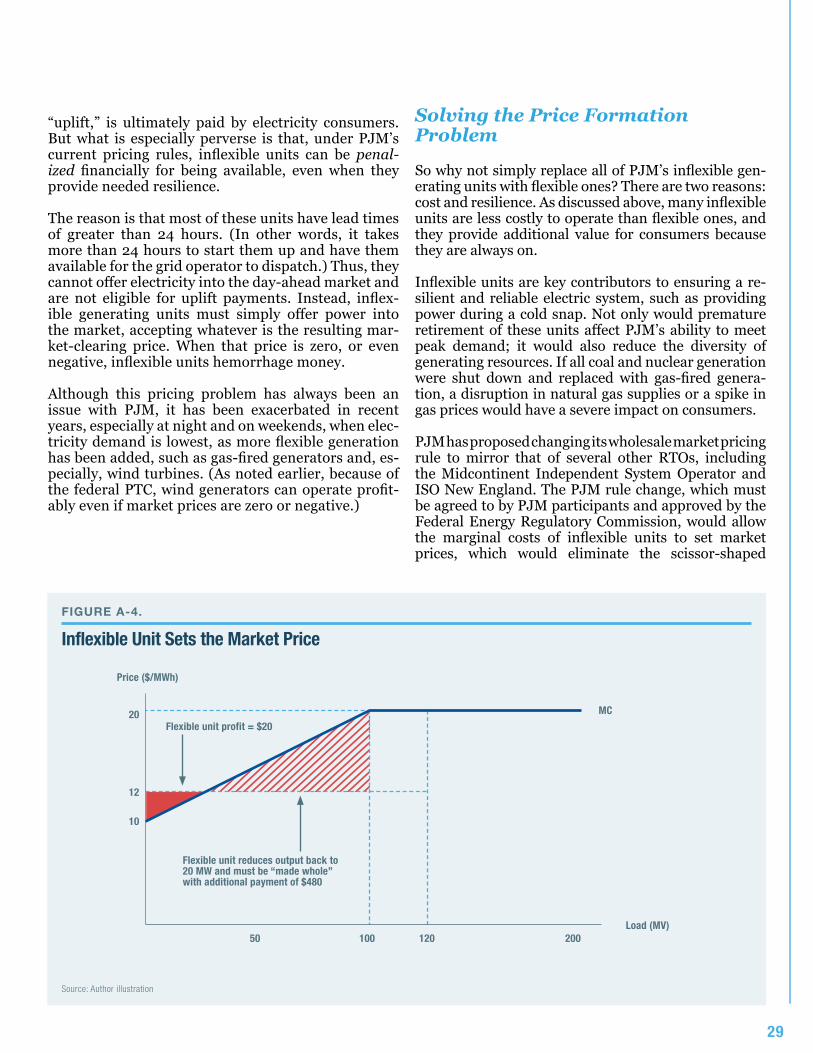
29
“uplift,” is ultimately paid by electricity consumers. But what is especially perverse is that, under PJM’s current pricing rules, inflexible units can be penal-ized financially for being available, even when they provide needed resilience.
The reason is that most of these units have lead times of greater than 24 hours. (In other words, it takes more than 24 hours to start them up and have them available for the grid operator to dispatch.) Thus, they cannot offer electricity into the day-ahead market and are not eligible for uplift payments. Instead, inflex-ible generating units must simply offer power into the market, accepting whatever is the resulting mar-ket-clearing price. When that price is zero, or even negative, inflexible units hemorrhage money.
Although this pricing problem has always been an issue with PJM, it has been exacerbated in recent years, especially at night and on weekends, when elec-tricity demand is lowest, as more flexible generation has been added, such as gas-fired generators and, es-pecially, wind turbines. (As noted earlier, because of the federal PTC, wind generators can operate profit-ably even if market prices are zero or negative.)
Solving the Price Formation Problem
So why not simply replace all of PJM’s inflexible gen-erating units with flexible ones? There are two reasons: cost and resilience. As discussed above, many inflexible units are less costly to operate than flexible ones, and they provide additional value for consumers because they are always on.
Inflexible units are key contributors to ensuring a re-silient and reliable electric system, such as providing power during a cold snap. Not only would premature retirement of these units affect PJM’s ability to meet peak demand; it would also reduce the diversity of generating resources. If all coal and nuclear generation were shut down and replaced with gas-fired genera-tion, a disruption in natural gas supplies or a spike in gas prices would have a severe impact on consumers.
PJM has proposed changing its wholesale market pricing rule to mirror that of several other RTOs, including the Midcontinent Independent System Operator and ISO New England. The PJM rule change, which must be agreed to by PJM participants and approved by the Federal Energy Regulatory Commission, would allow the marginal costs of inflexible units to set market prices, which would eliminate the scissor-shaped
FIGURE A-4.
Inflexible Unit Sets the Market Price
Source: Author illustration
50 100 120 200
20
12
10
Flexible unit profit = $20
Flexible unit reduces output back to 20 MW and must be “made whole” with additional payment of $480
MC
Load (MV)
Price ($/MWh)
Is There a Future for Nuclear Power in the United States?
30
marginal-cost problem. The rule change would also equitably compensate inflexible units for the value they provide by always being available.
Suppose that demand is again 120 MW. PJM needs the output of the inflexible unit, which is 100 MW, to meet demand. Thus, the flexible unit’s output again is reduced to 20 MW. Now, however, the market-clear-ing price is $20/MWh, eliminating the uplift payment (Figure A-4). At this price, the flexible unit would choose to operate at its maximum 100-MW capacity,
and its total profit would be $500.112 But because PJM requires it to reduce its output, the unit’s actual profit is $20. Thus, PJM pays the flexible unit an additional $480 in market compensation—the same amount the unit would earn in a fully competitive market.
Although the market price in this simple example in-creases from $12/MWh to $20/MWh, the more accu-rate price signal means that consumers will save in the long run because plant investment and retirement de-cisions will be more efficient.
31
1 Actual production can change each year, depending on whether a specific plant is being refueled. The 130-TWh value assumes an average annual capacity factor of 90%. See Nuclear Energy Institute, “U.S. Nuclear Generation Capacity Factors, 1917–2017.”
2 U.S. Energy Information Administration (EIA), Electric Power Monthly with Data for December 2018, tables 6.1 and 1.1. EIA estimates that small-scale solar PV, including rooftop solar, generated about 30 TWh in 2018.
3 Proponents claim that ZECs are not subsidies, but rather a way to value an unpriced attribute—in this case, a lack of carbon emissions. As discussed in Section III, such arguments are disingenuous. ZECs, like production tax credits, are subsidies.
4 Andrew Maykuth, “New Jersey Approves $300 Million in Nuclear Subsidies; PSEG Had Threatened to Close Reactors,” Philadelphia Inquirer, Apr. 18, 2019.
5 Julia Gheorgiu, “Connecticut Moves to Preserve Millstone Nuclear Plant with 10-Year Power Deal,” Utility Dive, Jan. 3, 2019.
6 Matt Kempner and Anastaciah Ondieki, “After Wrangling Over Georgia Nuclear Plant Cost, Concerns Remain,” Atlanta Journal-Constitution, Sept. 28, 2018.
7 As discussed in Section III, the U.S. has no permanent storage facility for high-level nuclear waste, including spent nuclear fuel. At this time, Finland is the only country actively constructing a permanent spent-fuel repository.
8 Nuclear Energy Institute, “Nuclear by the Numbers,” March 2019, p. 14.
9 P.L. 115-258.
10 Nuclear Energy Institute, “Roadmap for the Deployment of Micro-Reactors for U.S. Department of Defense Domestic Installations,” Oct. 4, 2018.
11 New York governor Andrew M. Cuomo, “2018 State of the State.”
12 House Resolution 109, “Recognizing the Duty of the Federal Government to Create a Green New Deal,” Feb. 7, 2019.
13 Robert Bryce, “All Renewable Energy in California? Sorry, Land-Use Calculations Say It’s Not Going to Happen,” Los Angeles Times, Aug. 21, 2018.
14 See Mark P. Mills, “The ‘New Energy Economy’: An Exercise in Magical Thinking,” Manhattan Institute, March 2019.
15 See the Appendix to this report.
16 For a concise overview of the industry, see DOE, “The History of Nuclear Energy,” DOE/NE-0088.
17 A third piece of legislation, the Natural Gas Policy Act, began the process of decontrolling natural gas prices. That legislation was the genesis for the huge increases in natural gas production and the low natural gas prices that we see today. Those lower prices are one reason for nuclear power’s current economic difficulties. The final two pieces addressed of legislation fuel use by industrial customers and electric utilities, encouraging both to switch to coal.
18 Many such analyses are based on estimates of resources’ “levelized costs,” which can be thought of as similar to a mortgage payment. These comparisons are affected by assumed lifetimes of the resources, performance over time, forecasts of fuel costs, and the appropriate discount rates for the analyses. A discussion of levelized cost analysis and other methodologies used to compare the costs of generating resources against energy efficiency and conservation efforts is beyond the scope of this report.
19 The accident at TMI was caused by a stuck valve, which led to a loss of coolant, higher temperatures in the reactor core, and, ultimately, a partial meltdown of the core and radiation leakage. Although the accident did not cause any injuries or deaths, it galvanized the antinuclear movement. For a discussion, see Scott Montgomery and Thomas Graham, Jr., Seeing the Light: The Case for Nuclear Power in the 21st Century (New York: Cambridge University Press, 2017), pp. 168–69. A 2017 study by researchers at the Pennsylvania State University College of Medicine reported a “possible” correlation between TMI and thyroid cancer rates. See David Goldenberg et al., “Altered Molecular Profile in Thyroid Cancers from Patients Affected by the Three Mile Island Nuclear Accident,” The Laryngoscope 127, no. S3 (July 2017): S1–S9.
20 The accident at Chernobyl was caused by a fundamentally flawed reactor design that was inherently unstable and by poorly trained employees. Employees conducted an unauthorized test of the reactor’s power, which caused a power surge and increased pressure in the core, leading to an explosion. For additional discussion, see Montgomery and Graham, Seeing the Light, pp. 145–49.
21 On May 19, 1989, LILCO agreed not to operate the plant in a deal with the state, under which most of the project’s $6 billion cost was passed on to Long Island residents. In 1992, the Long Island Power Authority bought the plant from LILCO. It remains unused.
22 See HistoryLink.org, “The Washington Public Power Supply System.”
23 Today, that plant is called the Columbia Generating Station. For a detailed discussion, see Daniel Pope, Nuclear Implosions: The Rise and Fall of the Washington Public Power Supply System (New York: Cambridge University Press, 2008). See also Michael Blumstein, “The Lessons of a Bond Failure,” New York Times, Aug. 14, 1983.
24 For a discussion, see Congressional Budget Office (CBO), “Electric Utilities and Stranded Costs,” October 1998.
25 Fang Zhang, “Does Electricity Restructuring Work? Evidence from the U.S. Nuclear Energy Industry,” Journal of Industrial Economics 55, no. 3 (September 2007): 397–418.
26 “Exelon Nuclear Fact Sheet.” Exelon Nuclear is also the owner of the Oyster Creek plant, which was permanently shut on Sept. 17, 2018, after 49 years of operation. The plant was closed because Exelon determined that the cost of installing new cooling towers, which the New Jersey Department of Environmental Protection decided to require, was uneconomic. Ironically, when the plant was constructed, the state did not want cooling towers installed because of their visual impact.
27 See David E. Dismukes, “Removing Big Wind’s ‘Training Wheels’: The Case for Ending the Federal Production Tax Credit,” American Energy Alliance, November 2012. See also Jonathan A. Lesser, “Wind Intermittency and the Production Tax Credit: A High Cost Subsidy for Low Value Power,” Continental Economics, October 2012.
28 The $23/MWh price is a tax credit. Thus, with a federal corporate income tax of 21%, as long as the market price is greater than –$23/MWh x (1.21) = –$27.83, the owner of a wind turbine can earn a profit.
Endnotes
Is There a Future for Nuclear Power in the United States?
32
29 It is for this reason that nuclear plants that sell power into wholesale markets like the New York Independent System Operator (NYISO) and PJM are called “price takers.” They accept whatever the market price turns out to be.
30 Joachim Seel, Andrew Mills, and Ryan Wiser, “Impacts of High Variable Renewable Energy Futures on Wholesale Electricity Prices, and on Electric-Sector Decision Making,” Lawrence Berkeley National Laboratory, May 2018.
31 Paul Denholm et al., “Overgeneration from Solar Energy in California: A Field Guide to the Duck Chart,” National Renewable Energy Laboratory, NREL/TP-6A20-65023, November 2015.
32 Several wholesale power markets also provide payments for installed capacity, sometimes referred to as “iron in the ground.” These markets were designed to compensate generators for “missing money” stemming from price caps in the energy markets. The operations of these capacity markets, which are artificial creations, continue to evolve. There is a large literature on the “missing money” problem. See, e.g., Paul Joskow, “Capacity Payments in Imperfect Electricity Markets: Need and Design,” Massachusetts Institute of Technology, December 2007, and William Hogan, “Electricity Scarcity Pricing Through Operating Reserves,” Economics of Energy and Environmental Policy 2, no. 2 (September 2013): 65–86.
33 For a discussion of traditional cost-of-service utility regulation, see Jonathan A. Lesser and Leonardo R. Giacchino, Fundamentals of Energy Regulation, 2nd ed. (Reston, VA: Public Utilities Reports, Inc., 2013).
34 The same market pricing impacts ultimately would also render all fossil-fuel generators uncompetitive.
35 EIA, Frequently Asked Questions.
36 This figure excludes the small amount of customer-owned, “behind-the-meter” generation, produced almost exclusively from rooftop solar panels.
37 Nuclear Energy Institute, “Nuclear by the Numbers,” pp. 12–13.
38 Current nameplate nuclear generating capacity is 99,221 MW, from the nation’s 98 reactors. (Nameplate capacity refers to a generating unit’s maximum rate of output. The actual output varies, depending on operating conditions.) World Nuclear Association, “Nuclear Power in the USA,” March 2019.
39 EIA, Form 923.
40 EIA, Electric Power Annual 2018, tables 3.1.B and 4.3.
41 NC Clean Energy Technology Center, DSIRE (Database of State Incentives for Renewables & Efficiency), New York Clean Energy Standard, Jan. 8, 2019; New York Department of Public Service, Case 15-E-0302, Proceeding on Motion of the Commission to Implement a Large-Scale Renewable Program and a Clean Energy Standard, and Case 16-E-0270, Petition of Constellation Energy Nuclear Group LLC; R. E. Ginna Nuclear Power Plant, LLC; and Nine Mile Point Nuclear Station, LLC, to Initiate a Proceeding to Establish the Facility Costs for the R. E. Ginna and Nine Mile Point Nuclear Power Plants, Order Adopting a Clean Energy Standard, Aug. 1, 2016 (calculation based on total state electricity load of about 160 TWh, an annual ZEC cap of 27.6 TWh and initial ZEC price of $17.48/MWh).
42 “New York Electricity Supply Costs to Increase in 2017–PSC Approves Clean Energy Standard, Subsidizes Upstate Nuclear Power,” Energywatch, Aug. 3, 2016.
43 Based on an increase in ZEC prices and forecast of electricity loads. Both the New York and Illinois subsidy schemes have been upheld by the courts. New York: Coalition for Competitive Electricity v. Zibelman, Case No. 17-2654 (2d Circ. 2018); Illinois: Electric Power Supply Association et al. v. Starr et al., Case Nos. 17-2433 and 17-2445 (7th Circ. 2018).
44 Exelon is also pressing the state to provide subsidies for its three other plants in Illinois: Braidwood, Byron, and Dresden. As of this writing, legislation that would subsidize these three plants has not passed the Illinois legislature. A controversial report by the PJM Independent Market Monitor has concluded that all five of Exelon’s nuclear plants in Illinois are profitable. See Steve Daniels, “Exelon’s Hand Is Out for More Nuke Subsidies—and a Power Market Referee Cries Foul,” Crain’s Chicago Business, Mar. 22, 2019.
45 John O’Connor, “Last-Minute Exelon Subsidy Plant Goes to Illinois House Floor,” Chicago Sun-Times, Nov. 30, 2016.
46 The subsidy payment is $16.50/MWh through 2020. Thereafter, the subsidies increase by $1/MWh each year, unless wholesale prices increase. See Illinois Power Agency Act, 20 ILCS 3855/1-75(d-5). See also Illinois Power Agency, “Zero Emission Standard Procurement Plan,” Oct. 31, 2017.
47 Joe Cahill, “The Secret to Exelon’s Rising Profit,” Crain’s Chicago Business, Aug. 15, 2018.
48 Connecticut Senate Bill 1501, Public Act No. 17-3.
49 New Jersey Senate Bill 2313.
50 Maykuth, “New Jersey Approves.”
51 New Jersey Assembly Bill 3723.
52 “New Jersey Awards First ZECs,” World Nuclear News, Apr. 23, 2019.
53 Ohio Legislature, HB 381.
54 Letter from Rick Giannantonio, General Counsel, FirstEnergy Solutions Corp., to the Honorable James Richard Perry, Secretary of Energy, Mar. 29, 2018.
55 The five plants are Beaver Valley, Limerick, Peach Bottom, Susquehanna, and Three Mile Island. The total generating capacity of the five plants is about 4,300 MW. The legislation would require utilities to purchase 50% of their electricity from a new third “tier” of alternative energy, consisting of nuclear, solar, wind, geothermal, and “low-impact” hydroelectric. However, the legislation prohibits generating resources that receive any other tax exemptions, credits, etc. from participating. This prohibition would effectively limit Tier 3 to in-state nuclear generating. The legislation faces strong opposition from the natural gas industry, as well as customer and industrial groups.
56 Scott DiSavino, “Pennsylvania State Lawmaker Offers Bill to Save Nuclear Power Plants,” Reuters, Mar. 11, 2019. The legislation is HB 11.
57 Nuclear Energy Institute, “Nuclear by the Numbers 2019,” p. 14.
58 Geoffrey Haratyk, “Early Nuclear Retirements in Deregulated U.S. Markets: Causes, Implications and Policy Options,” Energy Policy 110 (November 2017): 150–66.
59 Greg Brown, “Whatever It Takes: ScoMo Prepared to Go Nuclear if It Cuts Power Prices,” The Australian, Oct. 6, 2018.
60 Joshua Byrd, “Chart of the Day: Something Has Gone Terribly Wrong with Electricity Prices,” Australia Broadcasting Corporation, July 17, 2018. The
33
exchange rate on May 1, 2019, was $1 Australian = $US 0.7050. The average residential price in Australia was therefore about $US 0.22/kWh.
61 Rosatom (State Atomic Energy Corporation), Projects.
62 In Europe, Germany still intends to shutter all its nuclear plants by 2022 as part of that country’s Energiewende (energy transition) and is pressuring other European countries to do the same. However, the antinuclear push is colliding with Germany’s carbon emissions reductions goals. P. Tamma, “Germany’s Green Dreams Run into Climate Change Reality,” Politico, Oct. 9, 2018.
63 EPA, “Health and Environmental Effects of Particulate Matter.”
64 For an exhaustive discussion, see Vaclav Smil, Power Density (Cambridge, MA: MIT Press, 2015).
65 The calculation is as follows: one hectare (ha) is 10,000 square meters, or 2.47 acres. Thus, 240 acres is equivalent to 240 / 2.47 = 97.2 ha = 972,000 square meters. The power density then is (2,060 MW) x (1,000,000 watts/MW) / 972,000 = 2,119 w/M2.
66 Smil, Power Density, pp. 64–68.
67 These include California, Colorado, Hawaii, Illinois, Maine, Massachusetts, Minnesota, New Jersey, New Mexico, New York, Oregon, and Washington State. Some of these 100% goals are currently aspirational, while others, including those of California and New York, are embodied in legislation.
68 Although many coal plants have on-site supplies, these “coal piles” can freeze in extreme weather.
69 “US Nuclear Plants Operate Through Polar Vortex,” World Nuclear News, Feb. 4, 2019.
70 For an introduction to electric power system design and operations, see Robert Miller and James Malinowski, Power System Operation, 3rd ed. (New York: McGraw-Hill, 1993).
71 For a detailed discussion, see Organisation for Economic Co-operation and Development (OECD), “Nuclear Energy and Renewables: System Effects in Low-Carbon Electricity Systems,” 2012.
72 Mills, “The ‘New Energy Economy.’ ”
73 EIA, “Direct Federal Financial Interventions and Subsidies in Energy in Fiscal Year 2016,” April 2018, table 4, p. 11. 2016 generation totals from EIA, Electric Power Monthly with Data for December 2018, table 1.1.A.
74 Behind-the-meter solar PV (that is, solar PV installed by customers) also benefits from subsidies, including the costs of providing backup power and the costs of maintaining voltage and frequency within specific limits on local distribution systems. Moreover, many local electric utilities offer “net-metering” programs that pay behind-the-meter solar generators the retail price of electricity, rather than the wholesale market price. These subsidies are all paid for by other retail customers.
75 OECD, “Nuclear Energy and Renewables,” p. 127, table 4.6.
76 Ibid.
77 E. Merchant, “Surviving the Polar Vortex: A Look at How the Electricity System Fared,” GreenTech Media, Feb. 6, 2019.
78 National Conference of State Legislatures, “State Restrictions on New Nuclear Power Facility Construction,” May 2017.
79 See Blue Ribbon Commission on America’s Nuclear Future, “Report to the Secretary of Energy,” January 2012; and R. Wigeland et al., “Nuclear Fuel Cycle Evaluation and Screening: Final Report,” U.S. Department of Energy, INL/EXT-14-31465, FCRD-FCO-2014-000106, Oct. 8, 2014.
80 Henry Fountain, “On Nuclear Waste, Finland Shows U.S. How It Can Be Done,” New York Times, June 9, 2017.
81 International Atomic Energy Agency, “Spent Fuel Reprocessing Options,” IAEI-TECDOC-1587, August 2008.
82 World Nuclear Association, “Nuclear Power in France,” November 2018.
83 “US Budget Request Supports Yucca Mountain,” World Nuclear News, Mar. 12, 2019.
84 Jeremy Dillon and George Cahlink, “New Nev. Lawmaker: Pelosi Promises No on Shuttered Site,” E&E News, Jan. 4, 2019.
85 Dale Jany, “Community, WIPP History Closely Intertwined,” Carlsbad Current Argus, Mar. 28, 2019.
86 Mark Hibbs, “Does the U.S. Nuclear Industry Have a Future?” Carnegie Endowment for World Peace, Aug. 10, 2017.
87 U.S. Nuclear Regulatory Commission, “Design Certification Application—NuScale.”
88 NuScale, “How the NuScale Module Works,” undated.
89 Critics argue that the design is not safe and contend that any nuclear power investments are wasteful. See, e.g., Sierra Club, “Small Modular Reactors: Squandering Money and Resources,” April 2017; Union of Concerned Scientists, “Small Isn’t Always Beautiful: Safety, Security and Cost Concerns About Small Modular Reactors,” September 2013.
90 NuScale selected BWX Technologies to begin the manufacturing phase. See “NuScale SMR Enters First Manufacturing Phase,” World Nuclear News, Sept. 26, 2018.
91 Cassandra Profita, “Oregon’s Small-Scale Nuclear Company Looks to Build 1st Plant in Idaho,” Oregon Public Broadcasting, Mar. 11, 2019.
92 NuScale. “Breakthrough for NuScale Power: Increase in Its SMR Output Delivers 20 Percent More Power,” June 6, 2018. For an analysis of SMR costs, see SMR Start, “The Economics of Small Modular Reactors,” Sept. 14, 2017.
93 Some dismiss SMR technology as “fantasy” that ignores nuclear power’s past failures. See Benjamin Sovalco and M. Ramana, “Back to the Future: Small Modular Reactors, Nuclear Fantasies, and Symbolic Convergence,” Science, Technology, & Human Values 40, no 1 (January 2015): 96–125.
94 MIT Energy Initiative, “The Future of Nuclear Energy in a Carbon-Constrained World,” 2018.
95 Wind generators will be eligible for PTC as long as construction starts by Dec. 31, 2019. For facilities beginning construction in 2017, PTC credit was reduced by 20%, from $23/MWh ($28/MWh on a pretax basis) to $19/MWh ($24/MWh on a pretax basis). For construction starting in 2018, PTC was reduced by 40%, to $15/MWh ($19/MWh on a pretax basis). And for generators commencing construction in 2019, PTC is reduced by 60%, to $11/MWh ($14/MWh on a pretax basis). See DOE, Renewable Electricity Production Tax Credit.
Is There a Future for Nuclear Power in the United States?
34
96 Robert Pindyk, “The Use and Misuse of Models for Climate Policy,” Review of Environmental Economics and Policy 11, no. 1 (Winter 2017): 100–114.
97 Illinois Power Agency, “Zero Emission Standard Procurement Plan,” Oct. 31, 2017, pp. 22–26.
98 Nuclear Energy Institute, “Zero Emissions Credits,” April 2018, pp. 4–5.
99 New York Independent System Operator (NYISO), Monthly Report, December 2018, January 2019.
100 Many countries, such as Spain and Germany, along with some U.S. states, have used what are called “feed-in tariffs” (FITs) to subsidize renewable generation. In Spain and Germany, FITs were set so high that they encouraged huge quantities of renewable generation, which led to much higher electricity costs. An alternative is to set FIT values using an auction mechanism, based on desired quantities of a resource. See Jonathan A. Lesser and Xuejuan Su, “Design of an Economically Efficient Feed-In Tariff Structure for Renewable Energy Development,” Energy Policy 36, no. 3 (March 2008): 981–90.
101 This is a simplified example. Nuclear plants also earn revenues in the wholesale capacity market. Those revenues offset the plants’ fixed costs, which a plant owner must eventually recover to remain economically viable.
102 For an introduction to performance-based regulation, see Lesser and Giacchino, Fundamentals of Energy Regulation, pp. 83–89.
103 There are many proposals for carbon taxes, including those that are supposedly revenue-neutral. A discussion of the welfare impacts of the different carbon tax proposals on U.S. consumers and businesses is far beyond the scope of this report. For one analysis, see Stephie Fried, Kevin Novan, and William B. Peterman, “The Distribution Effects of a Carbon Tax on Current and Future Generations,” Board of Governors of the Federal Reserve System, Finance and Economics Discussion Series 2016-038, Apr. 20, 2016.
104 See Jonathan A. Lesser, “Missing Benefits, Hidden Costs: The Cloudy Numbers in the EPA’s Proposed Clean Power Plan,” Manhattan Institute June 2016, pp. 9–19.
105 Southern Company’s Vogtle plant was awarded its first government loan guarantee in 2008.
106 EIA, State Energy Data System, table C4. In 2016, total end-use energy consumption in New York was estimated to be 3,662 TBtus. Total retail electric sales were estimated to be 504 TBtus.
107 See, e.g., Robert Bryce, “Vacant-Land Mythology Impedes Serious Energy Discussions,” The Hill, Feb. 25, 2019; Darrel Radford, “County Towns Putting Up Walls Against Wind,” Courier-Times (New Castle, IN), Nov. 1, 2018; Halie Cook, “Wind Turbine Banned in Unincorporated Los Angeles County,” hometownstation.com (Santa Clarita, CA), July 23, 2015.
108 For a discussion, see Jonathan A. Lesser, “Short Circuit: The High Cost of Electric Vehicle Subsidies,” Manhattan Institute, May 2018, pp. 20–23.
109 Mills, “The ‘New Energy Economy.’ ”
110 See, e.g., International Renewable Energy Agency, “Renewable Power Generation Costs in 2017,” January 2018.
111 The area of the small triangle is (1/2) x ($2/MWh) x (20 MW) = $20 for the given hour.
112 (1/2) x (100 MW) x ($10/MWh) = $500 for the hour.
AcknowledgmentsConnor Harris, a policy analyst at the Manhattan Institute, provided research assistance for this report.
35

July 2019


![Nuclear Fission: : A Review of Experimental Advances and …eprints.whiterose.ac.uk/119672/1/Andreyev_et_al_2017_Rep._Prog._Phy… · Nuclear fission, discovered in 1938 [1], provides](https://img.pdfslide.us/doc/110x75/602692ecd315a53da13f1292/nuclear-fission-a-review-of-experimental-advances-and-nuclear-ission-discovered.jpg)