Embed Size (px)
Citation preview
Is the Tax Expense Estimate Improved or Biased
in the Presence of Using the Same Tax and Audit Firm?
Cristi A. Gleason, University of Iowa, and Lillian F. Mills, University of Texas
Regulators have limited firms’ ability to purchase tax services from their audit firms out of concerns that auditors permit biased reporting when their firms provide tax services to their audit clients. Auditor bias
could arise either because of the economic bond generated by the magnitude of the tax services or because a qualitative conflict exists whereby auditors are reviewing the accounting arising from their own firm’s tax advice. On the other hand, providing tax services could improve the estimation of tax expense because the audit firm enjoys knowledge spillover from its tax department. That is, the audit team learns from its tax group more about the tax planning undertaken by the corporation. To date, empirical accounting research in the Sarbanes-Oxley (SOX) period has focused on the possibility that independence is impaired when an audit firm provides tax services to an audit client (Frankel, Johnson, and Nelson, 2002; Antle et al., 2002; DeFond, Raghunandan, and Subramanyan, 2002; Ashbaugh, LaFond, and Mayhew, 2003; Chung and Kal-lapur, 2003; Kinney, Palmrose, and Scholz, 2004; and Larker and Richardson, 2004). Accounting theory, however, provides support for both independence impairment and estimation improvement resulting from audit-provided tax services (Simunic, 1984; Beck, Frecka, and Solomon, 1988). We design tests to distinguish between these competing predictions.
Our study is motivated by the ongoing debate on auditor-provided tax services. The evidence in academic research fails to find lapses in independence for auditor-provided services in general. Also, many commentators advocate permitting tax services because of the benefits of knowledge spillovers. Nev-ertheless, regulators have continued to inhibit tax services provided by auditors beyond the initial restrictions in section 2.01 of the Sarbanes Oxley Act of 2002. The requirement that corporations must obtain audit committee approval for permitted nonaudit services imposes a serious friction that contributes to the decline in auditor-provided tax services (Maydew and Shackelford, 2006). Conservative audit committees are unlikely to approve such tax services based on the current lack of evidence concerning independence failures. In

Gleason and Mills4
the post-SOX climate, saying “no” is safe and easy--saying “yes” requires positive evidence.
Accounting for contingencies related to IRS examinations provides a context in which the differences in competing predictions from audit theory should be especially stark. Firms estimate and record a liability (tax cushion) for the probable and estimable amount of additional tax the firm expects to lose to the IRS as a result of IRS examinations. Determining the amount of tax cushion requires judgment on the part of both management and auditors. The need for judgment provides management with an occasion to record tax benefits or contingencies opportunistically.
Auditors can constrain managers from under- or over-recording tax cushion through their audit procedures. Auditors assess the sufficiency of the tax expense by reviewing tax returns, workpapers, and IRS correspondence to identify areas of tax risk, skeptically evaluating managers’ own risk analysis, seeking outside legal opinions, and conducting tax research to assess the prob-ability of loss.
If an audit firm provides tax planning or tax compliance services, the audit personnel can learn about the existence and technical merits of any uncertain tax positions from the tax personnel. These knowledge spillovers (Simunic, 1984; Beck, Frecka, and Solomon, 1988) can improve the estimation of the probable amount owed. It is more difficult for an audit firm to assess tax risk if its client conducts its own tax planning or uses unrelated consultants. An audit firm that does not provide tax services must first detect aggressive tax positions (or rely on management to reveal those positions), then generate evidence about the expected outcome of those positions.
However, regulators are concerned that nonaudit services impair inde-pendence because substantial services create an economic bond whereby the audit firm does not want to lose a profitable client. The tax setting also has a qualitative effect if the auditor is reviewing the results of its own tax depart-ment’s advice. The potential link between auditor-provided tax services and the impairment of auditor independence is illustrated in the following quote:
The issue of independence is particularly acute when the tax strategy is sold to achieve a particular financial statement result. The whole point of the auditor is to audit the financial statements, but now they’re affecting the financial statement results and they’re then going to audit that? How can that possibly be independent?
Mark Anson (Calpers), PCAOB 2004, p. 111.1
Thus, the alternative to knowledge spillovers is that the auditor permits firms to bias their estimates of tax cushion and thus tax expense. Focusing on the relation between reported tax cushion and deficiency exploits the direct
Is the Tax Expense Estimate Improved or Biased? 5
link between tax planning and tax expense. An underlying assumption is that auditors who do not provide tax services are free from bias. Hence, we use comparisons between firms that do and do not purchase auditor-provided tax services to test for bias or improved estimation of tax cushion.
We analyze observations for years in which the IRS completes its exami-nation. These years represent periods when corporations learn the amount of the disputed tax (the deficiency) and make any concessions by paying some of the disputed tax. Our sample consists of 497 corporation-years with completed examinations and sufficient data from four sources: financial statement data from Standard & Poor’s Compustat, audit fee data from Standard & Poor’s, tax return data, and IRS examination data. The corporations are publicly traded companies in the large- and midsized business (LMSB) division of the IRS. The sample includes years 2000, 2001, and 2002, because auditor fee data were not available until 2000, and because IRS tax data are available to one of the authors only through 2002.
We estimate a regression of tax expense on IRS deficiencies. We expect deficiencies to contribute positively to tax expense.2 This result would occur if firms accrued less than the eventual loss from the deficiency, perhaps because they record the lower amount of a probable range of loss from any tax deficiency (FIN 14). To test whether auditor-provided tax services affect the association between tax expense and tax deficiency, we interact a dummy variable for such services with deficiency in the regression specification.3
We find that only corporations whose auditors do not perform tax services record additional tax expense for the deficiency. Specifically, these corpora-tions increase tax expense by about 78 percent of the deficiency in the year the IRS exam is completed. In contrast, the coefficient for the interaction between deficiency and using auditor-provided tax services is negative, and the net co-efficient is not significantly different from zero. This means that, on average, corporations whose auditors provide tax services do not increase tax expense in response to the IRS deficiency, a result consistent with better estimation of contingent IRS exam liabilities in prior periods. We repeat the analysis using the amount of total payments in settlement with the IRS after all appeals and litigation steps are concluded as the dependent variable, and find that corpo-rations using auditor-provided tax services still do not record additional tax expense. This corroborates our interpretation that these corporations have fully accrued the tax liability prior to the deficiency. We infer that corporations using auditor-provided tax services have adequately, or even conservatively, recorded reserves for tax loss contingencies prior to IRS examination. In other words, these corporations convey bad news sooner to shareholders.
To conclude that recording enough expense for the contingency does not itself lead to earnings manipulation, we investigate whether corporations using auditor-provided tax services overaccrue tax expense to manage earnings. We

Gleason and Mills6
find no association between the presence of auditor-provided tax services and the management of tax expense to meet or beat analysts’ quarterly earnings-per-share forecasts or to smooth earnings. We conclude that purchasing tax services from the auditor does not permit corporations to manage earnings more easily than corporations whose auditors do not provide tax services.
In summary, we find no evidence that providing tax services impairs an auditor’s independence. In contrast, our evidence is consistent with knowledge spillovers from auditor-provided tax services improving the precision of tax cushion estimates, and hence audit quality.
Institutional Background and PredictionsCorporations often pay less tax on their return than will be ultimately required by the IRS after it examines the return and all disputes are settled. Determining how much more will be paid is difficult and requires judgment. Thus, tax loss contingencies present a useful setting to explore whether tax expense estimation is improved or biased for corporations that use the same tax and audit firm.
Estimates of Tax Loss ContingencyTax “cushion” is the term used to describe amounts firms record for contin-gent tax liabilities in anticipation of IRS challenges of uncertain tax positions. SFAS 5 requires that a corporation record the amount of contingent liability that is probable and estimable.4 In applying this standard to contingent tax li-abilities, anecdotal evidence suggests that companies assess the probability of the loss taking into account some or all of the following risks: the risk of the legal uncertainty, the risk of IRS examination, the risk of detection, and the risk of litigation.5 Corporations update their estimates of the tax loss contingency beginning in the fiscal year of the return and extending to the final settlement with the IRS.6
Under SFAS 5, a corporation accrues a loss contingency when the loss is probable and estimable. As a result, corporations would generally record less than the expected value of all losses, because some contingencies that are not judged probable under SFAS 5 would nonetheless occasionally result in a real-ized loss. Further, SFAS 5 states that, when the corporation can only estimate a range, and when no amount in the range is more probable than any other, the corporation should record the bottom number in the range. Conditional on the same expected value, a more precise estimate results in a higher lower bound. Therefore, a more precise estimate results in a higher accrual if firms book the bottom number in the range.
Coupled with difficulties in estimating tax cushion, managers face in-centives to bias earnings estimates to achieve financial reporting objectives.
Is the Tax Expense Estimate Improved or Biased? 7
Managers may record lower amounts of cushion in order to meet bonus targets, debt covenants, or analyst earnings targets. Alternatively, managers may record excess cushion to build a “cookie jar,” with the intent to smooth earnings now and provide flexibility to meet targets in the future.
Role of AuditorsWe assume that independent auditors require corporations to make objective unbiased accounting reports (Ashbaugh, Lafond, and Mahew, 2003). Thus, if managers underreport loss contingencies or conservatively report contingen-cies and use that conservatism for earnings smoothing, we would interpret such reporting as opportunistic bias. Such bias would appear consistent with an independence failure. With respect to the precision of managers’ cushion estimates, auditors may improve the estimate. This improvement comes from greater experience and expertise than are available inside the firm. When the auditor also provides nonaudit services, there is the potential for “knowledge spillovers” (Simunic, 1984; Beck, Frecka, and Solomon, 1988).
Theory offers contradictory explanations for how nonaudit services affect the quality of the audit with respect to bias. Nonaudit services may improve audit quality in two ways. First, knowledge spillover should reduce the bias of contingency estimates because auditors are more familiar with the tax treat-ment. Second, nonaudit services may increase the costs to the auditor of a potential audit failure due to increased litigation risk and reputation concerns (Reynolds and Francis, 2001), motivating auditors to higher skepticism and increased scrutiny.
Knowledge spillover should increase the precision of tax contingency estimates because auditors who also provide tax planning or compliance ser-vices already know about the existence of tax positions that create uncertain tax benefits. They should also have superior information about the probable outcome of those tax plans, because they already know how well the client’s fact patterns and legal structures match the requirements of any tax precedents. Participants in the PCAOB Roundtable discussion express this view as follows: “I do think the fundamental provision of tax services does, in fact, enhance the audit process” (Lynn Turner (Glass Lewis, former chief accountant SEC), PCAOB Roundtable 2004, p. 23). “We also believe that the provision of tax advice… [for] public registrants serves the public interest by permitting the auditor to conduct an efficient audit in respect to tax matters” (Mr. Brasher (KPMG), PCAOB 2004, p. 28).
Holding the expected value constant, the lower bound on a more precise estimate will be higher, so that the auditor will require the corporation to record more tax cushion. Thus, absent any bias, corporations using auditor-provided tax services should record higher amounts of tax cushion prior to learning the
Gleason and Mills8
amount of the deficiency or settlement than other corporations, if knowledge spillovers from providing tax services enhance the audit.
Alternatively, nonaudit services may decrease audit quality by permitting bias in cushion. The audit firm’s dependence on the nonaudit service revenue may increase the economic bond between the auditor and client and decrease the likelihood the auditor corrects any bias (Beck, Frecka, and Solomon, 1988; Kinney and Libby, 2002). The bond between the auditor and client has a qualitative as well as economic aspect if the nonaudit service is tax advice that directly affects earnings:
If you get … that aggressive recommendation from the tax depart-ment of the audit firm, how likely is the auditor to call that advice into question? … When push comes to shove, will the auditor call that recommendation into question? And I think that becomes significantly less likely if the recommendation came from his own firm.
Barbara Roper (Consumer Federation of America), PCAOB Roundtable 2004, p.80.
Because there are widely held but conflicting predictions regarding the ef-fect of auditor-provided tax services on auditor independence versus knowledge spillover, we examine the issue empirically.7 We focus on tax contingencies for IRS examination deficiencies. We state our research question as follows:
RQ1: Do corporations whose auditors provide tax services record higher, lower, or equivalent amounts of tax expense for tax loss contingencies compared with corporations whose auditors do not provide tax services?
Managers’ reporting incentives could create bias in either direction: delaying or accelerating the recording of cushion. If auditor-provided tax services are associated with insufficient amounts of cushion, we will conclude that such auditors permit managers to manage earnings upward by recording less tax cushion.
However, if auditor-provided tax services are associated with higher amounts of cushion, we cannot distinguish better estimation from opportunism merely based on the amounts of recorded cushion. To distinguish improved precision from opportunistic overaccrual (cookie jar), we consider whether auditor-provided tax services are associated with earnings management. We investigate the following additional research question:
RQ2: Do corporations whose auditors provide tax services manage earnings via tax expense more frequently than those who do not?
Is the Tax Expense Estimate Improved or Biased? 9
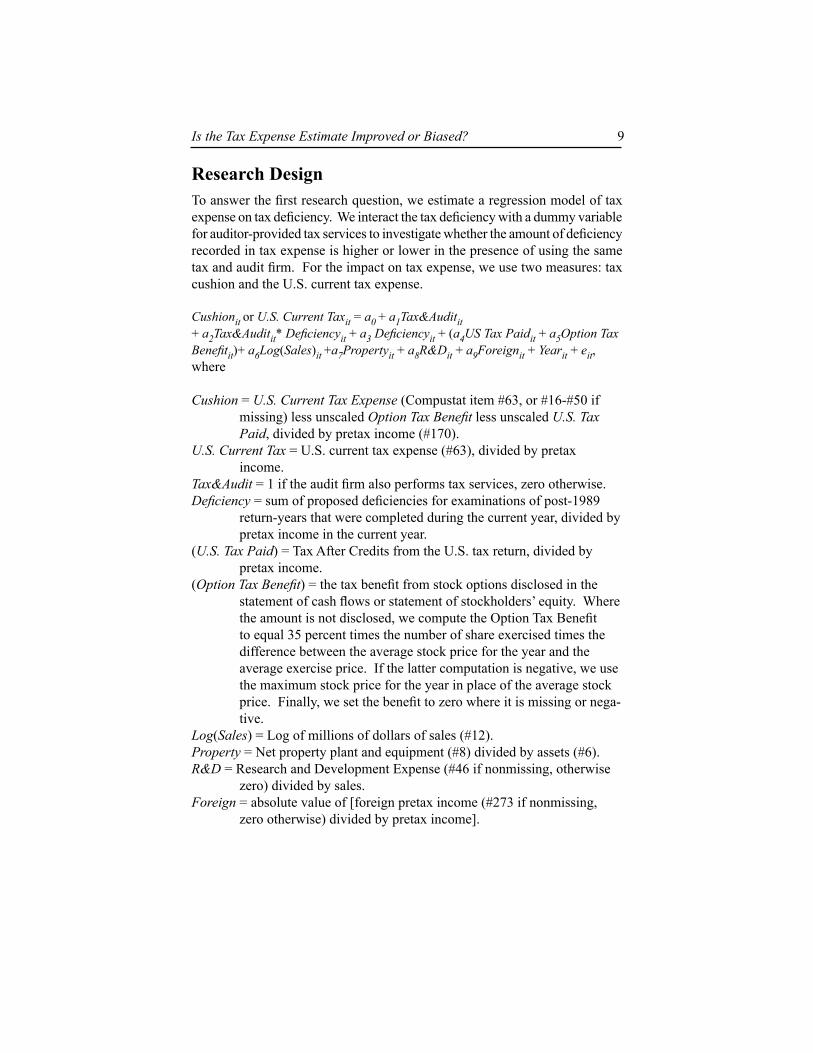
Research DesignTo answer the first research question, we estimate a regression model of tax expense on tax deficiency. We interact the tax deficiency with a dummy variable for auditor-provided tax services to investigate whether the amount of deficiency recorded in tax expense is higher or lower in the presence of using the same tax and audit firm. For the impact on tax expense, we use two measures: tax cushion and the U.S. current tax expense.
Cushionit or U.S. Current Taxit = a0 + a1Tax&Auditit + a2Tax&Auditit* Deficiencyit + a3 Deficiencyit + (a4US Tax Paidit + a5Option Tax Benefitit)+ a6Log(Sales)it +a7Propertyit + a8R&Dit + a9Foreignit + Yearit + eit,where
Cushion = U.S. Current Tax Expense (Compustat item #63, or #16-#50 if missing) less unscaled Option Tax Benefit less unscaled U.S. Tax Paid, divided by pretax income (#170).
U.S. Current Tax = U.S. current tax expense (#63), divided by pretax income.
Tax&Audit = 1 if the audit firm also performs tax services, zero otherwise.Deficiency = sum of proposed deficiencies for examinations of post-1989
return-years that were completed during the current year, divided by pretax income in the current year.
(U.S. Tax Paid) = Tax After Credits from the U.S. tax return, divided by pretax income.
(Option Tax Benefit) = the tax benefit from stock options disclosed in the statement of cash flows or statement of stockholders’ equity. Where the amount is not disclosed, we compute the Option Tax Benefit to equal 35 percent times the number of share exercised times the difference between the average stock price for the year and the average exercise price. If the latter computation is negative, we use the maximum stock price for the year in place of the average stock price. Finally, we set the benefit to zero where it is missing or nega-tive.
Log(Sales) = Log of millions of dollars of sales (#12). Property = Net property plant and equipment (#8) divided by assets (#6).R&D = Research and Development Expense (#46 if nonmissing, otherwise
zero) divided by sales.Foreign = absolute value of [foreign pretax income (#273 if nonmissing,
zero otherwise) divided by pretax income].
Gleason and Mills10
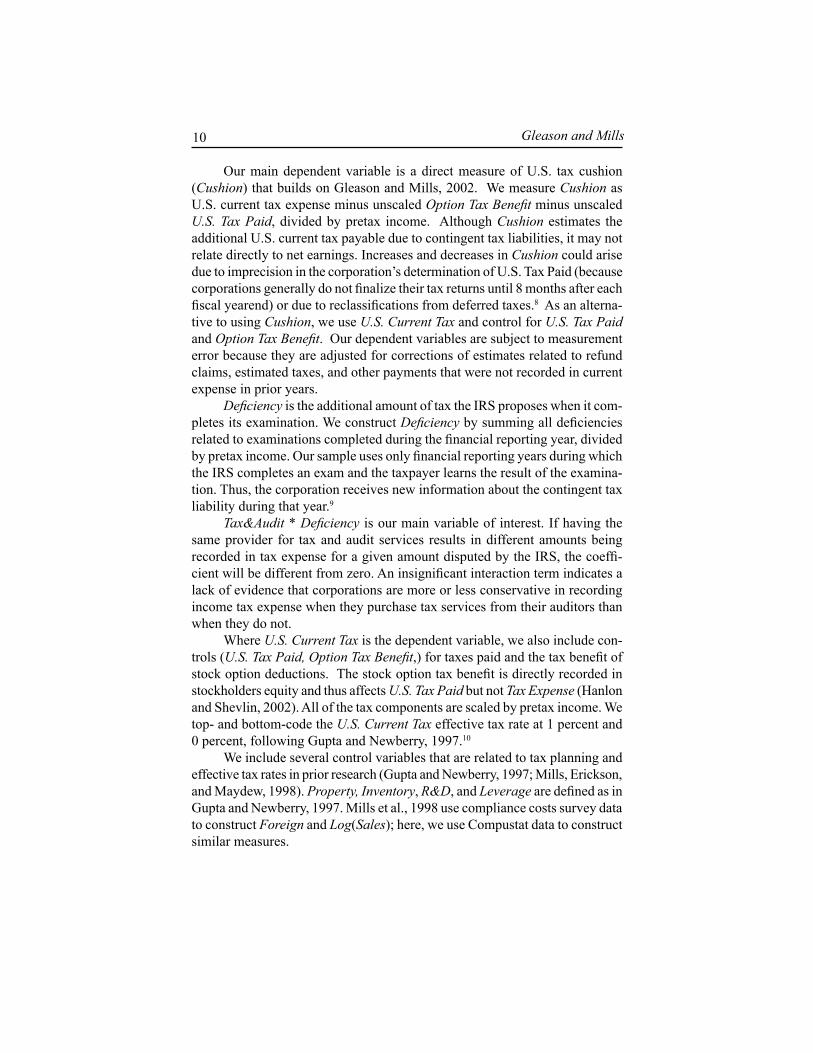
Our main dependent variable is a direct measure of U.S. tax cushion (Cushion) that builds on Gleason and Mills, 2002. We measure Cushion as U.S. current tax expense minus unscaled Option Tax Benefit minus unscaled U.S. Tax Paid, divided by pretax income. Although Cushion estimates the additional U.S. current tax payable due to contingent tax liabilities, it may not relate directly to net earnings. Increases and decreases in Cushion could arise due to imprecision in the corporation’s determination of U.S. Tax Paid (because corporations generally do not finalize their tax returns until 8 months after each fiscal yearend) or due to reclassifications from deferred taxes.8 As an alterna-tive to using Cushion, we use U.S. Current Tax and control for U.S. Tax Paid and Option Tax Benefit. Our dependent variables are subject to measurement error because they are adjusted for corrections of estimates related to refund claims, estimated taxes, and other payments that were not recorded in current expense in prior years.
Deficiency is the additional amount of tax the IRS proposes when it com-pletes its examination. We construct Deficiency by summing all deficiencies related to examinations completed during the financial reporting year, divided by pretax income. Our sample uses only financial reporting years during which the IRS completes an exam and the taxpayer learns the result of the examina-tion. Thus, the corporation receives new information about the contingent tax liability during that year.9
Tax&Audit * Deficiency is our main variable of interest. If having the same provider for tax and audit services results in different amounts being recorded in tax expense for a given amount disputed by the IRS, the coeffi-cient will be different from zero. An insignificant interaction term indicates a lack of evidence that corporations are more or less conservative in recording income tax expense when they purchase tax services from their auditors than when they do not.
Where U.S. Current Tax is the dependent variable, we also include con-trols (U.S. Tax Paid, Option Tax Benefit,) for taxes paid and the tax benefit of stock option deductions. The stock option tax benefit is directly recorded in stockholders equity and thus affects U.S. Tax Paid but not Tax Expense (Hanlon and Shevlin, 2002). All of the tax components are scaled by pretax income. We top- and bottom-code the U.S. Current Tax effective tax rate at 1 percent and 0 percent, following Gupta and Newberry, 1997.10
We include several control variables that are related to tax planning and effective tax rates in prior research (Gupta and Newberry, 1997; Mills, Erickson, and Maydew, 1998). Property, Inventory, R&D, and Leverage are defined as in Gupta and Newberry, 1997. Mills et al., 1998 use compliance costs survey data to construct Foreign and Log(Sales); here, we use Compustat data to construct similar measures.
Is the Tax Expense Estimate Improved or Biased? 11
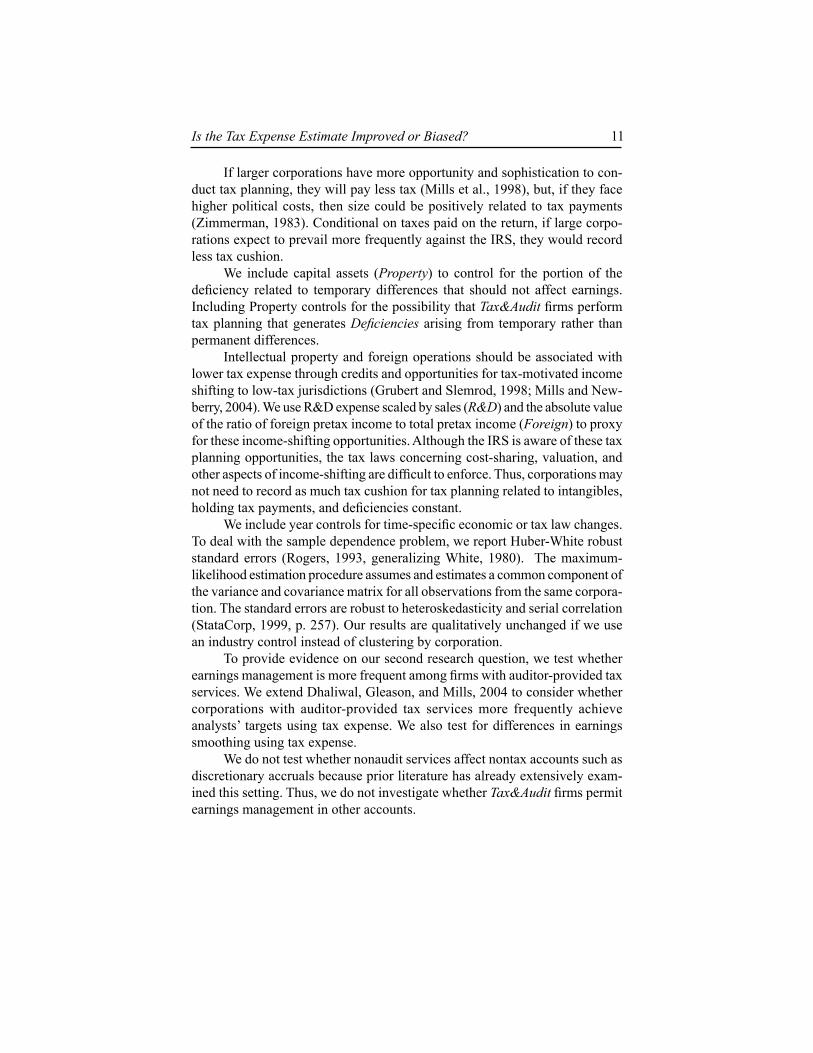
If larger corporations have more opportunity and sophistication to con-duct tax planning, they will pay less tax (Mills et al., 1998), but, if they face higher political costs, then size could be positively related to tax payments (Zimmerman, 1983). Conditional on taxes paid on the return, if large corpo-rations expect to prevail more frequently against the IRS, they would record less tax cushion.
We include capital assets (Property) to control for the portion of the deficiency related to temporary differences that should not affect earnings. Including Property controls for the possibility that Tax&Audit firms perform tax planning that generates Deficiencies arising from temporary rather than permanent differences.
Intellectual property and foreign operations should be associated with lower tax expense through credits and opportunities for tax-motivated income shifting to low-tax jurisdictions (Grubert and Slemrod, 1998; Mills and New-berry, 2004). We use R&D expense scaled by sales (R&D) and the absolute value of the ratio of foreign pretax income to total pretax income (Foreign) to proxy for these income-shifting opportunities. Although the IRS is aware of these tax planning opportunities, the tax laws concerning cost-sharing, valuation, and other aspects of income-shifting are difficult to enforce. Thus, corporations may not need to record as much tax cushion for tax planning related to intangibles, holding tax payments, and deficiencies constant.
We include year controls for time-specific economic or tax law changes. To deal with the sample dependence problem, we report Huber-White robust standard errors (Rogers, 1993, generalizing White, 1980). The maximum- likelihood estimation procedure assumes and estimates a common component of the variance and covariance matrix for all observations from the same corpora-tion. The standard errors are robust to heteroskedasticity and serial correlation (StataCorp, 1999, p. 257). Our results are qualitatively unchanged if we use an industry control instead of clustering by corporation.
To provide evidence on our second research question, we test whether earnings management is more frequent among firms with auditor-provided tax services. We extend Dhaliwal, Gleason, and Mills, 2004 to consider whether corporations with auditor-provided tax services more frequently achieve analysts’ targets using tax expense. We also test for differences in earnings smoothing using tax expense.
We do not test whether nonaudit services affect nontax accounts such as discretionary accruals because prior literature has already extensively exam-ined this setting. Thus, we do not investigate whether Tax&Audit firms permit earnings management in other accounts.
Gleason and Mills12
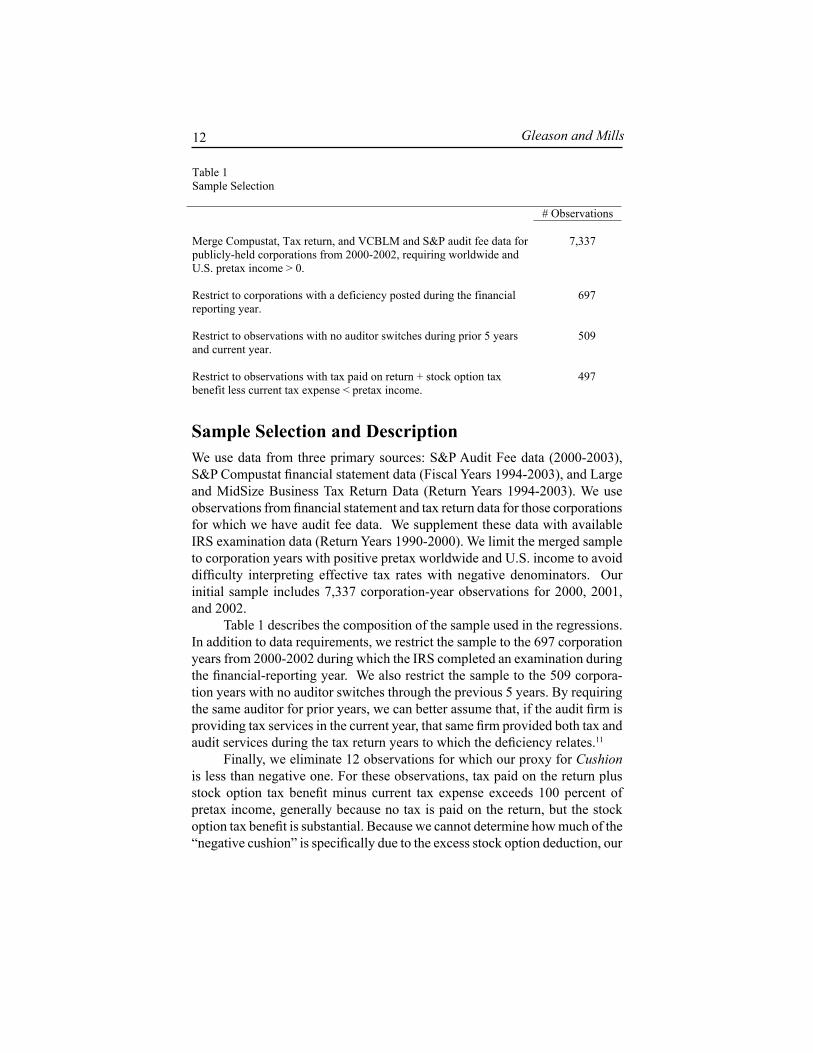
Table 1 Sample Selection
# Observations
Merge Compustat, Tax return, and VCBLM and S&P audit fee data for publicly-held corporations from 2000-2002, requiring worldwide and U.S. pretax income > 0.
7,337
Restrict to corporations with a deficiency posted during the financial reporting year.
697
Restrict to observations with no auditor switches during prior 5 years and current year.
509
Restrict to observations with tax paid on return + stock option tax benefit less current tax expense < pretax income.
497
Sample Selection and DescriptionWe use data from three primary sources: S&P Audit Fee data (2000-2003), S&P Compustat financial statement data (Fiscal Years 1994-2003), and Large and MidSize Business Tax Return Data (Return Years 1994-2003). We use observations from financial statement and tax return data for those corporations for which we have audit fee data. We supplement these data with available IRS examination data (Return Years 1990-2000). We limit the merged sample to corporation years with positive pretax worldwide and U.S. income to avoid difficulty interpreting effective tax rates with negative denominators. Our initial sample includes 7,337 corporation-year observations for 2000, 2001, and 2002.
Table 1 describes the composition of the sample used in the regressions. In addition to data requirements, we restrict the sample to the 697 corporation years from 2000-2002 during which the IRS completed an examination during the financial-reporting year. We also restrict the sample to the 509 corpora-tion years with no auditor switches through the previous 5 years. By requiring the same auditor for prior years, we can better assume that, if the audit firm is providing tax services in the current year, that same firm provided both tax and audit services during the tax return years to which the deficiency relates.11
Finally, we eliminate 12 observations for which our proxy for Cushion is less than negative one. For these observations, tax paid on the return plus stock option tax benefit minus current tax expense exceeds 100 percent of pretax income, generally because no tax is paid on the return, but the stock option tax benefit is substantial. Because we cannot determine how much of the “negative cushion” is specifically due to the excess stock option deduction, our
Is the Tax Expense Estimate Improved or Biased? 13
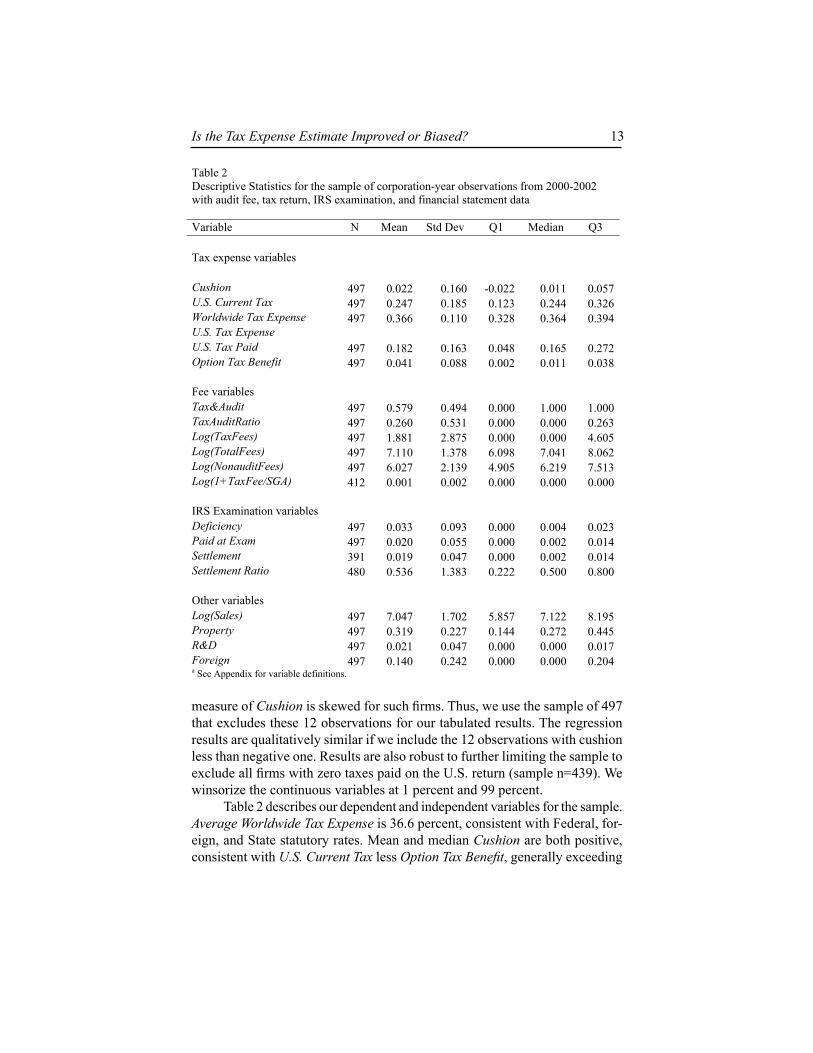
measure of Cushion is skewed for such firms. Thus, we use the sample of 497 that excludes these 12 observations for our tabulated results. The regression results are qualitatively similar if we include the 12 observations with cushion less than negative one. Results are also robust to further limiting the sample to exclude all firms with zero taxes paid on the U.S. return (sample n=439). We winsorize the continuous variables at 1 percent and 99 percent.
Table 2 describes our dependent and independent variables for the sample. Average Worldwide Tax Expense is 36.6 percent, consistent with Federal, for-eign, and State statutory rates. Mean and median Cushion are both positive, consistent with U.S. Current Tax less Option Tax Benefit, generally exceeding
Table 2 Descriptive Statistics for the sample of corporation-year observations from 2000-2002with audit fee, tax return, IRS examination, and financial statement data
Variable N Mean Std Dev Q1 Median Q3
Tax expense variables
Cushion 497 0.022 0.160 -0.022 0.011 0.057U.S. Current Tax 497 0.247 0.185 0.123 0.244 0.326Worldwide Tax Expense 497 0.366 0.110 0.328 0.364 0.394U.S. Tax Expense U.S. Tax Paid 497 0.182 0.163 0.048 0.165 0.272Option Tax Benefit 497 0.041 0.088 0.002 0.011 0.038
Fee variables Tax&Audit 497 0.579 0.494 0.000 1.000 1.000TaxAuditRatio 497 0.260 0.531 0.000 0.000 0.263Log(TaxFees) 497 1.881 2.875 0.000 0.000 4.605Log(TotalFees) 497 7.110 1.378 6.098 7.041 8.062Log(NonauditFees) 497 6.027 2.139 4.905 6.219 7.513Log(1+TaxFee/SGA) 412 0.001 0.002 0.000 0.000 0.000 IRS Examination variables Deficiency 497 0.033 0.093 0.000 0.004 0.023Paid at Exam 497 0.020 0.055 0.000 0.002 0.014Settlement 391 0.019 0.047 0.000 0.002 0.014Settlement Ratio 480 0.536 1.383 0.222 0.500 0.800
Other variables Log(Sales) 497 7.047 1.702 5.857 7.122 8.195Property 497 0.319 0.227 0.144 0.272 0.445R&D 497 0.021 0.047 0.000 0.000 0.017Foreign 497 0.140 0.242 0.000 0.000 0.204a See Appendix for variable definitions.

Gleason and Mills14
U.S. Tax Paid in the years in which the IRS completes an examination. Fifty-eight percent of the observations use the same tax and audit firm.12 Tax fees represent about 26 percent of audit fees on average. Average Deficiency of 3.3 percent of pretax income exceeds the third quartile, indicating that Deficiency is skewed, with many corporations having small or zero deficiencies. Our sample corporations are large, consistent with a high likelihood of IRS audit.13 The settlement ratio is 53.6 percent with a large standard deviation, arising from some negative settlements (IRS issues a refund after claims) or settlements in excess of 100 percent. Because the settlement ratio is not a regression vari-able, we do not trim or delete these outliers, although our results are robust to dropping these observations. Net depreciable property comprises 32 percent of
Table 3 Correlation and Tests of Differences in Means
Panel A: Correlations of tax measures with explanatory and control variables (N=497)
Cushion U.S. Current Tax Deficiency 0.27721 0.21043
<.0001 <.0001
Paid at Exam 0.18845 0.12475 <.0001 0.0054
Settlement 0.25234 0.13353 N=391 <.0001 0.0082
Tax&Audit -0.12458 -0.06674 0.0054 0.1373
TaxAuditRatio 0.00728 0.00533 0.8714 0.9056
Log(Sales) 0.07854 0.11633 0.0802 0.0094
Property -0.02437 -0.12598 0.5879 0.0049
R&D -0.0849 -0.01552 0.0586 0.7301
Foreign 0.05154 0.27784 0.2515 <.0001
a See Appendix for variable definitions.
Is the Tax Expense Estimate Improved or Biased? 15
assets. Research and development expenses are 2.1 percent of sales, and foreign pretax income is 14 percent of worldwide pretax income in absolute value.
Table 3 provides univariate tests, including correlations of dependent with independent variables and t-tests of mean differences. Deficiency, Paid at Exam, and Settlement are positively correlated with Cushion and U.S. Current Tax, consistent with current tax expense, including not only taxes paid but also the probable loss on contingent liabilities.
Tax&Audit is not correlated with U.S. Current Tax but is negatively cor-related with Tax Cushion. The ratio of auditor-provided tax fees to audit fees is uncorrelated with Cushion or U.S. Current Tax. Log(Sales) is positively cor-related with U.S. Current Tax but only weakly correlated with Cushion. R&D is negatively correlated with Cushion. Foreign is positively correlated with U.S. Current Tax, and Property is negatively correlated with U.S. Current Tax.
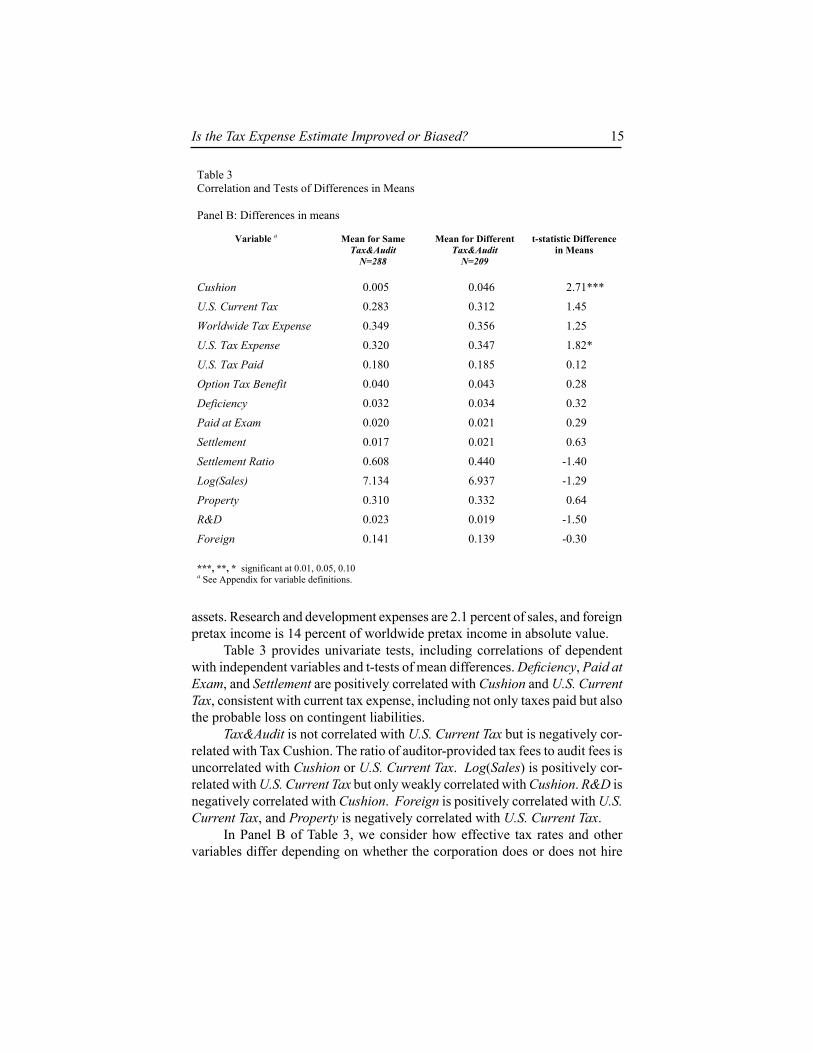
In Panel B of Table 3, we consider how effective tax rates and other variables differ depending on whether the corporation does or does not hire
Table 3 Correlation and Tests of Differences in Means
Panel B: Differences in means
Variable a Mean for Same Tax&Audit
N=288
Mean for Different Tax&Audit
N=209
t-statistic Difference in Means
Cushion 0.005 0.046 2.71***
U.S. Current Tax 0.283 0.312 1.45
Worldwide Tax Expense 0.349 0.356 1.25
U.S. Tax Expense 0.320 0.347 1.82*
U.S. Tax Paid 0.180 0.185 0.12
Option Tax Benefit 0.040 0.043 0.28
Deficiency 0.032 0.034 0.32
Paid at Exam 0.020 0.021 0.29
Settlement 0.017 0.021 0.63
Settlement Ratio 0.608 0.440 -1.40
Log(Sales) 7.134 6.937 -1.29
Property 0.310 0.332 0.64
R&D 0.023 0.019 -1.50
Foreign 0.141 0.139 -0.30
***, **, * significant at 0.01, 0.05, 0.10 a See Appendix for variable definitions.

Gleason and Mills16
its audit firm to perform tax services. Using the same tax and audit firm is associated with lower Cushion and U.S. Tax Expense. However, using the same tax and audit firm does not result in lower Worldwide Tax Expense, U.S. Current Tax, or U.S. Tax Paid. Thus, we find no univariate evidence that audi-tor-provided tax services are more effective than nonauditor services for tax planning, which could include consulting by nonauditor CPA firms, lawyers, and inhouse expertise.14
We find no evidence that using the same tax and audit firm reduces deficiencies, amounts PaidAtExam, settlements, or the percent of deficiency that is settled. Finding no differences in examination outcomes between the groups suggests that any differences in Tax Expense or Cushion in the regres-sion results to follow are not due to underlying differences in examination outcomes. Finally, there are no differences in size, capital intensity, R&D, or foreign income percent.
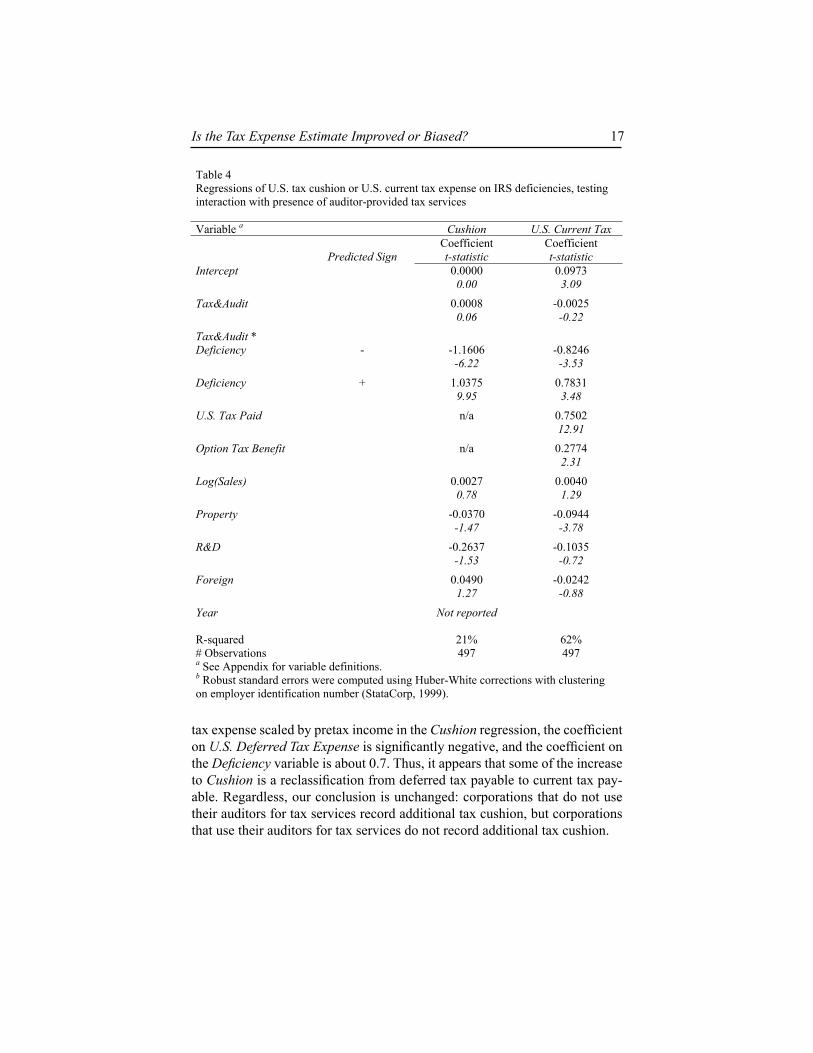
Regression ResultsTable 4 reports results of estimating our regression model to test our first re-search question and to provide partial evidence concerning our second research question. Cushion and U.S. Current Tax are significantly (p<0.001) positively related to Deficiency. This main effect shows that corporations record additional tax expense when they do not use auditor-provided tax services.
Based on the significant negative interaction of Tax&Audit*Deficiency, corporations that use auditor-provided tax services record less tax deficiency in tax expense in the year the IRS completes its examinations. Untabulated F tests show that the net coefficients on Deficiency for corporations with the same tax and audit firm (Tax&Audit * Deficiency + Deficiency) are not significantly different from zero. Thus, corporations using the same tax and audit firm do not record more tax expense when the IRS proposes a deficiency.
We use the dummy variable because the textual description of auditor-provided tax services in 2000 and 2001 often mentions the presence of tax consulting without disclosing the amount of the fee. Thus, we believe our dummy variable better measures the presence of auditor-provided tax services. In robustness tests, we use the ratio of tax fees to total audit fees (audit fees and audit-related fees) or a dummy variable for this ratio being in the upper quartile in place of a dummy variable for the presence of auditor-provided tax services. Results from substituting a continuous explanatory variable are mixed, possibly because we necessarily assign zero to observations where the text description mentions the presence of tax services.15
Because it is possible that some corporations record reserves in deferred tax expense during our sample period, we introduce U.S. Deferred Tax Expense as a control in a robustness test. Specifically, if we include U.S. deferred income
Is the Tax Expense Estimate Improved or Biased? 17
tax expense scaled by pretax income in the Cushion regression, the coefficient on U.S. Deferred Tax Expense is significantly negative, and the coefficient on the Deficiency variable is about 0.7. Thus, it appears that some of the increase to Cushion is a reclassification from deferred tax payable to current tax pay-able. Regardless, our conclusion is unchanged: corporations that do not use their auditors for tax services record additional tax cushion, but corporations that use their auditors for tax services do not record additional tax cushion.
Table 4 Regressions of U.S. tax cushion or U.S. current tax expense on IRS deficiencies, testing interaction with presence of auditor-provided tax services
Variable a Cushion U.S. Current Tax
Predicted SignCoefficientt-statistic
Coefficientt-statistic
Intercept 0.0000 0.0973 0.00 3.09
Tax&Audit 0.0008 -0.0025 0.06 -0.22
Tax&Audit * Deficiency - -1.1606 -0.8246
-6.22 -3.53 Deficiency + 1.0375 0.7831
9.95 3.48 U.S. Tax Paid n/a 0.7502
12.91 Option Tax Benefit n/a 0.2774
2.31 Log(Sales) 0.0027 0.0040
0.78 1.29 Property -0.0370 -0.0944
-1.47 -3.78 R&D -0.2637 -0.1035
-1.53 -0.72 Foreign 0.0490 -0.0242
1.27 -0.88 Year Not reported
R-squared 21% 62% # Observations 497 497 a See Appendix for variable definitions. b Robust standard errors were computed using Huber-White corrections with clustering on employer identification number (StataCorp, 1999).
Gleason and Mills18
Control variables are consistent with the composition of effective tax rates. Current tax expense is positively related to the noncushion components of U.S. Tax Paid and Option Tax Benefit.16 As expected, Property is associated with lower current tax expense.
An alternative explanation for the negative interaction coefficient on Deficiency is that corporations using auditor-provided tax services postpone recording the tax cushion until after the year the IRS completes its examina-tion (when we measure Deficiency). If so, our interpretation that Tax&Audit firms are adequately provided when the IRS completes its examination would be incorrect.
In untabulated tests, we consider whether Tax&Audit firms record tax contingencies prior to the year the IRS completes its examination. In place of Deficiency, we use the amount of the deficiency that the corporation pays (Paid at Exam) rather than appealing. Paid at Exam equals the sum of all payments related to examinations finished during the financial reporting year, scaled by pretax income. Paid at Exam represents the minimum tax dispute lost because the corporation concedes this amount.17 The corporation must fully accrue taxes Paid at Exam before or during the fiscal year to equal the credit to cash. Using this measure also eliminates differences across corporations in the likelihood of prevailing. Our results are qualitatively similar to Table 4. The coefficients relating either Cushion or U.S. Current Tax to PaidAtExam are nearly 1, sug-gesting that corporations that do not use the same tax and audit firm have pre-viously recorded little of the amount they concede on examination. Consistent with Table 4, each interaction coefficient is negative and significant, and the net coefficient is not different from zero. Thus, corporations using the same tax and audit firm do not record additional tax expense even for payments that they make at examination, suggesting their reserve was adequate in advance of any payment.
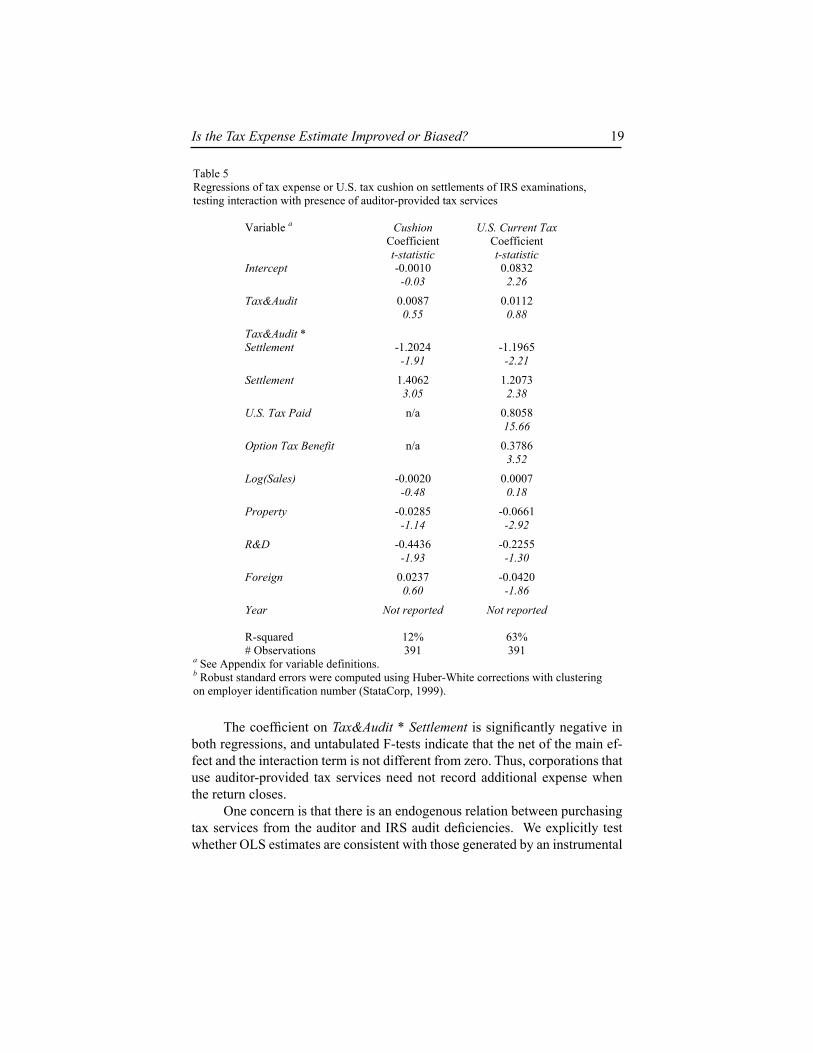
In Table 5, we test whether corporations postpone recording tax contin-gencies until the year of final settlement. To distinguish between the possibili-ties that Tax&Audit firms postpone recognition of contingencies and that they record more cushion prior to learning the Deficiency, we examine the relation between Tax Expense and Settlement. Because the taxpayer can make partial payments during the examination, appeals, or counsel process, Settlement is a noisy measure of new information during the year the return closes.
Results in Table 5 suggest that when the return year closes, firms generally record additional Cushion and U.S. Current Tax. The coefficients on Settle-ment are not significantly different from 1. As in the Deficiency regression, if we introduce U.S. Deferred Tax as a control variable in untabulated tests, the coefficient on Settlement in the Cushion regression decreases to 0.93.
Is the Tax Expense Estimate Improved or Biased? 19
The coefficient on Tax&Audit * Settlement is significantly negative in both regressions, and untabulated F-tests indicate that the net of the main ef-fect and the interaction term is not different from zero. Thus, corporations that use auditor-provided tax services need not record additional expense when the return closes.
One concern is that there is an endogenous relation between purchasing tax services from the auditor and IRS audit deficiencies. We explicitly test whether OLS estimates are consistent with those generated by an instrumental
Table 5 Regressions of tax expense or U.S. tax cushion on settlements of IRS examinations, testing interaction with presence of auditor-provided tax services
Variable a Cushion U.S. Current Tax Coefficientt-statistic
Coefficientt-statistic
Intercept -0.0010 0.0832 -0.03 2.26
Tax&Audit 0.0087 0.0112 0.55 0.88
Tax&Audit * Settlement -1.2024 -1.1965
-1.91 -2.21 Settlement 1.4062 1.2073
3.05 2.38 U.S. Tax Paid n/a 0.8058
15.66 Option Tax Benefit n/a 0.3786
3.52 Log(Sales) -0.0020 0.0007
-0.48 0.18 Property -0.0285 -0.0661
-1.14 -2.92 R&D -0.4436 -0.2255
-1.93 -1.30 Foreign 0.0237 -0.0420
0.60 -1.86 Year Not reported Not reported
R-squared 12% 63% # Observations 391 391
a See Appendix for variable definitions. b Robust standard errors were computed using Huber-White corrections with clustering on employer identification number (StataCorp, 1999).

Gleason and Mills20
variables approach using an augmented regression test suggested by Davidson and MacKinnon, 1993. The Davidson and MacKinnon test is a general endo-geneity test appropriate where heteroskedasticity or serial correlation is pres-ent in the error term. This test of endogeneity requires us to identify variables that are likely associated with the probability of a firm purchasing tax services from the auditor. Prior studies (Antle, 2002; Omer, Bedard, and Falsetta, 2006a; and Omer, Bedard, and Falsetta, 2006b) estimate nonaudit or tax fees as part of two-stage estimations to predict nonaudit or tax fees using variables such as firm size, foreign operations, log of statement of cash flow taxes paid, leverage (agency), quick ratio (risk), book-to-market ratio (risk), whether the firm reports negative net income (risk), audit firm tenure, qualified opinions (risk),and whether the audit firm is one of the “Big 4.” A limitation of many of these variables is that they are likely to be associated with the more general need for externally provided tax services, rather than the specific decision to acquire these services from the audit firm.18
For firms that need outside tax services, a number of factors may affect the decision to purchase tax services from their auditors. First, firms that frequently challenge IRS deficiencies are likely to benefit from the attorney-client privilege and thus are more likely to purchase services from an attorney rather than the auditor. We use the IRS examination data to construct a measure (Combative) of the average percentage of deficiency that the taxpayer decides to appeal. Finally, firms with option plans are more likely to use the auditor for executive tax services because the auditor is already familiar with the option plan and can provide tax services more efficiently. We use Execucomp data to measure the proportion of executive compensation related to stock option value.19 Requiring Execucomp data shrinks our sample to 270 observations. Our tests for endogene-ity are insignificant when either U.S. Current Tax or Cushion is the dependent variable. Nevertheless, we reestimate our regressions using an instrumental variables approach because Greene, 2003 indicates that endogeneity may be a problem even when tests are negative. We add OptionPct and Combative to the instruments used by Omer, Bedard, and Falsetta, 2006 and Antle et al., 2002. Our results are robust to including controls for endogeneity.20
Tests of Earnings ManagementWe triangulate our results on the recording of tax expense with evidence on earnings management. We test whether corporations more frequently beat benchmarks or smooth earnings using tax expense if they engage their audi-tors to provide tax services. Gleason and Mills, 2006 and Dhaliwal, Gleason, and Mills, 2004 together find that the discontinuity around beating analysts’ annual earnings forecasts is explained in part by corporations decreasing tax
Is the Tax Expense Estimate Improved or Biased? 21
expense to beat the forecast. We focus on incentives to meet analysts’ forecast benchmarks because they are relevant for the large publicly traded firms that comprise our sample (Brown and Caylor, 2005). Likewise, incentives to smooth earnings are present for broad samples of firms. Thus, these settings allow us to test for fine degrees of earnings management in our sample.
We use quarterly data from Compustat and I/B/E/S to construct a measure (Tax_Beat) of whether a decrease in the effective tax rate from the prior quarter permitted the corporation to beat analysts’ forecasts. We include only quar-ters two through four in our tests, following evidence in Comprix, Mills, and Schmidt, 2006 that firm behavior is substantially different in the first quarter.
We conduct chi-square tests of whether the proportion of corporations for which Tax&Audit =1 and decreases in tax expense permit them to beat the forecast is greater than the proportion of corporations that do not use auditor-provided tax services (Tax&Audit = 0) and beat the forecast due to a decrease in tax expense.
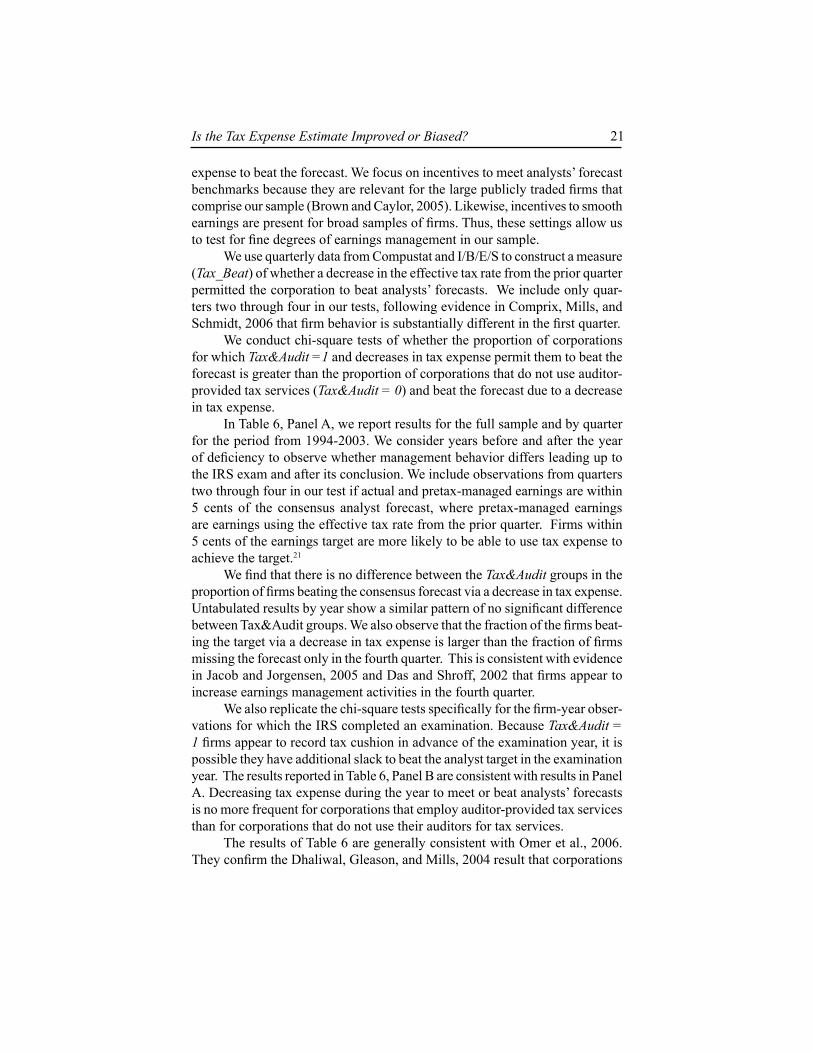
In Table 6, Panel A, we report results for the full sample and by quarter for the period from 1994-2003. We consider years before and after the year of deficiency to observe whether management behavior differs leading up to the IRS exam and after its conclusion. We include observations from quarters two through four in our test if actual and pretax-managed earnings are within 5 cents of the consensus analyst forecast, where pretax-managed earnings are earnings using the effective tax rate from the prior quarter. Firms within 5 cents of the earnings target are more likely to be able to use tax expense to achieve the target.21
We find that there is no difference between the Tax&Audit groups in the proportion of firms beating the consensus forecast via a decrease in tax expense. Untabulated results by year show a similar pattern of no significant difference between Tax&Audit groups. We also observe that the fraction of the firms beat-ing the target via a decrease in tax expense is larger than the fraction of firms missing the forecast only in the fourth quarter. This is consistent with evidence in Jacob and Jorgensen, 2005 and Das and Shroff, 2002 that firms appear to increase earnings management activities in the fourth quarter.
We also replicate the chi-square tests specifically for the firm-year obser-vations for which the IRS completed an examination. Because Tax&Audit = 1 firms appear to record tax cushion in advance of the examination year, it is possible they have additional slack to beat the analyst target in the examination year. The results reported in Table 6, Panel B are consistent with results in Panel A. Decreasing tax expense during the year to meet or beat analysts’ forecasts is no more frequent for corporations that employ auditor-provided tax services than for corporations that do not use their auditors for tax services.
The results of Table 6 are generally consistent with Omer et al., 2006. They confirm the Dhaliwal, Gleason, and Mills, 2004 result that corporations

Gleason and Mills22
Table 6 Chi-square tests of whether, among corporations that would miss an analyst target absent a decrease in tax expense, corporations using auditor-provided tax services achieve analysts’ earnings targets more frequently Panel A: Exam completion year and pre- and post-period (1994-2003)a
Full Sample Missed consensus Decreased Tax Expense
to beat consensus Column Total
(column%)
Tax&Audit = 0 462
(41%)364
(40%)826
(41%)
Tax&Audit = 1 661
(59%)547
(60%)1208(59%)
Row Total 1123 911 2034 2 = 0.59 (p-value = 0.44)
Second Quarter
Missed consensus Decreased Tax Expense to beat consensus
Column Total (column%)
Tax&Audit = 0 160
(42%)106
(39%)266
(41%)
Tax&Audit = 1 220
(58%)165
(61%)385
(59%)
Row Total 380 271 651 2 = 0.59 (p-value = 0.44)
Third Quarter
Missed consensus Decreased Tax Expense to beat consensus
Column Total (column%)
Tax&Audit = 0 180
(40%)127
(45%)307
(42%)
Tax&Audit = 1 268
(60%)152
(54%)420
(58%)
Row Total 448 279 727 2 = 2.0105 (p-value = 0.16)
Fourth Quarter
Missed consensus Decreased Tax Expense to beat consensus
Column Total (column%)
Tax&Audit = 0 122
(41%)131
(36%)253
(42%)
Tax&Audit = 1 173
(59%)230
(64%)403
(58%)
Row Total 295 361 656 2 = 1.7598 (p-value = 0.18)

Is the Tax Expense Estimate Improved or Biased? 23
that would otherwise miss their analysts’ earnings targets have greater decreases in their fourth quarter effective tax rates than do corporations that would meet the target. Although firms that pay greater fees to their auditors have larger decreases, they also find that corporations that do not engage their auditors for tax services also decrease tax rates to beat earnings. Similar to our tests, they do not find more frequent earnings management among firms that engage their auditors for tax services.
We also test whether corporations for whom Tax&Audit =1 have smoother earnings than other corporations. One possible reason to record higher levels of cushion is to build a “cookie jar” in order to smooth earnings in the cur-rent and subsequent periods. To measure smoothing, we adapt the smoothing measures used by Land and Lang, 2002; Leuz, Nanda, and Wysocki, 2003; Lang, Ready, and Wilson, 2005; and Myers, Myers, and Skinner, 2005. In prior research, smoothing is measured as the degree of negative correlation between the change in discretionary accruals and the change in prediscretion-ary income. In order to focus on the effect of any tax expense management, we measure the correlation between the change in tax-managed earnings and pre-managed income, defined as:
Tax-managed earnings = {pretax earnings per share * (EtrQt-1- EtrQt)}Pretax-managed earnings = {pretax earnings per share * (1-EtrQ3)}
Table 6 Chi-square tests of whether, among corporations that would miss an analyst target absent a decrease in tax expense, corporations using auditor-provided tax services achieve analysts’ earnings targets more frequently Panel A: Exam completion year and pre- and post-period (1994-2003)a
Full Sample Missed consensus Decreased Tax Expense
to beat consensus Column Total
(column%)
Tax&Audit = 0 462
(41%)364
(40%)826
(41%)
Tax&Audit = 1 661
(59%)547
(60%)1208
(59%)
Row Total 1123 911 2034 2 = 0.59 (p-value = 0.44)
Second Quarter
Missed consensus Decreased Tax Expense to beat consensus
Column Total (column%)
Tax&Audit = 0 160
(42%)106
(39%)266
(41%)
Tax&Audit = 1 220
(58%)165
(61%)385
(59%)
Row Total 380 271 651 2 = 0.59 (p-value = 0.44)
Third Quarter
Missed consensus Decreased Tax Expense to beat consensus
Column Total (column%)
Tax&Audit = 0 180
(40%)127
(45%)307
(42%)
Tax&Audit = 1 268
(60%)152
(54%)420
(58%)
Row Total 448 279 727 2 = 2.0105 (p-value = 0.16)
Fourth Quarter
Missed consensus Decreased Tax Expense to beat consensus
Column Total (column%)
Tax&Audit = 0 122
(41%)131
(36%)253
(42%)
Tax&Audit = 1 173
(59%)230
(64%)403
(58%)
Row Total 295 361 656 2 = 1.7598 (p-value = 0.18)
Table 6 Chi-square tests of whether, among corporations that would miss an analyst target absent a decrease in tax expense, corporations using auditor-provided tax services achieve analysts’ earnings targets more frequently--Continued Panel B: Exam completion year only b
Full Sample Missed consensus Decreased Tax Expense
to beat consensus Column Total
(column%)
Tax&Audit = 0 140
(43%)104
(42%)244
(43%)
Tax&Audit = 1 184
(57%)145
(58%)329
(57%)
Row Total 324 249 573 2 = 0.12 (p-value = 0.73)
a Observations for sample firms for quarters two through four in fiscal years between 1994 and 2003 are included if actual and pretax managed earnings are within 5 cents of the consensus analyst forecast. Pretax-managed earnings are defined as earnings computed using the prior quarter’s effective tax rate. b Observations for sample firms for quarters two through four in the fiscal year in which the IRS examination is completed are included if actual and pretax managed earnings are within 5 cents of the consensus analyst forecast.
Gleason and Mills24
We again use quarters two through four and measure the change as the difference between the current quarter and the same quarter of the prior year. We use all quarters from 1994-2005 with available data. Our sample of firms is reduced to 420 corporations with sufficient Compustat data for the test (n = 248 for Tax&Audit =1). In untabulated tests, we find significant negative correlations for corporations for which Tax&Audit =1 (mean ρ = -0.703) and other corporations (mean ρ = -0.701). Individually, the negative correlations are consistent with changes in quarterly effective tax rates helping to smooth earnings.22 However, the difference between the groups is not statistically significant. Thus, the test does not provide any evidence that Tax&Audit =1 corporations smooth earnings via tax expense more than other corporations. Overall, we find no evidence that having the same tax and audit firm is associ-ated with increased occurrence of earnings management or smoothing via tax expense. Therefore, we infer that auditor-provided tax services do not impair independence.
Supplemental Tests Prior research considers other circumstances that may impair auditor indepen-dence. DeAngelo, 1981 suggests that the audit fee can result in an economic bond between the auditor and client that may impair auditor independence. Kinney and Libby, 2002 suggest that the total of audit and nonaudit fees may be an appropriate measure of the economic bond and the potential for impair-ment of auditor independence. We consider both total fees and nonaudit fees other than tax as control variables in robustness tests.
In untabulated tests, we find that our result that Cushion is negatively related to Tax&Audit*Deficiency is robust to including Log (TotalFee) as a main effect and as an interaction with Deficiency. TotalFee is the sum of audit, information systems, tax, and other fees from the S&P database. Our results are qualitatively the same when we use nonaudit fees other than tax as our control variable for economic bond.
The skewed distribution of Deficiency indicates there are some large outliers. Our results are robust to dropping the six observations for which Deficiency exceeds half of pretax income.
The requirement to disclose the tax component of nonaudit services did not take effect until 2002. Although our sample for 2002 alone is quite small (n=41) because we only have tax data through June 2002 fiscal yearends, results are qualitatively the same in this small sample that excludes the volun-tary reporting years. Thus, we conclude that our results are not due to sample selection bias.
We include dummy variables for each of the Big 5 auditors to learn whether amounts accrued differ significantly across firms. Our results are ro-
Is the Tax Expense Estimate Improved or Biased? 25
bust to including dummy variables for each of the Big 5 auditors. We omit this from the tabulation for simplicity because none of the dummies is significantly different from zero.
An alternative explanation for our findings is that, when auditors provide tax services to their audit clients, they recommend tax planning schemes that result in challenges to temporary differences rather than permanent differences and that, in other circumstances, tax planning schemes result primarily in per-manent differences. To the extent the IRS proposes a deficiency related to a permanent item, the claimed tax if lost affects earnings directly. To the extent the deficiency relates to a temporary item, the claimed tax if lost accelerates the payment of tax already recorded in earnings. If Tax&Audit firms have more challenges related to temporary differences, they need not generally record an increase in total tax expense because the Deficiency would affect book earn-ings only through tax penalties and interest expense, which would generally be less than the related tax.
To address potential differences among firms based on relative amounts of permanent and temporary differences, we substitute total TaxExpense, which reflects the net effect of both current and deferred taxes on income, as the dependent variable. Our inferences are unchanged. The smaller coefficient relating Deficiency to total TaxExpense is fully reversed through the negative interaction term. Tax&Audit firms do not record additional total tax payable at the Deficiency date. Recall from Table 3, Panel B that the presence of auditor-provided tax services is not associated with lower tax rates, lower Deficiency, or lower settlement ratios.
The IRS could assess interest and penalties for challenges of both per-manent and temporary differences. FIN 48 suggests that practice concerning classification of interest and penalties varied during our sample period. How-ever, we have no reason to expect that variation in how interest and penalties are classified is correlated with auditor-provided tax services.23 Rather than standardizing practice, the new Interpretation requires that corporations disclose where in the income statement the firm classifies accrued interest and penalties. Future research could explore incentives related to classification once additional data become available.
ConclusionAlthough few auditor-provided tax services were prohibited by Sarbanes Oxley, the requirement to obtain board of directors approval for tax services, and the constraints imposed by the SEC and the PCAOB, have substantially reduced auditor-provided tax services. However, there is no prior evidence that auditor-provided tax services impair independence. Our study focuses on a tax setting where the link between the nonaudit services and financial reporting choices is

Gleason and Mills26
closely linked. By using IRS tax deficiency and tax return data, we investigate whether the relationship between tax expense and deficiencies is lower in the presence of auditor-provided tax services.
Our results suggest that only corporations that do not engage their audi-tors to provide tax services record additional tax expense for tax contingencies when they learn the results of an IRS examination. In contrast, corporations do not record any additional tax expense during the deficiency year when they use auditor-provided tax services. Further, the latter group of corporations does not require additional tax expense related to taxes conceded at examination or total taxes paid in settlement of the dispute. Corporations that purchase auditor-provided tax services do not use tax expense decreases to beat earnings targets or smooth earnings more than other corporations. We interpret these results as most consistent with corporations that engage their auditors to provide tax services correctly estimating potential contingent liabilities prior to completion of the IRS examination. Financial statement users benefit from more precise estimates of tax expenses.
Investigating the relation between tax expense and deficiency also has implications for corporate tax compliance. As the IRS works to complete ex-aminations from recent years that predate tougher tax shelter disclosure and penalty rules, evidence about the role of auditor-provided tax services on tax compliance could assist IRS examinations. Specifically, the IRS is widening its practice of requesting auditor workpapers related to tax cushion in the context of listed transactions (for tax shelters). Learning whether groups of taxpayers record tax cushion differently could guide their choices about requesting audit workpapers, especially in light of FIN 48’s requirements for schedules that detail jurisdiction and reasons for tax cushion.
Future research can reinvestigate the relation between recorded tax contin-gencies and auditor-provided tax services after the dust settles on SOX and FIN 48. Whether separating tax and audit services for a given client achieves inde-pendence is another open question. Any one of the Big 4 firms will sometimes find itself as the auditor for some clients and as the tax provider for other clients. Over repeated time periods, the auditors may become cooperative with other firms’ tax departments, further weakening the independence arguments.
AcknowledgmentsWe appreciate suggestions from Brad Barber, Jennifer Blouin, Jennifer Brown, Wayne Guay, William Kinney, Edward Maydew, Tom Omer, Jeff Schatzberg, Casey Schwab, Andrew Schmidt, Robert Yetman, David Weber, and workshop participants at the 2006 American Accounting Association Annual Meeting, the University of California-Davis, the 2006 Internal Revenue Service Research Conference, the University of Iowa, the University of North Carolina 2006 Tax
Is the Tax Expense Estimate Improved or Biased? 27
Symposium, the University of Pennsylvania, and the University of Texas. We also thank William Kress for excellent research assistance.
The Internal Revenue Service (IRS) provided confidential tax informa-tion to one of the authors pursuant to provisions of the Internal Revenue Code that allow disclosure of information to a contractor to the extent necessary to perform a research contract for the IRS. None of the confidential tax informa-tion received from the IRS is disclosed in this article. Statistical aggregates were used so that a specific taxpayer cannot be identified from information supplied by the IRS.
Endnotes1 Public Company Accounting Oversight Board Auditor Independence Tax
Services Roundtable, unofficial transcript, 2004-07-14_roundtable_tran-script.pdf, www.pcaob.org
2 Univariate tests indicate that corporations that purchase auditor-provided tax services do not differ from other corporations in the amount of U.S. taxes paid when the return is filed or in the results of the IRS examina-tions (frequency, deficiency, concessions, or settlements). Thus, we attri-bute any differences in recorded tax expense to the effect of the audit on reporting, rather than to the effect of the tax provider on IRS outcomes.
3 Our result that the presence of auditor-provided tax services decreases the amount of recorded deficiency is robust to adding total auditor fees or total nonaudit fees as proxies for the economic bond between the auditor and client and to interacting the measure of economic bond with Deficiencies.
4 During our sample period, SFAS 5, Contingent Liabilities, provided guidance for accounting for and disclosing uncertain tax positions during our sample period. FIN 48, Accounting for Uncertain Tax Positions: An Interpretation of FASB Statement No. 109, provides new guidance about how to record tax benefits related to those positions. FIN 48 requires that corporations record “the best estimate of the impact of a tax position only if that position is probable of being sustained on [IRS] audit based solely on the technical merits of the position,” thus reducing the flexibility that management judgment previously permitted. As our sample period pre-dates FIN 48, we expect that firms enjoyed opportunities to use uncertain tax benefits and tax cushion for earnings management.
5 We believe it is unlikely that concerns that the IRS could observe the amount of cushion affected managers’ choices of the amount to record. Gleason and Mills (2002) provide the first academic evidence that deficiencies are related to a proxy for tax cushion. Because that paper’s

Gleason and Mills28
sample primarily covered the early 1990s, the authors ignored any stock option component of current tax expense. They note that the tax benefit of stock options should be removed from current tax expense in estimat-ing cushion for later time periods. The unavailability of electronic data on stock option tax deductions makes the IRS unable to construct a large-sample estimate of cushion. Further, during our sample period, the IRS did not exert all its legal rights to obtain firm-specific information about tax cushion. In 1984, the U.S. Supreme Court held that the IRS could subpoena auditor workpapers related to the tax cushion. However, the IRS chose not to pursue its judicially granted authority. Only recently has the IRS changed that policy to examine workpapers related to tax reserves on listed transactions (tax shelters).
6 Throughout the timeline, the corporation and auditor also receive exog-enous information that affects their probability assessments. Examples include court cases, new regulations, technical corrections bills, IRS rul-ings, etc. Because our IRS examination data include no information about the specific issues challenged, we do not attempt to control for tax news.
7 Kinney and Libby (2002) describe the conceptual determinants of earn-ings management as resulting from the interaction of management and auditor incentives. Management incentives affect both the choice to manage earnings and the auditor’s incentives. Thus, firms may choose to purchase tax services from their auditors based on their choices (or desire to maintain the option) to manage tax expense. This is consistent with Francis, Maydew, and Sparks, 1999 who hypothesize and find that firms with a propensity for higher total accruals due to operating characteristics are more likely to employ a Big 6 auditor as a quality signal. In supple-mental tests, we explicitly test and control for endogeneity in the decision to purchase tax services from the auditor.
8 Consistent for cushion being a current liability because it is like a demand note, FIN48, Accounting for Uncertain Tax Positions: An Interpretation of FASB Statement No. 109, clarifies that decreases in tax benefits should not be recorded in deferred taxes. However, during our sample period, it is possible that some corporations recorded tax reserves in deferred tax payable until the probable liability became due. In robustness tests, we in-clude U.S. deferred tax expense scaled by pretax income as a control vari-able and find qualitatively similar results for the interaction of Tax&Audit and Deficiency.
9 We focus on years during which firms learn the results of IRS examina-tions to test how firms record new information. We cannot use all years because accruals should average to zero in the cross-section.
Is the Tax Expense Estimate Improved or Biased? 29
10 Setting the lowest effective tax rate to zero percent is appropriate for our sample, which excludes firms with negative worldwide or U.S. pretax income. Our results on Deficiency and Tax&Audit*Deficiency are robust to excluding any observations for which Tax Expense or U.S.Current Tax or U.S. Tax Paid equals zero or one. Thus, the top and bottom coding does not drive the results.
11 It is possible that corporations that used an auditor to provide tax services in prior years discontinued using that tax provider by our sample period. If so, some corporations classified as Tax&Audit = 0 may have auditors who provided tax services in prior years, and we group fired tax consul-tants with nontax consultants in the Tax&Audit = 0 group. Our data do not permit identification of these firms. However, if the auditors continue to benefit from knowledge spillovers or suffer from threats to indepen-dence, this will work against finding a difference between our two groups.
12 In 2002, the SEC formalized the requirements for fee disclosures and re-quired firms to provide comparative data from 2001. Using data provided by Tom Omer, we confirmed that our classifications based on the original 2001 disclosures include all firms identified, based on the restated 2001 tax fee data. We thank Tom Omer for sharing his firm classification data.
13 In subsequent tests, we control for whether firms are in the Coordinated Issue Cases (CIC) program. CIC program firms are audited nearly every year. Our results are robust to limiting our sample to these firms or to firms not in the program.
14 Some commentators argue that the auditor can most efficiently provide tax compliance and planning services.
I subscribe to the idea that you probably do save costs [using audi-tors for tax return preparation] because of the efficiencies. But I think there’s also a quality issue. If you use the auditor to prepare tax returns, I think it’s because of the auditor’s familiarity with the culture, if you will, of the client, the financial information of the client… [and] you’re much more likely to get appropriate tax advice for the client than you would if you had an outside firm doing it. (Tom Oschsenschlager, AICPA, PCAOB Roundtable 2004, p.73-74)
In untabulated supplemental tests, we follow Mills, Erickson, and Maydew, 1998 to regress Worldwide Current ETR or U.S. Tax Return ETR on transformed auditor-provided tax services (log of 1 + TaxFee/SGA). Consistent with expectations that tax planning reduces taxes paid, these effective tax rates are decreasing in the log of scaled tax fees. How-

Gleason and Mills30
ever, this test cannot determine whether auditor-provided tax services are more effective than other types of tax planning because the audit fee data do not report tax services. We consider annual regressions to learn whether the negative relation between fees and tax savings degrades over the sample period, consistent with Omer et al., 2005. For the full sample, Worldwide Tax Expense is negatively related to fees only in 2000, but not in any other year. Tax return ETR is negatively related to fees in 2001 but not in 2000 or 2002 (the last year of tax return data available). Although we are reluctant to make too much of these fragile results, we do not dispute Omer et al.’s result that the negative relation between auditor-pro-vided tax services and tax payments declines over the period. Additional details are available from the authors on request.
15 The U.S. Current Tax regression is qualitatively similar to Table 4 in that the net effect of the main and the interaction terms for Deficiency is zero, although the negative interaction is not significant by itself. The Cushion regression is not robust to this specification. However, a robustness test associating Worldwide Tax Expense with Deficiency is robust to using the tax fee ratio in place of our dummy variable
16 When we exclude other control variables from the regression, the coef-ficient on U.S. Tax Paid is 0.80 (std. error = 0.0429).
17 If the taxpayer prefers to file a claim for refund with the U.S. District Court of the U.S. Court of Claims, the corporation would prepay the tax prior to going to court. However, such a prepayment is unlikely to occur until the taxpayer has concluded the appeals process.
18 Slemrod and Blumenthal, 1993 document that compliance costs include both internal tax department costs (salaries and information technology costs) and external consulting services. The external services include both accounting and attorney fees. For the large corporations we study, we expect that corporations obtain tax planning services from multiple sources, including inhouse expertise. Thus, the choice to use auditor-pro-vided tax services does not represent a decision to conduct tax planning. We include taxes from the U.S. tax return in our main tests to control for differences in tax planning.
19 Using compliance cost survey data from Slemrod and Blumenthal, 1996, we confirm that the proportion of tax planning services of tax services purchased from accountants is negatively related to Combative and posi-tively related to OptionPct.
20 In an untabulated test, we find that auditor tenure (the number of years for which the corporation has used the same auditor) is no different among
Is the Tax Expense Estimate Improved or Biased? 31
the Tax&Audit groups. Thus, firms do not appear to have selected their tax providers based on specific tax positions taken. Further, we do not observe an ex ante explanation (Tenure) for maintaining a tax relationship with the auditor.
21 Evidence in Dhaliwal, Gleason, and Mills, 2004 shows that, on average, firms increase earnings by 1.6 cents by managing tax expense.
22 Relatedly, Blouin and Tuna, 2006 investigate whether cushion permits earnings smoothing. They find that net earnings are smoother than pretax earnings net of cash taxes paid plus stock option benefit.
23 The only penalty data we have available relates to the penalty for failure to file a return, which applies to less than one-third of 1 percent of the returns, using a sample of 8,674 closed return-years from 1994-2003. Our anecdotal understanding is that penalties for reasons other than nonfiling or nonpayment are rarely assessed and collected from large companies.
24 We base this estimate on a broader sample of 1,406 returns from 1994 from our match of Compustat, tax return, and IRS examination data for which the return is closed. It is possible that some exams for the 1994 return were still open after 2003, the last year for which data were available.
ReferencesAntle, Rick; Gordon, Elizabeth; Narayanamoorthy, Ganapathi; and Zhui,
Ling (2002), The Joint Determination of Audit Fees, Non-Audit Fees and Abnormal Accruals, working paper, Yale University.
Ashbaugh, Hollis; Lafond, Ryan; and Mayhew, Brian (2002), Do Nonaudit Services Compromise Auditor Independence?, The Accounting Review 78(3), pp. 611-639.
Beck, Paul; Frecka, Thomas; and Solomon, Ira (1988), A Model of the Market for MAS and Audit Services: Knowledge Spillovers and Auditor-Auditee Bonding, Journal of Accounting Literature, pp. 50-64.
Blouin, Jennifer and Tuna, Irem (2006), Tax Contingencies: Cushioning the blow on earnings from tax audits and policy changes, working paper, University of Pennsylvania.
Brown Larry D. and Caylor, Marcus L. (2005), A Temporal Analysis of Thresholds: Propensities and Valuation Consequences, The Accounting Review 80 (2), pp. 539-562.

Gleason and Mills32
Chung, Hyeesoo and Kallapur, Sanjay (2003). Client Importance, Nonaudit Services, and Abnormal Accruals, The Accounting Review 78(4), pp. 931-955.
Comprix, Jospeh; Mills, Lillian F.; and Schmidt, Andrew P. (2006), Earnings Management through Changes in Interim Expenses, Columbia University working paper.
Das, Somnath and Shroff, Pervin K. (2002), Fourth Quarter Reversals in Earnings Changes and Earnings Management, working paper, University of Minnesota.
Davidson, R. and MacKinnon, J.G. (1993), Estimation and Inference in Econometrics, Oxford University Press, New York.
DeAngelo, Linda E. (1981), Auditor Independence, ‘Low Balling’, and Dis-closure Regulation, Journal of Accounting and Economics 3, pp. 113-128.
Defond, Mark; Raghunandan, K.; and Subramanyam, K.R.. (2002), Do Nonaudit Service Fees Impair Auditor Independence? Evidence from Going Concern Audit Opinions, Journal of Accounting Research 40(4), pp. 1247-1243.
Dhaliwal, Dan; Gleason, Christi; and Mills, Lillian (2004), Using Income Tax Expense To Achieve Analysts’ Targets, Contemporary Accounting Research, Summer, Volume 21, Number 2, pp. 431-459.
Francis, Jere R.; Maydew, Edward L.; Sparks, H. Charles (1999), The Role of Big 6 Auditors in the Credible Reporting of Accruals, Auditing: A Journal of Practice and Theory, Volume 18, Number 2, pp. 17-34.
Frankel, Richard; Johnson, Marilyn; and Nelson, Karen (2002), The Relation Between Auditor’s Fees of Nonaudit Services and Earnings Management, The Accounting Review 77 (Supplement), pp. 71-105.
Gleason, Cristi and Mills, Lillian (2002), Materiality and Contingent Tax Liability Reporting, The Accounting Review, pp. 317-342.
Gleason, Cristi and Mills, Lillian (2006), Evidence of Differing Market Responses to Meeting or Beating Targets Through Tax Expense Decreas-es, working paper, University of Iowa.

Is the Tax Expense Estimate Improved or Biased? 33
Greene, William H. (2003), Econometric Analysis, Prentice-Hall, Inc., UpperSaddle River, New Jersey.
Grubert, Harry and Slemrod, Joel, The Effect of Taxes on Investment and Income Shifting to Puerto Rico, The Review of Economics and Statistics 80, Number 3, August 1998, pp. 365-373.
Gupta, Sanjay and Newberry, Kaye (1997), Determinants of the variability in corporate effective tax rates: Evidence from longitudinal data, Journal of Accounting and Public Policy, Volume 16, Number 1, pp. 1-34.
Hanlon, Michelle and Shevlin, Terry (2002), The Accounting Treatment of the Tax Benefits of Employee Stock Options: Implications for Financial Accounting and Tax Research, Accounting Horizons 16, Number 1, March, pp. 1-16.
Jacob, John and Jorgensen, Bjorn N. (2005), Earnings Management and Ac-counting Income Aggregation, working paper, University of Colorado at Boulder.
Kinney, William and Libby, Robert (2002), Discussion of The Relation Between Auditor’s Fees of Nonaudit Services and Earnings Management, The Accounting Review 77, pp. 107-114.
Kinney, William R., Jr.; Palmrose, Zoe-Vonna; and Scholz, Susan (2004), Auditor Independence, Non-Audit Services, and Restatements: Was the U.S. Government Right?, Journal of Accounting Research, Volume 42, Number 3, pp. 561-588.
Land, Judy and Lang, Mark H. (2002), Empirical Evidence on the Evolution of International Earnings, The Accounting Review 77, Supplement, pp. 115-134.
Lang, Mark H.; Ready, Jana S.; and Wilson, Wendy (2005), Earnings Man-agement and Cross Listing: Are Reconciled Earnings Comparable to US Earnings?, forthcoming, Journal of Accounting and Economics.
Leuz, Christian; Nanda, Dananjay; and Wysocki, Peter D. (2003), Earnings Management and Investor Protection: An International Comparison, Journal of Financial Economics, Volume 69, Number 3, pp. 505-527.

Gleason and Mills34
Larker, David and Richardson, Scott (2004), Fees Paid to Audit Firms, Accrual Choices, and Corporate Governance, Journal of Accounting Research, Volume 42, Number 3, pp. 625-658
Maydew, Edward and Shackelford, Douglas (2006), The Changing Role of Auditors in Corporate Tax Planning, University of North Carolina work-ing paper, NBER Working Paper 11504, August 2005.
Mills, Lillian; Erickson, Merle; and Maydew, Ed (1998), Investments in Tax Planning, Journal of the American Taxation Association, Volume 20, Number 1, pp. 1-20.
Mills, Lillian and Newberry, Kaye (2004), Do Foreign Multinationals’ Tax Incentives Influence their U.S. Income Reporting and Debt Policy?, National Tax Journal, March.
Myers, James; Myers, Linda; and Skinner, Douglas (2005), Earnings Momentum and Earnings Management, working paper, University of Chicago.
Omer, Thomas; Bedard, Jean; and Falsetta, Diana (2005), Auditor-Provided Tax Services: The Effects of a Changing Regulatory Environment, work-ing paper, Texas A&M University.
Reynolds, J. and Francis, Jere (2001), Does Size Matter? The Influence of Large Clients on Office Level Auditor Reporting Decisions, Journal of Accounting and Economics, Volume 30, pp. 375-400.
Rogers, W. (1993), Regression Standard Errors in Clustered Samples, In Stata Technical Bulletin Reprints, 1993, Volume 13, Stata Press, College Station, Texas.
Securities and Exchange Commission (SEC) (2000), Final Rule: Revision of the Commission’s Auditor Independence Requirements, Government Printing Office, Washington, DC.
Securities and Exchange Commission (SEC) (2003), Final Rule: Strength-ening the Commission’s Requirements Regarding Auditor Independence, Government Printing Office, Washington, DC.
Simunic, Dan. (1984), Auditing, Consulting, and Auditor Independence, Journal of Accounting Research, Volume 22, pp. 679-702.
Is the Tax Expense Estimate Improved or Biased? 35
Slemrod, J. and Blumenthal, M. (1993), The compliance costs of big busi-ness, The Tax Foundation, Washington, DC.
StataCorp (1999), Stata Statistical Software, Release 6.0., User’s Guide, Stata Press, College Station, TX, [U] 23.11, pp. 256-260.
White, H. (1980), A heteroskedasticity-consistent covariance matrix estima-tor and a direct test for heteroskedasticity, Econometrica, Volume 48, Number 4, pp. 817-838.
Zimmerman, J. (1983), Taxes and Firm Size, Journal of Accounting and Economics, August, pp. 119-149.
Appendix: Variable Definitions (# refers to Compustat item number)Tax Expense Measures:Worldwide Tax Expense = tax expense (#16) divided by pretax income
(#170). Cushion = U.S. current tax expense (#63, or current tax expense (#16 – #50,
or #16 if #50 missing) if #63 is missing) minus unscaled Option Tax Benefit minus Tax After Credits from the U.S. Tax Return, divided by pretax income (#170).
Worldwide Current Tax = current tax expense (#16 – #50, or #16 if #50 miss-ing) divided by pretax income (#170).
U.S. Current Tax= U.S. current tax expense (#63, or current tax expense (#16 – #50, or #16 if #50 missing) if #63 is missing) divided by pretax income (#170).
U.S. Tax Paid = Tax After Credits from the U.S. tax return, divided by pretax income (#170).
Option Tax Benefit = the tax benefit from stock options disclosed in the statement of cash flows or the reconciliation of stockholders equity. Where the amount is not disclosed, we compute Option Tax Ben-efit to equal 35 percent times the number of share exercised times the difference between the average stock price for the year less the average exercise price. If the latter computation is negative, we use the maximum stock price for the year in place of the average stock price. Finally, we set the benefit to zero where it is missing or nega-tive. Option Tax Benefit is scaled by pretax income (#170).
State Current Tax = State current tax expense (#173 if nonmissing, otherwise zero) divided by pretax income (#170).
Gleason and Mills36
Foreign Current Tax = foreign current tax expense (#64 or zero if missing) divided by pretax income (#170).
In all tax expense measures, we code the variable at one if the numerator is positive and the denominator is negative, or if the variable exceeds one; we code the variable at zero if the numerator is negative (except in the case of Deferred Tax which is bottom-coded at negative one). The top and bottom coding at one and zero follows Gupta and Newberry, 1998 and Hanlon and Shevlin, 2002.
Audit Fee Measures:Tax&Audit = 1 if the audit firm also performs tax services, zero otherwise. TaxAuditRatio = TaxFees / AuditFees (including audit-related fees).TaxFees, AuditFees, TotalFees, NonauditFees are obtained from the S&P
database of audit fees. Other Fees were coded as tax fees according to a review of Other_Fees_Notes. NonauditFees are all fees other than AuditFees and Audit-relatedFees.
Log(1+TaxFee/SGA) = Log(1+TaxFees/SGA). We scale by SGA (#189), consistent with Mills, Erickson, and Maydew, 1998.
Tax Contingency Measures:Deficiency = the sum of deficiencies for IRS examinations closed during the
current financial reporting year, divided by pretax income. Paid at Exam = amount of additional tax the corporation pays and does not
appeal when the IRS examination concludes, divided by pretax income.
Settlement = the sum of settlements for returns closed during the current financial reporting year, where closed returns are complete through exam, appeals, and counsel proceedings, as well as closed to any claims of amounts paid in settlement of IRS exams, divided by pretax income.
Settlement Ratio = corporation mean Settlement/Deficiency percentage from 1990-2003.
Control Variables:Log(Sales) = Log of millions of dollars of sales (#12). Property = Net property plant and equipment (#8) divided by assets (#6). R&D = Research and Development Expense (#46 if nonmissing, otherwise
zero) divided by sales (#12).
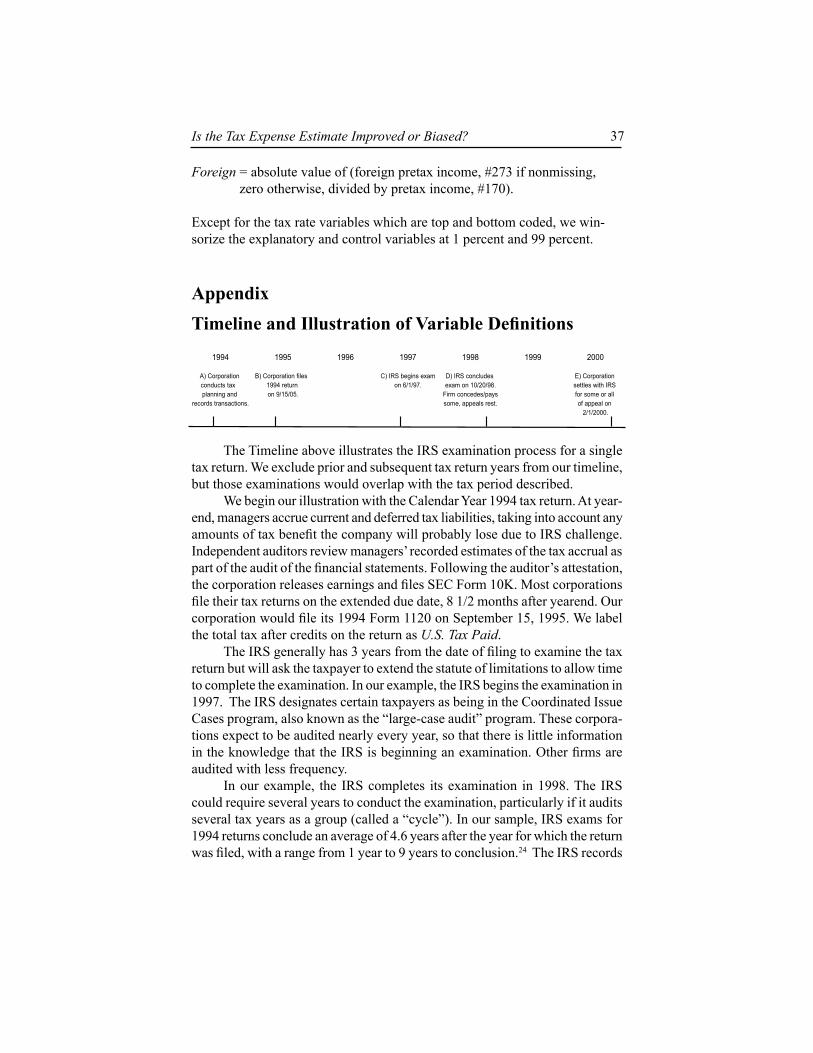
Is the Tax Expense Estimate Improved or Biased? 37
1994 1995 1996 1997 1998 1999 2000
A) Corporation B) Corporation files C) IRS begins exam D) IRS concludes E) Corporation conducts tax 1994 return on 6/1/97. exam on 10/20/98. settles with IRS planning and on 9/15/05. Firm concedes/pays for some or all
records transactions. some, appeals rest. of appeal on 2/1/2000.
Foreign = absolute value of (foreign pretax income, #273 if nonmissing, zero otherwise, divided by pretax income, #170).
Except for the tax rate variables which are top and bottom coded, we win-sorize the explanatory and control variables at 1 percent and 99 percent.
AppendixTimeline and Illustration of Variable Definitions
The Timeline above illustrates the IRS examination process for a single tax return. We exclude prior and subsequent tax return years from our timeline, but those examinations would overlap with the tax period described.
We begin our illustration with the Calendar Year 1994 tax return. At year-end, managers accrue current and deferred tax liabilities, taking into account any amounts of tax benefit the company will probably lose due to IRS challenge. Independent auditors review managers’ recorded estimates of the tax accrual as part of the audit of the financial statements. Following the auditor’s attestation, the corporation releases earnings and files SEC Form 10K. Most corporations file their tax returns on the extended due date, 8 1/2 months after yearend. Our corporation would file its 1994 Form 1120 on September 15, 1995. We label the total tax after credits on the return as U.S. Tax Paid.
The IRS generally has 3 years from the date of filing to examine the tax return but will ask the taxpayer to extend the statute of limitations to allow time to complete the examination. In our example, the IRS begins the examination in 1997. The IRS designates certain taxpayers as being in the Coordinated Issue Cases program, also known as the “large-case audit” program. These corpora-tions expect to be audited nearly every year, so that there is little information in the knowledge that the IRS is beginning an examination. Other firms are audited with less frequency.
In our example, the IRS completes its examination in 1998. The IRS could require several years to conduct the examination, particularly if it audits several tax years as a group (called a “cycle”). In our sample, IRS exams for 1994 returns conclude an average of 4.6 years after the year for which the return was filed, with a range from 1 year to 9 years to conclusion.24 The IRS records

Gleason and Mills38
an ExamDate when the examination is complete, and the taxpayer responds to any additional tax (Deficiency) that the IRS proposes to the taxpayer. This date is usually within 90 days of the Notice of Deficiency and represents the date the taxpayer agrees to or appeals the adjustment, or the date of statutory assessment if the taxpayer fails to respond to the Notice.
The corporation pays none, some, or all of the Deficiency. We label the amount paid as Paid at Exam. Whatever the corporation does not pay it disputes by filing an appeal. The IRS has divisions for Examination, Appeals, and Counsel. Counsel handles court cases for the IRS and has final authority to concede and negotiate a settlement out of court.
The IRS considers a return to be closed when no claims by the IRS or by the taxpayer remain outstanding. In our example, the corporation settles the dispute in 2000 and pays any final amount negotiated with the IRS or decided by the court. For purposes of measuring a settlement date for our tests, we use the latest date that the IRS records a posting in Appeals or Counsel for any returns that the IRS designates as “closed.” We label the sum of all amounts paid during the examination, appeals, or counsel processes as Settlement.