Embed Size (px)
Citation preview
Is the Public Rational? Benchmarking CollectiveRationality in Economic Evaluations
Gregory E. McAvoyDepartment of Political Science
University of North Carolina at GreensboroPO Box 26170
Greensboro, NC 27402email: [email protected]
September 3, 2012
Abstract
In order to better understand information processing at the aggregate level, I a)describe a model of information processing of aggregate opinion that is consistent withthe individual-level models, b) show how this information processing model works inthe context of the public’s evaluation of the economy and c) compare aggregate opinionabout the economy to a benchmark of strict “rational” decision-makers represented bythe opinions of professional forecasters compiled in the Survey of Professional Fore-casters.
Prepared for delivery at the 2012 European Public Opinion and Parties Conference,University of Oxford, September 7-9, 2012.
Introduction
An enduring question in the study of public opinion is the extent to which collectiveopinion measures up to standards of rationality. Walter Lippmann’s (1922) early trea-tise on public opinion paints a grim portrait of the electorate, one in which citizenspossess little information about the political system and only provide weak signalsabout the direction that the country should take. Starting with The American Voter(1960), political scientists have documented that certain segments of the American pub-lic lack the knowledge or ideological framework for effective political decision-making.Such studies have long been a source of discouragement for those concerned about ahealthy, democratic polity.
But, when researchers have looked at the public as whole, the outlook has beenmore optimistic. In The Rational Public, Page and Shapiro (1992) argue that publicopinion follows reasonable and predictable patterns over time, despite the fact thatindividual citizens may lack the requisite knowledge to make good decisions. Theyargue that the public includes many citizens who fit the unflattering image of theelectorate described by Lippmann and others, but that there are enough people whoare attentive and informed to bring order and stability to aggregate public opinion (fora more recent argument along these lines, see Stimson (2004), especially p. 14-17).This occurs through the ”magic of aggregation”–meaning that the unstable opinions ofthose with limited information about politics introduce random noise into the system,while the informed public produces a consistent signal that brings order and meaningto aggregate public opinion.
A key assumption among those studying collective political rationality is that in-dividuals, particularly informed individuals, will use all information at their disposal(Erikson, MacKuen & Stimson 2002, Krause 2000). These researchers are not argu-ing for a strict form of rational expectations in which individuals possess all availableinformation–rather they are only claiming that people will use all information thatthey possess. However, this simple characterization of information processing does notsquare with individual-level processing models (Taber & Lodge 2006, Lodge, Steenber-gen & Brau 1995). These studies show that citizens often rely on motivated reasoning,that is, they seek out information that is consistent with their preconceptions (or pri-ors) and ignore, discount, or counter-argue information that is inconsistent with theirpredispositions. In addition, given the complexity of political decision-making (i.e.,a wide range of shifting issues) and the fact that many people’s attention to politicsis limited (by choice or necessity), citizens rely on short-cuts and predispositions toprocess information relevant to politics. Thus, it is likely that at the aggregate levelthese same forces are at work, (i.e., the need for rules of thumb, shifting attention,and information channels). In order to better understand information processing atthe aggregate level, I a) describe a model of information processing of aggregate opin-ion that is consistent with the individual-level models, b) show how this informationprocessing model works in the context of the public’s evaluation of the economy andc) compare aggregate opinion about the economy to a benchmark of strict “rational”decision-makers represented by the opinions compiled in the Survey of ProfessionalForecasters.
2
Information Processing
For a variety of reasons, aggregate models of behavior are generally grounded on as-sumptions of perfect or near-perfect information processing. Often these assumptionsare justified as necessary simplifications, but at times, they reflect researchers’ con-victions that at least some individuals are able to perform such demanding tasks.However, individual-level studies suggest that rather than systematic information pro-cessors, citizens try to interpret facts to fit their existing view points and those who aremore informed tend to be better at incorporating new information into their existinginterpretation of political affairs. (Gaines et al. 2007, Duch, Palmer & Anderson 2000).With new and complex issues making their way to the top of the political agenda, itis not surprising that citizens, even well-intentioned ones, rely on party cues and otherinformation short cuts to sift through the wealth of information in the modern politicalenvironment.
The response of the public to new information may not be as clear and straight-forward as rational actors models would suggest. Studies of the economic news andits impact on the public’s perceptions of economic conditions show the relationshipbetween news and information can by asymmetric. Soroka (2006) and others suggestthat the public reacts more to bad news about the economy than good news. Thismight arise in part from unmet expectations as people hope for the best and are dis-appointed when their optimistic expectations are not met, or through loss aversion, aphenomenon identified by Kahneman and Tversky (1979) in which individuals feel theimpact of a loss more profoundly than they do a gain.1
In his generative study of individual-level opinion, Zaller (Zaller 1992) proposes amodel of information processing that runs directly counter to the conventional notionsof aggregate rationality. In his model, Zaller identifies information reception as a keycomponent of the process by which individuals update in response to new informationin the environment. Individuals’ willingness to receive new information is contingenton their awareness and predispositions. In addition, Zaller and others who recognizethat individual citizens are occupied with a variety of tasks, like family and work,and these preclude them from giving their full attention to events in political andeconomic environment. Because of this shifting attention on and away from politics,we would expect certain amount of randomness in the aggregate public opinion as theidiosyncrasies of daily life bring events to the attention of some people while divertingthe attention of others. Because of these issues, Zaller argues that a component ofpublic opinion is the result of top of the head evaluations in which people’s responsesare influenced by salient information.
Even those investigating economic rationality have become sensitive to the rolethat limits to information processing might play in aggregate behavior. For example,Christopher Sims’ (2003, 2006) work on the role of “rational inattention” takes seriouslythe limits of the public as whole to process the wealth of information flowing to citizens.In the face of this plethora of information, inattention is a rational strategy. What thismeans, however, is that the response of economic agents to new information will beslower and smoother than would occur with attentive and hyper-rational individuals.
1See Soroka (2006) for a fuller description of these possible explanations
3
Ironically, this limited capacity to process information is currently paired with whatappears to be a limitless supply of information, as the billions of web pages currentlyindexed by Google attest.
Information and Reception
Within political science, the impact of economic conditions on public opinion likepresidential approval has been studied extensively. But, far less attention has beengiven to the role of information processing that underpins these type of analyses.2
Although much research has been devoted studying the components of consumer sen-timent collected in the Survey of Consumers, the survey also contains questions aboutrespondent’s perceptions of news reports about economic conditions provide, and theseprovide insight into the way that people use or ignore relevant information in their as-sessments of economic conditions.
Although there are a variety of questions asked about the public’s awareness ofnews reports, the focus of the analysis conducted here is on questions about generalnews about the economy. The question about general news asked in the survey is:“During the last few months, have your heard of any favorable or unfavorable changesin business conditions?” The survey then branches to questions about the type of newsheard, focusing on issues like unemployment, inflation, interest rates and a varietyof other economic factors. As Soroka and others have shown, there is a negativitybias in news about the economy, since negative information seems to be much morerelated to people’s assessment of the economy than favorable news. The correlations inTable 1 show the relationship about the public’s rating of the economy (as measuredby consumer sentiment), economic conditions, and the news questions. As the tableindicates, unfavorable news is much more closely related to economic conditions andthe public’s overall rating of the economy. Thus, the focus of the analysis here ison the role of unfavorable news in the public’s updating of opinions about economicconditions.
It is important to note that these simple correlations facilitate our understandingof the public’s use of information. The relatively low correlation between favorablenews and consumer sentiment indicates that even when the respondents say that theyreceived positive information about the economy, they did not use it systematicallyin making an overall evaluation of the economy. In addition, the weak correlationbetween economic conditions and consumer sentiment indicates that the public is notconsistently using information about these conditions in assessing the economy. Theseweak correlations give support to the idea that the public ignores or is inattentiveto political news, focusing its attention on other matters at times. (This is exploredfurther below).
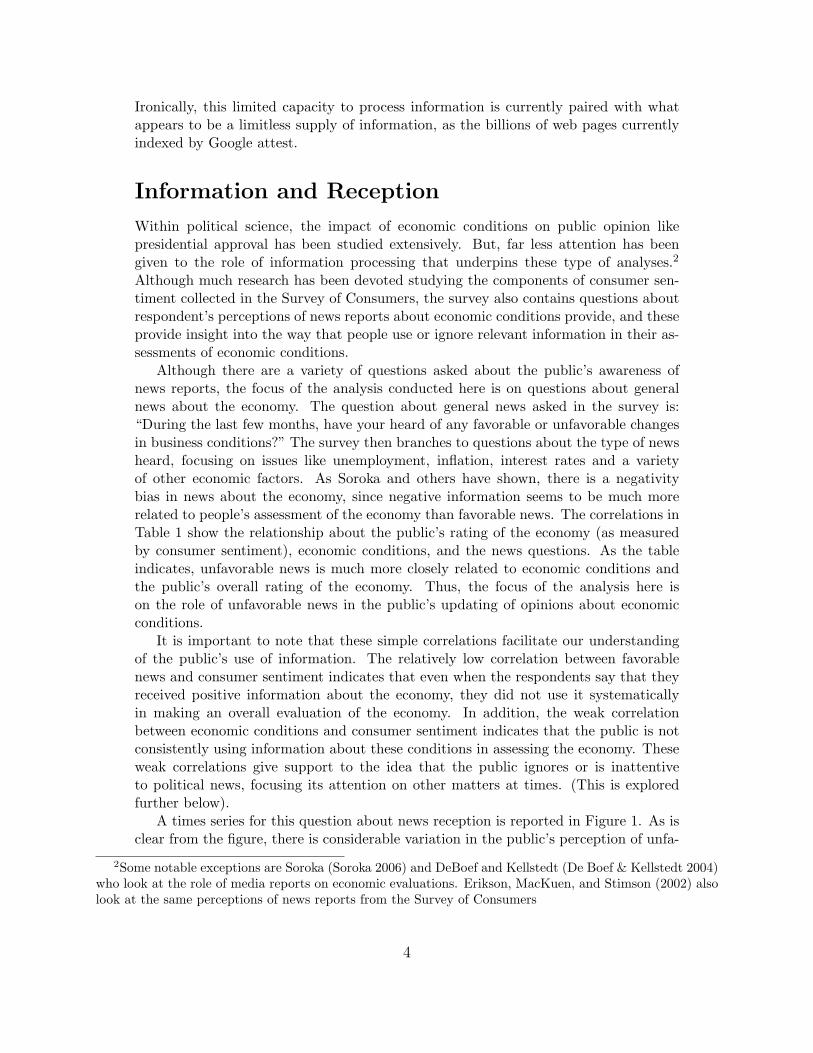
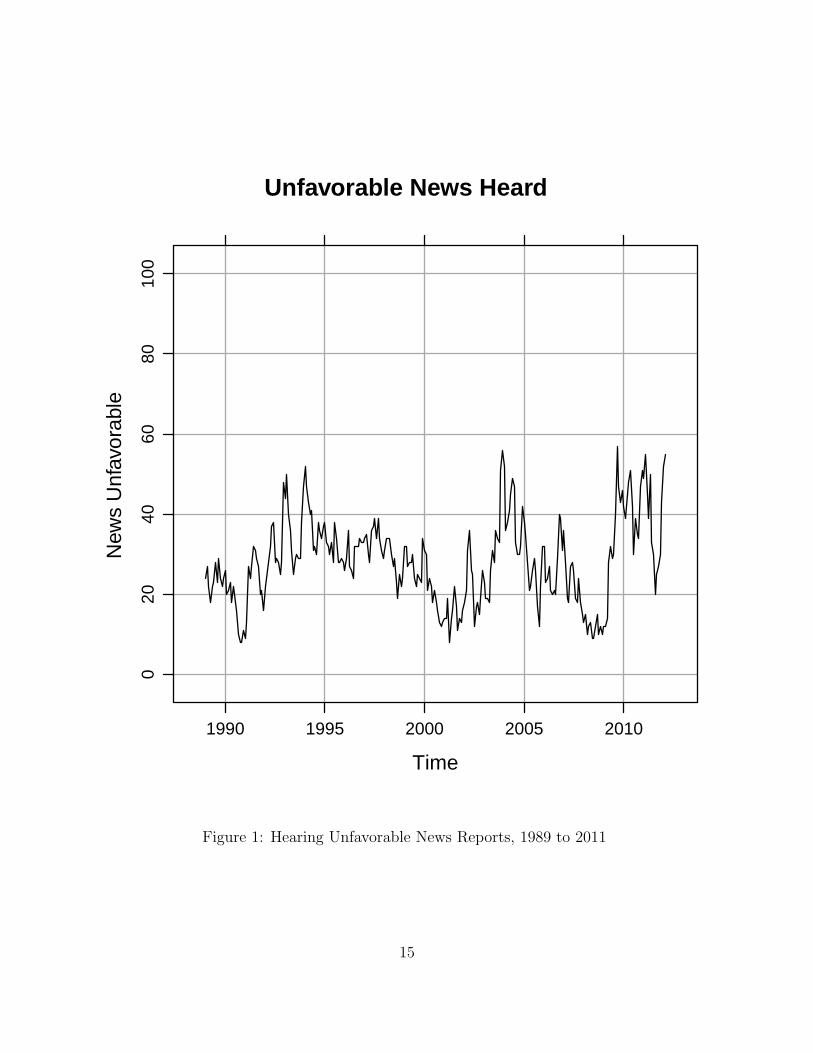
A times series for this question about news reception is reported in Figure 1. As isclear from the figure, there is considerable variation in the public’s perception of unfa-
2Some notable exceptions are Soroka (Soroka 2006) and DeBoef and Kellstedt (De Boef & Kellstedt 2004)who look at the role of media reports on economic evaluations. Erikson, MacKuen, and Stimson (2002) alsolook at the same perceptions of news reports from the Survey of Consumers
4
vorable news. The high points correspond with recessions in the early 1990s and 2000sand continue to be high in the wake of the 2008 financial crisis. Low reports of unfa-vorable news occurred during the second Clinton administration, when the economywas particularly robust.
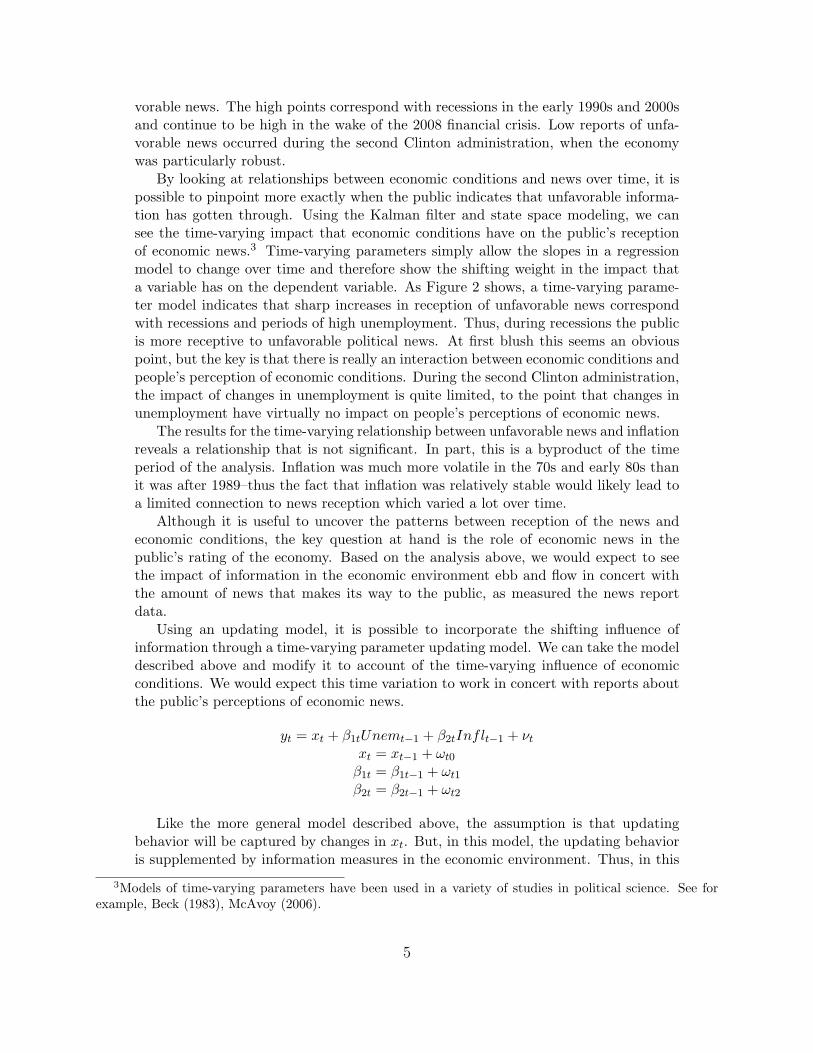
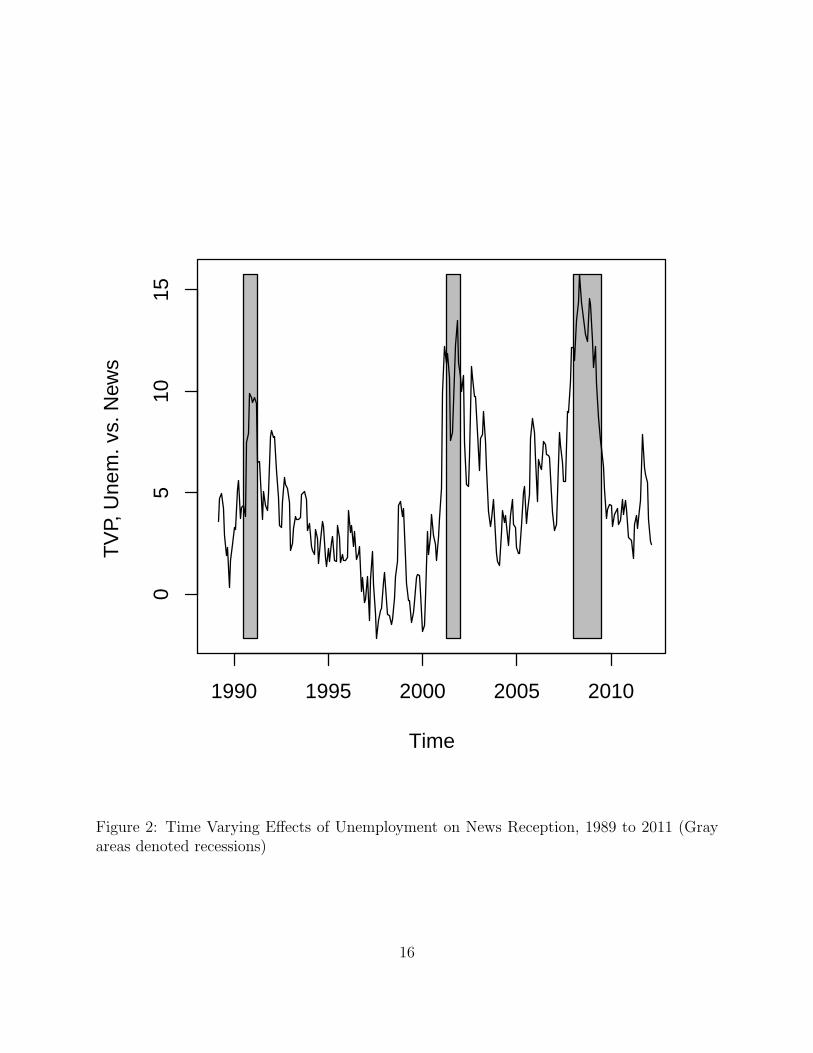
By looking at relationships between economic conditions and news over time, it ispossible to pinpoint more exactly when the public indicates that unfavorable informa-tion has gotten through. Using the Kalman filter and state space modeling, we cansee the time-varying impact that economic conditions have on the public’s receptionof economic news.3 Time-varying parameters simply allow the slopes in a regressionmodel to change over time and therefore show the shifting weight in the impact thata variable has on the dependent variable. As Figure 2 shows, a time-varying parame-ter model indicates that sharp increases in reception of unfavorable news correspondwith recessions and periods of high unemployment. Thus, during recessions the publicis more receptive to unfavorable political news. At first blush this seems an obviouspoint, but the key is that there is really an interaction between economic conditions andpeople’s perception of economic conditions. During the second Clinton administration,the impact of changes in unemployment is quite limited, to the point that changes inunemployment have virtually no impact on people’s perceptions of economic news.
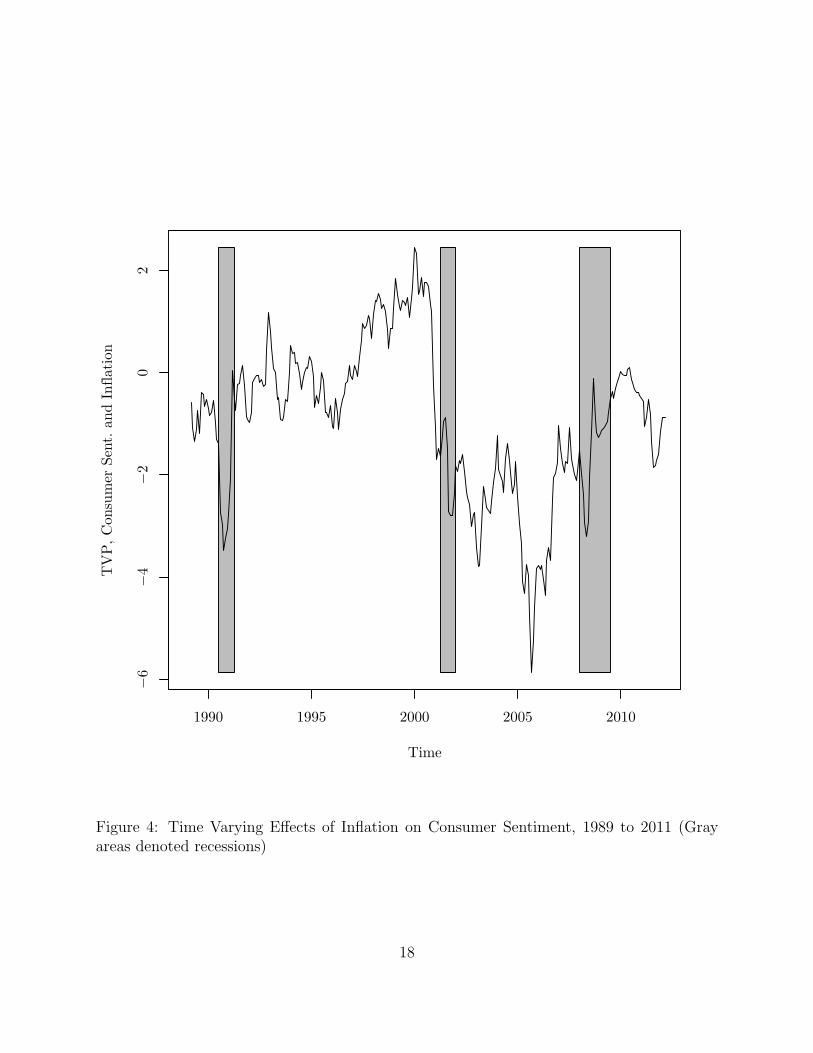
The results for the time-varying relationship between unfavorable news and inflationreveals a relationship that is not significant. In part, this is a byproduct of the timeperiod of the analysis. Inflation was much more volatile in the 70s and early 80s thanit was after 1989–thus the fact that inflation was relatively stable would likely lead toa limited connection to news reception which varied a lot over time.
Although it is useful to uncover the patterns between reception of the news andeconomic conditions, the key question at hand is the role of economic news in thepublic’s rating of the economy. Based on the analysis above, we would expect to seethe impact of information in the economic environment ebb and flow in concert withthe amount of news that makes its way to the public, as measured the news reportdata.
Using an updating model, it is possible to incorporate the shifting influence ofinformation through a time-varying parameter updating model. We can take the modeldescribed above and modify it to account of the time-varying influence of economicconditions. We would expect this time variation to work in concert with reports aboutthe public’s perceptions of economic news.
yt = xt + β1tUnemt−1 + β2tInflt−1 + νtxt = xt−1 + ωt0
β1t = β1t−1 + ωt1
β2t = β2t−1 + ωt2
Like the more general model described above, the assumption is that updatingbehavior will be captured by changes in xt. But, in this model, the updating behavioris supplemented by information measures in the economic environment. Thus, in this
3Models of time-varying parameters have been used in a variety of studies in political science. See forexample, Beck (1983), McAvoy (2006).
5
model of updating, it is possible for the impact of unemployment and inflation to changeover time and this effect is captured through the time-varying parameters (β1t, β2t). Wewould expect this variation to be closely linked to changes in the public’s receptivityto news reports.4
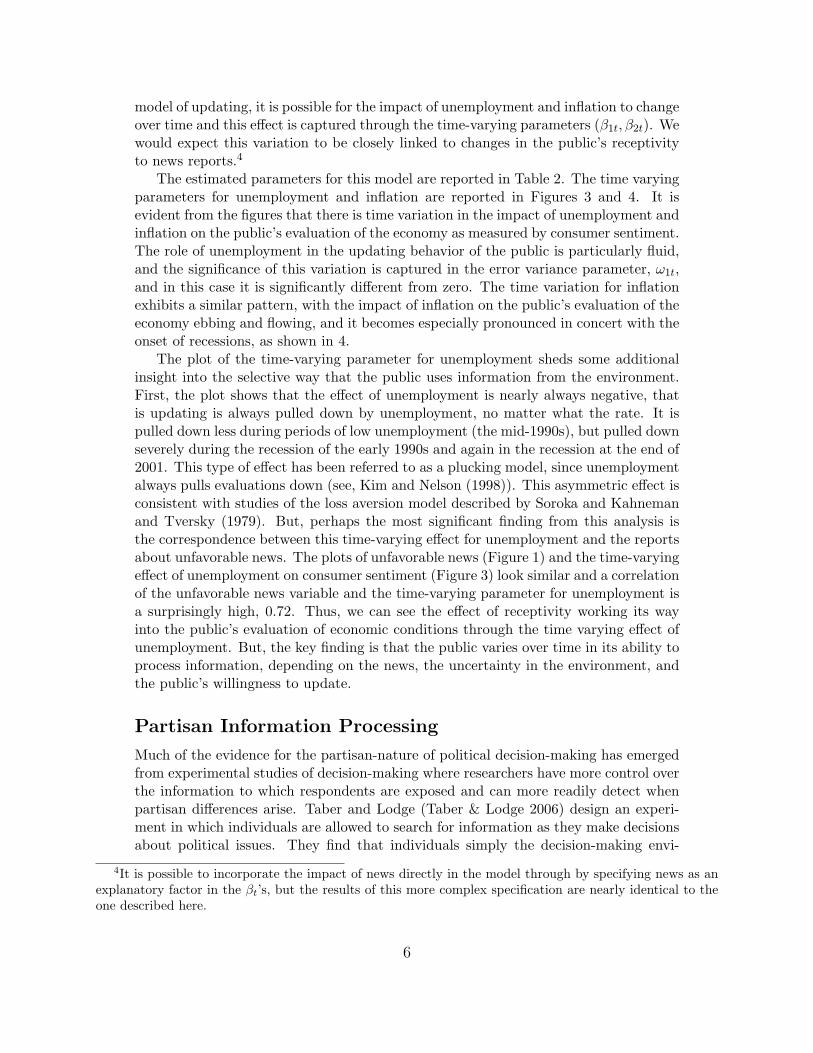
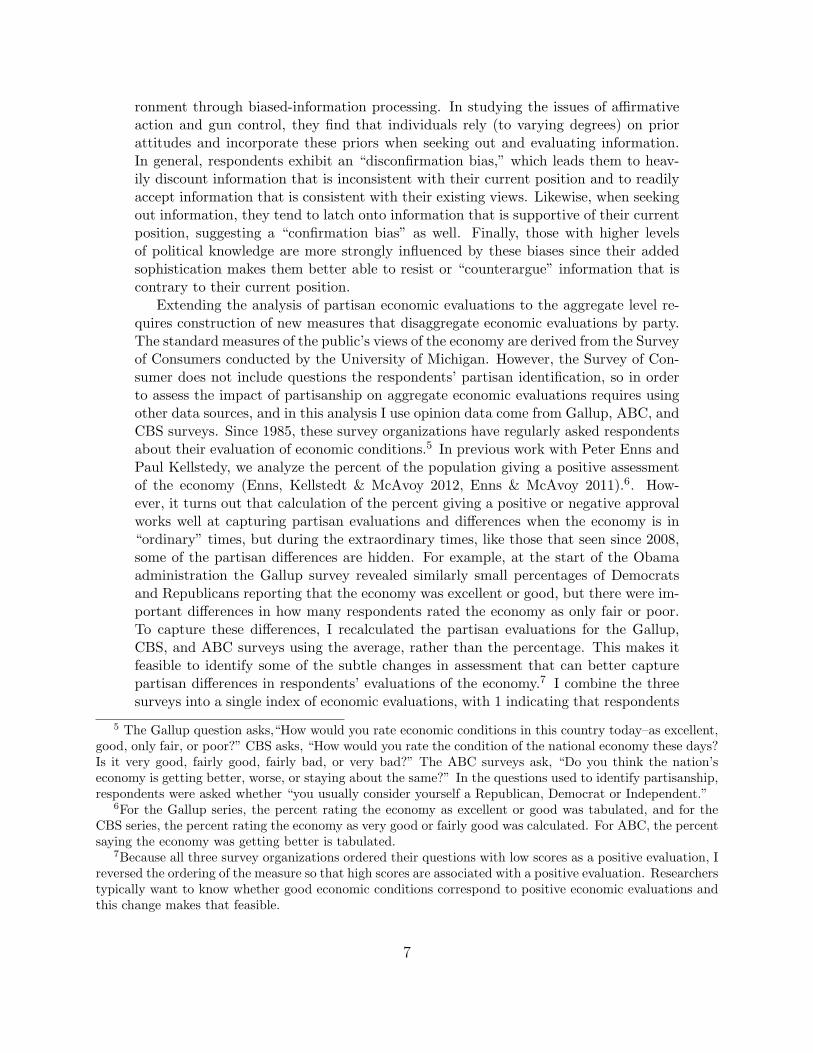
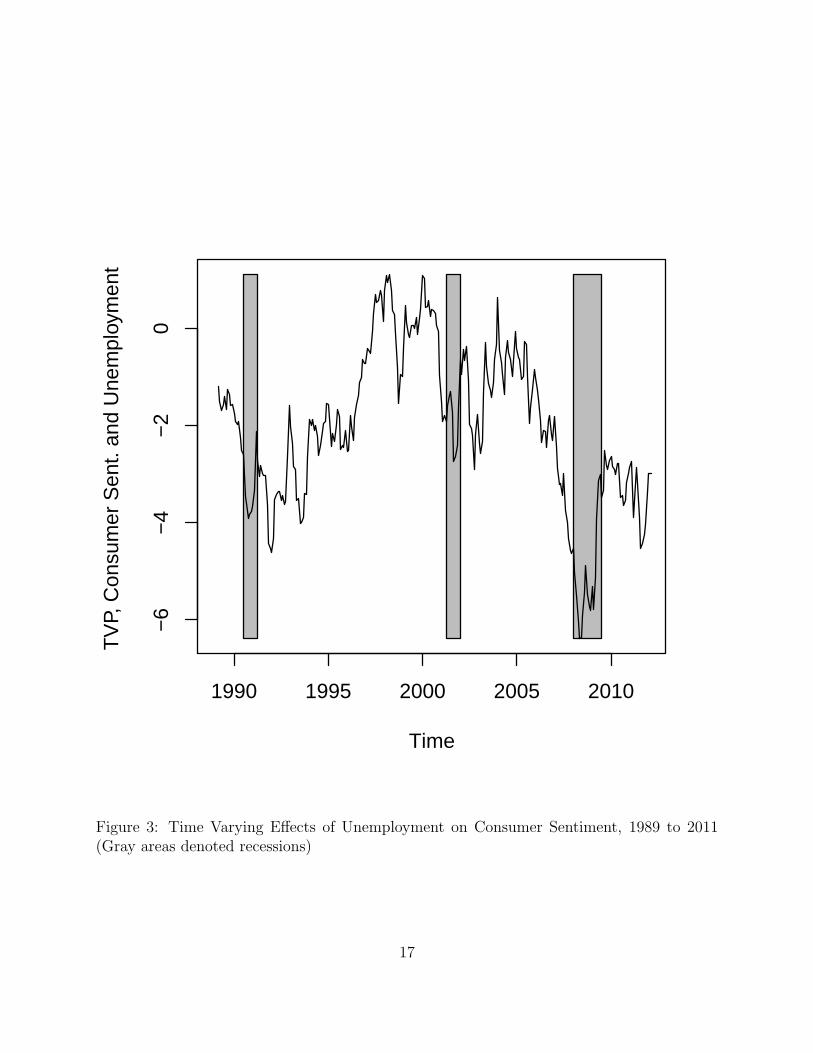
The estimated parameters for this model are reported in Table 2. The time varyingparameters for unemployment and inflation are reported in Figures 3 and 4. It isevident from the figures that there is time variation in the impact of unemployment andinflation on the public’s evaluation of the economy as measured by consumer sentiment.The role of unemployment in the updating behavior of the public is particularly fluid,and the significance of this variation is captured in the error variance parameter, ω1t,and in this case it is significantly different from zero. The time variation for inflationexhibits a similar pattern, with the impact of inflation on the public’s evaluation of theeconomy ebbing and flowing, and it becomes especially pronounced in concert with theonset of recessions, as shown in 4.
The plot of the time-varying parameter for unemployment sheds some additionalinsight into the selective way that the public uses information from the environment.First, the plot shows that the effect of unemployment is nearly always negative, thatis updating is always pulled down by unemployment, no matter what the rate. It ispulled down less during periods of low unemployment (the mid-1990s), but pulled downseverely during the recession of the early 1990s and again in the recession at the end of2001. This type of effect has been referred to as a plucking model, since unemploymentalways pulls evaluations down (see, Kim and Nelson (1998)). This asymmetric effect isconsistent with studies of the loss aversion model described by Soroka and Kahnemanand Tversky (1979). But, perhaps the most significant finding from this analysis isthe correspondence between this time-varying effect for unemployment and the reportsabout unfavorable news. The plots of unfavorable news (Figure 1) and the time-varyingeffect of unemployment on consumer sentiment (Figure 3) look similar and a correlationof the unfavorable news variable and the time-varying parameter for unemployment isa surprisingly high, 0.72. Thus, we can see the effect of receptivity working its wayinto the public’s evaluation of economic conditions through the time varying effect ofunemployment. But, the key finding is that the public varies over time in its ability toprocess information, depending on the news, the uncertainty in the environment, andthe public’s willingness to update.
Partisan Information Processing
Much of the evidence for the partisan-nature of political decision-making has emergedfrom experimental studies of decision-making where researchers have more control overthe information to which respondents are exposed and can more readily detect whenpartisan differences arise. Taber and Lodge (Taber & Lodge 2006) design an experi-ment in which individuals are allowed to search for information as they make decisionsabout political issues. They find that individuals simply the decision-making envi-
4It is possible to incorporate the impact of news directly in the model through by specifying news as anexplanatory factor in the βt’s, but the results of this more complex specification are nearly identical to theone described here.
6
ronment through biased-information processing. In studying the issues of affirmativeaction and gun control, they find that individuals rely (to varying degrees) on priorattitudes and incorporate these priors when seeking out and evaluating information.In general, respondents exhibit an “disconfirmation bias,” which leads them to heav-ily discount information that is inconsistent with their current position and to readilyaccept information that is consistent with their existing views. Likewise, when seekingout information, they tend to latch onto information that is supportive of their currentposition, suggesting a “confirmation bias” as well. Finally, those with higher levelsof political knowledge are more strongly influenced by these biases since their addedsophistication makes them better able to resist or “counterargue” information that iscontrary to their current position.
Extending the analysis of partisan economic evaluations to the aggregate level re-quires construction of new measures that disaggregate economic evaluations by party.The standard measures of the public’s views of the economy are derived from the Surveyof Consumers conducted by the University of Michigan. However, the Survey of Con-sumer does not include questions the respondents’ partisan identification, so in orderto assess the impact of partisanship on aggregate economic evaluations requires usingother data sources, and in this analysis I use opinion data come from Gallup, ABC, andCBS surveys. Since 1985, these survey organizations have regularly asked respondentsabout their evaluation of economic conditions.5 In previous work with Peter Enns andPaul Kellstedy, we analyze the percent of the population giving a positive assessmentof the economy (Enns, Kellstedt & McAvoy 2012, Enns & McAvoy 2011).6. How-ever, it turns out that calculation of the percent giving a positive or negative approvalworks well at capturing partisan evaluations and differences when the economy is in“ordinary” times, but during the extraordinary times, like those that seen since 2008,some of the partisan differences are hidden. For example, at the start of the Obamaadministration the Gallup survey revealed similarly small percentages of Democratsand Republicans reporting that the economy was excellent or good, but there were im-portant differences in how many respondents rated the economy as only fair or poor.To capture these differences, I recalculated the partisan evaluations for the Gallup,CBS, and ABC surveys using the average, rather than the percentage. This makes itfeasible to identify some of the subtle changes in assessment that can better capturepartisan differences in respondents’ evaluations of the economy.7 I combine the threesurveys into a single index of economic evaluations, with 1 indicating that respondents
5 The Gallup question asks,“How would you rate economic conditions in this country today–as excellent,good, only fair, or poor?” CBS asks, “How would you rate the condition of the national economy these days?Is it very good, fairly good, fairly bad, or very bad?” The ABC surveys ask, “Do you think the nation’seconomy is getting better, worse, or staying about the same?” In the questions used to identify partisanship,respondents were asked whether “you usually consider yourself a Republican, Democrat or Independent.”
6For the Gallup series, the percent rating the economy as excellent or good was tabulated, and for theCBS series, the percent rating the economy as very good or fairly good was calculated. For ABC, the percentsaying the economy was getting better is tabulated.
7Because all three survey organizations ordered their questions with low scores as a positive evaluation, Ireversed the ordering of the measure so that high scores are associated with a positive evaluation. Researcherstypically want to know whether good economic conditions correspond to positive economic evaluations andthis change makes that feasible.
7
collectively concluding that the economy was performing badly and 4 indicating thatit was performing well.8 Because each of the surveys skipped some months, using datafrom all the surveys helps overcome the missing data problem that would occur if werelied on a single survey. But equally important, combining surveys in the monthswhere they overlap (a majority of time points), decreases the sampling error becausethe total sample size increases. Thus, we can disaggregate by partisanship and stillobtain an accurate estimate of the subgroup’s rating of the economy.
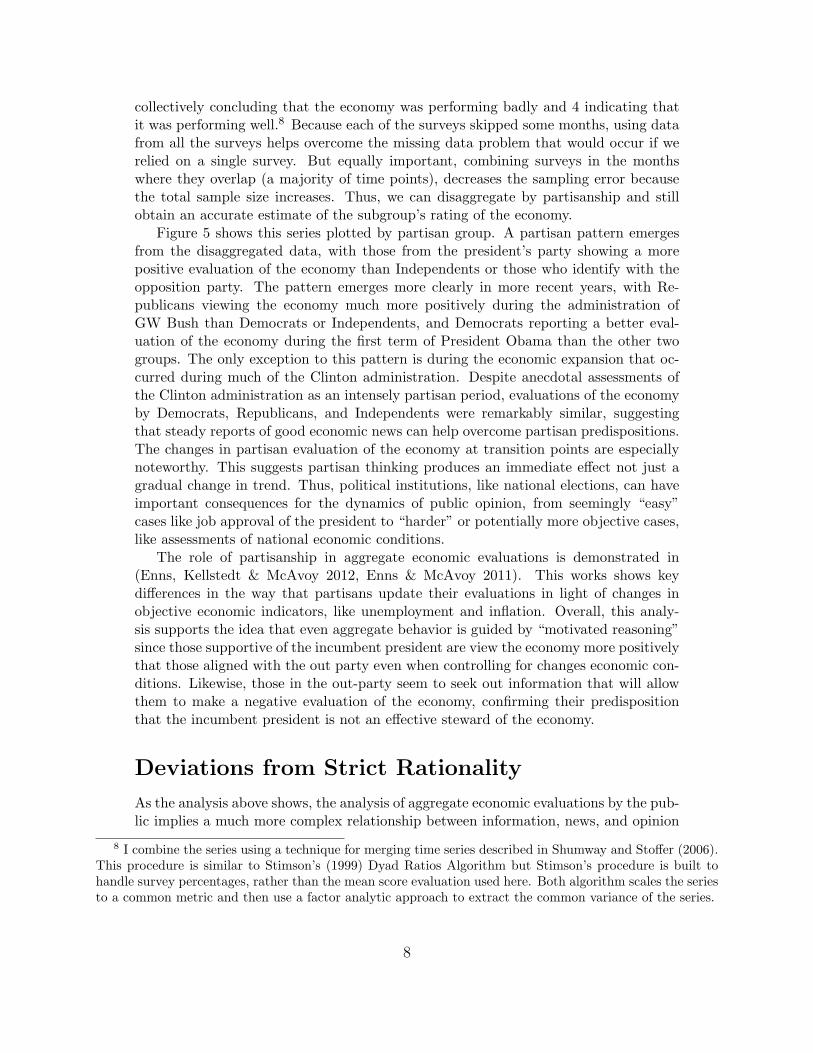
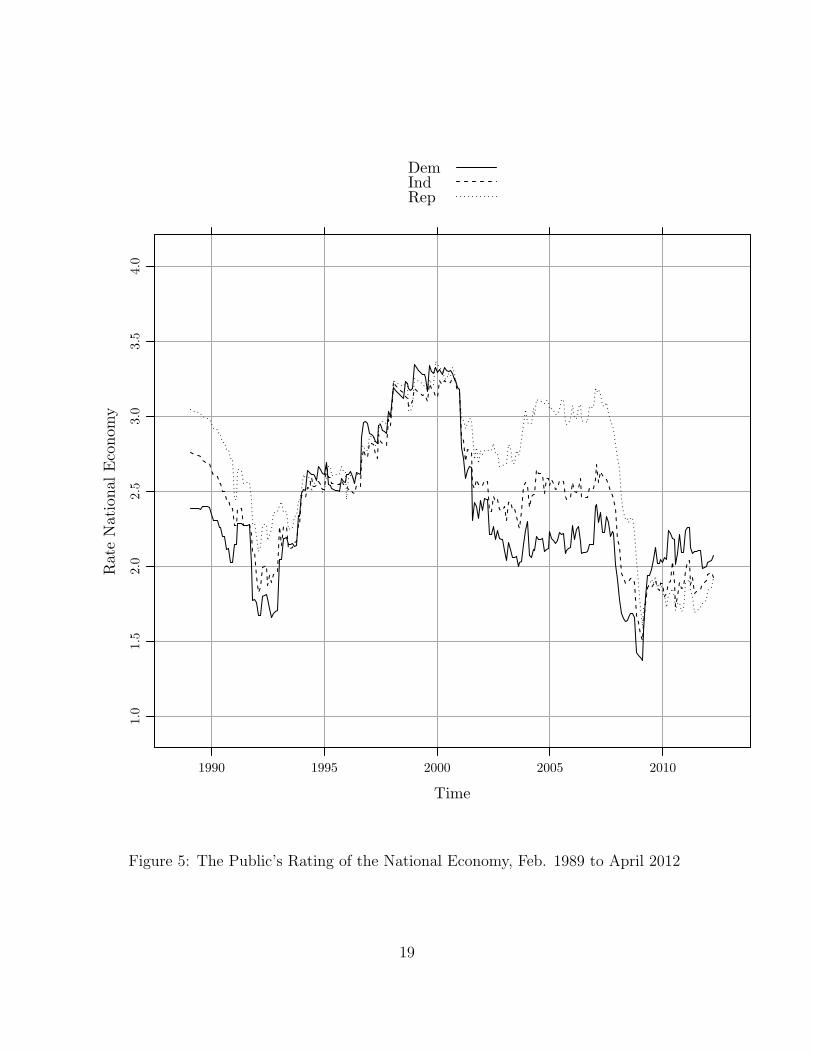
Figure 5 shows this series plotted by partisan group. A partisan pattern emergesfrom the disaggregated data, with those from the president’s party showing a morepositive evaluation of the economy than Independents or those who identify with theopposition party. The pattern emerges more clearly in more recent years, with Re-publicans viewing the economy much more positively during the administration ofGW Bush than Democrats or Independents, and Democrats reporting a better eval-uation of the economy during the first term of President Obama than the other twogroups. The only exception to this pattern is during the economic expansion that oc-curred during much of the Clinton administration. Despite anecdotal assessments ofthe Clinton administration as an intensely partisan period, evaluations of the economyby Democrats, Republicans, and Independents were remarkably similar, suggestingthat steady reports of good economic news can help overcome partisan predispositions.The changes in partisan evaluation of the economy at transition points are especiallynoteworthy. This suggests partisan thinking produces an immediate effect not just agradual change in trend. Thus, political institutions, like national elections, can haveimportant consequences for the dynamics of public opinion, from seemingly “easy”cases like job approval of the president to “harder” or potentially more objective cases,like assessments of national economic conditions.
The role of partisanship in aggregate economic evaluations is demonstrated in(Enns, Kellstedt & McAvoy 2012, Enns & McAvoy 2011). This works shows keydifferences in the way that partisans update their evaluations in light of changes inobjective economic indicators, like unemployment and inflation. Overall, this analy-sis supports the idea that even aggregate behavior is guided by “motivated reasoning”since those supportive of the incumbent president are view the economy more positivelythat those aligned with the out party even when controlling for changes economic con-ditions. Likewise, those in the out-party seem to seek out information that will allowthem to make a negative evaluation of the economy, confirming their predispositionthat the incumbent president is not an effective steward of the economy.
Deviations from Strict Rationality
As the analysis above shows, the analysis of aggregate economic evaluations by the pub-lic implies a much more complex relationship between information, news, and opinion
8 I combine the series using a technique for merging time series described in Shumway and Stoffer (2006).This procedure is similar to Stimson’s (1999) Dyad Ratios Algorithm but Stimson’s procedure is built tohandle survey percentages, rather than the mean score evaluation used here. Both algorithm scales the seriesto a common metric and then use a factor analytic approach to extract the common variance of the series.
8
than models of strict rationality suggest. The public does in fact ignore informationthat comes its way, based on the severity of the problem as well as other factors thatmight divert people’s attention from economic conditions. But, it is useful to know howfar these deviations from strict rationality push the public away from an evaluationthat would occur based on the calculations of a “rational” individual.
Fortunately, in the area of economic evaluations, data for making this compari-son is available. The Survey of Professional Forecasters has been conducted quarterlysince 1968, first by the American Statistical Association and then by National Bu-reau of Economic Research. In 1990, the Federal Reserve Bank of Philadelphia tookover administration of the survey. The survey asks professional forecasters a series ofquestions about future economic conditions. The results of this survey have been usedextensively in studies of inflation expectations (Carroll 2003), but have not been fullyutilized as a benchmark in other studies of rationality. However, if what we want toknow is how the public deviates from strict rationality, it is hard to imagine a betterbasis for comparison. Professional forecasters do exactly what many assume rationalindividuals should do, make systematic and thorough analyses of economic conditionsand form opinions based on these assessments.
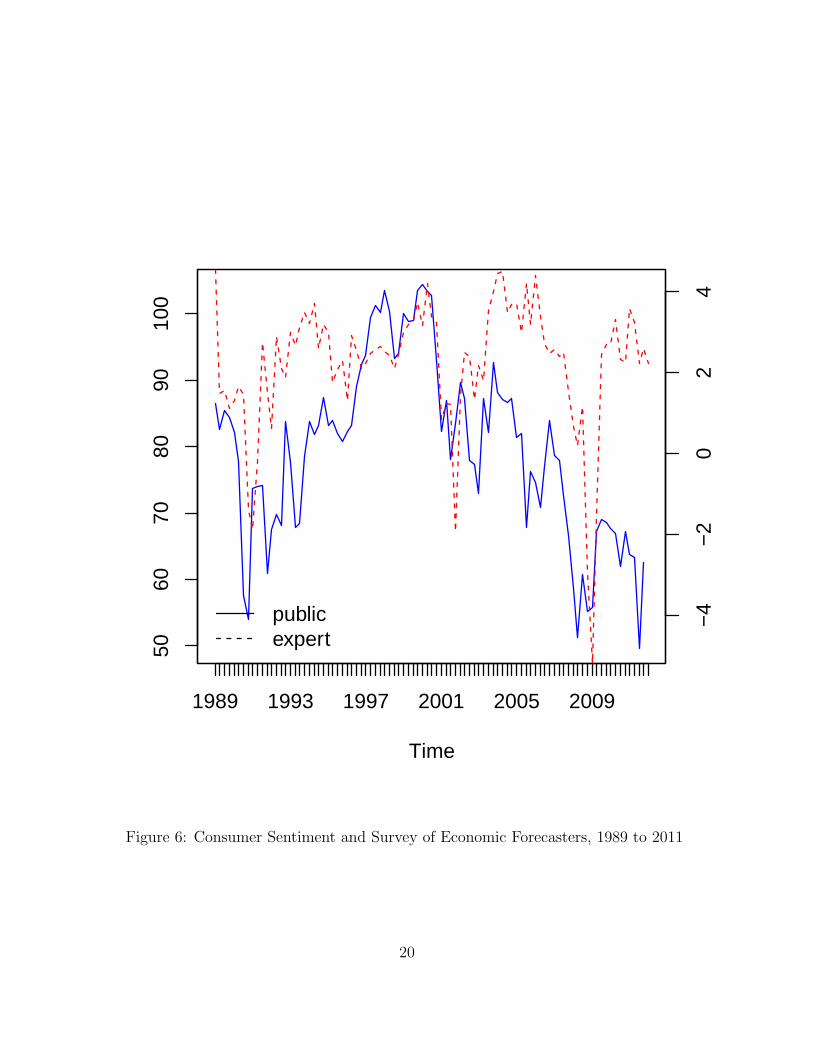
The question asked in the survey that best serves as a comparison to the public’sassessment of current economic conditions is the one in which forecasters are askedto predict mean economic growth for the quarter in which the survey is being ad-ministered. Thus, they are being asked to evaluate the current state of the economyusing information from previous quarters. The comparison between the forecasts ofprofessionals and the assessments of the public is not without its limitations, princi-pally the public is being asked to rate the economy (a very general question) and theforecasters are being asked about a specific aspect of the economy (growth in GDP).Still, economic growth is a broad measure of the state of the economy and thus there isreason to believe that the over time change in these two variables make for a reasonablecomparison between “rational” decision-making and the public.
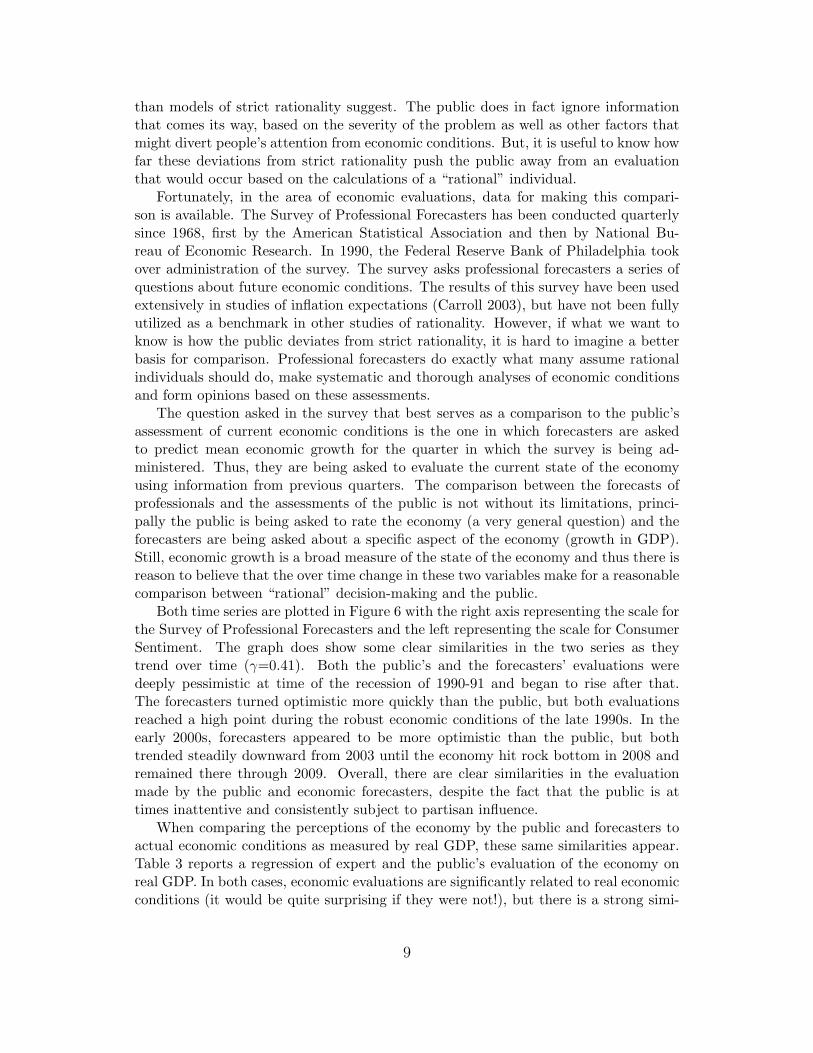
Both time series are plotted in Figure 6 with the right axis representing the scale forthe Survey of Professional Forecasters and the left representing the scale for ConsumerSentiment. The graph does show some clear similarities in the two series as theytrend over time (γ=0.41). Both the public’s and the forecasters’ evaluations weredeeply pessimistic at time of the recession of 1990-91 and began to rise after that.The forecasters turned optimistic more quickly than the public, but both evaluationsreached a high point during the robust economic conditions of the late 1990s. In theearly 2000s, forecasters appeared to be more optimistic than the public, but bothtrended steadily downward from 2003 until the economy hit rock bottom in 2008 andremained there through 2009. Overall, there are clear similarities in the evaluationmade by the public and economic forecasters, despite the fact that the public is attimes inattentive and consistently subject to partisan influence.
When comparing the perceptions of the economy by the public and forecasters toactual economic conditions as measured by real GDP, these same similarities appear.Table 3 reports a regression of expert and the public’s evaluation of the economy onreal GDP. In both cases, economic evaluations are significantly related to real economicconditions (it would be quite surprising if they were not!), but there is a strong simi-
9
larity in the relationships. There is a slightly smaller standard error for the residuals ofexperts (1.38) when compared to the public (1.48), but this difference does not alter theoverall sense that experts don’t have an enormous advantage in accurately evaluatingoverall economic conditions.
To get a sense of the impact of partisanship on the accuracy of evaluations of theeconomy, regressions were run in which partisans evaluations are regressed on realGDP. These are reported in Table 4. There are some differences in the strength ofthe relationship among the partisan groups, and this is consistent with the findingsof (Enns, Kellstedt & McAvoy 2012, Enns & McAvoy 2011) where these partisandifferences are described in more detail. The standard errors of the residuals are largerfor Democrats (1.54) and Republicans (1.62) than the public as a whole (1.48). Thus,there does seem to be some averaging between the evaluations of the two parties thatleads the overall evaluation to be somewhat closer to experts than the each of themare alone.
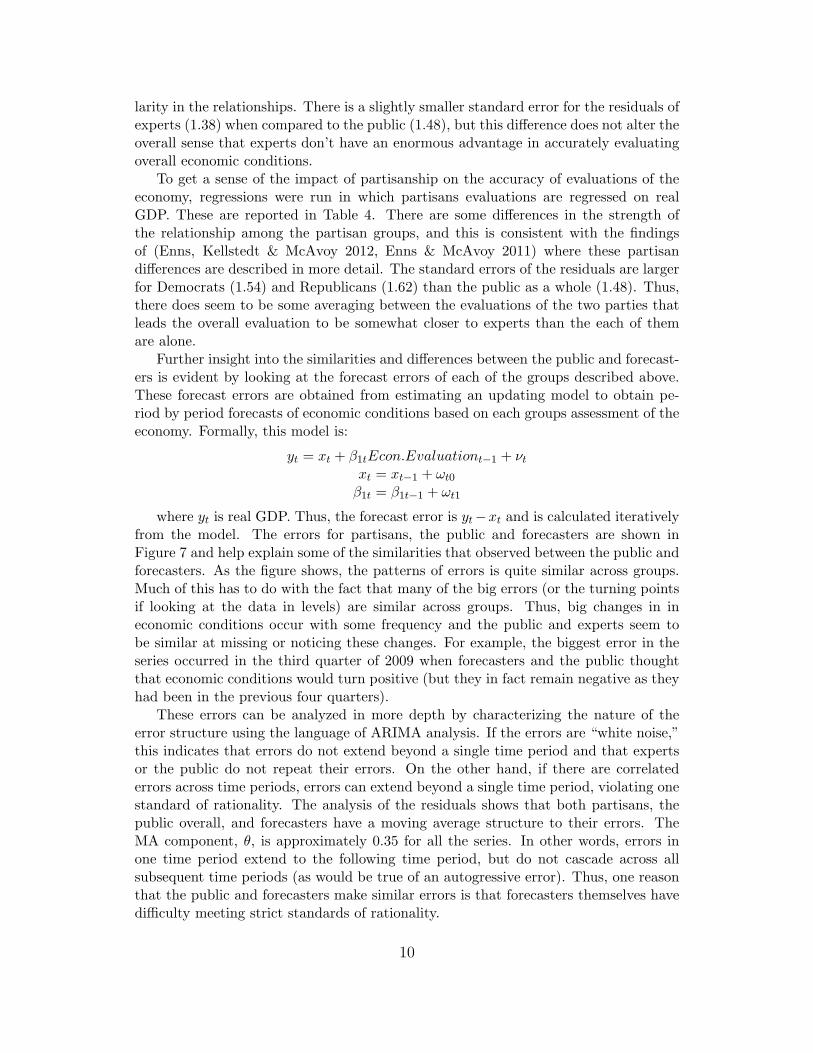
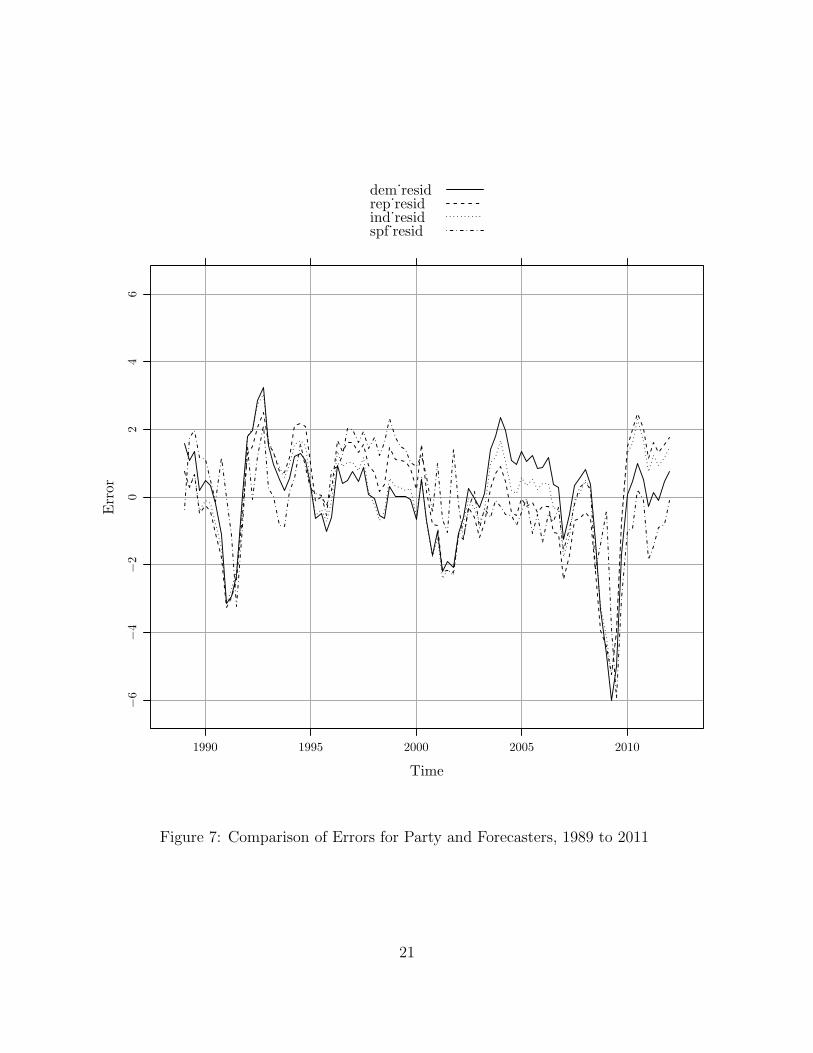
Further insight into the similarities and differences between the public and forecast-ers is evident by looking at the forecast errors of each of the groups described above.These forecast errors are obtained from estimating an updating model to obtain pe-riod by period forecasts of economic conditions based on each groups assessment of theeconomy. Formally, this model is:
yt = xt + β1tEcon.Evaluationt−1 + νtxt = xt−1 + ωt0
β1t = β1t−1 + ωt1
where yt is real GDP. Thus, the forecast error is yt−xt and is calculated iterativelyfrom the model. The errors for partisans, the public and forecasters are shown inFigure 7 and help explain some of the similarities that observed between the public andforecasters. As the figure shows, the patterns of errors is quite similar across groups.Much of this has to do with the fact that many of the big errors (or the turning pointsif looking at the data in levels) are similar across groups. Thus, big changes in ineconomic conditions occur with some frequency and the public and experts seem tobe similar at missing or noticing these changes. For example, the biggest error in theseries occurred in the third quarter of 2009 when forecasters and the public thoughtthat economic conditions would turn positive (but they in fact remain negative as theyhad been in the previous four quarters).
These errors can be analyzed in more depth by characterizing the nature of theerror structure using the language of ARIMA analysis. If the errors are “white noise,”this indicates that errors do not extend beyond a single time period and that expertsor the public do not repeat their errors. On the other hand, if there are correlatederrors across time periods, errors can extend beyond a single time period, violating onestandard of rationality. The analysis of the residuals shows that both partisans, thepublic overall, and forecasters have a moving average structure to their errors. TheMA component, θ, is approximately 0.35 for all the series. In other words, errors inone time period extend to the following time period, but do not cascade across allsubsequent time periods (as would be true of an autogressive error). Thus, one reasonthat the public and forecasters make similar errors is that forecasters themselves havedifficulty meeting strict standards of rationality.
10
Conclusion
For a long time, political observers and researchers have been frustrated by the public’sinability to measure up to the ideals of democratic citizenship. Among the public’smany documented failings are an inability to form coherent preferences, limited fac-tual knowledge about current events and political leaders, and low participation rates.However, aggregate studies of political behavior have tried to restore legitimacy topolitical decision-making by arguing that individuals may fail to meet the standardsof good democratic citizenship, but that in the aggregate, through the miracle of ag-gregation and the subset of the public that is attentive, meaning and legitimacy ofpolitical decision-making are possible. The difficulty, of course, is that in making thisleap from individual irrationality to collective rationality, researchers have side-steppedor ignored some of the key findings from individual-level studies about how the pub-lic processes information and the extent to which its ability to process information iscompatible with collective rationality.
The focus of this research is on the role of information reception in the formationof opinions about economic conditions in order to better understand the informationprocessing system that guides opinion formation. As Zaller notes, the availability ofinformation does not necessarily mean that it is received and just because it is receiveddoes not mean that it will be used in opinion updating. So unlike theories of rationalaggregate behavior which assume that all information that is received will be used, theevidence from this studies shows that public is more selective in its use of information.During economic downturns (marked by recessions), there is heightened awareness anduse of economic information. During periods of economic prosperity and when otherissues are ahead of the economy on the political agenda, the public routinely ignoresinformation that could be useful in updating its assessment of economic conditions.Interestingly, the role of information about economic conditions like unemployment isprimarily to drag down the public’s assessment of the economy but almost never toincrease it. Thus, the public’s assessment of economic conditions does not noticeablyimprove with good news about unemployment.
Finally, as the comparison of economic evaluations between the public and economicforecasters shows, there is reason to believe that despite its selective use of information,the public does not go widely astray in its evaluations of the economy. For much of thetime period studied, assessment of the public and professional forecasters maintaineda reasonably tight correspondence. (This finding is similar to studies that compareinflation expectations of the public to those of forecasters (Carroll 2003, Mankiw, Reis& Wolfers 2004). This can occur either because the public relies on information shortcuts and selective use of information in making judgments that allow them to act asif the public where more rational than it appears; or, that forecasters themselves failto live up to the standard of economic rationality.9 In the former case, the similaritybetween the two does provide some reason to believe there is some clear coherence toaggregate evaluations and that a merging of individual-level findings about informa-
9For example, they, too, might be subject to contagion, since over time, forecasters might be reluctant tomake forecasts that are too far from the group mean.
11
tion processing with aggregate outcomes should lead to a better model of aggregatebehavior.
12
References
Beck, Nathaniel. 1983. “Time-Varying Regression Models.” American Journal of Po-litical Science 27(3):557–600.
Campbell, Angus, Philip E. Converse, Warren E. Miller & Donald E. Stokes. 1960.The American Voter. New York: Wiley.
Carroll, Christopher. D. 2003. “Macroeconomic Expectations of Households and Pro-fessional forecasters.” Quarterly Journal Of Economics 118(1):269–298.
De Boef, Suzanna & Paul M. Kellstedt. 2004. “The Political (and Economic) Originsof Consumer Confidence.” American Journal of Political Science 48:633–649.
Duch, Raymond M., Harvey D. Palmer & Christopher Anderson. 2000. “Heterogeneityin Perceptions of National Economic Conditions.” American Journal of PoliticalScience 44:635–652.
Enns, Peter. K. & Gregory E. McAvoy. 2011. “The Role of Partisanship in AggregateOpinion.” Political Behavior on-line.
Enns, Peter K., Paul M. Kellstedt & Gregory E. McAvoy. 2012. “The Consequences ofPartisanship in Economic Perceptions.” Public Opinion Quarterly 76(2):287–310.
Erikson, Robert S., Michael B. MacKuen & James A. Stimson. 2002. The Macro Polity.New York: Cambridge University Press.
Gaines, Brian J., James H. Kuklinski, Paul J. Quirk, Buddy Peyton & Jay Verkuilen.2007. “Same Facts, Different Interpretations: Partisan Motivation and Opinionon Iraq.” Journal of Politics 69:957–974.
Kahneman, Daniel & Amos Tversky. 1979. “Prospect Theory: An Analysis of Decisionunder Risk.” Econometrica 47:263–291.
Kim, Chang-Jin & Charles R. Nelson. 1998. State-Space Models with Regime-Switching:Classical and Gibbs-Sampling Approaches with Applications. MIT Press.
Krause, George A. 2000. “Testing for the Strong Form of Rational Expectations withHeterogeneously Informed Agents.” Political Analysis 8:285–305.
Lippmann, Walter. 1922. Public Opinion. New York: Macmillan.
Lodge, Milton, Marco R. Steenbergen & Shawn Brau. 1995. “The Responsive Voter:Campaign Information and the Dynamics of Candidate Evaluation.” AmericanPolitical Science Review 89:309–326.
Mankiw, N. Gregory, Ricardo Reis & Justin Wolfers. 2004. “Disagreement aboutInflation Expectations.” NBER Macroeconomics Annual 18.
McAvoy, Gregory E. 2006. “Stability and Change: The Time Varying Impact ofEconomic and Foreign Policy Evaluations on Presidential Approval.” PoliticalResearch Quarterly 59:71–83.
Page, Benjamin I. & Robert Y. Shapiro. 1992. The Rational Public: Fifty Years ofTrends in Americans’ Policy Preferences. Chicago: University of Chicago Press.
13
Shumway, Robert H. & David S. Stoffer. 2006. Time series Analysis and Its Applica-tions: With R Examples. New York: Springer.
Sims, Christopher. A. 2003. “Implications of Rational Inattention.” Journal Of Mon-etary Economics 50(3):665–690.
Sims, Christopher. A. 2006. “Rational Inattention: Beyond the Linear-QuadraticCase.” American Economic Review 96(2):158–163.
Soroka, Stuart N. 2006. “Good News and Bad News: Asymmetric Responses to Eco-nomic Information.” Jounral of Politics 68(2):372–385.
Stimson, James A. 1999. Public Opinion in America: Moods, Cycles, and Swings. 2nded. Boulder, CO: Westview Press.
Stimson, James A. 2004. Tides of Consent: How Public Opinion Shapes AmericanPolitics. New York and London: Cambridge University Press.
Taber, Charles S. & Milton Lodge. 2006. “Motivated Skepticism in the Evaluation ofPolitical Beliefs.” American Journal of Political Science 50(3):755–769.
Zaller, John R. 1992. The Nature and Origins of Mass Opinion. New York: CambridgeUniversity Press.
14
Unfavorable News Heard
Time
New
s U
nfav
orab
le
020
4060
8010
0
1990 1995 2000 2005 2010
Figure 1: Hearing Unfavorable News Reports, 1989 to 2011
15
1990 1995 2000 2005 2010
05
1015
Time
TV
P, U
nem
. vs.
New
s
Figure 2: Time Varying Effects of Unemployment on News Reception, 1989 to 2011 (Grayareas denoted recessions)
16
1990 1995 2000 2005 2010
−6
−4
−2
0
Time
TV
P, C
onsu
mer
Sen
t. an
d U
nem
ploy
men
t
Figure 3: Time Varying Effects of Unemployment on Consumer Sentiment, 1989 to 2011(Gray areas denoted recessions)
17
1990 1995 2000 2005 2010
−6
−4
−2
02
Time
TV
P, C
onsu
mer
Sen
t. a
nd I
nflation
Figure 4: Time Varying Effects of Inflation on Consumer Sentiment, 1989 to 2011 (Grayareas denoted recessions)
18
Time
Rate
National E
conom
y
1.0
1.5
2.0
2.5
3.0
3.5
4.0
1990 1995 2000 2005 2010
DemIndRep
Figure 5: The Public’s Rating of the National Economy, Feb. 1989 to April 2012
19
1989 1993 1997 2001 2005 2009
5060
7080
9010
0
Time
−4
−2
02
4
publicexpert
Figure 6: Consumer Sentiment and Survey of Economic Forecasters, 1989 to 2011
20
Time
Error
−6
−4
−2
02
46
1990 1995 2000 2005 2010
dem˙residrep˙residind˙residspf˙resid
Figure 7: Comparison of Errors for Party and Forecasters, 1989 to 2011
21
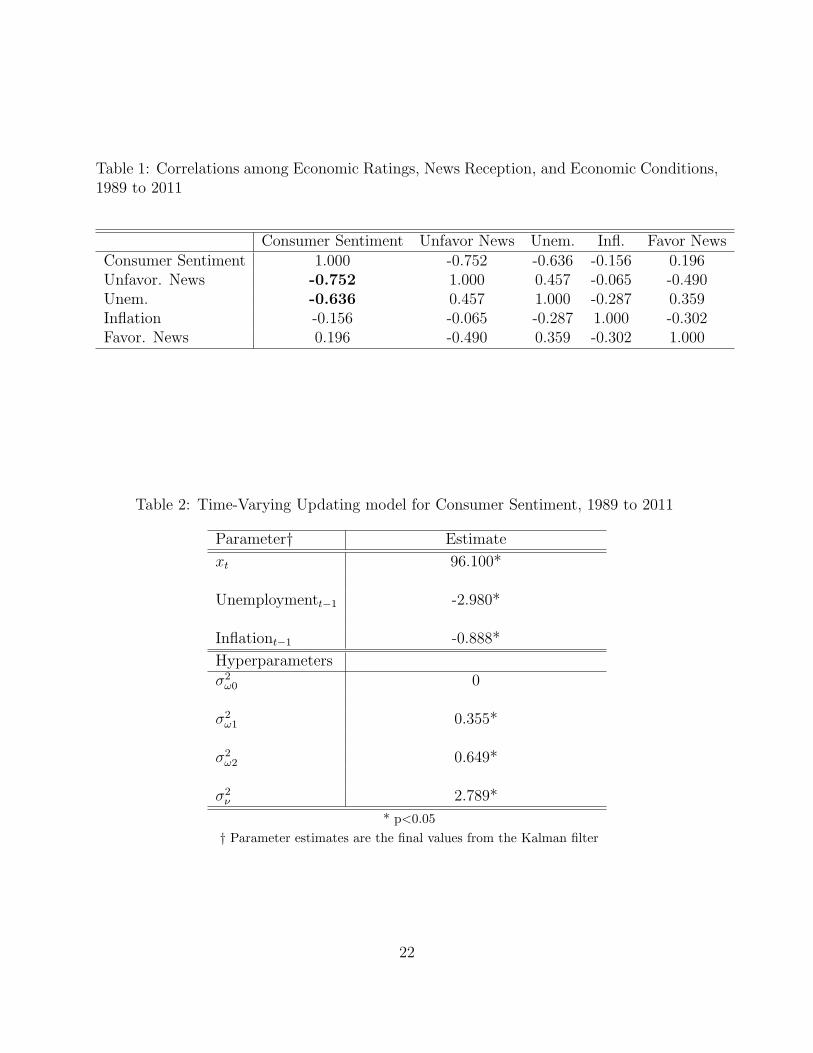
Table 1: Correlations among Economic Ratings, News Reception, and Economic Conditions,1989 to 2011
Consumer Sentiment Unfavor News Unem. Infl. Favor NewsConsumer Sentiment 1.000 -0.752 -0.636 -0.156 0.196Unfavor. News -0.752 1.000 0.457 -0.065 -0.490Unem. -0.636 0.457 1.000 -0.287 0.359Inflation -0.156 -0.065 -0.287 1.000 -0.302Favor. News 0.196 -0.490 0.359 -0.302 1.000
Table 2: Time-Varying Updating model for Consumer Sentiment, 1989 to 2011
Parameter† Estimate
xt 96.100*
Unemploymentt−1 -2.980*
Inflationt−1 -0.888*
Hyperparametersσ2ω0 0
σ2ω1 0.355*
σ2ω2 0.649*
σ2ν 2.789*
* p<0.05
† Parameter estimates are the final values from the Kalman filter
22
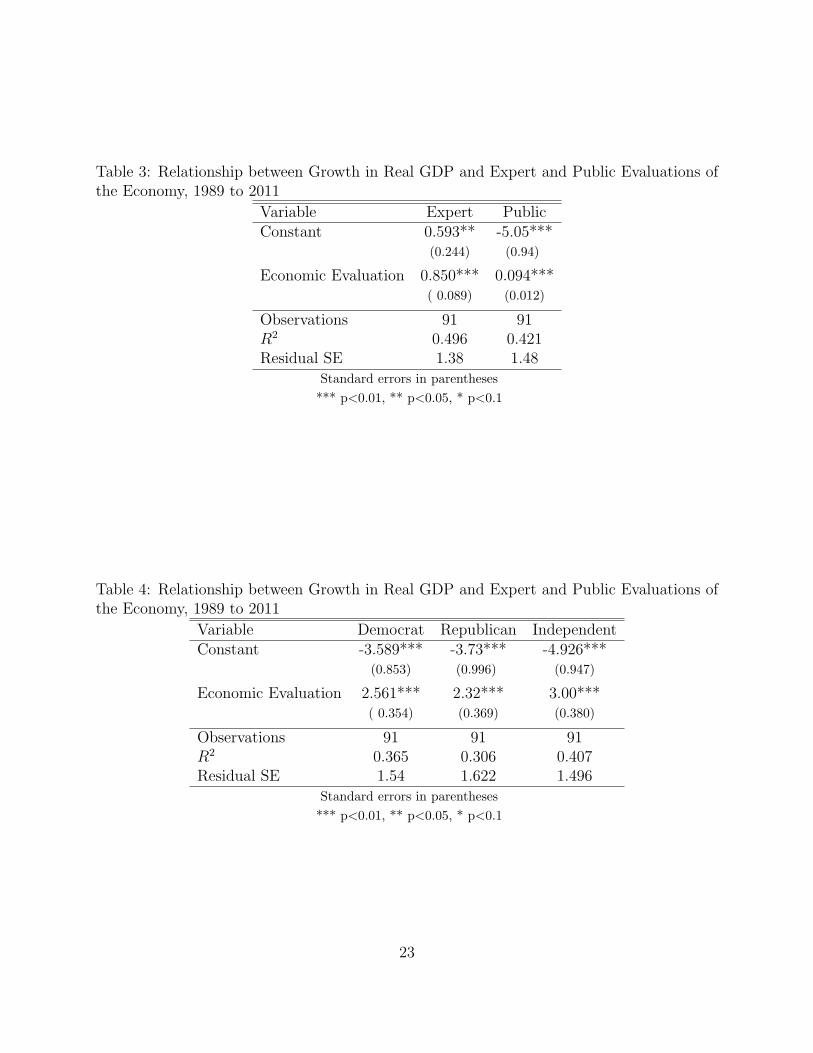
Table 3: Relationship between Growth in Real GDP and Expert and Public Evaluations ofthe Economy, 1989 to 2011
Variable Expert PublicConstant 0.593** -5.05***
(0.244) (0.94)
Economic Evaluation 0.850*** 0.094***( 0.089) (0.012)
Observations 91 91R2 0.496 0.421Residual SE 1.38 1.48
Standard errors in parentheses
*** p<0.01, ** p<0.05, * p<0.1
Table 4: Relationship between Growth in Real GDP and Expert and Public Evaluations ofthe Economy, 1989 to 2011
Variable Democrat Republican IndependentConstant -3.589*** -3.73*** -4.926***
(0.853) (0.996) (0.947)
Economic Evaluation 2.561*** 2.32*** 3.00***( 0.354) (0.369) (0.380)
Observations 91 91 91R2 0.365 0.306 0.407Residual SE 1.54 1.622 1.496
Standard errors in parentheses
*** p<0.01, ** p<0.05, * p<0.1
23