Embed Size (px)
Citation preview
IS THE CONDUCTION OF THE NERVE IMPULSE A CHEMICAL OR A PHYSICAL PROCESS ?
BY S. S. MAXWELL.
(From the Rudolph Spreckels Physiological Laboratory of the Unhersity of California.)
(Received for publication, July 12, 1907.)
I.
The remarkable resistance of nerves to fatigue and the diEi- culty of demonstrating satisfactorily the existence of chemical changes as the result of stimulation of the nerve are too well known to require restatement or discussion. The experiments of Bowditch, Wedenski and others, in which nerves were stimu- lated for many hours without indications of fatigue, are described in the common text-books. The failure to detect the liberation of heat from a stimulated nerve is equally well known. From these experiments the conclusion has very frequently been drawn that the transmission of the nerve impulse is a purely physical, molecular, and not a chemical process. In connection with these facts and the much investigated electro-motive phenomena of nerve a mountain of physical hypotheses as to the nature of the nerve impulse has been built up.
On the other hand it has often been argued that all other “life processes” with which we are familiar are associated with some sort of chemical change and that it would not be safe to decide upon purely negative evidence that the propagation of the nerve impulse is a unique exception. It is possible to conceive that fatigue does occur, but that recuperation takes place so rapidly that the recovery can be completed in the short intervals between the successive shocks of the Faradic current. The attempts to secure positive evidence of chemical change in stimulated nerve have taken in the main four forms:
I. The attempt to prove fatigue of the nerve. Passing by the earlier experiments, the results of which were
wholly negative or the methods admittedly faulty, I merely 359
360 Conduction of Nerve Impulse
mention some of the more recent attempts. Gotch and Burch’ found that when two stimuli separated by a very brief interval of time were applied to a frog’s sciatic, no electro-motive response to the second shock was obtained if the interval was less than about 0.006 of a second. They also noted that the duration of this “ critical interval” was very greatly influenced by tempera- ture.
According to Garter? definite fatigue could be produced in the olfactory nerve of the Pike by the use of induction shocks occur- ring as frequently as every 0.27 of a second. In this case the evidence of fatigue was the failure of the electro-motive response.
2. The attempt to demonstrate the presence of the products of chemical change in stimulated nerve.
Again I pass by the older observations. Waller3 has shown that tetanization of a nerve for a few minutes increases its sub- sequent electro-motive response to induction shocks, and that a similar increased response can also be obtained by exposing the nerve for a short time to very dilute carbon dioxide. From these experiments he argues the probability of the production of carbon dioxide in the stimulated nerve. The observation is extremely interesting, but the argument that the cause of the increased electro-motive effect is the same in both cases is certainly not convincing.
Bethe has shown that certain substances, fibril acids, in the neurofibrillae, have their distribution altered by the passage of a constant current through the nerve, in such way that the readily staining fibril acids migrate away from the anodal region and collect at the cathodal. He assumes provisionally that the con- ditions of anelectrotonus and catelectrotonus are connected with this movement, and that changes in the fibril acids, orin their relation to the neuro-fibrilhe, have to do with the propagation of the nerve impulse. In order, however, to secure the character- istic difference between anode and cathode, as brought out by staining, the current must be allowed to act for an exceedingly
‘Gotch and Burch: Joum. of Physiol., xxiv, p. 410, 1889. 2Garten, quoted by Biedermann in Ergeb. d. Physiol., ii, 2, p. 129. 3 Waller: Lectures on Physiology, First Series, London, 1897. 4 Bethe: Allgemeine Anutomie w& Physiologie des Nervensystems, Leip-
zig, 1903.
S. S. Maxwell 361
long time compared to that in which stimulation and conduction can occur. It would not be safe to assume that these changes are the essential factors in nerve excitation and conduction.
3. The attempt to demonstrate a change of temperature in stimu- lated nerve.
Helmholtz’ working with a thermopile could find no evidence of evolution of heat in the frog’s sciatic when stimulated.
Heidenhaix? obtained similar results. SchiP believed that he could show with the thermopile the
production of heat in stimulated nerves of the cat and rabbit. Rolleston,4 using an exceedingly sensitive electrical resistance
thermometer, could find no change of temperature in nerve as the result of stimulation.
4. The attempt to prove the necessity of free oxygen to the nerve. According to BaeyeP a nerve surrounded by an atmosphere of
pure nitrogen or hydrogen loses its irritability in about five hours, and becomes again excitable within a few minutes after the read- mission of oxygen. He compared the effect of lack of oxygen upon stimulated and unstimulated nerves and could find no well marked difference between them. So far as one may draw con- clusions from his experiments they seem to indicate that stimu- lation and conduction in the nerve are not oxidation processes.
II.
Neither the experiments mentioned above nor other work along similar lines have for so far given conclusive evidence as to the chemical or non-chemical nature of the nerve impulse. In the effect of temperature on reaction velocity van’t Hoff e and Arrhe- nius7 have pointed out a simple and reliable criterion for thedis- crimination between chemical processes and those which are usu- ally designated purely physical processes. They have shown that a rise of 10~ of temperature increases the velocity of a chemical
1 Helmholtz: A&z. f. Anat. u. Physiol., p. 158, 1848.
2 Heidenhain: Studien d. physiol. Inst. zu Breslau, iv, p. 250, 1868.
3 Schiff: Arch. de physiol. norm. et pathol., p. 157, 1869. 4 Rolleston: Journ. of Physiol., ii, p. 208, 1890. 6 Baeyer: Zeitscer. f. allgem. Physiol., ii, p. 169, 1903. B Van’t Hoff: Etudes de dynumique chimique, Amsterdam, 1884.
7 Arrhenius: Zeitschr. f. physikal. Gem., iv, p. 226, 1899.
362 Conduction of Nerve Impulse
reaction to two or three times its original rate, while no known physical process is accelerated in anything like so great an amount by a similar rise of temperature, probably not more than 5 to 15
per cent at the most. This principle has been used by Loeb’ to show that the artificial maturation of the eggs of Lottia is really a chemical process. Mr. C. D. Snyder was also asked by Pro- fessor Loeb to investigate the effect of temperature on the re- action velocity of the tortoise heart. These experiments gave a high temperature coefficient and indicated definitely that chemical processes underlie the rhythmic activity of the heart.2 His observations were fully confirmed by Robertson using the heart of a crustacean, Ceriodaphnia.3 The same criterion has been used by Loeb4 to determine whether the production of artificial parthenogenesis by the action of hypertonic sea water depends upon changes of a chemical or of a physical nature. The high coefficient obtained showed conclusively that the process is a chemical one. Professor Loeb also asked Dr. Burnett and myself to investigate the effect of temperature on the velocity of the nerve impulse, since it would be possible by this means definitely to decide whether the propagation is due to chemical or to non-chemical processes. Dr. Burnett found it advantageous in the beginning of his experiments to study the effect of temperature on the latent period of striated muscle. This part was published early in 1906.~ Afterward on account of the pressure of other work Dr. Burnett was unable to continue the investigation, and, at Professor Loeb’s request, I have carried it through with the results herein reported.
The fact that the velocity of the nerve impulse is affected by temperature was observed by Helmholtz? and has been frequent.ly noted since, but so far as I know,, no investigations have hereto- fore been made with the direct purpose of determining the tem- perature coefficient of nerve conduction. Nicolai7 made a
’ Loeb: University of California Publications, Physiology, iii, p. I, 1905. ZSnyder: Ibid., ii, p. 125, 1905. 3 Robertson: Biol. Bull., x, p. 242.
4 Loeb: University of California Publications, Physiology, iii, p. 40, Igob. 5 Burnett: This Jownal, ii, p. 195, Igob. B Helmholtz: Arch. f. Anat. u. Physiol., p. 358, 1850.
’ Nicolai: Arch. f. d. ges. Physiol., lxxxv, p. 65, 1901; Arch. f. Physiol., 1905, supplement, p. 341.

S. S. Maxwell
series of experiments on the speed of the nerve impulse in the olfactory of the Pike, in which, among other things, he con- sidered the effect of temperature. He used the “negative varia- tion” photographically recorded as the indicator of the passage of the impulse. His results show indeed that the velocity is affected by the temperature, but the experiments were not speci- fically planned for the determination of the temperature coeffi- cient and for several reasons are inapplicable to that purpose. The length of nerve employed was relatively small, from 4 to 23 millimeters, allowing room for large experimental errors. The temperature changes were, except in one experiment, all made in one direction; that is, the temperature was either raised for each successive observation, or lowered for each, so that it was not possible to know whether the observed change in rate was all due to the change in temperature, or whether it was also affected by other variables. The importance of this consideration I shall discuss more fully in connection with my own experiments. Von Miraml studied the effect of high temperatures on the con- ductivity of the frog’s sciatic. His results are given in the form of curves and averages. On account of the great individual variations a statistical method is absolutely out of the question in dealing with the effect of temperature on nerve conduction and hence von Miram’s paper is unavailable for the purpose. His table shows, for example, at 15' a minimum rate of 25 meters and a maximum rate of 38.7 meters a second, and at 30~ a mini- mum of 38.7 and a maximum of 49.5 meters. Since, according to this, one nerve at 15~ may have a higher rate than another at 25' it is evident that one cannot safely draw conclusions from averages except from an impossibly large number of observa- tions. Besides, the high rate of the impulse in the frog’s nerves makes it necessary to deal with differences of thousandths of a second-differences in many cases smaller than the probable experimental error.
Snyder2 has based on Nicolai’s and v. Miram’s experiments calculations of the temperature coefficient of the velocity of the nerve impulse, and concludes that “a comparison of tempera-
1 Van Miram Arch. f. Physiol., : p. 5 33, 1906. 2 Snyder: Arch. f. Physiol., p. I I 3, 1907.

364 Conduction of Nerve Impulse
ture coefficients leaves us no longer in doubt as to the nature of nerve conduction.” The methods employed in calculating these coefficients are not free from objection. He says, “I have used only the average values of the determinations of these authors.” At first glance it is hard to see how these averages were made. Of the eight lines in the table founded on Nicolai’s tables,l I quote as specimens the first two and the last.
t1 12 RI RP 10 R, Rz (6 - td
9.25 3.45 13.7 5.65 4.1 9.25 4.82 13.7 8.55 3.6
25.0 3.45 22.2 5.65 1.8
In the above table at rate 13.7 temperature 9.25 is obtained by averaging two consecutive observations in the experiment of November I I in which the stimulus was the closing of a constant current. The single items are
go rate 14.6 9.5O “ 12.8
Compared with this is rate 5.65 at temperature 3.45 obtained by combining and averaging as follows:
3.7O rate 6.4 \ from above mentioned experiment of November 3.5” “ 6.4( 11. 3.40 “ 5.7 from an experiment of November 30, using 3.2’= “ 4.1 > break induction shock as stimulus. --
Average 3.45’ “ 5.65
In the second line the same 13.7 rate is used as before. The rate 8.55 at temperature 4.82 is secured by the following selec- tion :
5.0°rate 7.61 4.70 “ 7.1(
from above experiment of November 11.
4.8’ “ 10.2 ‘1 from an experiment of November 28, break 4.8’ “ 9.3 ( induction shock. - -
Average 4.82’ “ 8.55
r Arch. f . d. ges. Physiol., Ixxxv, pp. 82 and 83.
S. S. Maxwell
Finally the rate of 2 2.2 at temperature 25' was the last response of the dying nerve used in the experiment of November I I, and the only observation recorded at that temperature. It will thus be seen that the tables in Snyder’s paper are obtained by select- ing and comparing a few observations made upon the nerves of different animals and in different degrees of freshness. One of these nerves, moreover, is expressly stated by Nicolai to have been injured by lying on ice. By a different selection of data a different conclusion might be reached.
III.
Our own experiments herein described were all made upon the pedal nerves of the giant slug, Ariolivnax columbianus. The importance of this selection is seen in the great length of nerve available and the slowness of the impulse, Jenkins and Carlson’ having found a mean rate of 440 millimeters a second, while it is possible to use a nerve IOO millimeters or more in length. If, on the other hand, the frog’s sciatic were employed one would expect to deal with magnitudes of the following order: Suppose a distance of 30 millimeters between the near and far points of stimulation and at a certain temperature a rate of 30 meters a second. This would mean a difference in length of latent periods for the near and the far points of 0.001 of a second. Now sup- pose at another temperature the rate is 45 meters a second; the difference of the latent periods becomes one one-thousand-five- hundredth of a second. The value of the desired quotient will thus depend upon a time relation of the difference between one one-thousandth and one one-thousand-five-hundredth, or one three-thousandth of a second; or, if one uses to measure the time a tuning fork of 200 double vibrations a second, it depends on the measurement of one-fifteenth of a single wave. It is at once apparent that the probable error in such a calculation is vastly larger than in observations on the pedal nerves of Ariolirnax in which one may obtain differences between the latent periods for the near and the far points of from four to thirty-hundredths of a second.
1 Jenkins and Carlson: Amer. Jown. of Physiol., viii, p. 251, 1903.
Conduction of Nerve Impulse
The methods at first employed were essentially those of Jen- kins and Carlson’ except that the moist chamber in which the animal was placed was so arranged that its temperature could be regulated by surrounding it with warm or cool water as desired. It was soon found that this plan was impracticable because when the muscle is cooled the latent period is enor- mouslylengthened, the muscle contracts very slowly, and the total shortening is greatly reduced. It thus becomes difficult at low temperatures to secure curves with sharply defined beginnings. When the higher temperatures were used another difficultywas found in the increasing tendency to spontaneous rhythmical con- tractions. For these reasons it was necessary to leave the mus- cle outside the moist chamber and to cool the nerve only.
After many trials the method finally adopted was as fol- lows: a moist chamber was constructed of heavy copper foil, 80 X 2 5 X 2 5 millimeters in size. This was soldered by one end to the inner wall of a metal case 120 x 105 x 40millimetersinside measurement. The outer case was provided with an inlet tube, through which water could be circulated, and a stirrer to equalize the temperature of the water. In the attached end of the moist chamber and the wall of the outer case was cut a V- shaped slit about IO millimeters deep. The edges of this slit and the end of the case in its neighborhood were coated with wax to prevent any possible contact of the nerve or muscle with the metal. The use of copper foil for the moist chamber made it necessary very carefully to avoid touching it with the nerve, which rested on the electrodes only. It was found that a moist chamber of hard rubber did not respond with sufficient promptness to changes of temperature for the purposes of this investigation.
The electrodes consisted of platinum wires sealed into slender glass tubes to insure perfect insulation. These tubes were then fastened in place by means of sealing wax. One pair of elec- trodes was placed near the V-shaped slit about halfway from bottom to cover of the moist chamber, the other pair was near the opposite end of the moist chamber and at a similar depth. The pairs of electrodes in part of the experiments were 32 milli- meters, in the others 64 millimeters apart. They were connected
1 Jenkins and Carlson: Amer. Joum. of Physiol., viii, p. 251, 1903.

S. S. Maxwell 367
with the poles of an inductorium by means of a Pohl’s commu- tator without cross wires, so that the stimulating current had the same direction in both pairs of electrodes.
The stimulus employed consisted of the break induction shock from a Zimmermann’s DuBois-Reymond inductorium of 10,000
windings, with one Edison-Lalande cell, Type 2, in the primary circuit. The circuit was broken automatically by a peg pro- jecting from the rim of the kymograph drum. The time was recorded by a tuning fork making IOO double vibrations a second.
Two large percolators connected by a Y-tube to the inlet tube of the outer case served as reservoirs of warm and cold water for the regulation of the temperature. A thermometer held by a rubber support was so placed that its bulb was near the middle of the moist chamber at the level of the nerve.
The muscle used consisted of about two or three centimeters of the posterior end of the foot. This was pinned firmly at its anterior end to a block which carried a small pulley. A hook was placed in the free, posterior end of the preparation, and a thread passed from the hook around the pulley, and up to a light lever arranged to record the contractions on the drum of the kymograph.
The muscle of the slug is so readily thrown into strong and lasting tonic contraction that special care had to be taken to get it into proper position before beginning the dissection. It was also found much better to secure the slug in its elongated position than to attempt after dissection to stretch the nerve to the length which it would have in the relaxed animal. In doing the latter one frequently finds that the adhering blood and mucus are much stronger than the nerve itself and, stretching irregularly, they tend to break or injure the nerve. For these reasons in making the preparations a second block was placed in front of the one bearing the pulley. The animal was placed on the blocks with the posterior end directed toward the pulley and allowed to creep until only about two centimeters of its length remained on the block bearing the pulley. Pins were now driven firmly through the body into this block very near its edge. The pinning usually acted as a stimulus to cause the animal to creep straight forward. When maximal elongation had been obtained in this way the anterior end was suddenly pinned down firmly, the body was
Conduction of Nerve Impulse
slit open and the viscera removed. A thread was tied around the pedal nerves near the pedal ganglion (the two nerves taken together made the best preparation), and their side branches were cut off as far back as the first pins. The nerve was then held up by the thread, care being taken to have it fully extended, and the body was cut through at the line of contact of the two blocks. The block with the preparation was now placed in front of the V-shaped slit in the moist chamber. A pledget of cotton wet with the animal’s blood was laid in the bottom of the slit, the nerve was extended across the two pairs of electrodes and held in position by looping the thread around a pin fastened at the far end of the moist chamber. The upper side of the slit was closed by another loose pledget of cotton wet with blood. The nerve touched only this moist cotton and the two pairs of electrodes. The moist chamber, which had been lined with thoroughly wet filter paper, was now closed with a glass plate covered with wet filter paper.
The velocity of the nerve impulse was determined by the method of Helmholtz. In its application, however, to the nerve of the slug certain difficulties must be mentioned. In order that the curves obtained by stimulation at the near and the far points respectively shall rise with equal steepness from the horizontal and so avoid error in determining the exact beginning of each curve, it is usual to employ a maximal stimulus. With the slug muscle, subject as it is to enormous changes of tonus, it is impossible to say what constitutes a maximal stimulus. The only practical thing to do is to use a strength of shock which experience proves to give fairly equal curves. If the curves do not come out well the tracing must simply be thrown away. Much time and many tracings were lost on account of this difficulty. I found it best to use fairly strong induction shocks, the secondary coil at from 275 to 300. If, however, the cur- rent employed was too strong, while the curves obtained looked very satisfactory, it often happened, that when the tuning fork record was counted the latent periods for the far and the near points were practically equal. What occurred was probably this, that on account of the high potential of the induced current and the poor electric conductivity of the nerve the effect was essentially the same as in the so-called unipolar stimulation;
S. S. Maxwell
the whole length of the nerve was excited simultaneously whether the near or the far electrodes were used. How easily the limit of allowable strength may be overpassed is shown by one experi- ment in which with the coil at 260 the latent periods for the two points of stimulation were equal while with the coil at 275 the results were apparently rational.
The nerve-muscle preparation of the slug is astonishingly sen- sitive to mechanical stimulation. I found, for example, that when the tuning fork was set in vibration before starting the kymograph the slight jar communicated to the table excited a contraction. For this reason it became necessary to support the tuning fork in a manner entirely independent of the table on which the moist chamber rested. For the same reason it was necessary to discard the ordinary brake used to start and stop the Ludwig kymograph and to employ a device which would work more smoothly.
The tendency to spontaneous rhythmical contraction frequently interfered with the experiments. The rate of these contrac- tions was always comparatively slow, usually not far from one a minute, and it was mostly possible to secure curves in the quiet intervals of relaxation which gave apparently rational results. Still it was impossible to be sure that the state of excitability of such a muscle would not so vary from moment to moment as to affect the length of the latent period and thus render unreliable the estimation of the rate of the impulse. On this account most preparations showing a persistent tendency to spontaneous con- tractions were thrown away as useless.
The contraction and relaxation of the slug muscle are rela- tively slow, especially the latter, and at times the muscle when once stimulated tends to remain for a considerable period in a state of strong tonic contraction. When this occurs it, of course, interferes seriously with accurate velocity determinations. I found, for example, that if the second curve was taken not more than half a minute after the first the results appeared usually to be reasonably consistent, but if a period of one or two minutes intervened absurd or poorly agreeing figures were obtained. It would seem that changes taking place in the muscle, impossible to control, affect the duration of the latent period. This makes it necessary to avoid all unnecessary delay between the two
370 Conduction of Nerve Impulse
curves. After considerable experience with this sort of diffi- culty, I found it best to throw away those tracings which I had marked “relaxation slow” without taking the trouble to count the vibrations. In order to shorten the time between the curves for the near and the far points I put two pegs for the circuit breaking key on the rim of the kymograph drum 180'
apart and adopted a rate of speed which allowed the essential part of the tracings to be taken within one half a revolution. This did away with the necessity of a readjustment of the drum between the two steps of the experiment. It also had the advantage of allowing twice as many tracings to be taken on the one drum.
In order to secure the quotient
Velocity at T + I o degrees
Velocity at T degrees
in which T and T + IO are absolute temperatures, it was thought preferable to make the observations at temperatures of exactly 10~ difference rather than to make calculations from observa- tions at other or random intervals. The plan usually followed was to take two observations at some convenient temperature; then by the method previously described to change the tem- perature IO' and take two observations, after which the nerve was brought back to the original temperature and two more determinations were made. The object in taking two determin- ations at each temperature was, of course, that they should serve as controls on each other. The reason for not taking more than two is that, while the nerve remains irritable for some hours after preparation, it nevertheless undergoes changes, degenerative or otherwise, which affect its conductivity. In order then that the chief variable shall be the change of tem- perature it is important that the observations shall follow each other as rapidly as possible. It is not possible, however, to secure a change of 10~ without a very considerable interval of time. It required usually five to eight minutes to bring about the desired change and be sure that the temperature would remain fairly constant during the observation. It was of course necessary that the nerve should have time to take the actual temperature indicated by the thermometer. As an
S. S. Maxwell 37’
extreme illustration of the progressive changes which may occur, apart from the change due to temperature, I quote from the tables to follow the velocities found in experiment 8:
Temperature.
210 210
Velocity in Centimeters.
110 11°
21° 210
2g 1 Average 28.5. 281
In the above it is evident that neither the quotient
42 28.5 ___ nor 23 .5 23.5
correctly represents the acceleration due to a rise of IO’, but that for temperature 21~ the mean of the first and last observa- tions,
24 + 28.5
2
should be taken, giving a quotient of
35.25
23.5
In a preceding section I stated that on account of the failure to observe the order of experiment just mentioned-i. e., a return to the beginning temperature-the data given by Nicolai and by v. Miram are not usable in calculating the temperature coefficient. Jenkins and Carlson* working with the pedal nerves of Ariolilnax observed that “the rate of the nervous impulse seems to vary with the freshness of the preparation.” Nicola? called attention to similar changes in the Pike’s olfactory and
1 Jenkins and Carlson: LOG. cit., p. 254. 2 Nicolai: Arch. f. Physiol., supplement, p. 376, 1905.

372 Conduction of Nerve Impulse
considered them to be the effect of the repeated stimulation. I am strongly inclined from some observations of my own to believe that these changes occur in the absence of repeated stim- ulation, and that they are caused by degenerative processes in the nerve fiber when separated from its cell body, but I have not sufficiently investigated the matter. The fact that they do occur renders the above order of procedure absolutely necessary.
In the course of my experiments I found that the preparations remained irritable for many hours, but that it was not advisable to make more than a few observations on each nerve, and then only while it was in the freshest condition possible. It is obvious that the nerve in the moist chamber is exposed to the influence of many unknown or uncontrollable variables, and that the effect of these must increase as the preparation becomes older. The possible injurious effect of repeated stimulation, contact with injurious substances, changes in moisture, etc., may occur. Other, accidental, disturbances may easily arise. For example I several times found that the nerve suddenly ceased to respond to the strength of shock which had just been giving good curves, and discovered that with the lowering of the temperature the moisture condensing on the nerve and electrodes had short- circuited the current. Changes also take place in the muscle as well as the nerve. This was evidenced by the increasing ten- dency to spontaneous contraction. These contractions were not caused by the condition of the nerve in the moist chamber for they were not affected by cutting the nerve off close to the muscle.
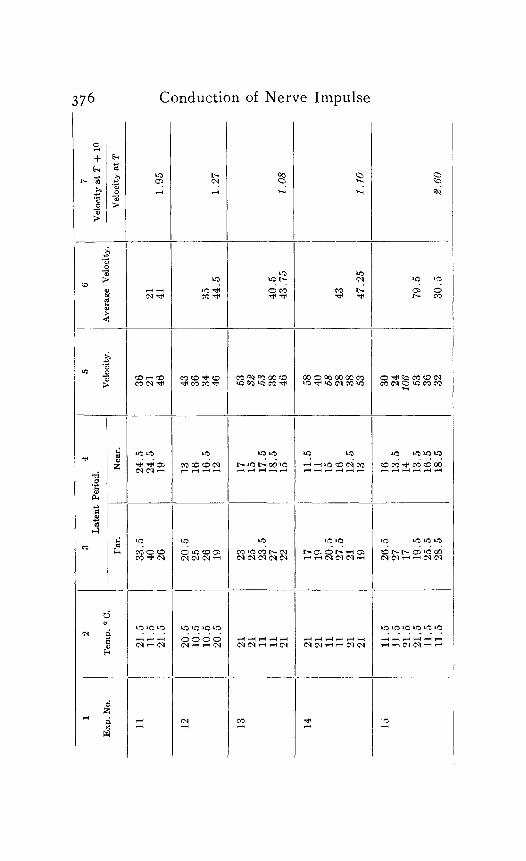
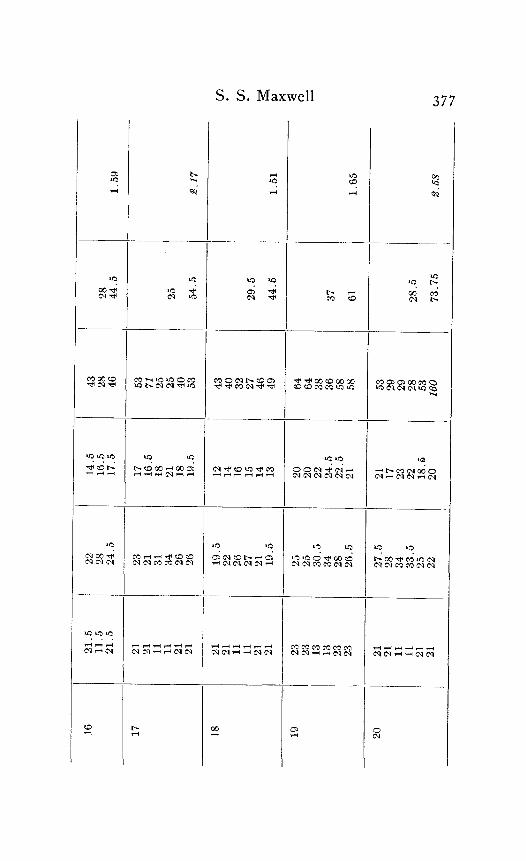
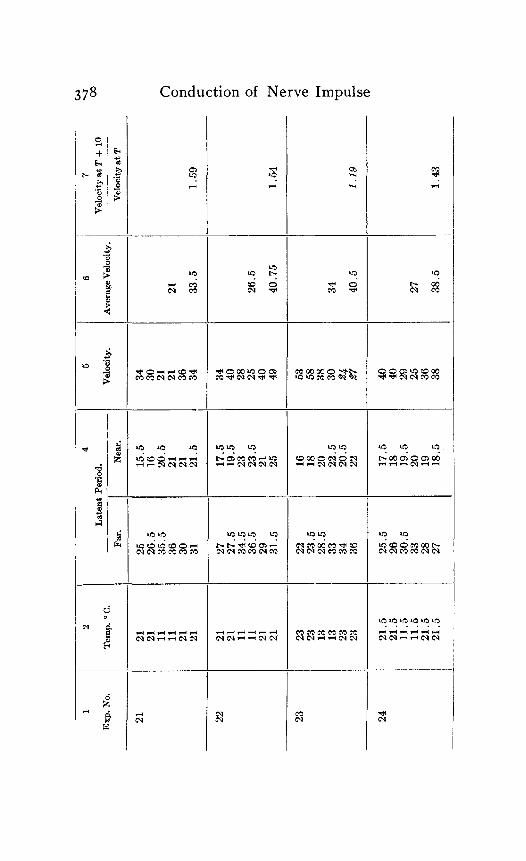
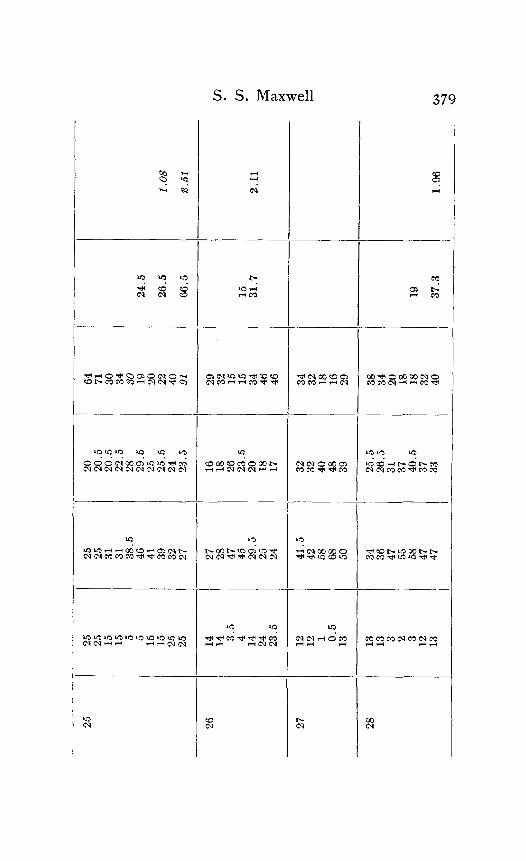
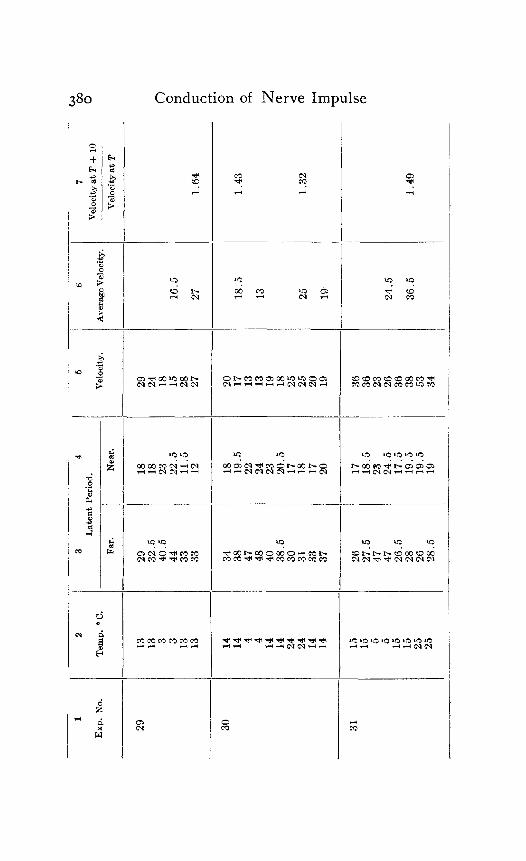
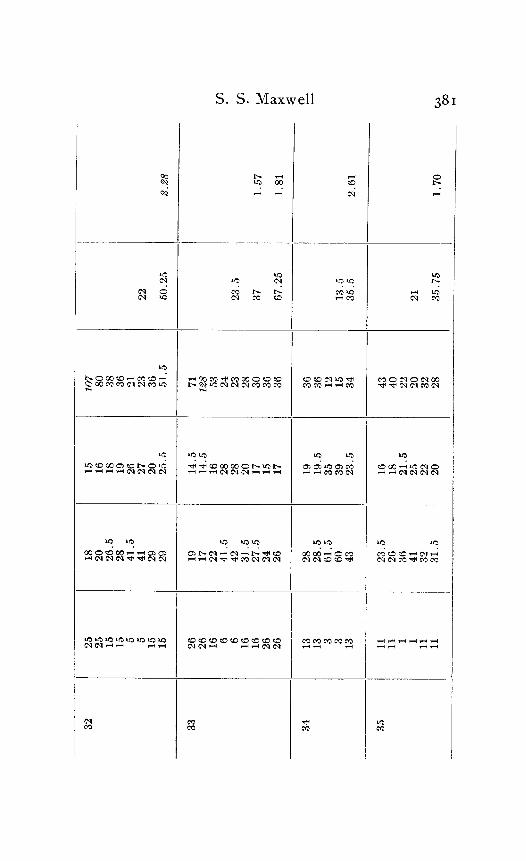
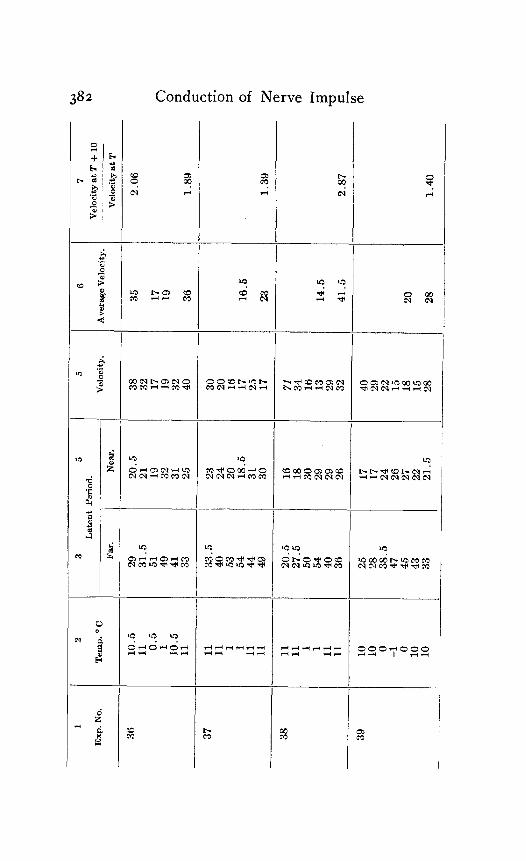
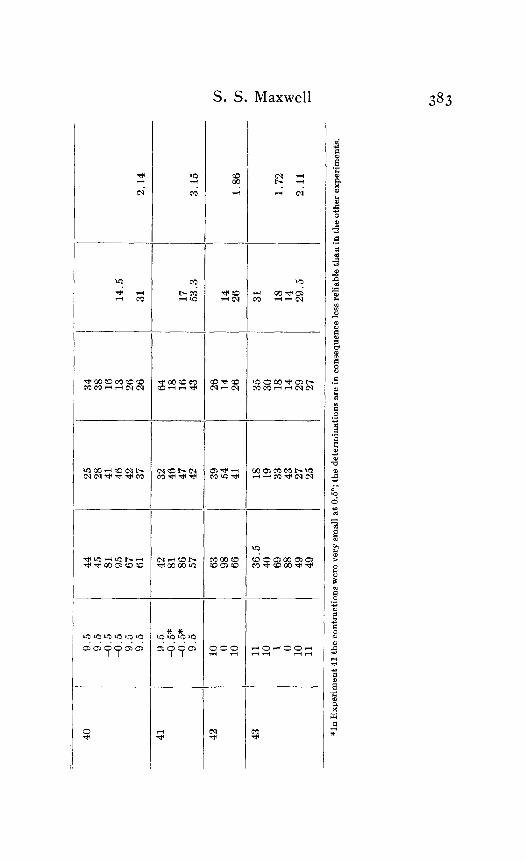
In the following table of results of my experiments I have given not only the calculated velocities and the temperature coefficients obtained from them, but also the latent periods for the near and far points in each experiment, in order that the reader may have an opportunity to judge of the degree of con- sistency and of variability in the individual experiments. Each numbered experiment represents a fresh preparation. The figures are given in the order in which the records were made. The intervals between the time of stimulation at the near and the far electrodes were, as stated above, not far from half a minute. The intervals between any two observations at the same temperature were usually from one to three minutes; and
S. S. Maxwell 373
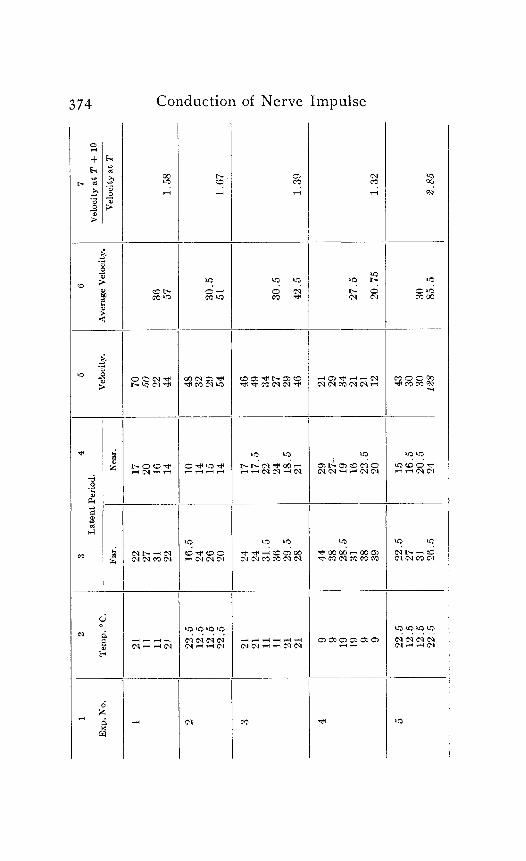
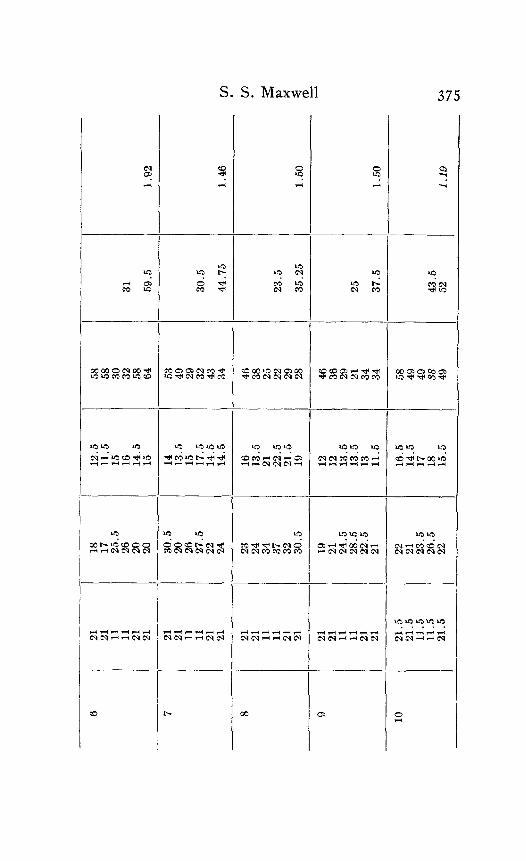
the intervals between observations at different temperatures were from five to eight minutes.
Column I is the number of the experiment. Column 2 is the tempera- ture. Column 3 is the latent period for the far point, and Column 4 for the near point, in hundredths of a second. Column 5 is the velocity in centimeters per second. In Column 6 the average velocity for each tem- perature is placed in line with the figure representing that temperature in Column 2. Column 7 is the quotient
Velocity at T + ICI Velocity at T
in which T and T+ I o represent the temperatures in the experiment.
Tem
p.
OC.
3 4
Late
nt
Perio
d.
1
Exp.
No
.
7 ;J
Ve
locity
at
T
+
10
P
Veloc
ity
at
T
Veloc
ity.
Aver
age
Veloc
ity.
2 36
57
.- .- .- .-
1 21
11
8: 22.5
12
.5
12.5
22
.5
16.5
10
24
26
:; 20
14
ii;
29
30.5
54
51
2 3 21
24
I
17
46
2i
27
30.5
29
46
42
.5
17..5
;z
18.5
21
4 21
ii ;: 27
.5
12
20.7
5
5:
29
27-
28.5
Zk
:: 22.5
39
20
5 22
.5
22.5
15
12
.5
27
16.5
12
.5
31
20.5
22
.5
26.5
24
El
30
I.%?8
6.
85
6 7 8 9
21
21
11
a:
21
21
21
11
11
21
21
21
21
:: 21
21 x:
:: 21
21
- -- -- -- -- -
18
17
25.5
26
s 30.5
20
fit.5
22
24
23
24
:; 32
30.5
19
21
24.5
28
.5
22.5
21
22
iii
5 26
:5
22
- -- -- -- -- -
12.5
11
.5
15
16
14.5
15
:34.
5
:::
5 14
:5
14.5
:36.
5 2
5 21
:5
19
:; 13.5
13
.5
13
11.5
16.5
14
.5
17
18
15.5
- -- -- -- -- -
__
L.
c-
-.
c-
-
31
59.5
30.5
44.7
5 1.
46
23.5
35.2
5 /
1.50
25
37.5
1.
50
43.5
52
1.
19
I w .,
7 - I
- -i-
3
4 La
tent
Perio
d. 5
6
Veloc
ity.
Avera
ge
Veloc
ity.
Veloc
ity
at T
+ 10
1
Exp.
No.
11
2
Tem
p.
o C.
-
21.5
11
.5
21.5
Far.
Near.
Ve
locity
at
T -:-
_-
_-
.- .- .- .-
_-
_-
_.
_-
_-
-
_-
_-
--
--
--
--
33.5
ii
24.5
24
.5
19
I%
46
21
41
35
44.5
1.95
20.5
25
26
19
13
16
16.5
12
12
20.5
10
.5
10.5
20
.5
1.27
40.5
43
.75
;“5
23.5
27
22
17
15
17.5
18
.5
15
13
21
21
::
I 21
1.
08
46
43
47.2
5
17
19
20.5
27
.5
21
19
11.5
11
15
14
2”: 11
16
12.5
13
;: 21
1.
10
.- 26
.5
T::
19.5
25
.5
28.5
16
13.5
14
13
.5
16.5
18
.5
15
11.5
11
.5
21.5
21
.5
11.5
11
.5
79.5
30.5
2.
60
S. S. Maxwell
1
Exp.
No
.
21
22
23
24
-- -.--
-- --
2
Tem
p.
o C.
I 5
I 6
7 2
Veloc
ity
at
T
+ 10
co
Veloc
ity.
1 Av
erag
e Ve
locity
. Ve
locity
at
T
f :
11
;: 21
21
21
11
;: 21
23
23
13
13
xx 21.5
21
.5
11.5
11
.5
21.5
21
.5
4
Late
nt.
Perio
d.
Far.
I
Near
.
15.5
16
35
.5
20.5
;:
21
31
z.5
27
17.5
27
.5
19.5
34.5
36
.5
z.5
29
I 21
31
.5
i 25
22
23.5
28
.5
8:
z.5
20.5
36
22
25.5
I
17.5
26
I
18
30.5
19
.5
xi 20
19
27
18
.5
-- -- -- -- -
21
33.5
I
34
ii 25
26.5
40
49
I
40.7
5
27
38.5
1.59
1.54
1.19
1.43
25
26
27
28
22
15
15 55
15 2 25
14
14 3.5
4 ;: 23.5
:2” A.5
13
13
13 x 3 :3
"
27
28
47
ii.5
25
24
41.5
ii
- --
_-
_-
20
20.5
20
.5
22.5
28
29
.5
25
25.5
16
2 23.5
20
:; 25.5
26
.5
:i 40.5
3":
- _I-
.- .- -
29
32
:: iii
46
:: 29
24.5
26.5
66.5
ii.7
19
37.3
1.08
2.61
1.96
2 9
1
Exp.
No.
2
Tem
p.
o C.
3 4
Laten
t Pe
riod.
5
Veloc
ity.
6
Avera
ge
Veloc
ity.
7
Veloc
ity
at T
+ 10
Veloc
ity
at T
Near.
_-
--
29
:i E.5
11.5
12
2 18
as
27
16.5
27
1.64
--
30
ii.5
22
24
23
20.5
:i to’
20
E :9”
18
18.5
13
1.43
25
1.32
19
25
25
20
19
31
xt.5
47
47
26.5
:: 28.5
17
18.5
z.5
17.5
19
.5
19.5
24.5
36.5
1.
49
19
,, ,/,
.. ,,
_ ,,,
, ,,
,, ,,,
3‘2
33
34
35
13 ; 13
:: : 11
11
18
z.5
28
41.5
ii;
29 :‘:
22
41.5
8.5
27.5
24
26
23.5
26
36
ii:
31.5
14.5
14
.5
16
28 3:
:.:
17 ::.5
35
39
23.5
is”
21.5
25
xi
22
50.2
5
23.5
37
67.2
5
13.5
35
.5
21
35.7
5
!2.9
?8
cn
vi 1.
57
St
1.81
E 4 CD
L
2.61
1.70
CA
co
m
382 Conduction of Nerve Impulse
h f R .% ::
z P
UJ
a .F! k B 3 2
D
-
d d
-
4 l.3
-
$ 8 c;
-
-
: c
% l-4
S. S. Maxwell 383
-
-
i-
-
/’
--
:
--
E
-
F
--
c r
-
4
384 Conduction of Nerve Impulse
In the tables above the highest quotient is 3. I 5 and the lowest is 1.08. The average of the whole number of quotients obtained is 1.78. Inspection of the table will show that in nearly all, though not all, cases where the quotient is very much above or very much below the general average the abnormal result is due to some one, or in a few cases to some two, figures which are notably out of accord with the other magnitudes in the experiment. These numbers are printed in italics. Thus in experiment No. 5 the high quotient, 2.85, is clearly due to the effect of the velocity 128 at 22.5' which differs so far from the other velocity at that temperature, namely, 43. Again in Experiment No. 14 the low quotient 1.10 is the effect of the apparently disproportionately high rate of 58 at II'. The sig- nificant fact is that out of 4% quotients, obtained from 43 dif- ferent nerves, only two are low enough to come within the limit of acceleration of a physical process by a temperature rise of IO'.
It seems logical to conclude from the outcome of these experi- ments that the transmission of the nerve impulse is a chemical process.
Admitting the chemical nature of the nerve impulse, the ques- tion arises, can we go further and reach any conclusion as to the particular kind of reaction involved? It would be dangerous to carry speculation very far in this direction, but one thing appears to be significant and that is the relatively low reaction velocity as compared with that of those biological processes which are known to involve oxidations or the giving off of carbon diox- ide. Among such processes may be mentioned the germination of seeds, the segmentation and development of the egg and the contraction of muscle. According to the experiments of Clausen’ the quantity of carbon dioxide given off from germinat- ing seeds for temperatures between o and 2 5’ increases about 2.5 times for each rise of IO' temperature. Loeb2 has found that free oxygen is necessary to the production of artificial par- thenogenesis, and that a rise of temperature of IO’ hastens the process three or more times. For the rate of contractions of the terrapin heart Snyder? obtained at temperatures between o and
1 Cohen: Lectures on Physical Chemistry, New York, p. 60, 1902. 2 Loeb: University of California Publications, Physiology, iii, p. 39,1906. 3 Snyder: University of California Publications, Physiology, ii, p. 141,
1905.
S. S. Maxwell 385
25O quotients ranging from 10.2 to 2.1 For the sinus venosus of the frog’s heart he found quotients of similar magnitudes,l as well as for the rhythmic contraction of smooth muscle.2 It will be noticed further that in the experiments on contractions of the heart and of smooth muscle the quotient for tempera- tures below 15’ become markedly larger. The quotients for velocity of the nerve are not only lower throughout the range of temperature which I have investigated, but they do not show the excessive increase below 15’. The average of the whole 48
quotients is, as I have stated, 1.78; the average of the 19 cases in which the upper temperature was not above 15’ is ~.gq--an increase but not such a marked increase as is shown by con- tractile tissue. The inference from these facts would seem to be that the reaction involved in the nerve impulse is not of the nature of an oxidation, an inference which is made more prob- able by the fact that the nerve can remain irritable for several hours in lack of oxygen3 whether the nerve is stimulated dur- ing that time or allowed to remain at rest. One remembers also in this connection the remarkable sparseness of blood supply to the nerve trunks.
The results of this series of experiments may be summarized in a single statement : The temperature coefficient of the veloc- ity of the nerve impulse indicates definitely that the conduction is a chemical process, but probably not of the nature of an oxi- dation.
1 Snyder, Arch. j. Physiol., 18, p. I 1907. = Ibid., p. 126. 3 Baeyer: Zeitschr. f. a&em. Physiol., ii, p. 169, 1903.


![The influence of complex drug cocarnit on the nerve ... · neuro-muscular conduction, ... [12]. At the same time ... Cocarnit on the nerve impulse conduction dynamics in nervus tibialis](https://img.pdfslide.us/doc/110x75/5d2c756888c993c82f8d0b85/the-influence-of-complex-drug-cocarnit-on-the-nerve-neuro-muscular-conduction.jpg)