Embed Size (px)
Citation preview
HAL Id: hal-00677626https://hal.archives-ouvertes.fr/hal-00677626
Submitted on 9 Mar 2012
HAL is a multi-disciplinary open accessarchive for the deposit and dissemination of sci-entific research documents, whether they are pub-lished or not. The documents may come fromteaching and research institutions in France orabroad, or from public or private research centers.
L’archive ouverte pluridisciplinaire HAL, estdestinée au dépôt et à la diffusion de documentsscientifiques de niveau recherche, publiés ou non,émanant des établissements d’enseignement et derecherche français ou étrangers, des laboratoirespublics ou privés.
Is the beneficial effect of prior exercise on postprandiallipaemia partly due to redistribution of blood flow?
Nicholas M Hurren, George Balanos, Andrew Blannin
To cite this version:Nicholas M Hurren, George Balanos, Andrew Blannin. Is the beneficial effect of prior exercise onpostprandial lipaemia partly due to redistribution of blood flow?. Clinical Science, Portland Press,2011, 120 (12), pp.537-548. �10.1042/CS20100460�. �hal-00677626�

1
Is the beneficial effect of prior exercise on postprandial lipaemia partly due to
redistribution of blood flow? Nicholas M. HURREN, George M. BALANOS and Andrew K. BLANNIN School of Sport and Exercise Sciences, University of Birmingham, Edgbaston, Birmingham, B15 2TT, U.K. Key words: acute exercise, oral fat tolerance test, postprandial lipaemia, plasma triacylglycerol, hepatic blood flow, femoral blood flow Short title: Exercise, blood flow and postprandial lipaemia Correspondence: Dr Andrew K. Blannin, School of Sport and Exercise Sciences, University of Birmingham, Edgbaston, Birmingham, B15 2TT, U.K. (email [email protected])
A B S T R A C T
Preprandial aerobic exercise lowers postprandial lipaemia (a risk factor for coronary heart disease), however, the mechanisms responsible are still not clear. This study investigated whether blood flow to skeletal muscle and/or the liver was increased in the postprandial period after exercise, relative to a control trial, and whether this resulted from increased cardiac output or redistribution of flow. Eight overweight, inactive males, aged 49.4 ± 10.5 years (mean ± SD) acted as their own controls in a counter-balanced design, either walking briskly for 90 minutes at 60% VO2max, or resting in the lab, on the evening of day 1. The following morning a fasting blood sample was collected, participants consumed a high-fat breakfast and further venous blood samples were drawn hourly for 6 h. Immediately after blood sampling, Doppler ultrasound was used to measure cardiac output and blood flow through both the femoral artery of one leg and the hepatic portal vein, with the ultrasonographer blinded to trial order. The total postprandial triacylglycerol response was 22% lower after exercise (P = 0.001). Blood flow through the femoral artery and the hepatic portal vein was increased by 19% (P < 0.001) and 16% (P = 0.033) respectively during the 6 h postprandial period following exercise; however, postprandial cardiac output did not differ between trials (P = 0.065). Redistribution of blood flow, to both exercised skeletal muscle and the liver, may therefore play a role in reducing the plasma triacylglycerol response to a high-fat meal on the day after an exercise bout.
Clinical Science Immediate Publication. Published on 13 Jan 2011 as manuscript CS20100460T
HIS
IS N
OT
TH
E V
ER
SIO
N O
F R
EC
OR
D -
see
doi
:10.
1042
/CS
2010
0460
Acce
pted
Man
uscr
ipt
Licenced copy. Copying is not permitted, except with prior permission and as allowed by law.
© 2011 The Authors Journal compilation © 2011 Portland Press Limited

2
INTRODUCTION It is now more than 30 years since data were published suggesting a mechanistic link between postprandial lipoproteins and atherosclerosis [1]. Case-control investigations have found postprandial triacylglycerol (TAG) concentrations to be positively associated with both coronary heart disease (CHD) [2] and early atherosclerosis [3], and recent epidemiological studies [4,5] suggest that elevated postprandial lipaemia independently predicts risk of developing CHD. Therefore, reducing the accumulation of triacylglycerol-rich lipoproteins (TRLs) during the postprandial period presents a viable target for lowering arteriosclerotic risk. Studies in the field of postprandial lipaemia and exercise have consistently shown plasma TAG concentrations to be lowered when moderate-intensity aerobic exercise such as walking is undertaken 11-18 h before an oral fat tolerance test [6,7]. Despite the reproducible nature of this lowering, the literature has yet to reach a concensus regarding the mechanism through which such exercise exerts its effect. Early studies suggested that enhanced clearance of TAG, due to increased activity of the enzyme lipoprotein lipase (LPL) within skeletal muscle, was responsible. This belief was largely based on findings from ultra-endurance events, after which substantial increases in postheparin plasma LPL activity were reported [8,9]. However, several investigations have found moderate-intensity exercise to reduce postprandial lipaemia without upregulation of LPL activity [10-13]; therefore other mechanisms are likely to contribute. Reduced postprandial lipaemia following acute exercise is primarily attributed to a lowering of the plasma very low density lipoprotein (VLDL)-TAG concentration [14,15], and indirect evidence, such as an increased serum 3-hydroxybutyrate concentration after exercise [14,15], offers some support for the theory that prior exercise attenuates the postprandial VLDL-TAG secretion rate [16]. However, stable isotope studies in the fasted state do not report a reduction in VLDL-TAG secretion on the morning following exercise [17,18], and investigations of how exercise affects postprandial VLDL kinetics are lacking. Delayed release of dietary fat from the intestine has been proposed to explain at least part of the TAG-lowering effect of exercise [19], but, owing to the length of time between cessation of exercise and test meal intake in most studies (typically 12 - 16 hours), it is not likely that any impact on intestinal TAG release would be appreciable enough to significantly influence postprandial lipaemia. Alongside these suggested mechanisms, it is possible that upregulation, or redistribution, of blood flow to skeletal muscle and/or the liver may occur on the day following exercise. As the rate of substrate delivery exerts a strong influence upon the extent of substrate uptake from the plasma, increased blood flow to either of these tissues on the day after an exercise bout could potentially reduce plasma TAG concentrations. It has been reported that blood flow to skeletal muscle is maintained above resting levels for at least 90 minutes after moderate-intensity exercise [20] and earlier work has shown that postprandial, but not fasting, calf blood flow is elevated above control values on the day after a 2 h treadmill run [15]. If blood flow to skeletal muscles used during a treadmill walk is increased on the day after exercise, this increased flow (and assumed greater substrate delivery) would present an opportunity for greater clearance of TAG into the muscle. As the legs contain the major muscles being worked during walking, femoral artery blood flow was monitored in the current study to assess whether blood flow to skeletal muscle exercised on the previous day was increased in the fasting state 13 h later and during a subsequent 6 h postprandial period. Despite the major influence of the liver on lipid metabolism and its theoretical role as the organ largely responsible for the lowering of postprandial lipaemia following moderate exercise, to our knowledge, no published work has investigated whether hepatic blood flow (in the fasted state or postprandially) is altered on the day after an exercise bout. Therefore,
Clinical Science Immediate Publication. Published on 13 Jan 2011 as manuscript CS20100460T
HIS
IS N
OT
TH
E V
ER
SIO
N O
F R
EC
OR
D -
see
doi
:10.
1042
/CS
2010
0460
Acce
pted
Man
uscr
ipt
Licenced copy. Copying is not permitted, except with prior permission and as allowed by law.
© 2011 The Authors Journal compilation © 2011 Portland Press Limited
3
in addition to investigating femoral artery blood flow, this study included measurements of blood flow through the hepatic portal vein. To determine whether any increases in femoral/hepatic blood flow were due to specific redistribution or were secondary to an increase in whole-body blood flow, cardiac output measurements were also made. METHODS Participants Eight healthy, nonsmoking, sedentary, overweight men gave their written informed consent to participate in the study. Physical characteristics of the participants are presented in Table 1. None of the men performed more than one hour of structured physical activity per week. All men were free from cardiovascular disease and none were taking medication known to affect lipid metabolism. All investigative procedures were carried out in accordance with the Declaration of Helsinki (2000) of the World Medical Association and ethical approval to conduct the study was granted by the Black Country Research Ethics Committee. Study design To investigate the effect of brisk walking on postprandial lipaemia and blood flow, volunteers participated in two oral fat tolerance tests (OFTTs) with differing preconditions: a brisk 90-minute treadmill walk (EX) and a trial where no prior exercise was performed (CON). The order in which the trials were completed was initially randomised, then counter-balanced, to ensure that an equal number of participants completed the trials in each order. A minimum washout period of 4 days separated OFTTs for each participant. Participants maintained a record of all food and drink consumed on the day prior to, and the day of their first trial; this diet was then replicated before the second trial. No exercise was permitted for two days before each oral fat tolerance test (except that performed during the treadmill walk session) and ingestion of alcohol and caffeine was prohibited on the day prior to the OFTTs. Preliminary exercise testing To determine the speed and gradient to be used during the 90-minute walks, all men participated in a sub-maximal incremental treadmill test. Participants were advised to select a ʻbriskʼ walking speed, but to remember that the speed must be maintainable for 90 minutes. The speed was guided by heart rate, as recorded using short-range telemetry (Polar Vantage NV, Polar Electro Oy, Kempele, Finland), with values required to be in the 100 - 110 beats·min-1 range before the speed was deemed sufficient to begin the test. All walking stages lasted five minutes, with speed held constant and gradient increased by 2 - 3% before the start of the new stage. The first stage commenced with a 0% treadmill gradient. Heart rate was noted and expired gas collected during the final minute of each stage, with indirect calorimetry used to calculate oxygen uptake. Upon participants reaching 85% of their individual predicted maximal heart rate, i.e. 208 - 0.7 x age [21], the test was concluded. The relationships between heart rate, oxygen uptake and treadmill gradient were then used to predict maximal oxygen uptake (VO2max) and the gradient required to evoke 60% of VO2max. Main trials Exercise trials Participants arrived at the laboratory at 18:00 and completed a 90-minute treadmill walk. To confirm that the gradient used was eliciting the desired exercise intensity, two-minute expired breath samples were collected at 15-minute intervals during the walk. Subtle
Clinical Science Immediate Publication. Published on 13 Jan 2011 as manuscript CS20100460T
HIS
IS N
OT
TH
E V
ER
SIO
N O
F R
EC
OR
D -
see
doi
:10.
1042
/CS
2010
0460
Acce
pted
Man
uscr
ipt
Licenced copy. Copying is not permitted, except with prior permission and as allowed by law.
© 2011 The Authors Journal compilation © 2011 Portland Press Limited
4
alterations to the initial treadmill gradient were made if participants were found to be working above or below their required oxygen uptake values. Heart rate was monitored throughout the trial. Control trials During control trials, participants underwent a dual-energy x-ray absorptiometry (DXA) scan to determine body fat percentage. Thereafter, participants sat resting in the lab, either watching television or reading, until 90 minutes had elapsed. Evening (post-intervention) meal After performing the treadmill walk or resting in the laboratory, all participants were provided with an evening meal. The mean energy (± S.D.) provided by the meal was 4.39 ± 0.79 MJ (1049 ± 188 kcal) with 36% of calories as fat, 46% as carbohydrate and 18% as protein. The percentage of energy from fat was guided by a UK governmental report [22], while the total energy content mirrored each individualʼs average evening energy intake as calculated from food and drink diaries maintained by participants for three consecutive evenings prior to their first trial. All participants ingested their evening meal within 60 minutes of exercise/rest period cessation; participants ate nothing thereafter and drank only water, until the following morning. Oral fat tolerance tests At 08:00 on the morning of day 2, participants arrived at the laboratory and a fasting blood sample (5 ml) was drawn from an antecubital or forearm vein via cannulation (Venflon, Becton Dickinson, UK). Participants remained supine to allow ultrasound measurement of blood flow through the aorta, hepatic portal vein and femoral artery (further details of the methodology employed can be found in the section titled “Ultrasound measurements”). The same investigator made all measurements used to derive blood flows and was blinded throughout the study as to whether participants had exercised on the previous evening, thus eliminating any potential bias. A test meal providing 0.91g fat, 1.64g carbohydrate and 0.41g protein per kg body mass (68.6 kJ per kg body mass; 50% fat, 40% carbohydrate, 10% protein as percentage of total energy) was then consumed. The meal contained 6.29 ± 0.24 MJ (1504 ± 58 kcal) of energy, had a mean fat load of 83.5 ± 3.2 g, and consisted of a raspberry milkshake (whole milk, double cream, sugar and raspberry flavouring), apricot cereal bars, and oven-cooked croissants with butter and raspberry jam. Venous blood samples were drawn 0.5, 1, 2, 3, 4, 5 and 6 hours postprandially. The line was kept patent by flushing every 20 minutes with non-heparinised saline (B. Braun, Germany) and 2 ml of blood was aspirated and discarded at each time-point to clear the cannula before a sample was taken. Immediately after each blood sample, ultrasound measurements were made at the three sites mentioned previously, with participants remaining supine throughout. Participants drank water ad libitum during the postprandial period of the first trial; the volume was recorded and participants were given the same volume of water to consume during the second trial. Plasma and serum separation At each time-point, a K3-EDTA vacutainer (Becton Dickinson, UK) was precooled on ice to slow metabolism and 4 ml of blood was transferred from a 5 ml syringe for recovery of plasma. The blood contained within this vacutainer was centrifuged immediately, for 15 minutes, at 4oC and 3500 RPM. Plasma was then aspirated and divided into aliquots for immediate storage at -80oC. The remaining 1 ml of blood was dispensed into a plain
Clinical Science Immediate Publication. Published on 13 Jan 2011 as manuscript CS20100460T
HIS
IS N
OT
TH
E V
ER
SIO
N O
F R
EC
OR
D -
see
doi
:10.
1042
/CS
2010
0460
Acce
pted
Man
uscr
ipt
Licenced copy. Copying is not permitted, except with prior permission and as allowed by law.
© 2011 The Authors Journal compilation © 2011 Portland Press Limited
5
vacutainer for obtainment of serum. This uncoated vacutainer was left on the bench top for 30 minutes to allow clotting to occur before centrifugation. Ultrasound measurements Echocardiographic measurements were made using a Philips Sonos 7500 ultrasound system (Philips Medical Systems, Bothell, Washington, U.S.A.) with an S3 two-dimensional transducer (1-3 MHz). Digital images of spectral waveforms were recorded for later analysis. For each measurement point, a minimum of three spectral waveforms were recorded at end-expiration, or as close as possible to it, before being averaged. By employing this technique, measurements for cardiac output could be averaged in 60-second intervals. Heart rate and a respiratory waveform were also recorded. An apical five-chamber view of the heart was used with Doppler mode to identify flow through the aortic valve during systole. Using pulsed-wave spectral mode at a screen sweep speed of 100 mm·s-1, the velocity profile of the aortic flow was obtained. Doppler sampling of the flow was taken immediately below the orifice of the aortic valve. The flow was quantified automatically using the velocity time integral (VTI), which is the mean distance through which blood travels in the outflow tract during ventricular contraction. Each measurement of VTI was made from at least three velocity profiles taken towards the end of expiration. Aortic valve diameter (d) was measured from a parasternal long axis view, thus allowing the aortic valve area (A) to be calculated using the formula A = π·(d/2)². Stroke volume (SV) was calculated from VTI x A; cardiac output was calculated from SV multiplied by HR. Two-dimensional (2-D) and Doppler ultrasound measurements were made using the same ultrasound system (Philips Medical Systems, Bothell, WA) with a linear-array transducer transmitting a frequency of 12 MHz. Longitudinal images of the femoral artery (proximal to any branching) and the hepatic portal vein were obtained, and the average of several diameter measurements made during the R wave for each vessel was taken. At the same location, blood velocity was measured using pulsed-wave Doppler at the centre of the vessel. Using the 2-D and Doppler ultrasound measurements, blood flow through the femoral artery and the hepatic portal vein was then calculated using the equation Vπ·(d/2)², where V is the mean velocity of blood flow through the vessel and d is the diameter of the vessel. As the number of measurements made at each time point for vessel cross-sectional area and velocity of blood flow, for both the hepatic portal vein and the femoral artery, was not equal, it is not possible to report a coefficient of variation (CV) for blood flow through these vessels. Instead, we report the CV for cardiac output and the CVs for the component parts of blood flow for the hepatic portal vein and the femoral artery. Coefficients of variation were 3.8% for cardiac output, 4.1% for hepatic portal vein cross-sectional area, 5.1% for hepatic portal vein velocity of flow, 2.8% for femoral artery cross-sectional area and 5.5% for femoral artery velocity of flow. Analytical procedures Plasma was analysed by enzymatic colourimetric methods using a 96-well plate reader (Multiskan MS, Labsystems, Finland) for triacylglycerol (Sigma-Aldrich, Poole, UK) and using a centrifugal analyser (Cobas Mira Plus, Roche, Switzerland) for NEFA (Wako, Germany) and glucose (ABX Diagnostics, Montpellier, France). Serum was analysed for insulin by ELISA (IDS Ltd, Germany). Owing to the nature of the TAG assay, plasma glycerol concentrations were also measured to allow for correction of TAG concentrations. Samples were stored at -80oC until immediately prior to analysis, with all samples for each participant
Clinical Science Immediate Publication. Published on 13 Jan 2011 as manuscript CS20100460T
HIS
IS N
OT
TH
E V
ER
SIO
N O
F R
EC
OR
D -
see
doi
:10.
1042
/CS
2010
0460
Acce
pted
Man
uscr
ipt
Licenced copy. Copying is not permitted, except with prior permission and as allowed by law.
© 2011 The Authors Journal compilation © 2011 Portland Press Limited
6
being analysed in the same run. Within-batch coefficients of variation were 2.3% for TAG (after correction for plasma glycerol), 1.1% for NEFA, 2.1% for glucose and 5.7% for insulin. Calculations and statistics The total energy expended during the 90-minute treadmill walk was calculated using indirect calorimetry, with the assumption of no protein oxidation [23]. The Shapiro-Wilk test was used to test for normality, with none of the data sets found to deviate significantly from a normal distribution. Postprandial metabolites and haemodynamics were analysed using analysis of variance for repeated measures. In addition to the main effects of trial and time, and the interaction between the two, the first two orthogonal polynomial contrasts (linear and quadratic components) were investigated to gain further insight into the shape of the curves over time. These analyses were performed using SYSTAT 11 for Windows. Logarithmic transformation of time (base e) was performed prior to statistical analyses for NEFA, glucose, insulin, cardiac output and hepatic portal vein blood flow, as such transformation improved symmetry across time for these variables (a condition for use of orthogonal polynomial contrast analysis). The trapezoidal rule was used to calculate area under the curve (AUC) scores for main measures of interest, thereby allowing comparisons with previous work. Total metabolite or blood flow responses (tAUC) were calculated using zero as the baseline for the area under the metabolite/blood flow versus time curve, whereas incremental responses (iAUC) represent the area under the curve with baseline reset to the fasting value. In this way, total responses reflect the actual concentration or flow over the study period, whilst incremental responses describe the change in concentration after the meal. tAUC scores, iAUC scores, fasting values, peak values and time to peak values were analysed using paired sample t-tests (SPSS 16 for Mac). Relationships between variables were examined using Pearsonʼs product-moment correlation coefficient. Fasting concentrations of glucose and insulin were used to derive a validated surrogate measure of insulin resistance [24]. Specifically, fasting glucose and insulin concentrations were entered into a “HOMA2 calculator” downloaded from the Diabetes Trials Unit, University of Oxford website [25]. F-ratios were deemed statistically significant when P < 0.05. Data are presented as mean values ± standard error of the mean (S.E.M.) unless otherwise stated. RESULTS Responses during brisk walking Participants walked at a speed of 6.0 ± 0.2 km·h-1 up a gradient of 2.9 ± 0.7 %. Mean oxygen uptake during the walk was 20.4 ± 1.1 ml·kg-1·min-1 (59.7 ± 0.6 % VO2max). Gross energy expenditure during the walk was 3.51 ± 0.23 MJ, with a mean heart rate of 128 ± 3 beats·min-1. Mean rating of perceived exertion (RPE) from the Borg RPE Scale [26] was 13.1 ± 0.7, i.e. “somewhat hard”. Metabolite concentrations and blood flows in the fasted state Fasting plasma concentrations of triacylglycerol, NEFA and glucose, serum concentrations of insulin, HOMA scores and tissue blood flows are presented in Table 2. Mean plasma TAG concentration tended to be lower after walking, compared with control, but the difference was not statistically significant (see Table 2 for values and significance level). Flows through both the hepatic portal vein and the femoral artery were increased in the fasted state following exercise, relative to control values, however only the increase in hepatic flow was found to be of statistical significance. When hepatic portal vein blood flow was expressed relative to cardiac output in the fasted state for each trial, the proportion of
Clinical Science Immediate Publication. Published on 13 Jan 2011 as manuscript CS20100460T
HIS
IS N
OT
TH
E V
ER
SIO
N O
F R
EC
OR
D -
see
doi
:10.
1042
/CS
2010
0460
Acce
pted
Man
uscr
ipt
Licenced copy. Copying is not permitted, except with prior permission and as allowed by law.
© 2011 The Authors Journal compilation © 2011 Portland Press Limited
7
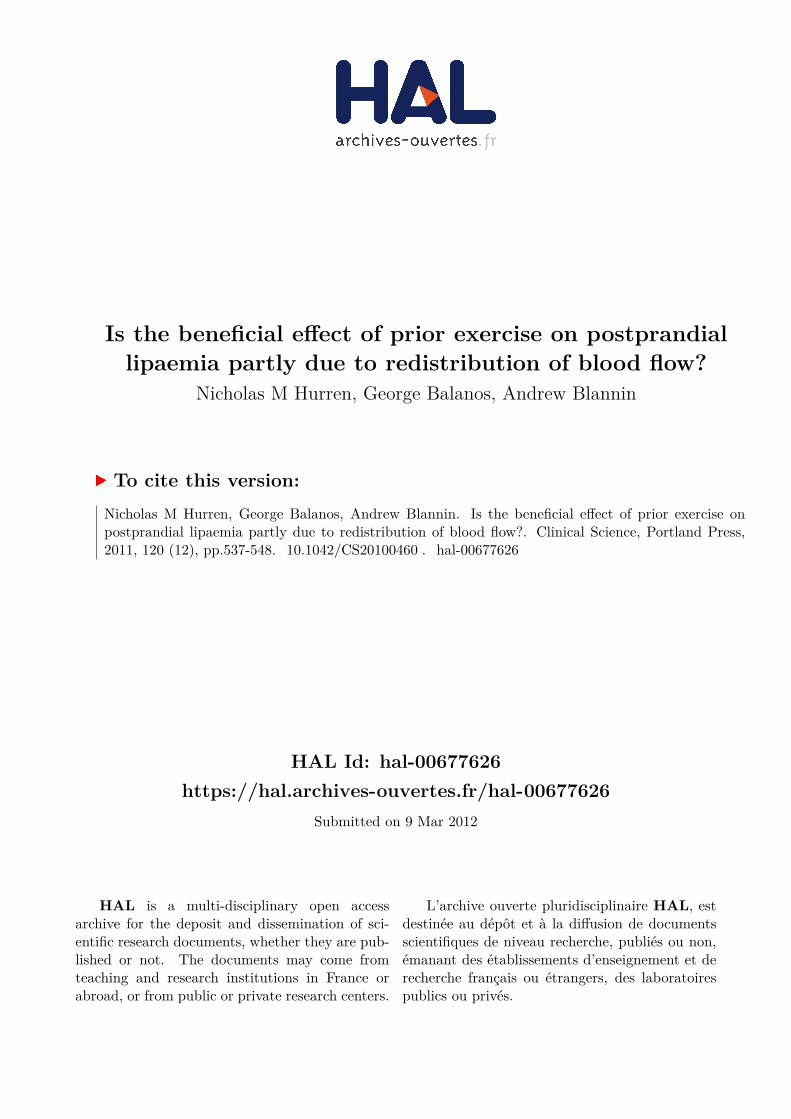
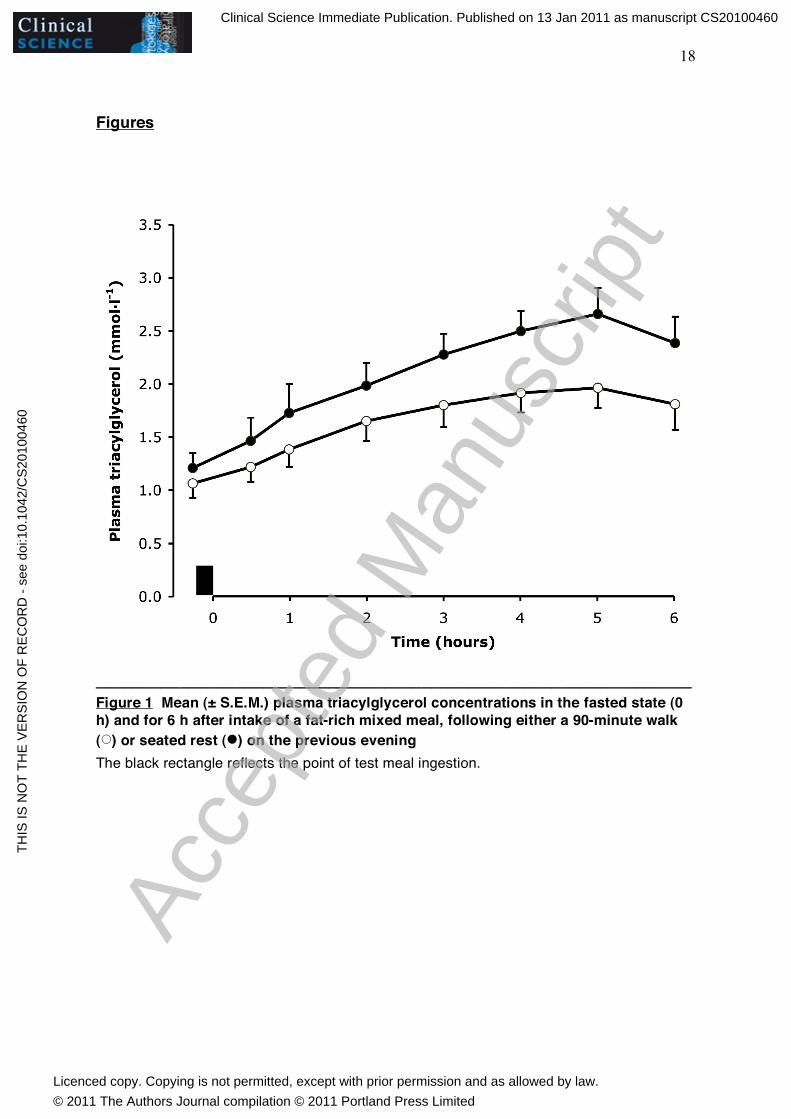
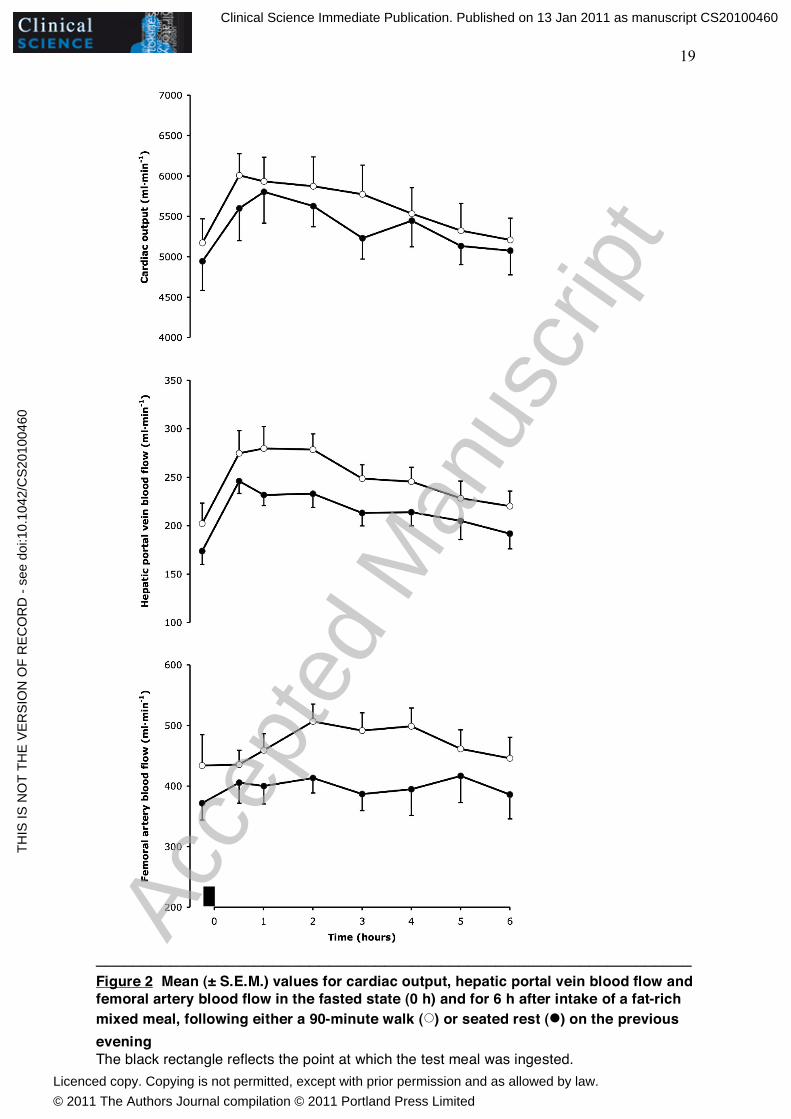
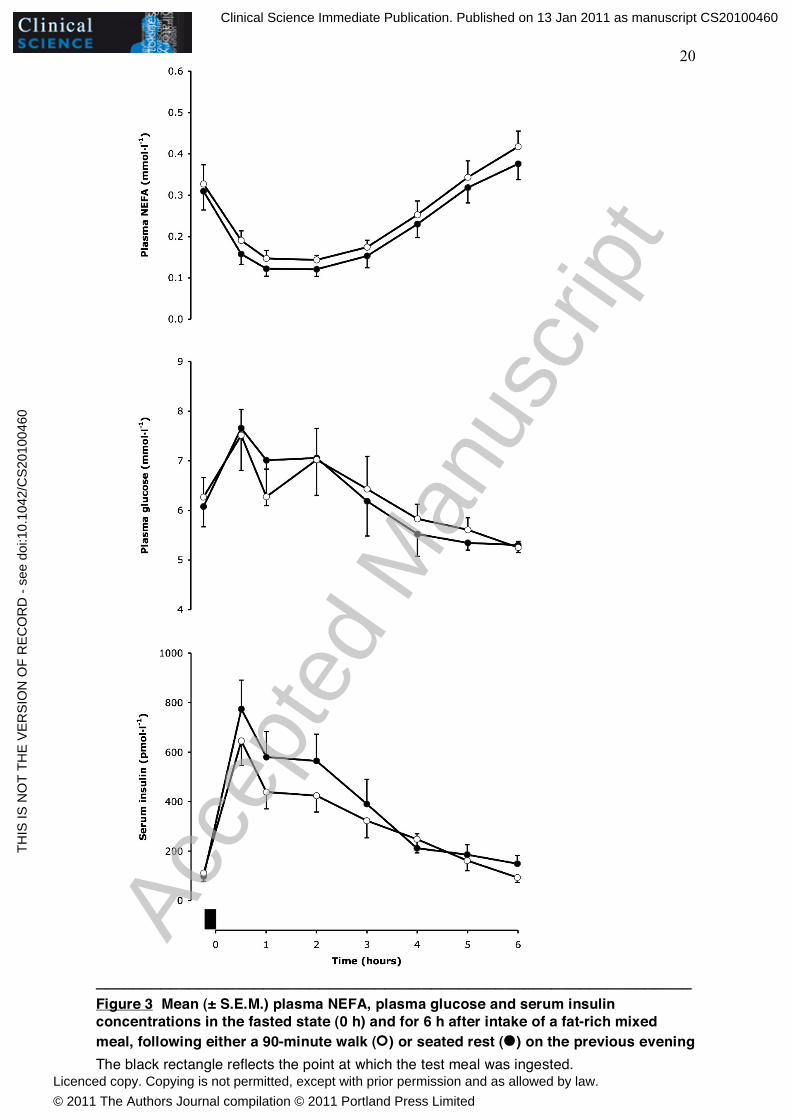
cardiac output flowing through the hepatic portal vein was not significantly different between trials (mean increase of 10.6% with exercise; P = 0.224). The mean percentage of cardiac output flowing through the femoral artery in the fasted state was also unchanged by prior exercise (7.3% increase on control values; P = 0.469). Exercise and control trial values for cardiac output, plasma glucose and NEFA concentration, serum insulin concentration, and HOMA score were similar, and none of the differences between these variables approached statistical significance. Triacylglycerol concentrations in the postprandial state Plasma TAG concentrations (Figure 1) increased significantly during the postprandial period for both trials (effect of time, P < 0.001), but were lower after the walking trial than with control (effect of trial, P = 0.002). Prior walking attenuated both the total and the incremental lipaemic response, relative to the control trial (see Table 3 for AUC scores and P values). Blood flows in the postprandial state Cardiac output (Figure 2) was significantly altered across the postprandial period (P < 0.001 for effect of time); a quadratic function explained 80% of this variation (P < 0.001). While cardiac output was increased at all time points on the day after the 90-minute walk, relative to control, the difference was modest and did not quite reach statistical significance (effect of trial; P = 0.061). A significant change was seen in the flow through the hepatic portal vein (Figure 2) postprandially (P < 0.001 for effect of time); 79% of this variation could be attributed to a quadratic function (P = 0.002). Hepatic portal vein blood flow was elevated after exercise, with flow increased at all time points relative to the control trial (effect of trial; P = 0.027). The total area under the curve was significantly increased following exercise, but not the incremental area (Table 3). The hepatic portal vein blood flow AUC accounted for 4.05 ± 0.22 % of the cardiac output AUC in the control condition and 4.52 ± 0.35 % after the exercise bout. This equated to an 11.6% increase in the percentage of cardiac output distributed to the liver (via the hepatic portal vein) with exercise, but was not a statistically significant change (P = 0.113). The rate of femoral artery blood flow (Figure 2) varied across the postprandial period (P = 0.014 for effect of time), with a quadratic function accounting for 77% of this variation (P = 0.006). Blood flow through the femoral artery was greater in the exercise trial than the control trial at all time points (effect of trial; P < 0.001). This reflected an increased total response of femoral artery blood flow, but not an increased incremental response (Table 3). The AUC for femoral artery blood flow represented 7.49 ± 0.58 % of cardiac output in the control trial and 8.56 ± 0.59 % in the exercise trial. A significant redistribution of cardiac output to the leg, via the femoral artery (mean increase of 14.4%), was therefore apparent on the day following exercise (P = 0.010). Other metabolites in the postprandial state Concentrations of plasma NEFA, serum insulin and plasma glucose (Figure 3) changed significantly across the postprandial period (effect of time; P < 0.001 for NEFA and insulin, P = 0.007 for glucose). NEFA concentrations were higher after exercise than control (P = 0.028), but there was no significant difference between trials for glucose (P = 0.979) or insulin (P = 0.170).
Clinical Science Immediate Publication. Published on 13 Jan 2011 as manuscript CS20100460T
HIS
IS N
OT
TH
E V
ER
SIO
N O
F R
EC
OR
D -
see
doi
:10.
1042
/CS
2010
0460
Acce
pted
Man
uscr
ipt
Licenced copy. Copying is not permitted, except with prior permission and as allowed by law.
© 2011 The Authors Journal compilation © 2011 Portland Press Limited

8
DISCUSSION The most novel findings within this study were the observed elevations of hepatic portal vein and femoral artery blood flow on the day after a bout of lipaemia-lowering exercise. The ability of prior exercise to attenuate postprandial TAG concentrations is well known, but, to our knowledge, no published work has documented an increase in either fasting or postprandial blood flow to the liver on the day following moderate-intensity exercise. Similarly, while one previous article has reported an increase in calf blood flow, along with a reduction in postprandial lipaemia [14], this finding was on the day after a 2 h run in normal-weight men. We believe ours is the first study to demonstrate an increase in postprandial femoral artery blood flow on the day after a 90-minute treadmill walk in a subject group at high risk of developing cardiovascular disease (middle-aged, overweight men who possess low cardiorespiratory fitness). When changes in cardiac output were accounted for, only blood flow through the femoral artery remained significantly augmented, signifying a redistribution of blood to the skeletal muscle worked 13-19 h beforehand. The upregulation of postprandial blood flow through the hepatic portal vein could not be fully explained by the small, non-significant increase in cardiac output seen on the day post-exercise, but equally so, this vessel did not receive a statistically significant redistribution of blood flow. In other words, the significant increase in postprandial portal vein blood flow is partly due to an increase in cardiac output and partly due to receiving a greater percentage of cardiac output. The observation that blood flow to the liver was increased on the morning after exercise, whilst the participants were still in the fasted state, was unexpected and, we believe, without precedent. The mean increase in flow was relatively small, but was consistent; all participants displayed an increase with exercise. While hepatic portal vein blood flow was significantly increased in the fasted state on the morning after exercise, when the flow was expressed relative to the cardiac output in each trial, the flow through the portal vein was not different between trials. This suggests that blood was not selectively redistributed to the liver on the morning after exercise and that differences in cardiac output played a role in the increased portal vein blood flow. However, cardiac output was not significantly greater than control on the morning after exercise and three of the eight men had a lower cardiac output following the walk. Therefore, the statistically significant exercise-induced increase in hepatic portal vein blood flow in the fasted state appears to be partly due to a small increase in cardiac output and a small redistribution of cardiac output to the liver. Previous work has shown portal vein flow to be significantly reduced during exercise [27-29], and immediately afterwards [30], although a return to pre-exercise values has been noted as shortly as 10 minutes post-exercise [28]. The reduction in portal vein flow during cycling exercise at 70% VO2max [29] and after 40 minutes of treadmill walking/running [30] has primarily been attributed to a reduction in vessel cross-sectional area resulting from splanchnic arterial vasoconstriction. However, reduced portal blood flow after a step test, and recovery of this flow to basal levels, resulted from reduction (and subsequent restoration) of both vessel cross-sectional area and flow velocity [28]. In the present study, the increased fasting portal flow on the day after exercise appears to result from vasodilation of the vessel, as the diameter of the hepatic portal vein was significantly increased following exercise, but velocity was not significantly altered (data not shown). Speculatively, therefore, the increase in fasting hepatic portal vein blood flow on the day after exercise may result from hyperaemia within the splanchnic arterial vasculature as a reaction to the reduction in flow to the viscera during exercise. Alternatively, a local increase in insulin sensitivity may play a role, as discussed in more detail later. Hepatic portal vein blood flow increased postprandially in both trials within this study, with flow still above fasting values at 6 h after meal ingestion. This effect was unsurprising,
Clinical Science Immediate Publication. Published on 13 Jan 2011 as manuscript CS20100460T
HIS
IS N
OT
TH
E V
ER
SIO
N O
F R
EC
OR
D -
see
doi
:10.
1042
/CS
2010
0460
Acce
pted
Man
uscr
ipt
Licenced copy. Copying is not permitted, except with prior permission and as allowed by law.
© 2011 The Authors Journal compilation © 2011 Portland Press Limited
9
having been reported previously on more than one occasion [31-35]. While meal intake has been shown to elevate portal blood flow on several occasions, we believe the significantly greater total flow response following exercise in our study is a new finding. It is not clear exactly how a bout of prior exercise would bring about this change in portal haemodynamics; future studies could address this issue by including measurement of flow within the superior mesenteric artery and in vessels which drain directly into the hepatic portal vein. Inter-observer variability when measuring portal vein blood flow is large [36-38], therefore to limit variability as much as possible, the same ultrasonographer (GMB) made all measurements in the current study. Intra-observer coefficients of variation in published work suggest that Doppler ultrasound is a reliable method by which to measure portal vein blood flow, if the same observer is retained [36,37,39], and the coefficients of variation for the component parts of portal vein blood flow in our study compare favourably with those found in the literature. Femoral artery blood flow was not significantly increased in the fasted state on the day after exercise, neither was the incremental flow response significantly elevated, yet the total flow response to the test meal was greater. This apparent contradiction may be explained anecdotally by the observation that most people with increased femoral flow in the fasted state following exercise did not also show a greater response to the meal, and vice versa. As a result, all eight subjects demonstrated a larger total femoral artery blood flow response (range: 8.8% - 35.7% increase in total AUC) on the day after exercise than on the day after control. As neither fasting, nor 6 h incremental femoral flow was significantly increased, it is difficult to suggest a main mechanism which could explain the finding of enhanced total femoral flow in all subjects; proposition of two possible mechanisms may be more appropriate. Firstly, participants who had elevated fasting femoral blood flow may simply have been seeing the tail end of the massively increased skeletal muscle blood flow from during exercise the previous day. Blood flow to exercising skeletal muscle increases (due to vasodilatation) within seconds of the first muscle contraction [40], and during maximal exercise may increase 20 to 30 fold above resting values [41], therefore it is feasible that a modestly elevated flow, of the magnitude seen in this study (~ 1.2 fold increase), may persist in the fasted state some 13 h after cessation of exercise. While possible, this mechanism does not have strong support, and leg blood flow has been reported to return to pre-exercise values within 2.5 h of completing a 1 h cycle at 60% VO2max [20]. In our study, femoral artery blood flow was not measured in the period between cessation of exercise and the initial fasting measurements on the morning of day 2, therefore the rate at which leg blood flow returned towards pre-exercise values is not known. If femoral artery blood flow did return to pre-exercise values within 2.5 h of exercise being completed, as in the study of Williams et al., then increases in fasting femoral artery blood flow may instead be explained by a different mechanism: improved insulin sensitivity. A single bout of moderate-to-high intensity exercise can increase whole-body insulin sensitivity, as measured by a euglycaemic-hyperinsulinaemic clamp [42] or a hyperglycaemic-hyperinsulinaemic clamp [43], such that the increase is still detectable 48 h later. Infusion of insulin and maintenance at a high, but physiological concentration has been shown to increase leg blood flow [44]. Therefore, if insulin sensitivity was increased within the skeletal muscles exercised in our study (primarily the legs), then the small concentration of serum insulin present in the fasted state could have increased femoral artery blood flow relative to the control trial. Our own data showed no correlation between the difference in fasting insulin or HOMA from control to exercise trials, and the difference in femoral artery blood flow, but this does not necessarily discredit the idea that insulin sensitivity may still have been increased at the level of the muscle. In the case of those subjects who did not present with increased femoral blood flow at baseline, but did experience a large increase in flow postprandially in the exercise trial,
Clinical Science Immediate Publication. Published on 13 Jan 2011 as manuscript CS20100460T
HIS
IS N
OT
TH
E V
ER
SIO
N O
F R
EC
OR
D -
see
doi
:10.
1042
/CS
2010
0460
Acce
pted
Man
uscr
ipt
Licenced copy. Copying is not permitted, except with prior permission and as allowed by law.
© 2011 The Authors Journal compilation © 2011 Portland Press Limited
10
these individuals may have been more insulin-sensitive during the postprandial period on the day after exercise. In studies showing increases in leg blood flow after insulin infusion [44,45], serum insulin is elevated and maintained at a concentration equivalent to or above the peak insulin concentration seen after a mixed meal. However, the elevations in insulin after an oral glucose load [46] and a small mixed meal [47] have also been sufficient to increase skeletal muscle blood flow. Therefore, it is perhaps most likely that any exercise-induced improvement in insulin sensitivity would increase femoral artery blood flow most substantially during the postprandial period, when insulin concentrations are high. Exercising aerobically for 60 minutes at ~ 63% VO2max was shown to improve postprandial, but not fasting, endothelial function, 17 h later, with the improvement attributed to greater insulin sensitivity after exercise [48]. Prior aerobic exercise may therefore increase skeletal muscle blood flow through improving local insulin sensitivity and meliorating endothelial dysfunction. Insulin is known to stimulate a distinct phosphorylation-dependent mechanism at the level of the vascular endothelium, ultimately leading to vasodilatation via increased production of nitric oxide [49]. Increased sensitivity to insulin action at the site of the vascular endothelium within skeletal muscle could therefore represent a viable mechanism through which femoral artery blood flow is increased on the day after exercise. HOMA scores in this study were not lower after exercise and therefore do not provide support for this proposed mechanism, however HOMA only provides an estimation of whole-body insulin sensitivity in the fasted state, it does not offer information regarding the insulin sensitivity of specific tissues, particularly after a meal. Furthermore, HOMA is primarily intended for use as an estimation of insulin sensitivity within a medium to large population; the likelihood of HOMA reflecting insulin sensitivity as measured by clamp, in a very small group of subjects (N = 8 in the current study), is not high. It may be asked, “What is the mechanism through which prior exercise would produce an insulin-induced increase in blood flow?” Interestingly, postprandial endothelial function (measured by flow-mediated dilation) was improved by exercise performed 16 – 18 h earlier [48,50]. Moreover, insulin-sensitive Akt phophorylation has been shown to be elevated 24 hours after a 60 min exercise bout [51]. As there is evidence that free fatty acids appear to impair eNOS phosphorylation [52,53], the prior exercise might lower the free fatty acid concentration in the local milieu, thus releasing this inhibition of eNOS. Although our data demonstrate that postprandial plasma TAG concentrations are attenuated, and postprandial hepatic portal vein and femoral artery blood flows are increased on the day following a moderate-intensity aerobic exercise bout, relative to a control trial, we can only speculate upon a causative role of the increased tissue blood flows in the lowering of postprandial lipaemia. Speculatively, the elevation of femoral artery blood flow may induce skeletal muscle capillary recruitment (whether longitudinal or in previously non-flowing capillaries [54]), thereby increasing skeletal muscle capillary blood volume and presenting an opportunity for more widespread hydrolysis of circulating TAG by LPL within capillaries. However, as evidence from animal studies suggests that capillary blood flow cannot necessarily be determined by extrapolation from flow within larger vessels [55], it therefore does not automatically follow that an increase in femoral artery flow will be reflected at the capillary level. Alternatively, alterations in tissue sensitivity to insulin action, brought about by prior exercise, may act indirectly to reduce postprandial TAG concentrations. While there was not a statistically significant difference, there was a tendency for postprandial insulin concentrations to be lower after exercise in our study, when compared with control, despite postprandial glucose concentrations being very similar between trials. Therefore, it is possible that postprandial insulin sensitivity was increased with exercise. As skeletal muscle is the primary site of insulin-mediated glucose disposal, it appears reasonable to consider increased postprandial sensitivity to the metabolic actions of
Clinical Science Immediate Publication. Published on 13 Jan 2011 as manuscript CS20100460T
HIS
IS N
OT
TH
E V
ER
SIO
N O
F R
EC
OR
D -
see
doi
:10.
1042
/CS
2010
0460
Acce
pted
Man
uscr
ipt
Licenced copy. Copying is not permitted, except with prior permission and as allowed by law.
© 2011 The Authors Journal compilation © 2011 Portland Press Limited
11
insulin on a whole-body level to primarily reflect improved sensitivity within skeletal muscle. Any improvement in skeletal muscle insulin sensitivity is likely to be associated with increased capillary perfusion within the muscle, which would presumably permit circulating TAG greater access to LPL and allow for clearance of such TAG into the muscle, in turn lowering the plasma TAG concentration. In this scenario, exercise-induced increases in femoral artery blood flow may well be secondary to increases in microvascular blood volume, as capillary recruitment has been shown to precede increases in total muscle blood flow by 60 – 90 min, as induced by physiological hyperinsulinaemia in rats [56]. Furthermore, precapillary arterioles that control microvascular perfusion have been shown to be more sensitive to the vasodilatory effect of insulin than resistance arterioles that control total muscle blood flow [57]. Therefore the increase in femoral artery blood flow in our study may well present a delayed picture of changes that have occurred at the microvascular level and reflect an environment conducive to removal of TAG from the plasma. While concerted efforts were made to ensure that the present study was robust, well designed and unbiased, we acknowledge that certain limitations do exist regarding the application and interpretation of our results. Firstly, our observations are limited to measurements made in eight individuals; investigation of a larger group of participants would provide confirmation that the effects we have noted are likely to be truly representative of most middle-aged, inactive, overweight men. Furthermore, as the eight men in our study where recruited based on specific criteria, an element of caution should be exercised when attempting to extend our findings to groups with different characteristics from those we studied. Thirdly, it is possible that our study was underpowered to detect a significant effect of exercise for certain parameters. Specifically, if the trends seen within our eight participants were to have continued with studies of additional volunteers, the fasting plasma TAG concentration, the fasting femoral artery blood flow, and postprandial cardiac output could all potentially have shown a statistically significant difference between exercise and control trials. In addition to the limitations imposed by the small number of participants investigated in the present study, we further acknowledge that while increases in blood flow to skeletal muscle and the liver are indicative of increased substrate delivery to these tissues, and may present a mechanism through which moderate exercise reduces postprandial lipaemia, such measures are not conclusive. Arterio-venous difference measurements made across a leg, though far more invasive than Doppler ultrasound, would provide valuable information in this respect. In conclusion, this study found that a bout of moderate-intensity exercise, which significantly reduced postprandial lipaemia, also increased postprandial blood flow to the liver and recently exercised skeletal muscle. In the fasted state, blood flow through the hepatic portal vein was significantly greater 13 h after exercise than after rest, but the mean increase in femoral artery blood flow with exercise was not statistically significant. The increase in hepatic portal vein and femoral artery blood flow above baseline was not significantly different between exercise and control trials, suggesting that elevated flow rates in the fasted state were largely responsible for the elevated postprandial blood flows. Further research is required to establish the mechanisms through which prior exercise augments blood flow to these sites.
Clinical Science Immediate Publication. Published on 13 Jan 2011 as manuscript CS20100460T
HIS
IS N
OT
TH
E V
ER
SIO
N O
F R
EC
OR
D -
see
doi
:10.
1042
/CS
2010
0460
Acce
pted
Man
uscr
ipt
Licenced copy. Copying is not permitted, except with prior permission and as allowed by law.
© 2011 The Authors Journal compilation © 2011 Portland Press Limited
12
AUTHOR CONTRIBUTION A.K.B. conceived of the study idea, with all three authors involved in study design and participant recruitment. N.M.H. coordinated the trials, collected and analysed the biochemical samples, performed the statistical analysis and drafted the manuscript. G.M.B. carried out all measurements and calculations pertaining to blood flows, and contributed to editing and writing of the manuscript. A.K.B. was involved in data collection, in editing and writing the manuscript, and was responsible for overall supervision of the study. ACKNOWLEDGEMENTS We thank Clair Powell for kindly providing technical guidance regarding imaging of the hepatic portal vein. We also express our gratitude to the research volunteers for their commitment to the study. FUNDING This research received no specific grant from any funding agency in the public, commercial or not-for-profit sectors.
Clinical Science Immediate Publication. Published on 13 Jan 2011 as manuscript CS20100460T
HIS
IS N
OT
TH
E V
ER
SIO
N O
F R
EC
OR
D -
see
doi
:10.
1042
/CS
2010
0460
Acce
pted
Man
uscr
ipt
Licenced copy. Copying is not permitted, except with prior permission and as allowed by law.
© 2011 The Authors Journal compilation © 2011 Portland Press Limited

13
REFERENCES
1 Zilversmit, D. B. (1979) Atherogenesis: a postprandial pheonomenon. Circulation 60, 473-485
2 Patsch, J. R., Miesenböck, G., Hopferwieser, T., Mühlberger, V., Knapp, E., Dunn, J. K., Gotto Jr, A. M. and Patsch, W. (1992) Relation of triglyceride metabolism and coronary artery disease. Studies in the postprandial state. Arterioscler. Thromb. 12, 1336-1345
3 Karpe, F., de Faire, U., Mercuri, M., Bond. M. G., Hellenius, M. L. and Hamsten, A. (1998) Magnitude of alimentary lipemia is related to intima-media thickness of the common carotid artery in middle-aged men. Atherosclerosis 141, 307-314
4 Nordestgaard, B. G., Benn, M., Schnohr, P. and Tybjaerg-Hansen, A. (2007) Nonfasting triglycerides and risk of myocardial infarction, ischemic heart disease, and death in men and women. JAMA 298, 299-308
5 Bansal, S., Buring, J.E., Rifai, N., Mora, S., Sacks, F. M. and Ridker, P. M. (2007) Fasting compared with nonfasting triglycerides and risk of cardiovascular events in women. JAMA 298, 309-316
6 Gill, J. M. and Hardman, A. E. (2003) Exercise and postprandial lipid metabolism: an update on potential mechanisms and interactions with high-carbohydrate diets. J. Nutr. Biochem. 14, 122-132
7 Petitt, D. S. and Cureton, K. J. (2003) Effects of prior exercise on postprandial lipemia: a quantitative review. Metabolism 52, 418-424
8 Kantor, M. A., Cullinane, E. M., Herbert, P. N. and Thompson, P. D. (1984) Acute increase in lipoprotein lipase following prolonged exercise. Metabolism 33, 454-457
9 Sady, S. P., Thompson, P. D., Cullinane, E. M., Kantor, M. A., Domagala, E. and Herbert, P.N. (1986) Prolonged exercise augments plasma triglyceride clearance. JAMA 256, 2552-2555
10 Ferguson, M. A., Alderson, N. L., Trost, S. G., Essig, D. A., Burke, J. R. and Durstine, J. L. (1998) Effects of four different single exercise sessions on lipids, lipoproteins, and lipoprotein lipase. J. Appl. Physiol. 85, 1169-1174
11 Herd, S. L., Kiens, B., Boobis, L. H. and Hardman, A. E. (2001) Moderate exercise, postprandial lipaemia, and skeletal muscle lipoprotein lipase activity. Metabolism 50, 756-762
12 Gill, J. M., Herd, S. L., Vora, V. and Hardman, A. E. (2003) Effects of a brisk walk on lipoprotein lipase activity and plasma triglyceride concentrations in the fasted and postprandial states. Eur. J. Appl. Physiol. 89, 184-190
13 Katsanos, C. S., Grandjean, P. W. and Moffatt, R. J. (2004) Effects of low and moderate exercise intensity on postprandial lipaemia and postheparin plasma lipoprotein lipase activity in physically active men. J. Appl. Physiol. 96, 181-188
14 Malkova, D., Evans, R. D., Frayn, K. N., Humphreys, S. M., Jones, P. R. and Hardman, A. E. (2000) Prior exercise and postprandial substrate extraction across the human leg. Am. J. Physiol. 279, E1020-1028
15 Gill, J. M., Frayn, K. N., Wootton, S. A., Miller, G. J. and Hardman, A. E. (2001) Effects of prior moderate exercise on exogenous and endogenous lipid metabolism and plasma factor VII activity. Clin. Sci. 100, 517-527
16 Gill, J. M. R. (2004). Exercise and postprandial lipid metabolism – an analysis of the current evidence. Eur. J. Lipid Sci. Technol. 106, 110-121
17 Magkos, F., Wright, D. C., Patterson, B. W., Mohammed, B. S. and Mittendorfer, B. (2006) Lipid metabolism response to a single, prolonged bout of endurance exercise in healthy young men. Am. J. Physiol. Endocrinol. Metab. 290, E355-E362
Clinical Science Immediate Publication. Published on 13 Jan 2011 as manuscript CS20100460T
HIS
IS N
OT
TH
E V
ER
SIO
N O
F R
EC
OR
D -
see
doi
:10.
1042
/CS
2010
0460
Acce
pted
Man
uscr
ipt
Licenced copy. Copying is not permitted, except with prior permission and as allowed by law.
© 2011 The Authors Journal compilation © 2011 Portland Press Limited
14
18 Tsekouras, Y. E., Yanni, A. E., Bougatsas, D., Kavouras, S. A. and Sidossis, L. S. (2007) A single bout of brisk walking increases basal very low-density lipoprotein triacylglycerol clearance in young men. Metabolism 56, 1037-1043
19 Kolifa, M., Petridou, A. and Mougios, V. (2004) Effect of prior exercise on lipemia after a meal of moderate fat content. Eur. J. Clin. Nutr. 58, 1327-1335
20 Williams, J. T., Pricher, M. P. and Halliwill, J. R. (2005) Is postexercise hypotension related to excess postexercise oxygen consumption through changes in leg blood flow? J. Appl. Physiol. 98, 1463-1468
21 Tanaka, H., Monashan, K. D. and Seals, D. R. (2001) Age-predicted maximal heart rate revisited. J. Am. Coll. Cardiol. 37, 153-156
22 Department of Health (1994) Nutritional aspects of cardiovascular disease. Report of the Cardiovascular Review Group of the Committee on Medical Aspects of Food Policy. HMSO: London
23 Jeukendrup, A. E. and Wallis, G. A. (2005) Measurement of substrate oxidation during exercise by means of gas exchange measurements. Int. J. Sports. Med. 26(Suppl 1), S28-S37
24 Levy, J. C., Matthews, D. R. and Hermans, M. P. (1998) Correct homeostasis model assessment (HOMA) evaluation uses the computer program. Diabetes Care 21, 2191-2192
25 HOMA2 Calculator, Version 2.2. © Diabetes Trials Unit, University of Oxford. http://www.dtu.ox.ac.uk/index.php?maindoc=/homa/ (last retrieved 29th May 2010)
26 Borg, G. A. (1982) Psychological bases of perceived exertion. Med. Sci. Sports Exerc. 14, 377-381
27 Rowell, L. B., Blackmon, J. R. and Bruce, R. A. (1964) Indocyanine green clearance and estimated hepatic blood flow during mild to maximal exercise in upright man. J. Clin. Invest. 43, 1677-1690
28 Ohnishi, K., Saito, M., Nakayama, T., Iida, S., Nomura, F., Koen, H. and Okuda, K. (1985) Portal venous hemodynamics in chronic liver disease: effects of posture change and exercise. Radiology 155, 757-761
29 Rehrer, N. J., Smets, A., Reynaert, H., Goes, E. and De Meirleir, K. (2001) Effect of exercise on portal vein blood flow in man. Med. Sci. Sports Exerc. 33, 1533-1537
30 Ersoz, G., and Ersoz, S. (2003) Changes in portal blood flow following acute exercise in liver transplant patients. Transplant. Proc. 35, 1456-1457
31 Gaiani, S., Bolondi, L., Li Bassi, S., Santi, V., Zironi, G. and Barbara, L. (1989) Effect of meal in portal hemodynamics in healthy humans and in patients with chronic liver disease. Hepatology 9, 815-819
32 Sabbá, C., Ferraioli, G., Genecin, P., Colombato, L., Buonamico, P., Lerner, E., Taylor, K. J. and Groszmann, R. J. (1991) Evaluation of postprandial hyperemia in superior mesenteric artery and portal vein in healthy and cirrhotic humans: an operator-blind echo-Doppler study. Hepatology 13, 714-718
33 Iwao, T., Toyonaga, A., Oho, K., Sakai, T., Tayama, C., Masumoto, H., Sato, M., Nakahara, K., and Tanikawa, K. (1996) Postprandial splanchnic hemodynamic response in patients with cirrhosis of the liver: evaluation of “triple-vessel” duplex US. Radiology 201, 711-715
34 Ludwig, D., Schwarting, K., Korbel, C. M., Brüning, A., Schiefer, B. and Stange, E. F. (1998) The postprandial portal flow is related to the severity of portal hypertension and liver cirrhosis. J. Hepatol. 28, 631-638
35 Stanley, A. J., Forrest, E. H., Redhead, D. N., Bouchier, I. A. and Hayes, P. C. (1998) Direct measurement of post-prandial portal haemodynamics in cirrhotic patients with
Clinical Science Immediate Publication. Published on 13 Jan 2011 as manuscript CS20100460T
HIS
IS N
OT
TH
E V
ER
SIO
N O
F R
EC
OR
D -
see
doi
:10.
1042
/CS
2010
0460
Acce
pted
Man
uscr
ipt
Licenced copy. Copying is not permitted, except with prior permission and as allowed by law.
© 2011 The Authors Journal compilation © 2011 Portland Press Limited
15
a transjugular intrahepatic portosystemic stent-shunt. Eur. J. Gastroenterol. Hepatol. 10, 393-397
36 Sabbá, C., Weltin, G. G., Cicchetti, D. V., Ferraioli, G., Taylor, K. J., Nakamura, T., Moriyasu, F. and Groszmann, R. J. (1990) Observer variability in echo-Doppler measurements of portal flow in cirrhotic patients and normal volunteers. Gastroenterology 98, 1603-1611
37 Iwao, T., Toyonaga, A., Shigemori, H., Oho, K., Sumino, M., Sato, M. and Tanikawa, K. (1996) Echo-Doppler measurements of portal vein and superior mesenteric artery blood flow in humans: inter- and intra-observer short-term reproducibility. J. Gastroenterol. Hepatol. 11, 40-46
38 Fisher, A. J., Paulson, E. K., Kliewer, M. A., DeLong, D. M. and Nelson, R. C. (1998) Doppler sonography of the portal vein and hepatic artery: measurement of a prandial effect in healthy subjects. Radiology 207, 711-715
39 Lycklama à Nijeholt, G. J., Burggraaf, K., Wasser, M. N., Schultze Kool, L. J., Schoemaker, R. C., Cohen, A. F. and de Roos, A. (1997) Variability of splanchnic blood flow measurements using MR velocity mapping under fasting and post-prandial conditions – comparisons with echo-Doppler. J. Hepatol. 26, 298-304
40 Clifford, P. S. (2007) Skeletal muscle vasodilatation at the onset of exercise. J. Physiol. 583, 825-833
41 Snell, P. G., Martin, W. H., Buckey, J. C. and Blomqvist, C. G. (1987) Maximal vascular leg conductance in trained and untrained men. J. Appl. Physiol. 62, 606-610
42 Mikines, K. J., Sonne, B., Farrell, P. A., Tronier, B. and Galbo, H. (1988) Effect of physical exercise on sensitivity and responsiveness to insulin in humans. Am. J. Physiol. 254, E248-259
43 Perseghin, G., Price, T. B., Petersen, K. F., Roden, M., Cline, G. W., Gerow, K., Rothman, D. L. and Shulman, G. I. (1996) Increased glucose transport-phosphorylation and muscle glycogen synthesis after exercise training in insulin-resistant subjects. N. Engl. J. Med. 335, 1357-1362
44 Laakso, M., Edelman, S. V., Brechtel, G. and Baron, A. D. (1990) Decreased effect of insulin to stimulate skeletal muscle blood flow in obese man. A novel mechanism for insulin resistance. J. Clin. Invest. 85, 1844-1852
45 Laine, H., Knuuti, M. J., Ruotsalainen, U., Utriainen, T., Oikonen, V., Raitakari, M., Luotolahti, M., Kirvelä, O., Vicini, P., Cobelli, C., Nuutila, P. and Yki-Järvinen, H. (1998) Preserved relative dispersion but blunted stimulation of mean flow, absolute dispersion, and blood volume by insulin in skeletal muscle of patients with essential hypertension. Circulation 97, 2146-2153
46 Baron, A. D., Laakso, M., Brechtel, G., Holt, B., Watt, C. and Edelman, S. V. (1990) Reduced postprandial skeletal muscle blood flow contributes to glucose intolerance in human obesity. J. Clin. Endocrinol. Metab. 70, 1525-1533
47 Vincent, M. A., Clerk, L. H., Lindner, J. R., Price, W. J., Jahn, L. A., Leong-Poi, H. and Barrett, E. J. (2006) Mixed meal and light exercise each recruit muscle capillaries in healthy humans. Am. J. Physiol. 290, E1191-1197
48 Weiss, E. P., Arif, H., Villareal, D. T., Marzetti, E. and Holloszy, J. O. (2008) Endothelial function after high-sugar food ingestion improves with endurance exercise performed on the previous day. Am. J. Clin. Nutr. 88, 51-57
49 Zeng, G. and Quon, M. J. (1996) Insulin-stimulated production of nitric oxide is inhibited by wortmannin. Direct measurement in vascular endothelial cells. J. Clin. Invest. 98, 894-898
50 Tyldum, G. A., Schjerve, I. E., Tjønna, A. E., Kirkeby-Garstad, I., Stølen, T. O., Richardson, R. S. and Wisløff, U. (2009) Endothelial dysfunction induced by post-
Clinical Science Immediate Publication. Published on 13 Jan 2011 as manuscript CS20100460T
HIS
IS N
OT
TH
E V
ER
SIO
N O
F R
EC
OR
D -
see
doi
:10.
1042
/CS
2010
0460
Acce
pted
Man
uscr
ipt
Licenced copy. Copying is not permitted, except with prior permission and as allowed by law.
© 2011 The Authors Journal compilation © 2011 Portland Press Limited
16
prandial lipemia: complete protection afforded by high-intensity aerobic interval exercise. J. Am. Coll. Cardiol. 53, 200-206
51 Wadley, G. D., Konstantopoulos, N., Macaulay, L., Howlett, K. F., Garnham, A., Hargreaves, M. and Cameron-Smith, D. (2007) Increased insulin-stimulated Akt pSer473 and cytosolic SHP2 protein abundance in human skeletal muscle following acute exercise and short-term training. J. Appl. Physiol. 102, 1624-1631
52 Wang, X. L., Zhang, L., Youker, K., Zhang, M-X., Wang, J., LeMaire, S. A., Coselli, J. S. and Shen, Y. H. (2006) Free fatty acids inhibit insulin signaling-stimulated endothelial nitric oxide synthase activation through upregulating PTEN or inhibiting Akt kinase. Diabetes 55, 2301-2310
53 Symons, J. D., McMillin, S. L., Riehle, C., Tanner, J., Palionyte, M., Hillas, E., Jones, D., Cooksey, R. C., Birnbaum, M. J., McClain, D. A., Zhang, Q. J., Gale, D., Wilson, L. J. and Abel E. D. (2009) Contribution of insulin and Akt1 signalling to endothelial nitric oxide synthase in the regulation of endothelial function and blood pressure. Circulation Research 104, 1085-1094
54 Poole, D., Brown, M. and Hudlicka, O. (2008) Last word on Point:Counterpoint: There is/is not capillary recruitment in active skeletal muscle during exercise. J. Appl. Physiol. 104, 901
55 Shore, A.C. (2000) Capillaroscopy and the measurement of capillary pressure. Br. J. Clin. Pharmacol. 50, 501-513
56 Vincent, M.A., Dawson, D., Clark, A.D., Lindner, J.R., Rattigan, S., Clark, M.G. and Barrett, E.G. (2002) Skeletal muscle microvascular recruitment by physiological hyperinsulinemia precedes increases in total blood flow. Diabetes 51, 42-48
57 Zhang, L., Vincent, M.A., Richards, S.M., Clerk, L.H., Rattigan, S., Clark, M.G. and Barrett, E.G (2004) Insulin sensitivity of muscle capillary recruitment in vivo. Diabetes 53, 447-453
Clinical Science Immediate Publication. Published on 13 Jan 2011 as manuscript CS20100460T
HIS
IS N
OT
TH
E V
ER
SIO
N O
F R
EC
OR
D -
see
doi
:10.
1042
/CS
2010
0460
Acce
pted
Man
uscr
ipt
Licenced copy. Copying is not permitted, except with prior permission and as allowed by law.
© 2011 The Authors Journal compilation © 2011 Portland Press Limited
17
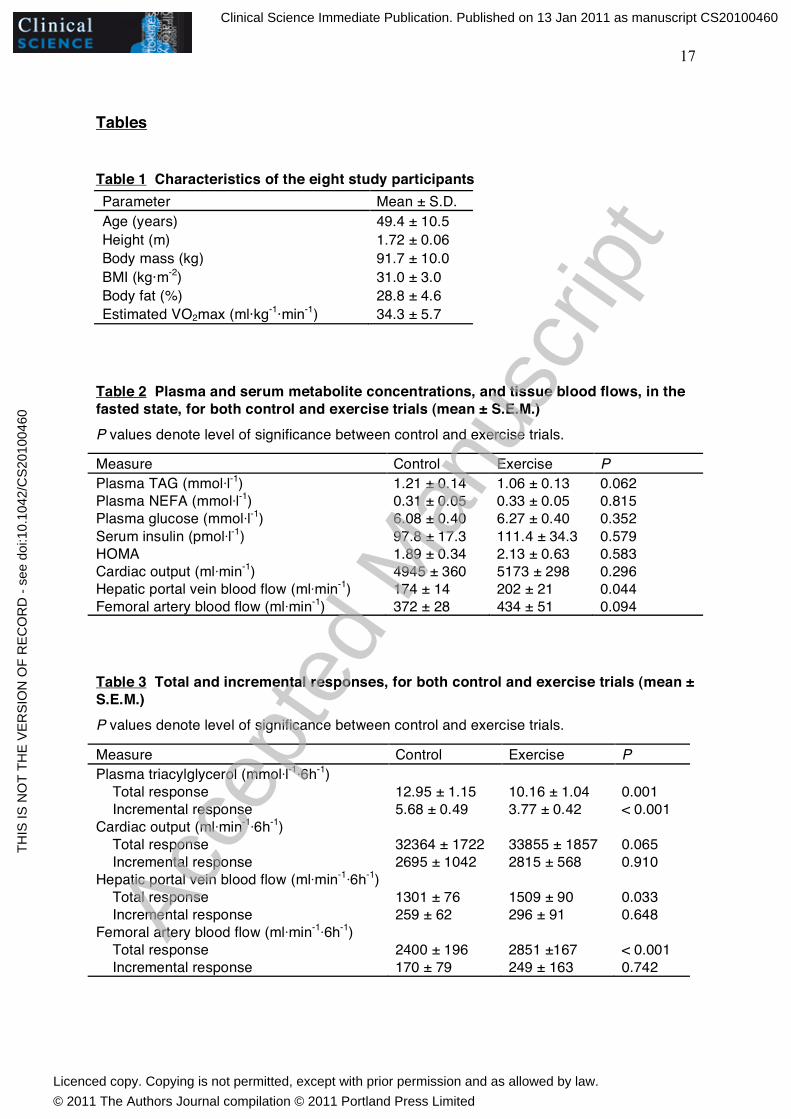
Tables Table 1 Characteristics of the eight study participants Parameter Mean ± S.D. Age (years) 49.4 ± 10.5 Height (m) 1.72 ± 0.06 Body mass (kg) 91.7 ± 10.0 BMI (kg·m-2) 31.0 ± 3.0 Body fat (%) 28.8 ± 4.6 Estimated VO2max (ml·kg-1·min-1) 34.3 ± 5.7
Table 2 Plasma and serum metabolite concentrations, and tissue blood flows, in the fasted state, for both control and exercise trials (mean ± S.E.M.)
P values denote level of significance between control and exercise trials.
Measure Control Exercise P Plasma TAG (mmol·l-1) 1.21 ± 0.14 1.06 ± 0.13 0.062 Plasma NEFA (mmol·l-1) 0.31 ± 0.05 0.33 ± 0.05 0.815 Plasma glucose (mmol·l-1) 6.08 ± 0.40 6.27 ± 0.40 0.352 Serum insulin (pmol·l-1) 97.8 ± 17.3 111.4 ± 34.3 0.579 HOMA 1.89 ± 0.34 2.13 ± 0.63 0.583 Cardiac output (ml·min-1) 4945 ± 360 5173 ± 298 0.296 Hepatic portal vein blood flow (ml·min-1) 174 ± 14 202 ± 21 0.044 Femoral artery blood flow (ml·min-1) 372 ± 28 434 ± 51 0.094 Table 3 Total and incremental responses, for both control and exercise trials (mean ± S.E.M.)
P values denote level of significance between control and exercise trials.
Measure Control Exercise P Plasma triacylglycerol (mmol·l-1·6h-1) Total response 12.95 ± 1.15 10.16 ± 1.04 0.001 Incremental response 5.68 ± 0.49 3.77 ± 0.42 < 0.001 Cardiac output (ml·min-1·6h-1) Total response 32364 ± 1722 33855 ± 1857 0.065 Incremental response 2695 ± 1042 2815 ± 568 0.910 Hepatic portal vein blood flow (ml·min-1·6h-1) Total response 1301 ± 76 1509 ± 90 0.033 Incremental response 259 ± 62 296 ± 91 0.648 Femoral artery blood flow (ml·min-1·6h-1) Total response 2400 ± 196 2851 ±167 < 0.001 Incremental response 170 ± 79 249 ± 163 0.742
Clinical Science Immediate Publication. Published on 13 Jan 2011 as manuscript CS20100460T
HIS
IS N
OT
TH
E V
ER
SIO
N O
F R
EC
OR
D -
see
doi
:10.
1042
/CS
2010
0460
Acce
pted
Man
uscr
ipt
Licenced copy. Copying is not permitted, except with prior permission and as allowed by law.
© 2011 The Authors Journal compilation © 2011 Portland Press Limited
18
Figures
________________________________________________________________
Figure 1 Mean (± S.E.M.) plasma triacylglycerol concentrations in the fasted state (0 h) and for 6 h after intake of a fat-rich mixed meal, following either a 90-minute walk (○) or seated rest (●) on the previous evening The black rectangle reflects the point of test meal ingestion.
Clinical Science Immediate Publication. Published on 13 Jan 2011 as manuscript CS20100460T
HIS
IS N
OT
TH
E V
ER
SIO
N O
F R
EC
OR
D -
see
doi
:10.
1042
/CS
2010
0460
Acce
pted
Man
uscr
ipt
Licenced copy. Copying is not permitted, except with prior permission and as allowed by law.
© 2011 The Authors Journal compilation © 2011 Portland Press Limited
19
________________________________________________________________
Figure 2 Mean (± S.E.M.) values for cardiac output, hepatic portal vein blood flow and femoral artery blood flow in the fasted state (0 h) and for 6 h after intake of a fat-rich mixed meal, following either a 90-minute walk (○) or seated rest (●) on the previous evening The black rectangle reflects the point at which the test meal was ingested.
Clinical Science Immediate Publication. Published on 13 Jan 2011 as manuscript CS20100460T
HIS
IS N
OT
TH
E V
ER
SIO
N O
F R
EC
OR
D -
see
doi
:10.
1042
/CS
2010
0460
Acce
pted
Man
uscr
ipt
Licenced copy. Copying is not permitted, except with prior permission and as allowed by law.
© 2011 The Authors Journal compilation © 2011 Portland Press Limited
20
________________________________________________________________
Figure 3 Mean (± S.E.M.) plasma NEFA, plasma glucose and serum insulin concentrations in the fasted state (0 h) and for 6 h after intake of a fat-rich mixed meal, following either a 90-minute walk (○ ) or seated rest (●) on the previous evening The black rectangle reflects the point at which the test meal was ingested.
Clinical Science Immediate Publication. Published on 13 Jan 2011 as manuscript CS20100460T
HIS
IS N
OT
TH
E V
ER
SIO
N O
F R
EC
OR
D -
see
doi
:10.
1042
/CS
2010
0460
Acce
pted
Man
uscr
ipt
Licenced copy. Copying is not permitted, except with prior permission and as allowed by law.
© 2011 The Authors Journal compilation © 2011 Portland Press Limited