Embed Size (px)
Citation preview
1
Running Head: STUDENT DEBT
Is Student Debt Jeopardizing the Long-Term Financial Health of U.S. Households?
*William Elliott, PhD, University of Kansas, School of Social Welfare
1545 Lilac Lane, 309 Twente Hall, Lawrence, KS 66044
Email: [email protected]; Phone: (785) 864-2283; Fax: (785) 864-5277
Ilsung Nam, PhD, University of Kansas, School of Social Welfare
1545 Lilac Lane, 6 Twente Hall, Lawrence, KS 66044
Email: [email protected]; Phone: (785) 864-2283; Fax: (785) 864-5277
Keywords: net worth; student loans; survey of consumer finances, college; child development
accounts
Acknowledgements: We are particularly grateful for the detailed feedback provided by Bryan J.
Noeth on the analysis plan for this study. We would also like to thank William R. Emmons and
Jason Lee for their helpful thoughts, and Karen M. Pence for her willingness to share the Stata
macro she created for use in the analysis for this paper. Finally, we would like to thank Michael
Sherraden and Jin Huang for their informative comments and Sung-Geun Kim for his assistance
in conducting the analysis.
*Corresponding author
2
Abstract
In this study, we use the Survey of Consumer Finances to examine whether student loans
are associated with household net worth. For households without outstanding student debt, we
find that median net worth in 2009 ($117,700) is nearly three times higher than it is for
households with outstanding student loans ($42,800). Further, multivariate statistics reveal that
living in a household with outstanding student debt and median net worth in 2007 ($128,828) is
associated with a loss of about 54% in net worth in 2009 compared to living in a household with
similar levels of net worth but no outstanding student debt. The main policy implication of this
study is that outstanding student debt may reduce the financial health of households. However,
this topic is complex and more research is needed before suggesting policy prescriptions.
3
Highlights:
About 18% of U.S. households have outstanding student loan debt; the average of these
has about $26,018 in outstanding student loan debt.
Median net worth in 2009 for households without student debt ($117,700) is nearly three
times higher than it is for households with student debt ($42,800).
Living in a household with median net worth in 2007 ($128,828) which has outstanding
student debt is associated with a loss of about 54% in net worth compared to a household
with similar levels of net worth but without student debt.
Living in a household with a four-year college graduate with outstanding student debt is
associated with a net worth loss of about 63% ($185,995.90 less) compared to living in a
household with a four-year college graduate without outstanding debt.
By reducing net worth, outstanding student debt may reduce the financial health of
households but more research is needed.
4
Introduction
More households hold more are shackled by student debt than ever before. Fry (2012)
finds that 40% of all households with heads younger than age 35 have outstanding student debt.
In the 2011—2012 school year about 37% (70.8 billion) of all undergraduate financial aid
received came from federal loans (College Board, 2012). The next highest source of aid was
federal Pell Grants at 19% and institutional grants at 18%. According to Fry (2012), the average
outstanding student loan debt in 2007 was $23,349 and it rose to $26,683 by 2010. Further, total
borrowing for college hit $113.4 billion for the 2011—2012 school year, up 24% from five years
earlier (College Board, 2012). As a result, more households are faced with ever-growing
amounts of student loan debt.
While high-income households are more likely to have student loan debt, outstanding
debt as a share of household income is higher for low-income families than it is for any other
group. According to Fry (2012), outstanding student loan debt made up 24% of household
income for households with income less than $21,044 in 2010, while it made up 7% for
households with incomes between $97,586 - $146,791, and 2% for households with incomes
$146,792 or more. Fry (2012) finds similar patterns with respect to assets. This suggests that the
relative burden placed on households by student debt may not be equally shared. Changes in
federal and state policies that have favored students and their families taking on more of the
burden of paying for college may disproportionately burden low-income and minority students
(see Elliott & Friedline, 2012). While a growing body of literature suggests that these shifts are
affecting students’ decisions about higher education, this paper examines the relationship with
families’ finances, even after college graduation.
Student Loans and the Long-Term Financial Health of Households

5
Generally, student debt is thought to be detrimental to the financial health of households
and the U.S. economy only in those cases in which individuals default on their student loans. The
U.S. Department of Education (2012) finds that the national two-year student loan default rate
was 9.1% in 2010 and the three-year default rate was 13.4%. Not surprisingly, students from
higher income households are less likely to default (Woo, 2002). We speculate that their families
might be able to provide them with a safety net against fluctuations in their own personal income,
while lower-income families are less able to offer such support. Further, the higher the amount of
debt students graduate with, the more likely they are to default on their loans (Schwartz & Finnie,
2002).
However, student loan debt can be damaging to household balance sheets even when not
in default. According to Boshara (2012), household balance sheets include quality of financial
services and credit scores, savings, assets, and consumer mortgage debts. Just being delinquent
may also be damaging to the overall financial health of a household. Student loans are delinquent
when a borrower becomes 60 to 120 days late. Delinquent accounts may be reflected in students’
credit scores. According to Cunningham and Kienzl (2011), 26% of borrowers who entered
repayment in 2005 became delinquent on their loans at some point but did not default. About 21%
of these borrowers do not pay back their loans to get out of delinquency, but instead use
deferment (temporary suspension of loan payments) or forbearance (temporary postponement or
reduction of payments for a period of time because of financial difficulty) to temporarily
alleviate the problem (Cunningham et al., 2011). In total, Cunningham and Kienzl find that
nearly 41% of borrowers suffered the negative consequences of delinquency or default.
Delinquency and default also may have negative consequences for society as a whole.
For example, the U.S. Department of Education spent $1.4 billion to pay collection agencies to
6
track down students who are delinquent or in default (Martin, 2012). The high percentages of
students either becoming delinquent or defaulting might have led some in the popular media to
speculate whether student loans represent the next financial crisis for America (e.g., Cohn, 2012).
The effects may extend beyond students to their families as a whole. Parents often cosign
on student loans, making them equally liable for repayment and the consequences of default.
According to the Federal Reserve Bank of New York, about 2.2 million Americans 60 or older
owed $43 billion in federal and private student loans in 2012, up $15 billion from 2007 (Greene,
2012). Among student loans held by Americans 60 or older, 9.5% were at least 90 days
delinquent. This is up about 7.4% from 2007. Even without defaulting, cosigners’ responsibility
for loan repayment affects their credit, and as such may make it more difficult to qualify for
loans for homes or other major purchases.
Default and delinquency can be damaging to the financial health of households. Even
when individuals are not delinquent and do not default on their loans, having student loan debt
may still negatively affect the financial health of households (e.g., Gicheva, 2011; Minicozzi,
2005; Mishory, O’Sullivan, & Invincibles, 2012). For example, Stone, Van Horn, and Zukin
(2012) find that 40% of students graduating from a four-year college with student loan debt
delay a major purchase such as a home or car. Evidence also suggests that students with
outstanding student loans may delay marriage and have reduced earnings. For example, Gicheva
(2011) finds that an additional $10,000 for education reduces the long-term likelihood of
marriage. Minicozzi (2005) finds evidence that a student loan debt increase from $5,000 to about
$10,000 is associated with a 5% decline in wage growth four years after graduating from college.
Theoretical Framework

7
Using the traditional life-cycle model in economics, Rothstein and Rouse (2011) posit
that debt from student loans should have little effect on consumption throughout the life course.
They go on to suggest that, “student debt has only an income effect – proportional to the ratio of
debt to the present discounted value of total lifetime earnings – on career and other post-college
decisions” (Rothstein & Rouse, 2011, p. 149). As such, students are treated as rational actors
who weigh the amount of student debt they will incur on the way to completing a college degree
against their potential lifetime earnings as a college graduate. Rothstein and Rouse (2011) point
out that $10,000 in student debt represents less than 1% of the present value of the average
college graduate’s potential lifetime earnings. They argue that since the amount of debt the
typical student incurs for attaining a college degree is so small relative to their potential lifetime
earnings, student debt will have little effect on consumption at any point during the life course
(Rothstein & Rouse, 2011).
However, upon leaving college, young adults’ annual earnings are often much lower than
what they will be after they reach their prime earning years during middle age. Further, in most
cases, young adults cannot rely on their parents to give them the money they need to purchase
large-ticket wealth -building assets. Therefore, most young adults are forced to rely on credit as a
key mechanism for smoothing out their consumption and purchasing wealth-building assets like
a house (Oliver & Shaprio, 2006; Keister, 2000). The life-cycle hypothesis of student debt
assumes that there are little or no constraints on credit (a perfect credit market) and individuals,
particularly lower income, are able to borrow against future earnings to purchase large ticket
items that require considerable financial investment. In America, houses are the main source of
wealth accumulation for the middle class (Mishel, Bivens, Gould, & Shierholz, forthcoming).
Mishel et al. (forthcoming) find that home equity makes up about 64.5% of all U.S. wealth.
8
There is evidence to suggest that credit constraints may actually force young adults with
outstanding student debt to delay purchasing a house, or purchase it at a much higher interest rate
in the subprime loan market. This may make it harder for them to earn equity in the house. For
example, Mishory et al. (2012) find that the average single student debtor would have to pay
close to 50% of their monthly income toward student loans and their mortgage payments. As a
result, they would not qualify for an FHA loan or many private loans (Mishory et al., 2012).
Despite evidence that student loan debt may have negative economic consequences for
individuals and the households they live in post-graduation, little academic research has been
done on the role that student debt plays on the overall financial health of households. In this
study we attempt to provide a first look at this question. Following Rothstein and Rouse, we
posit that credit constraints upon leaving college may represent a source of substantial debt
effects on post-college outcomes not accounted for by the traditional life-cycle hypothesis in
economics.
Research Questions
We explore three research questions. First, is having outstanding student loan debt
associated with household net worth? Second, among households with outstanding student debt,
is the amount of debt associated with household net worth? The final research question is
regarding equity: is outstanding student loan debt associated with household net worth among
graduates of four-year colleges and higher?
Methods
Data
We used the Survey of Consumer Finances (SCF) 2007—2009 panel data, which was
sponsored by the Federal Reserve Board. The panel data collected observations on 3,857 families
9
of the U.S. population who responded in 2007 and in 2009. These panel data offer the advantage
of using a true longitudinal design, over the normally cross-sectional SCF data, providing an
opportunity to analyze change in net worth. We analyzed data on survey respondents, rather than
the household heads, in part because the SCF does not provide information on such key variables
as the household head’s race. The respondent in a household is defined as, “the economically
dominant single individual or the financially most knowledgeable member of the economically
dominant couple” (Kennickell, 2010, p. 4). Questions were focused on the primary economic
unit, which “includes the core individual or couple and any other people in the household or
away at school who were financially interdependent with that person or couple” (Kennickell,
2010, p. 4).
The aggregate sample for this study consisted of all 3,857 households in the SCF, from
which we created two subsamples. First we restricted the sample to include only respondents
who graduated from a four-year college (n = 2,385), in order to test whether the effects of
student loan debt on financial well-being were mitigated by college completion. Second, we
restricted the sample to students with outstanding student loans (n =543) to determine whether
amount of student loans mattered for determining household net worth.
Measures
To construct the variables in this sample we used the macro provided by SCF.1 This
macro was created for use with the 2007—2009 SCF survey panel.
Dependent Variables. Net worth in 2009 was the dependent variable of interest. Net
worth was calculated by using the SCF macro for the 2007—2009 survey panel. Net worth was
1 The macro can be found at
http://www.federalreserve.gov/econresdata/scf/files/fedstables.macro.txt.

10
composed of the sum of savings, checking, money market accounts, certificates of deposit,
stocks, bonds, mutual funds, 401(k)s, plan balances, IRAs, the cash value of whole life insurance
policies, tangible assets such as real estate and cars, as well as loans against these assets minus
credit card balances and other consumer loans to include student loans. For a more detailed
explanation of how SCF calculated net worth see Bucks, Kennickell, Mach, & Moore (2009).
Since student loans were a liability and because we wanted to examine the effects of
student loans on net worth using the net worth variable calculated from the SCF macro, we had
to remove student loan amount from the net worth variables. To remove a liability, it has to be
added. Therefore, we added student loan amount into the net worth variables. Moreover, we
transformed net worth using the Inverse Hyperbolic Sine (IHS). The IHS conversion allowed us
to maintain negative net worth values without having to restrict the sample or distort standard
errors (Pence, 2006). The transformation can be expressed as:
sinh-1
(θw) = θ-1
ln(θw + (θ2w
2 + 1)
½)
in which θ is a scaling parameter and w is net worth. According to Pence (2006), the inverse
hyperbolic sine transformation provides a way to estimate a percentage change specification
without excluding households with negative net worth.
To make interpretation of results easier, we converted IHS net worth values back into
dollar amounts. The conversion can be expressed as:
( )
, and can be considered as a marginal effect of a change in independent variable X on dollars of
wealth w, where ( ), θ was a scaling parameter for IHS transformation, and was
a coefficient for variable . The IHS marginal effects depend on the chosen value of θ. The
11
regression estimates in this study were based on a θ of 0.00011, the optimal value as estimated
by maximum likelihood method.2
Covariates. We included 10 covariates in our analyses: whether a member of the
household was the graduate of a four-year college graduate or higher, age, occupational prestige,
marital status, welfare use, race, health insurance coverage, income, net worth, and outstanding
student loans.3 With regard to our variable of interest, outstanding student loans, respondents
were asked whether they or anyone in their household owed any money or had any loans for
educational expenses (yes/no). We also examined student loan amount; it was a continuous
variable. All controls were drawn from the 2007 wave of the SCF using the macro provided by
SCF (see footnote 1). Highly skewed variables can be appropriately analyzed using median
regression without being transformed because median regression does not post any assumption
of distribution (Hao & Naiman 2007).
Analysis Plan
Median Regression
Data analysis steps were conducted using Stata (version 12). The main analysis employs
median regression. According to Pence (2006), median regression offers two advantages over
ordinary least squares (OLS). First, median regression can deal with extreme values in data
without a major distortion in estimation because it is only affected by the order in data. Second,
2 To calculate the optimal values we used a macro created by Pence (2006). It can be found at
http://works.bepress.com/karen_pence/16/.
3 Welfare use was measured by asking respondents whether he/she or anyone else in the
household had income from TANF, Supplemental Nutrition Assistance Program (SNAP), or
other forms of welfare or assistance such as Social Security Insurance (SSI).
12
the difference-in-difference estimator by median regression is an unbiased estimator of
percentage change (Wooldbridge, 2002). Using a series of median regression analyses, we
estimated the effect that outstanding student loan debt had in 2007 on net worth in 2009. The
covariates such as four-year college graduation, age, income, occupational prestige, marital
status, use of welfare, race, and health insurance use were used. We utilized four different
samples: the aggregate sample, a four-year graduate-only sample, a sample of respondents with
student loans, and a sample of respondents between the ages of 30 to 60.
Missing Data and Adjustment of Standard Errors
As many respondents in the SCF dataset were reluctant to reveal the values of their assets
(Kennickell, 1997), imputation was inevitable for unbiased model estimation, which introduces
uncertainty in the process. Additionally, due to the heteroskedasticity issue, median regression
standard errors were potentially inaccurate. Finally, due to the complex stratification and
clustering in SCF sample design, which the SCF data does not provide information for the
respondent’s confidentiality issue, the standard errors should be adjusted.
We employed the methods that Pence (2006) used in her study using the tools that the
SCF provided in order to adjust standard errors for heteroskedasticity, survey design, and
imputation uncertainty. The first method we employed was bootstrapping, using 999
bootstrapped sampling weight replicates that the SCF provided (Kennickell, 1997; Kennickell,
2000; Pence, 2006). We also used the repeated imputation inference to adjust the standard errors
for imputation uncertainty (Pence, 2002; Pence, 2006).
Sensitivity Analysis
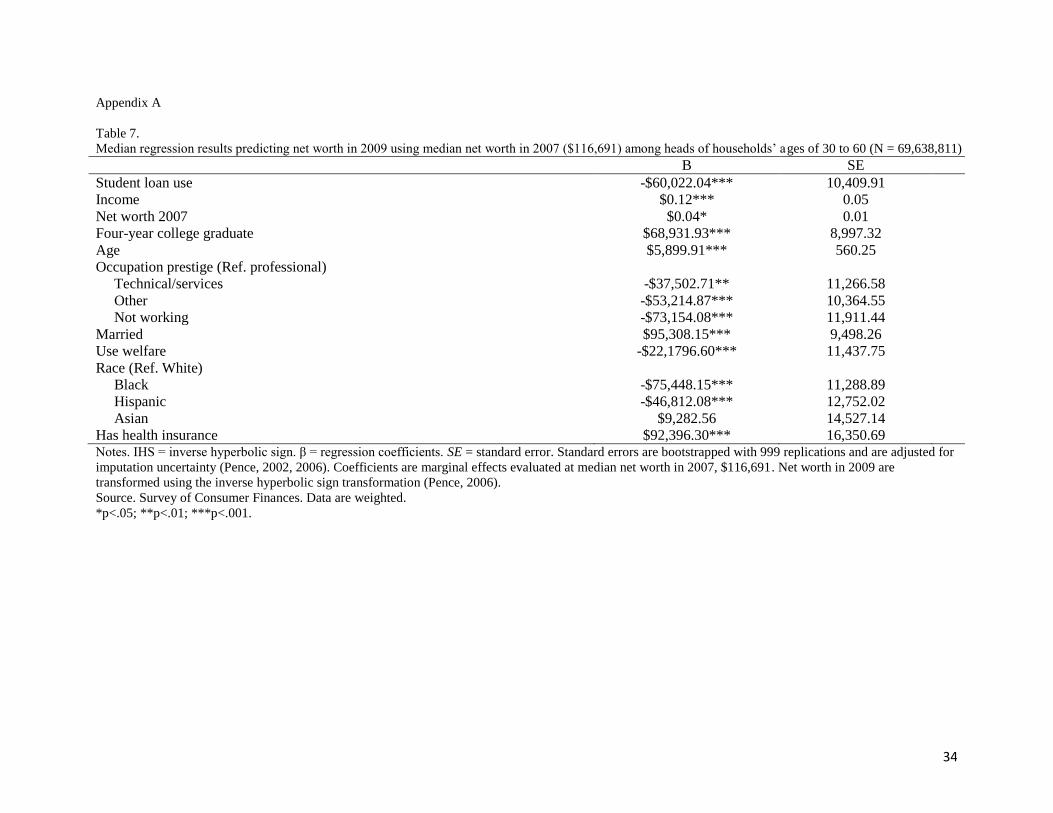
We also estimated models restricting the sample by whether a college graduate or higher
was in the household, and by age. In the main models we control for four-year college graduation,
13
but by restricting the sample to only households with a four-year graduate or higher we were able
to better account for differences that might result from having a four-year degree. Results are
reported in Table 6. In the case of age, we restricted the sample to ages 30 to 60. We used the
cutoff of 60 because at this age saving decisions might be affected by retirement options (Pence,
2006). Results remained similar to that of the aggregate sample. To conserve space these results
were not reported in the main text (see Appendix A, Table 7).
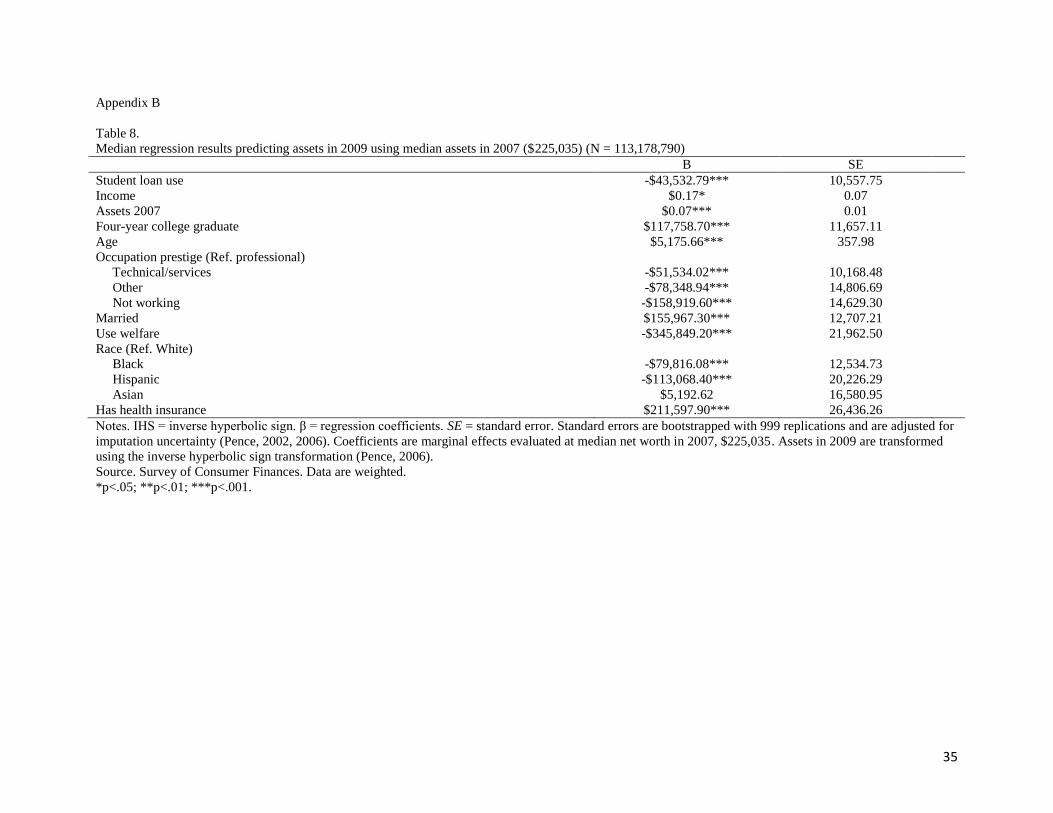
Finally, we estimated a model using assets as the dependent variable in place of net worth.
Assets are composed of the sum of savings, checking, money market accounts, certificates of
deposit, stocks, bonds, mutual funds, 401(k)s, plan balances, IRAs, the cash value of whole life
insurance policies, tangible assets such as real estate and cars. This variable was also derived
from the SCF 2007—2009 macro (see footnote 1). Table 8 contained these results (see Appendix
B, Table 8). We find that living in a household with outstanding student debt was associated with
having $43,532.79 fewer assets compared to living in a household without outstanding student
debt.
Results
Sample Characteristics
As expected, given that the SCF panel data cover the period of the Great Recession,
median net worth in 2007 ($128,828.35) declines in 2009 ($98,000.00). Further, approximately
36% of households have a family member who is a four-year college-graduate or higher. With
respect to student loans, about 18% of households have outstanding student loan debt and on
average they owe about $26,018.27. The average respondent’s age is approximately 52
(minimum age 19; maximum age 95). The median income is $50,053.89, about 12% of
14
households use welfare, and about 92% of households include at least one member with health
insurance. For further information on the sample characteristics, see Table 1.
[INSERT TABLE 1 ABOUT HERE]
Sample Characteristics by Student Loan Use
Table 2 provides information on who uses student loans. Among respondents with a four-
year college degree about 49% live in households with outstanding student loan debt, while the
average age of respondents who live in households with student loans is 39. In contrast, 33% of
respondents who are four-year college graduates live in households with no outstanding loans,
and the median age of respondents living in a household without student loans is 52. The median
household income is $57,508.72 for households with student loans while it is $47,923 for
households without student loans.4 We also see that a higher percentage of black households
(27.9%) have loans than Hispanic households (14.1%) (see note at the bottom of Table 2). For
more information see Table 2.
[INSERT TABLE 2 ABOUT HERE]
Net Worth by Student Loan Use
Table 3 provides information on net worth by student loan use. Median net worth in 2009
for households without outstanding student loan debt is nearly three times higher than it is for
households with outstanding student loans ($117,250.00 vs. $42,800, respectively). Though
slightly smaller, this pattern holds true for 2007 net worth data as well ($149,022.50 vs.
$68,427.17). Households with no outstanding student loans have a bigger decrease in their
4 All households with student loans have a member that at least has some college while
households without student loans may or may not have a member with some college. This might
explain income differences.
15
median change in net worth from 2007 to 2009 than do households with outstanding student
loans (-$10,957.34 vs. -$5,410.03, respectively). However, whether we examine the mean or
median change in net worth, change in net worth represents a higher percentage of total net
worth in 2009 for households with outstanding student debt (mean 40.28; median 12.4%) than it
does for households with no outstanding student debt (mean 22.6%; median 9.31%).5
[INSERT TABLE 3 ABOUT HERE]
Predicting Net Worth in 2009 by Percentile (15th
, 30th
, and 50th
) of Net Worth in 2007
In the next series of analyses, coefficients are marginal effects evaluated at the 15th
, 30th
,
and 50th
percentile. With regard to our variable of interest, student loans are an important
predictor of net worth after holding all other factors constant. Regardless of percentile of net
worth in 2007, the association between student loans and net worth in 2009 remains consistently
negative (Table 4). Living in a household at the 15th
percentile that has net worth of $1,761 in
2007 with outstanding student debt is associated with a drop in net worth in 2009 of $5,017.26
compared to if they did not have student debt, a loss of about 285%. Living in a household at the
30th
percentile with net worth of $33,780 in 2007 with student debt is associated with a drop in
net worth in 2009 of $18,954.12 compared to if they did not have student debt, a loss of about
56%. Living in a household that has net worth of $128,828 (50th
percentile) in 2007 with student
5 We also investigated change in net worth as the dependent variable; however, this table
suggests that change in net worth might not be the right dependent variable to use. This is
because even though households without outstanding student loans on average experience larger
declines in net worth than households that have outstanding student loans, these losses make up
considerably less of their total net worth holdings.
16
debt, is associated with a drop in net worth in 2009 of $69,976 compared to if they did not have
student debt, a loss of about 54%.
In addition to student loans, occupation prestige, welfare use, and being black or Hispanic
have a significant negative association with net worth in 2009. Of these covariates, several stand
out. For example, using welfare and living in a household with net worth in 2007 at the 15th
(-
$14,650.37, loss of 832%), 30th
(-$55,345.92, loss of 164%) or the 50th
(-$204,329.60, loss of
159%) percentiles is associated with having net worth in 2009 that is less than if they did not use
welfare and had similar levels of net worth in 2007. It is also worth pointing out that black
households, households with net worth in 2007 at the 15th
(-$4,983.58, loss of 283%), 30th
(-
$18,826.89, loss of 56%) or the 50th
percentile (-$69,506.29, loss of 54%) are associated with
having less net worth in 2009 than white households with similar levels of net worth in 2007. In
the case of Hispanic households, households with net worth in 2007 at the 15th
(-$5,687.63, loss
of 323%), 30th
(-$21,486.61, loss of 64%) or the 50th
percentile (-$79,325.63, loss of 17%) are
associated with having less net worth in 2009 than white households with similar levels of net
worth in 2007.
In contrast, higher income, higher net worth in 2007, having a four-year college graduate
in the household, age, being married, being Asian, and having health insurance are all associated
with an increase in net worth in 2009. In particular, two of the covariates stand out from the rest:
households with a four-year college graduate, and those with health insurance. Living in a
household with a four-year college graduate and net worth in 2007 at the 15th
($6,379.97, gain of
362%), 30th
($24,102.13, gain of 71%) or the 50th
($88,981.78, gain of 69%) percentile is
associated with having more net worth in 2009 compared to living in a household without a four-
year college graduate and similar net worth levels in 2007. Living in a household with health
17
insurance and net worth in 2007 at the 15th
($6,999.12, gain of 397%), 30th
($26,441.17, gain of
78%) or the 50th
($97,617.16, gain of 76%) percentile is associated with having more net worth
in 2009 compared to living in a household without health insurance and similar net worth levels
in 2007.
[INSERT TABLE 4 ABOUT HERE]
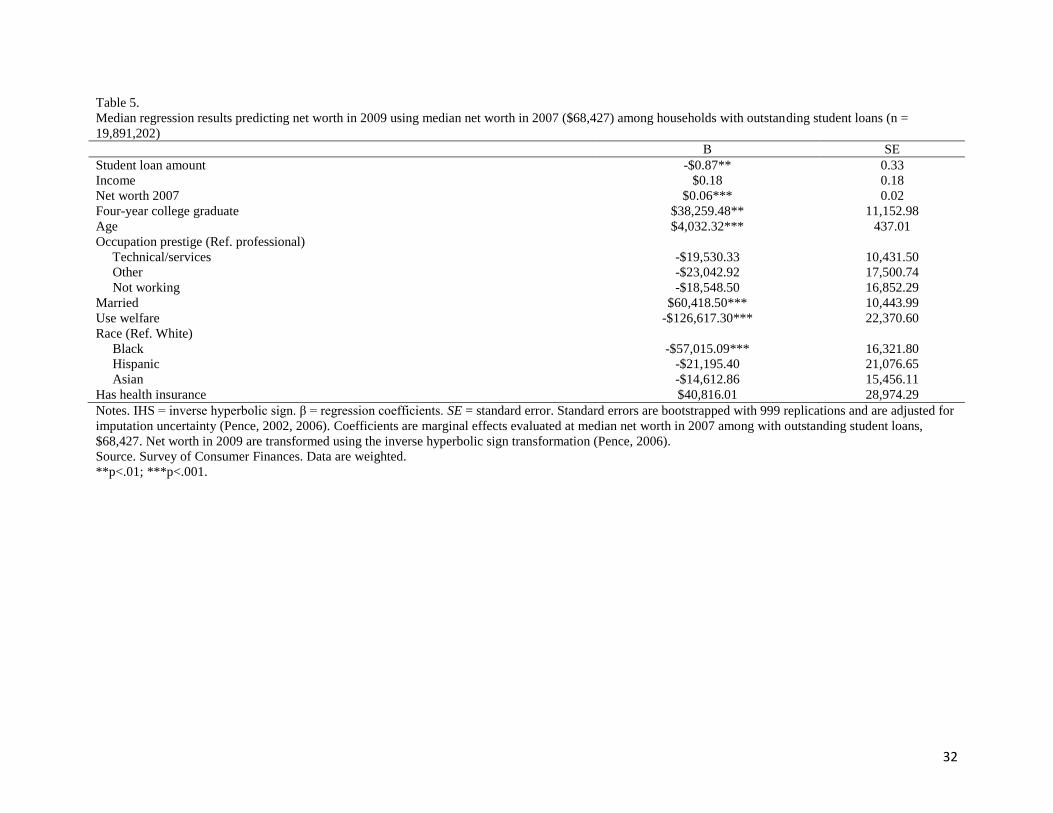
Predicting Net Worth in 2009 among Students with Loans
In addition to student loan use (has loans/does not have loans), student loan amount has a
significant negative association with net worth in 2009 (Table 5). For each one-dollar increase in
student loans, living in a household with median net worth in 2007 is associated with having
$0.87 less net worth in 2009. Marital status, use of welfare, and race remain significant negative
predictors of net worth. Interestingly, Hispanic households are not significantly different from
white households. However, with respect to black households, living in a household with median
net worth in 2007 is associated with having $21,195,40 less net worth in 2009 compared to white
households, a loss of about 31%.
Higher net worth in 2007, having a four-year college graduate in the household, being
older, and being married have a significant positive association with net worth in 2009. Living in
a household with a four-year college graduate and net worth in 2007 at the 50th
percentile is
associated with having $38,259.48 (a gain of 56%) more net worth in 2009 compared to a
household with a four-year college graduate and similar net worth levels in 2007.
[INSERT TABLE 5 ABOUT HERE]
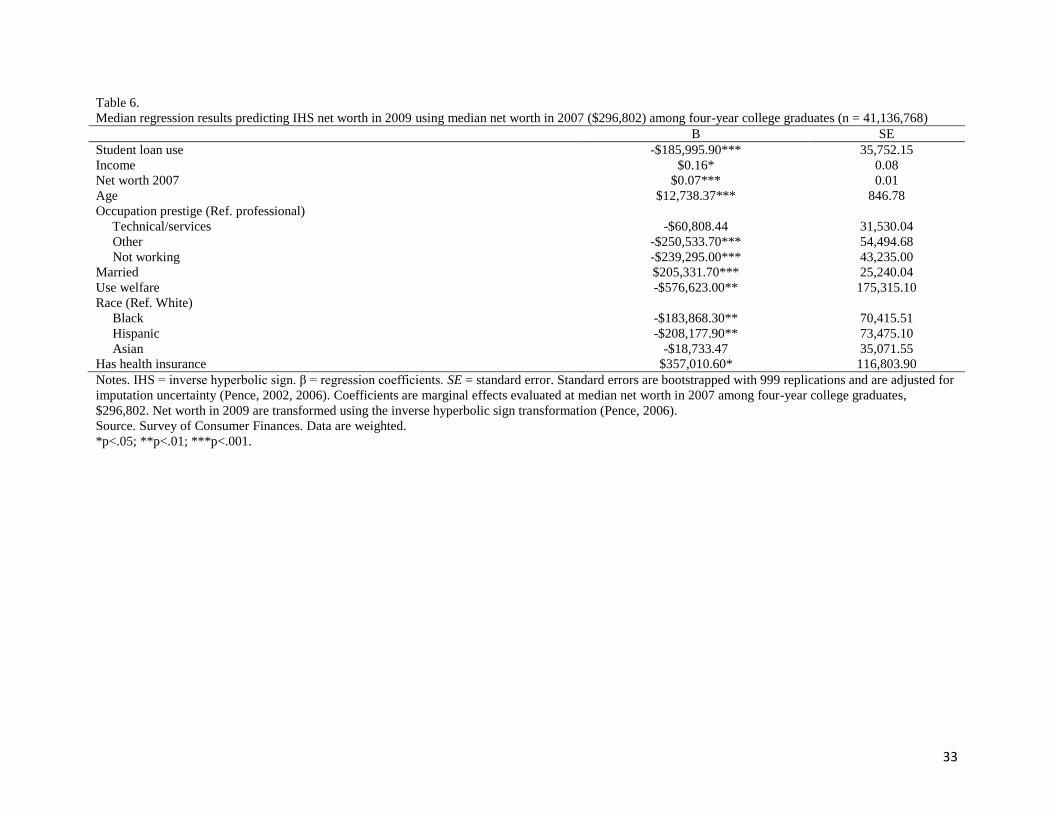
Predicting Net Worth in 2009 among Four-Year College Graduates
Student loans continue to have a significant association with net worth in 2009 when the
sample is restricted to households with a college graduate (Table 6). Living in a household with
18
student debt which have net worth of $296,802 (50th
percentile) in 2007 is associated with having
$185,995.90 less net worth in 2009 compared to households without student debt, a loss of about
63%. Other factors that contribute to low net worth are occupational prestige, use of welfare, and
race. Once again, the biggest predictor associated with a reduction in net worth is welfare use.
Living in a household that uses welfare and has median net worth in 2007 ($296,802) is
associated with having $576,623 less net worth in 2009 compared to living in a household that
did not use welfare, a loss of about 194%. With respect to black households, living in a
household with median net worth in 2007 is associated with a loss of $183,868.30 of net worth in
2009 compared to living in a white household with median net worth in 2007, a loss of about
62%. Further, living in an Hispanic household with median net worth in 2007 is associated with
having $208,177.90 less net worth in 2009 compared to living in a white household with median
net worth in 2007, a loss of about 70%.
Income, net worth in 2007, age, being married, and having health insurance all are
significantly related to increases in 2009 net worth. It is worth pointing out that both net worth in
2007 and income, while significant, have a weak association with net worth in 2009. Somewhat
surprisingly, living in a household with median net worth and health insurance in 2007 is
associated with having $357,010.60 more net worth compared to living in a household with no
health insurance, a 120% difference. Findings also suggest that being married is related to having
relatively strong gains in net worth. Living in a household with median net worth and where the
head is married in 2007 is associated with having $205,331.70 more net worth compared to
living in a household where the respondent is not married, gain of 69%.
[INSERT TABLE 6 ABOUT HERE]
Discussion
19
In our sample about 18% of households have outstanding student loans. Further, the
average family in 2007 has about $26,018 in student loans. This is slightly higher than what past
research finds. Fry (2012) finds that the average household in 2007 has about $23,349.00 of
outstanding debt. The difference might be due to the fact that Fry (2012) uses 2011 dollars. Not
surprisingly, we also see a sharp decrease in median net worth from 2007—2009 ($128,828.35 to
$98,000.00). This might be because the 2007—2009 period is the period of the Great Recession
and a large number of households during this period experienced a drop in their net worth,
largely as a result of declining home values (Fry, 2012).
The first main research question we examine in this study is whether having student loans
is associated with household wealth in 2009. We find that median net worth in 2009 for a
household without outstanding student debt ($117,700) is nearly three times higher than for a
household with outstanding student debt ($42,800). Moreover, when we consider change in net
worth, the relative burden appears to be much greater for households with student debt. Whether
we examine the mean or median change in net worth, change in net worth represents a higher
percentage of total net worth in 2009 (12.4%) for households with outstanding student debt than
it does for households with no outstanding student debt (9.31%). This might suggest that
households with outstanding student debt are more burdened by the negative change in net worth
from 2007 to 2009 than households without student loans.
After controlling for demographic factors, we find the pattern suggested by the
descriptive data remains: outstanding student loans are associated with having lower net worth.
A hypothetical household that has exactly median net worth in 2007 ($128,828) and has
outstanding student loans is associated with a loss of about 54% in net worth in 2009 compared
to a household with similar levels of net worth but no student debt. The idea that student debt
20
might negatively affect adults’ post-graduation outcomes is consistent with previous research.
For example, findings suggest that students graduating from a four-year college delay purchasing
major assets such as a car or a home (Stone, Van Horn, & Zukin, 2012), delay marriage (Gicheva,
2011), and earn lower wages after the first year upon graduating (Minicozzi, 2005).
Our findings might also suggest that outstanding student debt has a consistent negative
association with net worth in 2009 among households at the 15th
, 30th
, and the 50th
percentile of
net worth in 2007. However, we find that households with less net worth might be more
burdened by having outstanding student debt than those with higher levels of net worth. While
households at the 15th
percentile who have outstanding student debt lost less net worth
($5,017.26) than similar households at the 50th
percentile ($69,976) from 2007 to 2009, the loss
for the 15th
percentile represents 285% of their net worth in 2009 whereas it only represents 54%
for the 50th
percentile. This is in line with Elliott and Friedline’s (2012) findings that suggest the
student debt burden increasingly placed on households may not be equally shared at different
income levels.
In addition, it is important to highlight the finding that having a four-year college
graduate in the household is associated with having more net worth when compared to
households without a four-year college graduate. However, the effect size of college graduates is
larger for households with higher levels of net worth. Therefore, while all households appear to
benefit from having a four-year college graduate in the household, wealthier households appear
to benefit even more. Income and net worth in 2007 are also significantly associated with having
more net worth in 2009, but they appear to have a weak association controlling for all other
factors but more research is needed.
21
The second question we examine in this study is whether the amount of outstanding
student loan debt is associated with net worth. We find that higher amounts of debt result in
greater net worth losses. This is consistent with previous research in other areas. For example,
Dwyer et al.’s (2012) findings suggest that student loans above $10,000 actually reduce the
chance that a student graduates from college. Similarly, Minicozzi (2005) finds evidence that
over about $10,000 worth of debt, the positive effects student loans exhibit on earnings diminish
and Gicheva (2011) finds that an additional $10,000 for education reduces the long-term
likelihood of marriage.
The third question we examine in this study is whether student loans are associated with
the financial health of four-year college graduates when compared to their counterparts who do
not have student debt. We find that living in a household with a four-year college graduate with
outstanding student debt is associated with a net worth loss of about 63% ($185,995.90 less)
compared to living in a household with a four-year college graduate without outstanding debt.
Limitations
There are a number of important limitations that should be considered. It is important to
recognize that we cannot rule out that student loan debt may be a marker for larger but
unobserved household economic challenges. In other words, it may not be the student loan debt
that is causing the decline in net worth. This is mitigated some by controlling for a number of
factors believed to be important for predicting household net worth. Further, this is less of a
problem in the sample of households who all have outstanding student debt. Even if there are
unobserved household economic challenges that households with student loans face, findings
from the all student loan sample would lessen these concerns. However, findings from this study
can only be interpreted as suggesting that there might be an association between student loans
22
and net worth. We cannot completely rule out the possibility that it is not student loans and some
other factor that is causing net worth to decline.
Another important limitation is the short time frame under investigation, 2007—2009.
This makes it hard to fully account for the fact that human capital is created by student debt.
Conventional net worth does not include the value of human capital. As a result, conventional
net worth is biased to show that student debtors have less wealth because the debt is counted but
human capital is not included as an asset. We address this in two ways. First we dropped student
loan debt from the net worth variable as discussed in the measurement section of the paper.
Second, we estimated a model using assets only. The asset variable does not include debt so the
problem of including debt but not human capital is removed. We find that student loans also
have a significant negative association with household assets (see Appendix B).
Moreover, the problem of including student debt but not accounting for human capital as
an asset seems like less of a problem in the sample that only includes households that have a
college graduate. Unless there is reason to assume that households with student debt and a
college graduate will earn more in the future than households without student debt and a college
graduate, losses in the short-term most likely due to credit constraints will be hard to make up
over the long-term. That is, there is little reason to believe that households with student debt will
be able to better leverage (i.e., earn more) their college degree at some point in the future than
households without student debt. This is inline with our hypothesis that short-term credit
constraints post-college might be a source of substantial debt effects on the financial health of
households.
We would also like to acknowledge that using change in net worth instead of net worth
would lead to different results. However, change in net worth does not account for the fact that it
23
makes up more of the total net worth of households with outstanding student debt than it does for
those without outstanding student debt.
Policy Implication
The main policy implication of this study is that outstanding student debt may reduce the
financial health of households. However, findings should be viewed as a first look at this
question; more research will be required to disconfirm or substantiate these findings. Moreover,
the policy issues are complex and must be considered within the broader context of educational
finance.
Future Research
More research should be undertaken on the effects of student loans on household
financial health generally, and particularly in different time periods. The period between 2007
and 2009 is unusual due to the Great Recession. Research across longer time periods is also
desirable. Researchers may also want to examine whether similar effects exists when different
assets are examined (e.g., home equity, savings, stocks or more generally financial assets and
nonfinancial assets). Another important area of inquiry will be to examine whether households
with outstanding loans are also highly leveraged and whether this explains the lower net worth
held by these households. Researchers might also want to investigate whether there is a threshold
amount, above which student loans become more harmful to financial health of households.
While this body of research has barely begun, the findings in this study signal that it may be
important to continue the inquiry.
24
References
Boshara, R. (2012). From Asset Building to Balance Sheets: A Reflection on the First and Next
20 Years of Federal Assets Policy (CSD Perspective 12-24). St. Louis, MO: Washington
University, Center for Social Development.
Bucks, B. K., Kennickell, A. B., Mach, T. L., & Moore, K. B. (2009). Changes in U. S. family
finances from 2004 to 2007: Evidence from the survey of consumer finances. Federal
Reserve Bulletin 95, A1-A55.
Cohn, M. (2012). Student loan debts could trigger next financial crisis. Accounting Today
Retrieved January 4, 2012, from
http://www.accountingtoday.com/debits_credits/Student-Loan-Debts-Trigger-Financial-
Crisis-61700-1.html
College Board. (2012). Trends in student aid 2012. (Trends in higher education series).
New York: Author.
Cunningham, A. F., & Kienzl, G. S. (2011). Delinquency: The untold story of student loan
borrowing (pp. 1-36). Washington, DC: Institute for Higher Education Policy.
Dwyer, R. E., McCloud, L., & Hodson, R. (2011). Youth debt, mastery, and self-esteem: Class-
stratified effects of indebtedness on self-concept. Social Science Research, 40, 727-741.
Elliott, W., & Friedline, T. (2012). "You pay your share, we'll pay our share" Economics of
Education Review. Advance online publication doi:
http://dx.doi.org/10.1016/j.econedurev.2012.10.001
Elliott, W., Nam, I., and Friedline, T. (2013). Probability of living through a period of economic
instability. Children and Youth Services Review 35(3), p. 453-460.

25
Fry, R. (2012). A record one-in-five households now owe student loan debt. Pew Research
Center. Retrieved January 1, 2012, from http://www.pewsocialtrends.org/2012/09/26/a-
record-one-in-five-households-now-owe-student-loan-debt/
Gicheva, D. (2011). Does the student-loan burden weigh into the decision to start a family?
Retrieved February 1, 2013 from
http://www.uncg.edu/bae/people/gicheva/Student_loans_marriageMarch11.pdf
Greene, K. (2012). New peril for parents: Their kids' student loans. The Wall Street Journal
Retrieved January 5, 2013,
fromhttp://online.wsj.com/article/SB10000872396390444024204578044622648516106.h
tml
Kennickell, A. B. (1997). Multiple imputation and disclosure protection: The case of the 1995
survey of consumer finances. Washington, DC: Board of Governors of the Federal
Reserve System.
Kennickell, A. B. (2010). Try, try again: Response and nonresponse in the 2009 SCF panel.
Washington, DC: Board of Governors of the Federal Reserve System.
Keister, M. P. (2000). Wealth in America. Cambridge, MA: Cambridge University Press.
Martin, A. (2012). Debt collectors cashing in on student loans. New York Times. Retrieved
January 5, 2012, fromhttp://www.nytimes.com/2012/09/09/business/once-a-student-now-
dogged-by-collection-agencies.html?hp
Martin, A. (2012). Debt collectors cashing in on student loans. Retrieved January 5, 2012, from
New York Times http://www.nytimes.com/2012/09/09/business/once-a-student-now-
dogged-by-collection-agencies.html?hp
26
Minicozzi, A. (2005). The short term effect of educational debt on job decisions. Economics of
Education Review, 24(4), 417-430.
Mishel, L., Bivens, J., Gould, E., & Shierholz, H. (forthcoming). The state of working America
12th Edition. Ithaca: NY: Economic Policy Institute Book, Cornell University Press.
Mishory, J., & O'Sullivan, R. (2012). Denied? The impact of student debt on the ability to buy
a house. Young Invincibles. Retrieved November 9, 2012, from
http://younginvincibles.org/wp-content/uploads/2012/08/Denied-The-Impact-of-Student-
Debt-on-the-Ability-to-Buy-a-House-8.14.12.pdf
Oliver, M. L., & Shapiro, T. M. (2006). Black wealth/white wealth: A new perspective on racial
inequality (Vol. Tenth-Anniversary Edition). New York: Routledge.
Pence, K. M. (2002). 401(k)s and household saving: New evidence from the survey of consumer
finances. Federal Reserve Board of Governors. Retrieved 12-20-12, from
www.federalreserve.gov/pubs/feds/2002/200206/200206pap.pdf
Rothstein, J., & Rouse, C. E. (2011). Constrained after college: Student loans and early-career
occupational choices. Journal of Public Economics, 95, 149-163.
Schwartz, S., & Finnie, R. (2002). Student loans in Canada: An analysis of borrowing and
repayment. Economics of Education Review, 21(5), 497-513.
Stone, C., Van Horn, C., & Zukin, C. (2012). Chasing the American Dream: Recent college
graduates and the great recession. Center for Workforce Development from
http://www.heldrich.rutgers.edu/sites/default/files/content/Chasing_American_Dream_Re
port.pdf
27
U.S. Department of Education. (2012). First official three-year student loan default rates
published. Retrieved January 1, 2013, from ED.gov http://www.ed.gov/news/press-
releases/first-official-three-year-student-loan-default-rates-published
Woo, J., H. (2002). Factors affecting the probability of default: Student loans in California.
Journal of Student Financial Aid, 32(2), 5-23.
Wooldridge, J. M. (2002). Econometric analysis of cross section and panel data. Boston, MA:
MIT Press.
28
Table 1
Sample characteristics (N = 113,178,790)
Number or Mean % or Median
Education Loan Use 19,891,202 17.6%
Amount of Education Loan (Education loan users only) $26,018.268 $15,000
2009 Net worth $481,397.18 $98,000.00
2007 Net worth $598,232.02 $128.828.35
Is a four-year college graduate 41,136,768 36%
Age 51.52 50.00
Income $88,971.87 $50,053.89
Occupation prestige
Professional 32,674,464 28.9%
Technical services 24,703,413 21.8%
Other 23,807,313 21.0%
Not working 31,993,600 28.3%
Married 67,511,805 59.7%
Uses welfare 13,226,579 11.7%
Race
White 83,313,885 73.6%
Black 14,911,713 13.2%
Hispanic 10,160,730 9.0%
Asian 4,792,463 4.2%
Has health insurance 104,111,747 92%
Notes. Weighted data from the Survey of Consumer Finances (SCF) are used. SCF imputes data using multiple imputations. Column percentages are rounded to
the nearest whole percent or number.
29
Table 2
Sample characteristics by student loan use (N = 113,178,790)
Has Student Loans Does Not Have Student Loans
Number or Mean % or Median Number or Mean % or Median
Income $75,443.4172 $57,508.72 $91,856.47 $47,923
Is a four-year college graduate 9,819,552 49.4% 31,065,119 33.3%
Is not a four-year college graduate 10,071,649 50.6% 62,222,470 66.7%
Age 40.67 39 53.83 52
Occupation prestige
Professional 7,587,411 38.1% 25,087,053 26.9%
Technical services 5,459,732 27.4% 19,243,681 20.6%
Other 4,402,555 22.1% 19,404,758 20.8%
Not working 2,441,503 12.3% 29,552,097 31.7%
Married 13,035,998 65.5% 54,475,807 58.4%
Is not married 6,855,204 34.5% 38,811,782 41.6%
Uses welfare 2,289,349 11.5% 10,937.230 11.7%
Does not use welfare 17,601,853 88.5% 82,350,359 88.3%
Race
White 13,241,607 66.6% 70,072,278 75.1%
Black 4,167,678 21.0% 10,744,035 11.5%
Hispanic 1,426,037 7.2% 8,734,693 9.4%
Asian 1,055,880 5.3% 3,736,582 4.0%
Has health insurance 18,600,050 93.5% 85,511,697 91.7%
Does not have health insurance 1,291,151 6.5% 7,775,892 8.3%
Notes. Percentages are rounded to the nearest whole percent. In the case of race/ethnicity, within group percentages may also be important. Fifteen point nine
percent of white, 27.9% of black, 14.1% of Hispanic, and 22.1% of Asian households have outstanding student debt. Eighty-four point percent of white, 72.1% of
black, 85.9% of Hispanic, and 77.9% of Asian households do not have outstanding student debt.
Source. Survey of Consumer Finances. Data are weighted.
30
Table 3
Net worth by student loan use (N = 113,178,790)
Has Student Loans Does Not Have Student Loans
Variables Number or Mean % or Median Number or Mean % or Median
Net worth 2009 $190,945.80 $42,800 $543,328.54 $117,700.00
Net worth 2007 $284,324.81 $68,427.14 $665,164.74 $149,022.50
Change net worth -$76,917.45 -$5,410.03 -$122,778 -$10,957.34
Change in net worth / net worth 2009 (%) 40.28 12.4 22.6 9.31
Source. Survey of Consumer Finances. Data are weighted.
31
Table 4.
Median regression results predicting net worth in 2009 using 2007 net worth percentiles (N = 113,178,790)
15th ($1,761) 30th ($33,780) 50th ($128,828)
B SE B SE B SE
Student loan use -$5,017.26*** 740.60 -$18,954.12*** 2,797.84 -$69,976.00*** 10,329.25
Income $0.01** 0.00 $0.04** 0.01 $0.14** 0.05
Net worth 2007 $0.00*** 0.00 $0.01*** 0.00 $0.04*** 0.00
Four-year college graduate $6,379.97*** 616.11 $24,102.13*** 2,327.55 $88,981.78*** 8,592.98
Age $362.72*** 17.40 $1,370.29*** 65.74 $5,058.93*** 242.70
Occupation prestige (Ref. professional)
Technical/services -$3,330.62*** 735.55 -$12,582.36*** 2,778.75 -$46,452.37*** 10,258.76
Other -$4,973.97*** 898.68 -$18,790.56*** 3,395.03 -$69,372.18*** 12,533.97
Not working -$7,134.36*** 591.35 -$26,952.07*** 2,234.00 -$99,503.35*** 8,247.62
Married $6,495.43*** 584.62 $24,538.34*** 2,208.55 $90,592.20*** 8,153.67
Use welfare -$14,650.37*** 971.47 -$55,345.92*** 3,670.02 -$204,329.60*** 13,549.21
Race (Ref. White)
Black -$4,983.58*** 934.56 -$18,826.89*** 3,530.57 -$69,506.29*** 13,034.38
Hispanic -$5,687.63*** 856.06 -$21,486.61*** 3,234.01 -$79,325.63*** 11,939.53
Asian $41.96*** 1,082.96 $158.52*** 4,091.17 $585.24*** 15,104.03
Has health insurance $6,999.12*** 1,583.09 $26,441.17*** 5,980.59 $97,617.16*** 22,079.51
Notes. β = regression coefficients. SE = standard error. Standard errors are bootstrapped with 999 replications and are adjusted for imputation uncertainty (Pence,
2002, 2006). Coefficients are marginal effects evaluated at median net worth in 2007. Net worth in 2009 are transformed using the inverse hyperbolic sign
transformation (Pence, 2006).
Source. Survey of Consumer Finances. Data are weighted.
**p<.01; ***p<.001.
32
Table 5.
Median regression results predicting net worth in 2009 using median net worth in 2007 ($68,427) among households with outstanding student loans (n =
19,891,202)
B SE
Student loan amount -$0.87** 0.33
Income $0.18 0.18
Net worth 2007 $0.06*** 0.02
Four-year college graduate $38,259.48** 11,152.98
Age $4,032.32*** 437.01
Occupation prestige (Ref. professional)
Technical/services -$19,530.33 10,431.50
Other -$23,042.92 17,500.74
Not working -$18,548.50 16,852.29
Married $60,418.50*** 10,443.99
Use welfare -$126,617.30*** 22,370.60
Race (Ref. White)
Black -$57,015.09*** 16,321.80
Hispanic -$21,195.40 21,076.65
Asian -$14,612.86 15,456.11
Has health insurance $40,816.01 28,974.29
Notes. IHS = inverse hyperbolic sign. β = regression coefficients. SE = standard error. Standard errors are bootstrapped with 999 replications and are adjusted for
imputation uncertainty (Pence, 2002, 2006). Coefficients are marginal effects evaluated at median net worth in 2007 among with outstanding student loans,
$68,427. Net worth in 2009 are transformed using the inverse hyperbolic sign transformation (Pence, 2006).
Source. Survey of Consumer Finances. Data are weighted.
**p<.01; ***p<.001.
33
Table 6.
Median regression results predicting IHS net worth in 2009 using median net worth in 2007 ($296,802) among four-year college graduates (n = 41,136,768)
B SE
Student loan use -$185,995.90*** 35,752.15
Income $0.16* 0.08
Net worth 2007 $0.07*** 0.01
Age $12,738.37*** 846.78
Occupation prestige (Ref. professional)
Technical/services -$60,808.44 31,530.04
Other -$250,533.70*** 54,494.68
Not working -$239,295.00*** 43,235.00
Married $205,331.70*** 25,240.04
Use welfare -$576,623.00** 175,315.10
Race (Ref. White)
Black -$183,868.30** 70,415.51
Hispanic -$208,177.90** 73,475.10
Asian -$18,733.47 35,071.55
Has health insurance $357,010.60* 116,803.90
Notes. IHS = inverse hyperbolic sign. β = regression coefficients. SE = standard error. Standard errors are bootstrapped with 999 replications and are adjusted for
imputation uncertainty (Pence, 2002, 2006). Coefficients are marginal effects evaluated at median net worth in 2007 among four-year college graduates,
$296,802. Net worth in 2009 are transformed using the inverse hyperbolic sign transformation (Pence, 2006).
Source. Survey of Consumer Finances. Data are weighted.
*p<.05; **p<.01; ***p<.001.
34
Appendix A
Table 7.
Median regression results predicting net worth in 2009 using median net worth in 2007 ($116,691) among heads of households’ ages of 30 to 60 (N = 69,638,811)
B SE
Student loan use -$60,022.04*** 10,409.91
Income $0.12*** 0.05
Net worth 2007 $0.04* 0.01
Four-year college graduate $68,931.93*** 8,997.32
Age $5,899.91*** 560.25
Occupation prestige (Ref. professional)
Technical/services -$37,502.71** 11,266.58
Other -$53,214.87*** 10,364.55
Not working -$73,154.08*** 11,911.44
Married $95,308.15*** 9,498.26
Use welfare -$22,1796.60*** 11,437.75
Race (Ref. White)
Black -$75,448.15*** 11,288.89
Hispanic -$46,812.08*** 12,752.02
Asian $9,282.56 14,527.14
Has health insurance $92,396.30*** 16,350.69 Notes. IHS = inverse hyperbolic sign. β = regression coefficients. SE = standard error. Standard errors are bootstrapped with 999 replications and are adjusted for
imputation uncertainty (Pence, 2002, 2006). Coefficients are marginal effects evaluated at median net worth in 2007, $116,691. Net worth in 2009 are
transformed using the inverse hyperbolic sign transformation (Pence, 2006).
Source. Survey of Consumer Finances. Data are weighted.
*p<.05; **p<.01; ***p<.001.
35
Appendix B
Table 8.
Median regression results predicting assets in 2009 using median assets in 2007 ($225,035) (N = 113,178,790)
B SE
Student loan use -$43,532.79*** 10,557.75
Income $0.17* 0.07
Assets 2007 $0.07*** 0.01
Four-year college graduate $117,758.70*** 11,657.11
Age $5,175.66*** 357.98
Occupation prestige (Ref. professional)
Technical/services -$51,534.02*** 10,168.48
Other -$78,348.94*** 14,806.69
Not working -$158,919.60*** 14,629.30
Married $155,967.30*** 12,707.21
Use welfare -$345,849.20*** 21,962.50
Race (Ref. White)
Black -$79,816.08*** 12,534.73
Hispanic -$113,068.40*** 20,226.29
Asian $5,192.62 16,580.95
Has health insurance $211,597.90*** 26,436.26
Notes. IHS = inverse hyperbolic sign. β = regression coefficients. SE = standard error. Standard errors are bootstrapped with 999 replications and are adjusted for
imputation uncertainty (Pence, 2002, 2006). Coefficients are marginal effects evaluated at median net worth in 2007, $225,035. Assets in 2009 are transformed
using the inverse hyperbolic sign transformation (Pence, 2006).
Source. Survey of Consumer Finances. Data are weighted.
*p<.05; **p<.01; ***p<.001.