Embed Size (px)
Citation preview
FACTA UNIVERSITATIS Series: Physical Education and Sport Vol. 7, No 1, 2009, pp. 1 - 15
Original empirical article
IS SIGHT THE MAIN DETERRENT TO RACE PERFORMANCE IN VISUALLY IMPAIRED COMPETITIVE SWIMMERS?
UDC 796.034-056.26
Daniel Daly1, Laurie A. Malone2, Brendan Burkett3, Tomas Gabrys4, Danguole Satkunskiene5
1Department of Rehabilitation Sciences, Katholieke Universiteit Leuven, Leuven, Belgium 2Lakeshore Foundation, Birmingham, Alabama, USA
3University of the Sunshine Coast, Maroochydore, Queensland, Australia 4Warsaw Academy of Physical Education, Warsaw, Poland
5Lithuanian Academy of Physical Education, Kaunas, Lithuania
Abstract. A video race analysis was conducted at the Sydney 2000 Olympic and Paralympic Games in the 100-m freestyle event for three visually impaired classes (S11, S12, & S13) in both males and females. Supplementary information was available in small sub-samples for some physiological and biomechanical parameters. All visually impaired swimmers used race speed patterns similar to Olympic swimmers. These swimmers did not spend more race time starting or turning. The S11 class with greatest impairment swam slowest and was least competitive. Classes S12 and S13 did not differ in this respect. The race patterns of stroke rate and stroke length in visually impaired also matched those of Olympic swimmers although absolute stroke length values differed. Elite visually impaired swimmers achieve high post race lactate levels, and use arm coordination matching elite able-bodied swimmers. Aerobic capacity might, however, be low. Degree of visual impairment does not appear to be the main distinguishing factor of race performance.
Key words: race analysis, freestyle, disability sport, paralympics, olympics
Received January 29, 2009 / Accepted March, 30, 2009 Corresponding author: Daniel Daly Katholieke Universiteit Leuven, Faculty of Kinesiology and Rehabilitation Sciences, Tervuursevest 101, 3001 Leuven, Belgium • Tel: (32) (0)16 32 90 44 • Fax: (32) (0)16 32 91 96 • E-mail: [email protected]
2 D. DALY, L.A. MALONE, B. BURKETT, T. GABRYS, D. SATKUNSKIENE
INTRODUCTION
For competition at the Paralympic level, swimmers with visual impairment are di-vided into three classes: S11, S12, and S13. Class profiles are based on visual acuity, vis-ual field, and light perception as outlined below (International Paralympic Committee [IPC] swimming, 2003):
Class S11: No light perception in either eye up to light perception but inability to recognize the shape of a hand at any distance or in any direction (near blindness).
Class S12: From ability to recognize the shape of a hand up to visual acuity of 2/60 and/or visual field of less than 5 degrees (profound impairment).
Class S13: From visual acuity above 2/60 up to visual acuity of 6/60 and/or a vis-ual field of more than 5 degrees and less than 20 degrees (severe impairment).
Where a person with normal vision could read newsprint at a distance of 100 cm, an S13 swimmer needs to be at 10 cm, an S12 at 4 cm and an S11 could not read this at all. S11 swimmers are also required to wear blackened goggles and to ensure safety they use "tappers" during competition. The tappers, positioned on deck at each end of the pool, notify the swimmer that he/she is approaching the wall with a gentle "tap" using a long rod with a soft bulbous end.
Approximately 2.6% of the world population is visually impaired, and more than 80% of these persons are above 50 years of age (World Health Organisation [WHO], 2004). The recruitment pool of Paralympic athletes with visual impairments is therefore small and the low number of actual Paralympic participants reflects this (see N for preliminary heat participants per group in Tables 1 & 2). Visually impaired athletes, furthermore, might fail to recognize vital signals used to acquire knowledge, needed to make decisions and plan and execute actions during all stages of the career. Children with moderate vis-ual impairment (Congenital; acuity < 6/48) develop motor skills at a later age (Bouchard & Tetreault, 2000), have limited movement experience (Cratty, 1970), and as a result poor physical fitness and balance (Navarro, Fukujima, Fontes, de Andres Matas, & do Prado, 2004; Liebermann & McHugh, 2001; Short & Winnick, 1988).
Therefore these persons might have less opportunity to participate in intense physical activity at a young age and later less chance to compete and gain the experience needed to optimize performance (Liebermann & McHugh, 2001). They will furthermore have problems mastering correct swimming technique. Demonstrations by coaches as well as observation of other swimmers are not part of the conventional feedback available. Vis-ual input could also provide important feedback by which an individual can monitor his/her swimming speed. Vision may be important for swimmers to accurately define their position and orientation in the pool by using references such as the lane markers on the pool walls and bottom and lane lines. Poor balance could in some cases affect the swimmer's start and contribute to orientation problems during turning (Bouchard & Tetreault, 2000).
Competition or swimming race analysis has become a regular feature at most interna-tional swimming events with official video recordings conducted above water during the Olympic Games since 1988. Variables that are commonly measured include start, turn, and finish times, as well as 25-m and 50-m lap split times (Daly, Djobova, Malone, Vanlandewijck, & Steadward, 2003; Daly, Malone, Smith, Vanlandewijck, & Steadward, 2001; Mason, 2001; Pelayo, Sidney, Moretto, Wille, & Chollet, 1999). Using time data and segment distances, mid-pool swimming speed at various points in a race can be cal-

Is Sight the Main Deterrent to Race Performance in Visually Impaired Competitive Swimmers? 3
culated. Additional performance indicators include the swimmer's arm strokes/minute or stroke rate and the distance covered per arm stroke or stroke length. The swimmer's race pattern is defined by the within race changes in stroking parameters and resultant changes in swimming speed.
In a previous investigation, Malone, Sanders, Schiltz, and Steadward (2001) exam-ined the effects of visual impairment on stroke parameters during the 50- and 100-m free-style in 1996 Atlanta Paralympic swimmers. Results suggested that swim performance was most affected in persons with greatest degree of visual impairment. The male S11 swimmers demonstrated a significantly slower stroke rate, mid-pool swim speed, and race time than the other groups. The men's classes, however, were not clearly distinct from each other based on the swimming variables measured, as no significant differences were found between S12 and S13 in either event. In women, an increase in class (more sight) was associated with an increase in stroke index (swimming speed × stroke length), decrease in race time, and faster mid-pool swim speed.
Class S11 swimmers use blackened goggles reducing even differences in light per-ception. Classes S13 and S12, however, are distinguished by a cutoff point in visual acu-ity. Although this is a well known descriptor of visual function, the relationship of this measure to visual skills and abilities lags behind (Colenbrander, 2003). At any single vis-ual acuity level there is a large spread (overlap) in actual visual function. One might pose the question to which extent this plays a role in the performance of visually impaired swimmers thus further suggesting that classes S12 and S13 be integrated. Warren, Kay, Duchon, Zosh, and Sahuc (2001) have pointed out that in walking, for example, when vi-sion is reduced other feedback mechanisms such as the tactile sense might be awakened to help establish direction and speed of movement. In swimming the competitor is sur-rounded by water with its increased density also providing useful feedback.
Based on the men's results presented by Malone et al. (2001), and the literature sited, it might be suggested that three classes are not needed for swimmers with visual impair-ment; instead a two-class system may well be more appropriate. Women's results, how-ever, did not support such a change. Investigation of the other race phases (start, turn, finish), and examination of additional more basic data might provide a better under-standing of the effect of visual impairment on swimming performance.
The purpose of this study was to examine the role of vision in swimming race per-formance. Information was obtained from a race analysis of the male and female 100-m freestyle events at the Sydney 2000 Paralympic Games in which more extensive data was obtained than in the previous work of Malone et al. (2001) including a reference group of Olympic finalists. These data were complimented by a biomechanical and physiological analysis of a smaller number of elite visually impaired swimmers made as part of routine athlete screening. The question of interest was do swimmers with various degrees of vis-ual impairment differ in race result and is this due to differences in race speed and movement patterns, on starting and turning speed, or some combination of these?
This knowledge has several applications. First of all data is provided on classification. The present system is based on the WHO taxonomy. The exact implication of loss of vi-sion on swimming performance has, however, not been sufficiently evaluated. This might also provide information on how people learn to swim. The crawl stroke used in freestyle races studied here has been described as a natural stroke in which swimmers find their own best style with little help (self discovery), (Daly & Vanlandewijck, 1999). This being
4 D. DALY, L.A. MALONE, B. BURKETT, T. GABRYS, D. SATKUNSKIENE
the case the main difference between swimmers with and without visual impairment in freestyle races should be found in turning.
Presently it is not feasible to systematically collect more than disparate numbers on the more basic biomechanical and physiological parameters that might influence per-formance in the population at hand. The small numbers of elite visually impaired swim-mers are furthermore spread geographically around the world. In dealing with the ques-tion posed here it therefore should be valuable and reasonable to include even seemingly isolated information which might otherwise remain unknown. It is hoped that this might also stimulate others to pursue this area of work.
METHOD
Participants
Participants were 24 male and 23 female 100-m freestyle finalists in classes S11 to S13 at the Sydney 2000 Paralympic Games. Able-bodied reference data were obtained for an identical race analysis of finalists (n = 8 men & 8 women) at the Olympic Games held two weeks prior to the Paralympic Games at the same venue (Australian Institute of Sport, 2000). Race analysis was a scientific service for the athletes, of which all were in-formed, and whom received both individual and group reports within 12 hours of their swim. All Olympic and Paralympic participants or their legal guardian provide written permission to be photographed or videotaped for media use. Three male Sydney Para-lympic freestyle finalists, one from each class were also videotaped underwater previous to the games to determine an arm coordination index described by Chollet, Chalies, & Chatard (2000). Additionally 8 visually impaired international level swimmers (7 males and 1 female; 4 x S11, 3 x S12 & 1 x S13), among them two Athens Paralympic freestyle finalists, underwent a graded arm cranking test to determine aerobic capacity. None of these swimmers were, however, Sydney participants included on the race analysis section and they were not all freestyle specialists. These swimmers did provide informed consent.
Video Recordings and Digitizing Protocol
With the approval of the International Paralympic Committee (IPC) and IPC Swim-ming, the swimming events at the Sydney 2000 Paralympic Games were video recorded from above water. The race analysis was conducted by the Biomechanics Department of the Australian Institute of Sport. Details of this analysis have been described elsewhere (Daly et al., 2003). Five digital video cameras were suspended from the catwalk 16-m di-rectly above the pool surface of the 8 lane 50-m course. All cameras were connected via time code generators to Panasonic AG-DV2700 videocassette recorders. The official timing system (SWATCH) was also connected to the race analysis server (Compaq Proli-ant ML330) so that all 50-m split times and the end-race results for each swimmer were automatically downloaded to a database.
Data were collected from the videotapes by trained technicians. The 25-m split times were measured on videotape by manually entering the time code into the database at the moment the swimmer's head reached the 25-m reference line of each 50-m race lap. The following points were then digitized on the tapes: moment the swimmer's head passed under the reference, 15-m from start, 7.5-m before turn, 7.5-m after turns, 5-m before
Is Sight the Main Deterrent to Race Performance in Visually Impaired Competitive Swimmers? 5
finish. The position of the head was also digitized at the beginning and at the end of 4 to 6 arm stroke cycles in each of the swimming race segments. Beginning and end of a stroke cycle were defined as the first moment that the hand or arm entered the water as seen from top view.
Calculation of Performance Variables
Combining the information from the previous steps, the following were calculated: Race segment times (segment 1 = 15-m to 25-m; segment 2 = 25-m to 42.5-m,
segment 3 = 57.5-m to 75-m; segment 4 = 75-m to 95-m); Start time (start to 15-m), Turn time (7.5-m in and out of turn), and Finish time (final
5-m); Stroke Rate (1 × per race segment = time for N strokes converted to strokes/minute); Stroke Length (1 × per race segment = distance covered in N strokes converted to
distance/stroke).
Level of Competitiveness
In studies of elite sport performance, Hopkins, Hawley, and Burke (1999) point out that the caliber of the athlete examined must be clearly defined to encourage greater un-derstanding among scientists, coaches, and athletes. To define level of competitiveness or performance, swimming times were given a score, using the method suggested by Van Tilborgh, Daly, Vervaecke, & Persyn (1984) and used by Daly et al. (2001) and Daly and Vanlandewijck (1999). Performances of swimmers in various classes were set on the same scale based on the class world record.
Quantifying Race Speed Patterns
Race patterns were described in two ways. First the percentage of race time spent in each race section (starting, turning, swimming, and finishing) was calculated. In addition, the percentage changes in speed between adjacent race segments were defined. Starting, turning, and finishing indexes where also calculated for across group comparison as follows:
Start Index = (Start speed/Race segment 1 speed) × 100 Turn Index = (Turn speed/Race segment 3 speed) × 100 Finish Index = (Finish speed/Race segment 2 speed) × 100
Biomechanical and Physiological variables
In three visually impaired Sydney finalists, one from each class, and arm coordination index was measured (Chollet et al., 2000). This index is determined from side view un-derwater video analysis and describes the amount of lag time or overlapping of the pro-pulsive phases of right and left arms respectively. The index here is a mean for all com-binations of right and left arm movement over 3 stroke cycles with breathing.
Eight other visually impaired international level swimmers took part in a graded arm cranking test using an Angio arm ergometer at 60 cycles/minute (Lode, Netherlands). Load was increased each 3 min by 0.25 W/kg from an initial level of 0.5 W/kg. Oxygen consumption (V02) was determined 3 min prior to the beginning of the test in a resting position and during the last 30 s of each load step. Heart rate (HR: Polar 720i) and capillary

6 D. DALY, L.A. MALONE, B. BURKETT, T. GABRYS, D. SATKUNSKIENE
blood lactate concentration (LA) were measured prior to the beginning of the test, during the last 30 s of each load step, immediately at cessation and at 4 min and 8 min recovery.
Procedure
To describe the participants, means (M), standard deviations (SD), and minimum and maximum values were determined. One-way ANOVAs were used to compare Paralym-pic classes and Olympic swimmers. Effect size (ES) was calculated by eta squared (η2) and differences between classes were specified with the Student Newman-Keuls multiple range test. Differences within a race in race segment swimming speed, stroke length, and stroke rate were evaluated using repeated measures ANOVA with interaction for race segment × group. An alpha level of .01 was used for all analysis.
RESULTS
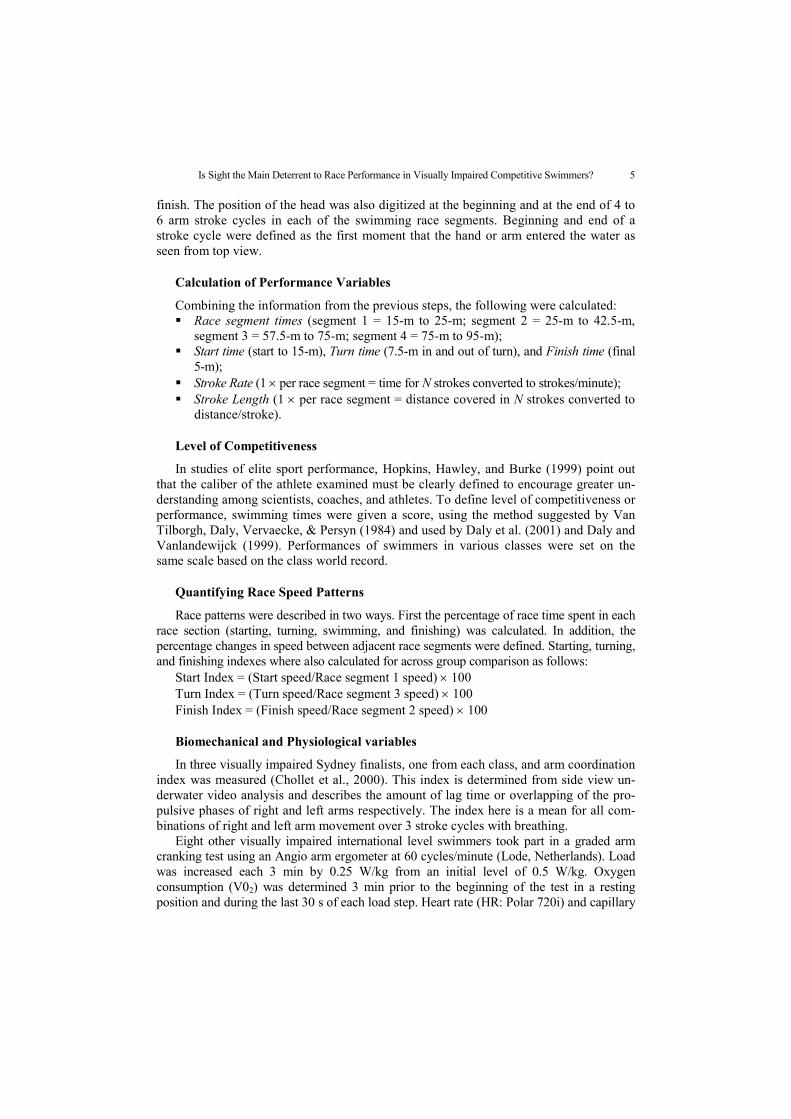
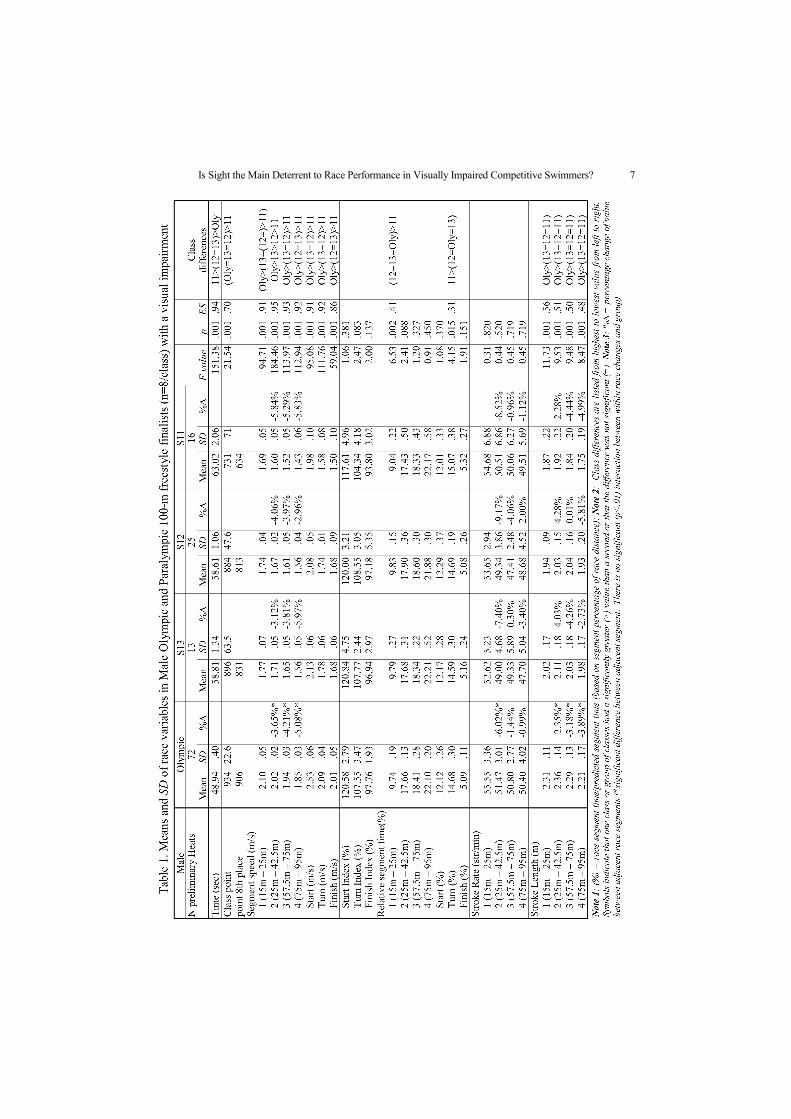
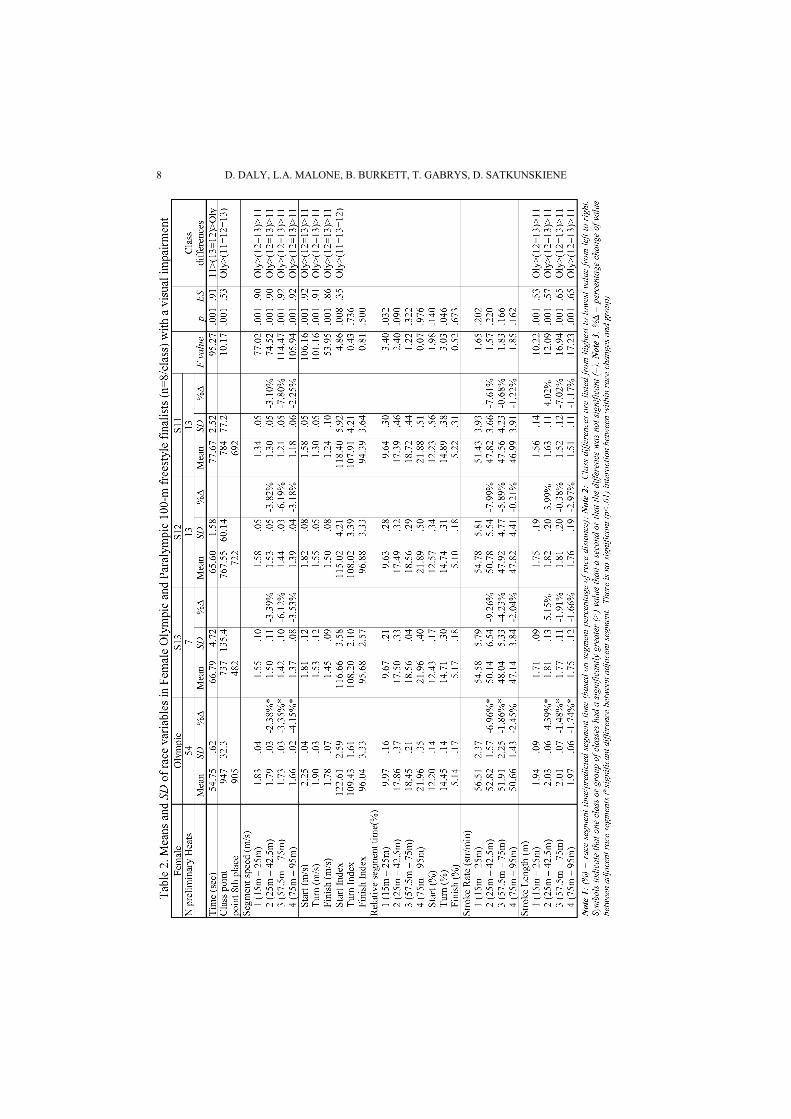
Tables 1 and 2, show the mean and standard deviation of the race analysis variables measured for the male and female 100-m freestyle events. In addition, the percentage changes in swimming speed, stroke rate and stroke length between consecutive race seg-ments are also given. All male and female visually impaired swimmers generally followed a similar pattern of race strategy that was only slightly different to the Olympic swimmers. Speed decreased as the race progressed by around 4% per segment in both Olympic and Paralympic swimmers (male: F(3, 84) = 241.69, p = .001, ES = .87 & female: F(3, 81) = 179.38, p = .001, ES = .86). There was almost never an increase in speed at the end of the race. Stroke rate decreased strongly at the beginning of this race then evened off (male: F(3, 84) = 26.45, p = .001, ES = .47 & female: F(3, 81) = 86.58, p = .001, ES = .73). Stroke length increased from race segment 1 to segment 2, and decreased thereafter (male: F(3, 84) = 14.16, p = .001, ES = .35 & female: F(3, 81) = 15.68, p =.001, ES = .33), (see Fig. 1). There was no interaction between group and race segment for any of these variables.
Men in class S11 (greatest impairment) had a significantly slower final race time than S12 and S13 (Olympians were the fastest). The S11 class was less competitive than the other 3 groups. Class S11 swimmers spent less percentage time in race segment 1 (15-m to 25-m) and more percentage time turning. Classes S13 and S12 did not differ in start-ing, turning, or finishing time and there were no differences between any groups in start-ing, turning, or finishing speed relative to swimming speed (index). Only Olympians had a longer stroke length and there were no differences in stroke rate.
There were more than 30% fewer women participants than men and the Paralympic women's event was less competitive than the men's event as reflected by the lower class points and 8th place scores. As in males, S11 swam slower and Olympians faster. Only Olympians had a relatively faster starting time and there were no further differences in race time spent in turning, finishing, or swimming. There were no differences in stroke rate while Olympians had a longer stroke length and class S11 a significantly shorter stroke length (in all 4 race segments). Actually in most respects the women's results con-firmed those of men. The repeated measures ANOVA for within race changes in swim-ming speed, stroke length, and stroke rate showed no significant interaction with group in either men or women (p < .01) indicating that these changes did not differ between Para-lympic and Olympic swimmers or within Paralympic classes (see Tables 1 & 2).
Is Sight the Main Deterrent to Race Performance in Visually Impaired Competitive Swimmers? 7
8 D. DALY, L.A. MALONE, B. BURKETT, T. GABRYS, D. SATKUNSKIENE

Is Sight the Main Deterrent to Race Performance in Visually Impaired Competitive Swimmers? 9
1
1.5
2
2.5
20 34 67 85
Race Distance (m)
Spee
d (m
/s) +
Stro
ke L
engt
h(m
)
45
50
55
60
65
70
Stro
ke R
ate
(str
/min
)
Speed
Stroke Length
Stroke Rate
Fig. 1. Progress of mid-pool swimming speed, stroke length and stroke rate in Male
Sydney Paralympic 100-m freestyle finalists (class S13, n=8).
1.40
1.60
1.80
2.00
2.20
2.40
2.60
1.40 1.50 1.60 1.70 1.80 1.90 2.00 2.10
Swim speed (m/s)
Stro
ke L
engt
h (m
)
S11S12S13Olympic
R = 0.715
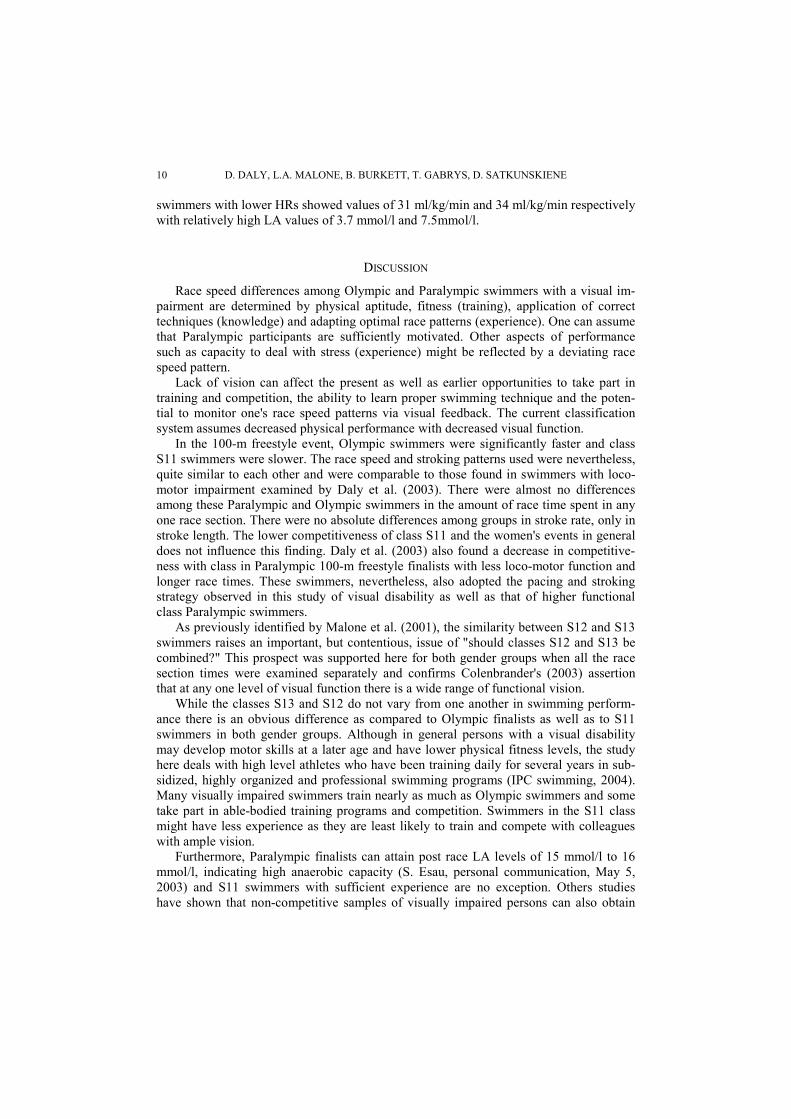
Fig. 2. Stroke length in relation to race mean mid-pool swimming speed in Male Sydney
Olympic and Paralympic 100-m freestyle finalists with visual impairment.
An index of arm coordination was measured on side view underwater video re-cordings in 3 Sydney Paralympic finalists, one from each class. The index ranged from 0.5% to 2.44% at speeds of 1.6 m/s to 1.73 m/s, indicating a slight overlapping of the right and left arm propulsive phases. During arm cranking, 6 of 8 swimmers tested reached HRs more than 90% of age related maximum values. The VO2 peak in these swimmers ranged from 36 ml/kg/min to 44 ml/kg/min (M = 41.17) at LA values of 4.94 mmol/l to 10.7 mmol/l. The lone female swimmer tested at 40.0 ml/kg/min. The two
10 D. DALY, L.A. MALONE, B. BURKETT, T. GABRYS, D. SATKUNSKIENE
swimmers with lower HRs showed values of 31 ml/kg/min and 34 ml/kg/min respectively with relatively high LA values of 3.7 mmol/l and 7.5mmol/l.
DISCUSSION
Race speed differences among Olympic and Paralympic swimmers with a visual im-pairment are determined by physical aptitude, fitness (training), application of correct techniques (knowledge) and adapting optimal race patterns (experience). One can assume that Paralympic participants are sufficiently motivated. Other aspects of performance such as capacity to deal with stress (experience) might be reflected by a deviating race speed pattern.
Lack of vision can affect the present as well as earlier opportunities to take part in training and competition, the ability to learn proper swimming technique and the poten-tial to monitor one's race speed patterns via visual feedback. The current classification system assumes decreased physical performance with decreased visual function.
In the 100-m freestyle event, Olympic swimmers were significantly faster and class S11 swimmers were slower. The race speed and stroking patterns used were nevertheless, quite similar to each other and were comparable to those found in swimmers with loco-motor impairment examined by Daly et al. (2003). There were almost no differences among these Paralympic and Olympic swimmers in the amount of race time spent in any one race section. There were no absolute differences among groups in stroke rate, only in stroke length. The lower competitiveness of class S11 and the women's events in general does not influence this finding. Daly et al. (2003) also found a decrease in competitive-ness with class in Paralympic 100-m freestyle finalists with less loco-motor function and longer race times. These swimmers, nevertheless, also adopted the pacing and stroking strategy observed in this study of visual disability as well as that of higher functional class Paralympic swimmers.
As previously identified by Malone et al. (2001), the similarity between S12 and S13 swimmers raises an important, but contentious, issue of "should classes S12 and S13 be combined?" This prospect was supported here for both gender groups when all the race section times were examined separately and confirms Colenbrander's (2003) assertion that at any one level of visual function there is a wide range of functional vision.
While the classes S13 and S12 do not vary from one another in swimming perform-ance there is an obvious difference as compared to Olympic finalists as well as to S11 swimmers in both gender groups. Although in general persons with a visual disability may develop motor skills at a later age and have lower physical fitness levels, the study here deals with high level athletes who have been training daily for several years in sub-sidized, highly organized and professional swimming programs (IPC swimming, 2004). Many visually impaired swimmers train nearly as much as Olympic swimmers and some take part in able-bodied training programs and competition. Swimmers in the S11 class might have less experience as they are least likely to train and compete with colleagues with ample vision.
Furthermore, Paralympic finalists can attain post race LA levels of 15 mmol/l to 16 mmol/l, indicating high anaerobic capacity (S. Esau, personal communication, May 5, 2003) and S11 swimmers with sufficient experience are no exception. Others studies have shown that non-competitive samples of visually impaired persons can also obtain

Is Sight the Main Deterrent to Race Performance in Visually Impaired Competitive Swimmers? 11
comparable levels of fitness to those without visual impairment (Lieberman & McHugh, 2001). One has thus to discount the idea that training and ability to achieve maximal ex-ertion explains the differences between Olympic and visually impaired Paralympic swimmers.
Examination of the Sydney Paralympic performances of visually impaired swimmers at the longer 400-m distance shows these to be less good than 100-m performances as compared to Olympians. The aerobic capacity levels of the small group of visually im-paired swimmers measured here can also only be considered as average (M = 41.17 ml/kg/min). Wheelchair athletes (Y. Vanlandewijck, personal communication, February 1, 2004) regularly obtain VO2 peak values above 50 ml/kg/min and Van Handel et al. (1988) reported values of over 65 ml/kg/min for able-bodied national level Americans in a swimming flume test. Even considering a possible difference between arm cranking and swimming values of 20% (Swaine & Winter, 1999) these visually disabled swimmers do not approach the peak VO2 levels of elite able-bodied athletes. Swaine & Winter's actual aerobic capacity values, obtained for supine arm cranking in 12 male able-bodied com-petitors were in fact equivalent to those of the visually impaired swimmers measured in this study, including two Paralympic finalists. The absolute performance level of these able-bodied swimmers was in addition only slightly higher (100-m free: M = 60.3s, SD = 3.4 s) than the visually impaired available. Within the small sample of swimmers tested here there did not appear to be any relationship between aerobic capacity and perform-ance. Visually impaired swimmers train hard. These results, however, together with the data on competitiveness indicate a generally lower physical aptitude compared to able-bodied elite swimmers which is unrelated to visual impairment.
Results here further show that swimmers with a visual impairment do not have more trouble starting and turning than their sighted colleagues and the level of the impairment does not seem to affect this. A similar result was found for finish time, with no significant differences in the finish section race strategy between the Olympic and Paralympic swimmers. This suggests that despite the lack or complete loss of vision, Paralympic swimmer still "raced" the finish section, further implying that swimmers generally follow a specific race plan over the 100-m and are less influenced by "seeing" the competitors beside them. Only the male S11 swimmers had a significantly longer percentage of time allocated to the turn. This greater allocation for the turn section of the race could be ex-pected as the S11 swimmers, having no sight, may approach and maneuver at the wall more cautiously. On the contrary the longer turn time was not observed in the female S11 swimmers.
In contrast to class S11, apparently classes S12 and S13 have enough depth percep-tion to see the large black cross on the pool end walls and perform a freestyle turn. This involves a somersault with a twist so that the legs hit the wall in a correct position to push off smoothly while not actually touching the wall with the hand. The S11 swimmers have the additional aid of the tapper and will therefore need more training (experience) but nevertheless are able to complete the task required.
There has been some discussion that underwater vision can be improved. Giesel et al. (2003) have shown that South Asian children who dive without goggles for their own food and livelihood have much better focus underwater than European children. Their eyes had adapted themselves but these authors could not determine if this was due to evolution or the result of practice. Underwater vision should be examined in Paralympics

12 D. DALY, L.A. MALONE, B. BURKETT, T. GABRYS, D. SATKUNSKIENE
swimmers. They might be one of the few samples available with visual problems spend-ing so much time with their eyes underwater.
To further examine performance variation the mean differences in 100-m freestyle end race results among groups in total 100-m race time (0.99 s to 22.8 s) were partitioned into percentages starting, turning, finishing, and swimming. In males and females com-bined the contribution of swimming time to the total time differences among groups was 66.54% (64.48% to 68.16%) with the exception of 59.85% between classes S11 and S12 in males. Starting contributed 12.05% (10.29% to 14.52%) to the total times differences, turning 15.51% (14.01% to 16.55%) and finishing 5.44% (4.81% to 6.21%). The actual contribution of these component distances to the total race distance is 15% for start, 15% for turn, 5% finish and 65% swimming. There was no relationship between absolute dif-ferences in end race result among groups and any of the percentage contributions given above. The contribution of turning time to race speed differences among groups did not increase with decreased vision.
Caution during approach to the turn was not reflected in a lower stroke rate in S11 swimmers. Stroke rate is the most common measure the swimmer and coach use to de-velop the desired race pattern. The swimmer can "feel" the arm timing and readily adjust this within their race (Daly et al., 2003). Within the four mid-pool swimming sections of the 100-m event there were no significant differences in stroke rate between the male, female, Olympic, or Paralympic swimmers. Furthermore, stroke rate changes within the 100-m distance by as much as 9% (segment 1 to segment 2) in the same manner in Olympic and Paralympic swimmers. This can only indicate that Paralympic swimmers who reach the final have sufficient experience. With practice swimmers are quite good (Δ 1%) at performing the race speed required on command without direct external feedback (Satkunskiene, Schega, Kunze, Birzinyte, & Daly, 2005). This sense of pace provided by the surrounding water mass together with the feedback of perceived exertion directly af-fecting stroke rate (rhythm) allows the swimmers to know when the turn or finish wall is approaching, with limited or no vision and without actually counting strokes.
It is interesting to note that the absolute number of strokes needed to swim a 100 m race changes by only about 3% between a heat and final race and by less than 2% be-tween laps 1 and 2 of a two lap 100-m freestyle race. This translates into a difference of less than one half arm cycle per 50-m pool lap. So when a swimmer increases stroke rate with a resulting increase in speed, the same real number of arm cycles are used to cover the race distance because of the decreased race time.
Within the male visually impaired swimmers there was no significant difference in stroke length across the three classes, although there was a general decrease with de-creasing vision. This was significantly different from Olympic swimmers. Within the fe-male visually impaired classes, the S12 and S13 swimmers produced the same stroke length, which was significantly longer than the S11 female class. This feature again highlights the similarities between the S12 and S13 class. As the stroke length difference only occurred in one gender in the S11 class, however, the result is not conclusive. The race pattern of stroke length followed is, nevertheless, the same for all groups in both males and females and is consistent with that reported by Daly et al. (2003) for Paralym-pic swimmers in the functional classes. There is an increase in stroke length at the begin-ning of the race despite the decrease in speed followed by a consistent decrease over the remaining race distance (Figure 1). This is in slight contradiction to other reports that both swimming speed and stroke length decrease consistently as race progresses (Sidney,

Is Sight the Main Deterrent to Race Performance in Visually Impaired Competitive Swimmers? 13
Delhaye, Baillon, & Pelayo, 1998; Pai, Hay, & Wilson, 1994; Craig, Skehan, Pawelczyk, & Boomer, 1985; Hay & Guimares, 1983; Letzelter & Freitag, 1983). This might also be related to the pool length which was 50-m in this study but not always the case in the sited literature.
The question remaining is: have these visually impaired athletes learned correct swimming technique (knowledge)? The evidence is positive on this point especially for men. Figure 2 shows the regression line of mean stroke length to mean mid-race swimming speed. Swimming speed decreases with stroke length from Olympic through three classes of Paralympic swimmers. The residuals of stroke length from the regression line are not different among classes in either men or women (F(3, 28) = 0.42, p = .74 & F(3, 27) = 0.25, p = .86). This suggests that all swimmers perform in relationship to their physical capacity (Kennedy, Brown, Chengular, & Nelson, 1990) and that no class deviates from the expected trend. They have adapted a swimming technique that is best for them.
An index of arm coordination (IdC) was also calculated in 3 visually impaired male 100-m Sydney Paralympic finalists, one from each class (Satkunskiene et al., 2005). The IdC values ranged from 0.05% to 2.44%, clearly falling within the limits reported for elite able-bodied swimmers by Seifert, Boulesteix, Carter, & Chollet (2004: M = 3.8%, SD = 3.8). This implies that there is less than a 3% overlapping of the propulsive phases of the right and left arm strokes. There is no indication of a catch up mode (score < -10.0%) in which one hand would always hang in front of the swimmer creating a long lag time between right and left arm propulsive phases.
CONCLUSION
This study compared the race speed and stroking patterns for visually impaired Para-lympic swimmers with Olympic swimmers over 100-m freestyle and provided some sup-plementary information on physiological and biomechanical parameters. Despite the de-gree of visual impairment, the majority of the performance indicators showed a similar race pattern used over the 100-m event by the Olympic and Paralympic swimmers. A most interesting feature was that swimmers with greatest degree of visual impairment (S11) adopted race start and finish times similar to the other groups. "Seeing" the oppos-ing swimmer or the pool surroundings may not be as important as experience (movement rhythm, feeling of the water, and perceived exertion) in employing a suitable race pattern. The results indicate that the essential difference between Olympic and Paralympic swimmers with a visual impairment appears to be in physical aptitude and that there are little or no differences in the performance of classes S12 and S13. Seeing only a little bit is enough to swim the race in an optimal manner.
Acknowledgement. This project was made possible by the financial assistance of the Science foundation of Flanders and The British Swimming Federation. The data collection was organized by Dr. Bruce Mason and Jessica Hart from the Australian Institute of Sport who also provided all equipment. Special thanks are given to the 24 students who worked around the clock to produce results for swimmers and coaches. Anne Green, chair of IPC Swimming and Dr. Jarrod Meerkin of the Australian Paralympic Committee/Queensland University of Technology coordinated and administered the project.

14 D. DALY, L.A. MALONE, B. BURKETT, T. GABRYS, D. SATKUNSKIENE
REFERENCES 1. Australian Institute of Sport, Biomechanics Department (2000). Olympic Games Swimmings:
Biomechanical Analysis. Available from Dr. B. Mason, Australian Institute of Sport, PO Box 176, Bel-connen, ACT 2616, Australia.
2. Bouchard, D., & Tetreault, S. (2000). The motor development of sighted children and children with moderate low vision age 8-13. Journal of Visual Impairment and Blindness, 94(9), 564-573.
3. Chollet, D., Chalies, S., & Chatard, J. C. (2000). New index of coordination for the crawl: description and usefulness. International Journal of Sports Medicine, 21, 54-59.
4. Colenbrander, A. (2003). Aspects of vision loss – visual functions and functional vision. Visual Impair-ment Research, 5(3), 115-136.
5. Cratty, B. J. (1970). Perceptual and motor development in infants and young children. New York: Macmillan.
6. Craig, A. B., Skehan, P. L., Pawelczyk, J. A., & Boomer, W. L. (1985). Velocity, stroke rate, and dis-tance per stroke during elite swimming competition. Medicine and Science in Sports and Exercise, 17, 625-634.
7. Daly, D. J., Djobova, S. K., Malone, L. A., Vanlandewijck, Y., & Steadward, R. D. (2003). Swimming speed patterns and stroking variables in the Paralympic 100-m freestyle. Adapted Physical Activity Quarterly, 20, 260-278.
8. Daly, D. J., Malone, L. A., Smith, D. J., Vanlandewijck, Y., & Steadward, R. D. (2001). The contribution of starting, turning, and finishing to total race performance in male Paralympic swimmers. Adapted Physical Activity Quarterly, 18, 316-333.
9. Daly, D. J., & Vanlandewijck, Y. (1999). Some criteria for evaluating swimming classification. Adapted Physical Activity Quarterly, 16, 271-289.
10. Gislén, A., Dacke, M., Kröger, R. H. H., Abrahamssen, M., Nilsson, D., & Warrant, E. J. (2003). Supe-rior underwater vision in a human population of sea gypsies. Current Biology, 13, 833-836.
11. Hay, J. G., & Guimares, A. C. S. (1983). A quantitative look at swimming biomechanics. Swimming Technique, 20(2), 11-17.
12. Hopkins, W. G., Hawley, J. A., & Burke, L. M. (1999). Design and analysis of research on sport performance enhancement. Medicine & Science in Sport and Exercise, 31, 472-485.
13. IPC Swimming (2003). Swimming Classification: Eligibility criteria for visually impaired. Retrieved No-vember 15, 2003, from IPC Swimming Web site via Access: http://www.ipcswimming.org.
14. IPC Swimming (2004). Laymans guide to classification. Retrieved November 1, 2004, from IPC Swim-ming Web site via Access: http://www.ipcswimming.org.
15. Kennedy, P., Brown, P., Chengular, S. N., & Nelson, R. C. (1990). Analysis of male and female Olympic swimmers in the 100-m events. International Journal of Sport Biomechanics, 6, 187-197.
16. Letzelter, H., & Freitag, W. (1983). Stroke length and stroke frequency variations in men's and women's 100-m freestyle swimming. In A. P. Hollander, P. A. Huijing, & G. de Groot (Eds.), Biomechanics and Medicine in Swimming (International Series on Sport Sciences, 14, 315-322). Champaign, IL: Human Kinetics.
17. Lieberman, L., & McHugh, H. (2001). Health-related fitness of children who are visually impaired. Jour-nal of Visual Impairment & Blindness, 95, 272-287.
18. Maglischo, E. (2003). Swimming Fastest. Champaign, IL: Human Kinetics. 19. Malone, L. A., Sanders, R. H., Schiltz, J. H., & Steadward, R. D. (2001). Effects of visual impairment on
stroke parameters in Paralympic swimmers. Medicine & Science in Sport and Exercise, 33, 2098-2103. 20. Mason, B. (2001). Putting science into practice. In: D. Hannula & N. Thorton (Eds.). The swim coaching
bible (pp. 111-120). Champaign, Illinois: Human Kinetics Publishers. 21. Navarro, A. S., Fukujima, M. M., Fontes, S. V., de Andres Matas, S. L., & do Prado, G. F. (2004). Bal-
ance and motor coordination are not fully developed in 7 years old blind children. Arq Neuropsiquiatr, 62(3-A), 654-657.
22. Pai, Y. C., Hay, J. G., & Wilson, B. D. (1994). Stroking techniques of elite swimmers. Journal of Sports Sciences, 2(3), 225-239.
23. Pelayo, P., Sidney, M., Moretto, P., Wille, F., & Chollet, D. (1999). Stroking parameters in top level swimmers with a disability. Medicine & Science in Sport and Exercise, 31, 1839-1843.
24. Satkunskiene, D., Schega, L., Kunze, K., Birzinyte, K., & Daly, D. J. (2005). Coordination in arm move-ments during crawl stroke in elite swimmers with a loco-motor disability. Human Movement Science, 24, 54-65.
25. Seifert, L., Boulesteix, L., Carter, M., & Chollet, D. (2004). The Spatial-Temporal and Coordinative Structures in elite Male 100-m Front Crawl Swimmers. Journal of Sports Sciences, 25, 1-8
Is Sight the Main Deterrent to Race Performance in Visually Impaired Competitive Swimmers? 15
26. Sidney, M., Delhaye, B., Baillon, M., & Pelayo, P. (1998). Stroke frequency evolution during 100-m and 200-m events front crawl swimming. In K. L Keskinen, P. V. Komi, & A. P. Hollander (Eds.), Biome-chanics and medicine in swimming VIII (pp. 71-75). Jyväskyla, Finland: University of Jyväskyla.
27. Short, F. X., & Winnick, J. P. (1988). Adolecent physical fitness: A comparative study. Journal of Visual Impairment & Blindness, 82, 237-238.
28. Swaine, I. L., & Winter, E. M. (1999). Comparison of cardiopulmonary responses to two types of dry-land upper-body exercise testing modes in competitive swimmers. European Journal of Applied Physiol-ogy, 80, 588-590.
29. Van Handel, P. J., Katz, A., Morrow, J. R., Troup, J. P., Daniels, J. T., & Bradley, P. W. (1988). Aerobic economy and competitive swimming performance of U.S. elite swimmers. In: B.E. Ungerechts, K. Wilke, K. Reischle (Eds.). Swimming Science V (pp. 219-227). Champaign; Illinois: Human Kinetics Publishers.
30. Van Tilborgh, L., Daly, D. J., Vervaecke, H., Persyn, U. (1984). The evolution of some crawl performance determinant factors in women competitive swimmers. In: J. Borms, R. Hauspie, A. Sand, C. Suzzanne, M. Hebbelinck (Eds.). Human growth and development (pp. 666-676). New York: Plenum Press.
31. Warren, W. H., Kay, B. A., Duchon, A. P., Zosh, W., Sahuc, S. (2001). Optic flow is used to control human walking. Nature Neuroscience, 4, 213-216.
32. World Health Organisation (2004). Magnitude and cause of visual impairment: Fact Sheet N°282. Retrieved October 15, 2004, from WHO Web site via Access: http://www.who.int/mediacentre/factsheets/fs282/en/.
DA LI JE VID GLAVNI SPREČAVAJUĆI FAKTOR KOD IZVOĐENJA TRKA TAKMIČARSKIH PLIVAČA
KOJI IMAJU OŠTEĆENJE VIDA
Daniel Daly, Laurie A. Malone, Brendan Burkett, Tomas Gabrys, Danguole Satkunskiene
Analiza video trke je sprovedena u Sidneju 2000 na Olimpijskim i Paralimpijskim igarama na 100-metara slobodnog stila za tri klase koji imaju oštećenje vida (S11, S12 & S13) kod muškaraca i kod žena. Dodatne informacije su dostupne u malim pod-uzorcima za neke fiziološke i biomehaničke parametre. Svi plivači sa oštećenjem vida su koristili brzinske obrasce slične olimpijskim plivačima. Ovi plivači nisu trošili mnogo vremena na početku trke ili pri okretima. S11 klasa sa najvećim oštećenjima su plivali najsporije i bili su najmanje konkurentni. Klase S12 i S13 se nisu razlikovale. Obrasci trke brzine poteza i dužine poteza kod onih sa oštećenim vidom su takođe upoređivani sa Olimpijskim plivačima iako su vrednosti apsolutne dužine poteza bile različite. Elitni plivači sa oštećenjem vida su postigli visoke nivoe laktata posle trke, i koriste koordinaciju ruku koja odgovara elitnim plivačima sa jakim telima. Aerobički kapaciteti mogu, ipak biti niski. Stepen oštećenja vida izgleda da nije glavni faktor isticanja u performansama trka.
Ključne reči: analiza trka, slobodan stil, sportovi sa invaliditetom, paralimpičari, olimpijada