Embed Size (px)
Citation preview
IS SHOPPING AT WALMART AN INFERIOR GOOD? EVIDENCE FROM 1997-2010
Mandie R.Weinandt
and
Michael A. Allgrunn*
* Mandie R. Weinandt: Instructor, University of South Dakota, Vermillion, SD 57069. Phone 1-605-677-5690, Fax
1-605-677-5058, E-mail: [email protected]
Michael A. Allgrunn: Associate Professor, University of South Dakota, Vermillion, SD 57069. Phone 1-605-677-
8834, Fax 1-605-677-5058, E-mail: [email protected]
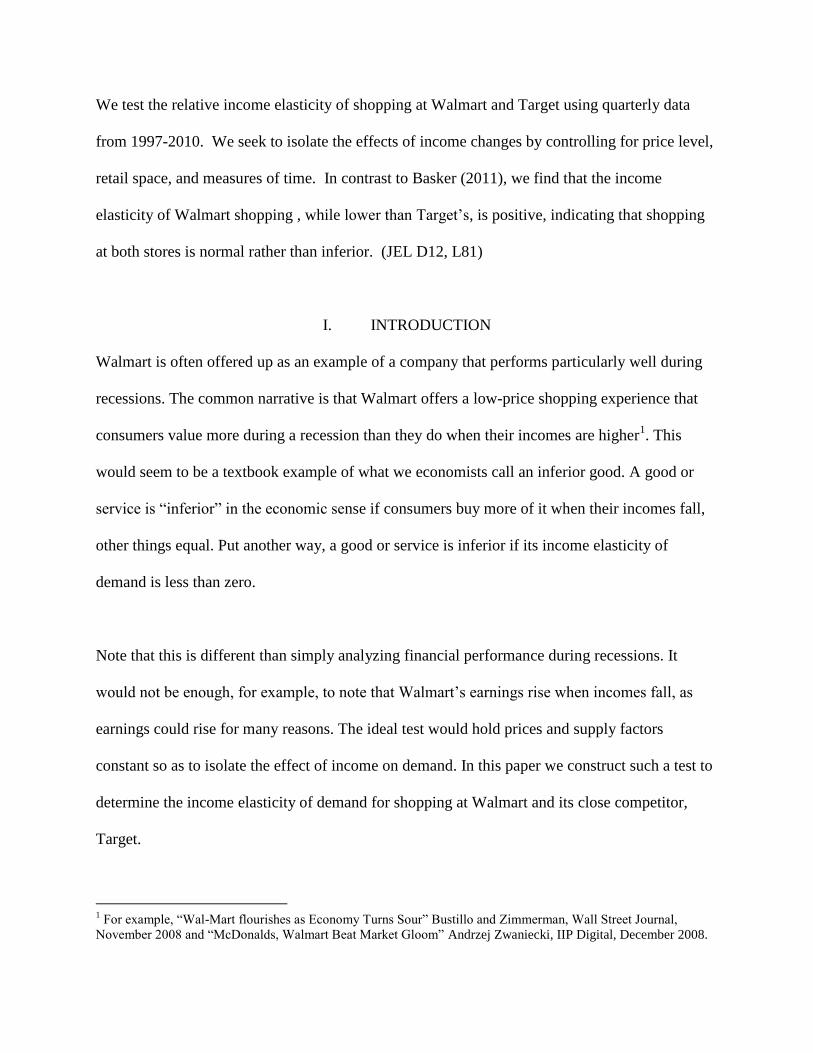
We test the relative income elasticity of shopping at Walmart and Target using quarterly data
from 1997-2010. We seek to isolate the effects of income changes by controlling for price level,
retail space, and measures of time. In contrast to Basker (2011), we find that the income
elasticity of Walmart shopping , while lower than Target’s, is positive, indicating that shopping
at both stores is normal rather than inferior. (JEL D12, L81)
I. INTRODUCTION
Walmart is often offered up as an example of a company that performs particularly well during
recessions. The common narrative is that Walmart offers a low-price shopping experience that
consumers value more during a recession than they do when their incomes are higher1. This
would seem to be a textbook example of what we economists call an inferior good. A good or
service is “inferior” in the economic sense if consumers buy more of it when their incomes fall,
other things equal. Put another way, a good or service is inferior if its income elasticity of
demand is less than zero.
Note that this is different than simply analyzing financial performance during recessions. It
would not be enough, for example, to note that Walmart’s earnings rise when incomes fall, as
earnings could rise for many reasons. The ideal test would hold prices and supply factors
constant so as to isolate the effect of income on demand. In this paper we construct such a test to
determine the income elasticity of demand for shopping at Walmart and its close competitor,
Target.
1 For example, “Wal-Mart flourishes as Economy Turns Sour” Bustillo and Zimmerman, Wall Street Journal,
November 2008 and “McDonalds, Walmart Beat Market Gloom” Andrzej Zwaniecki, IIP Digital, December 2008.
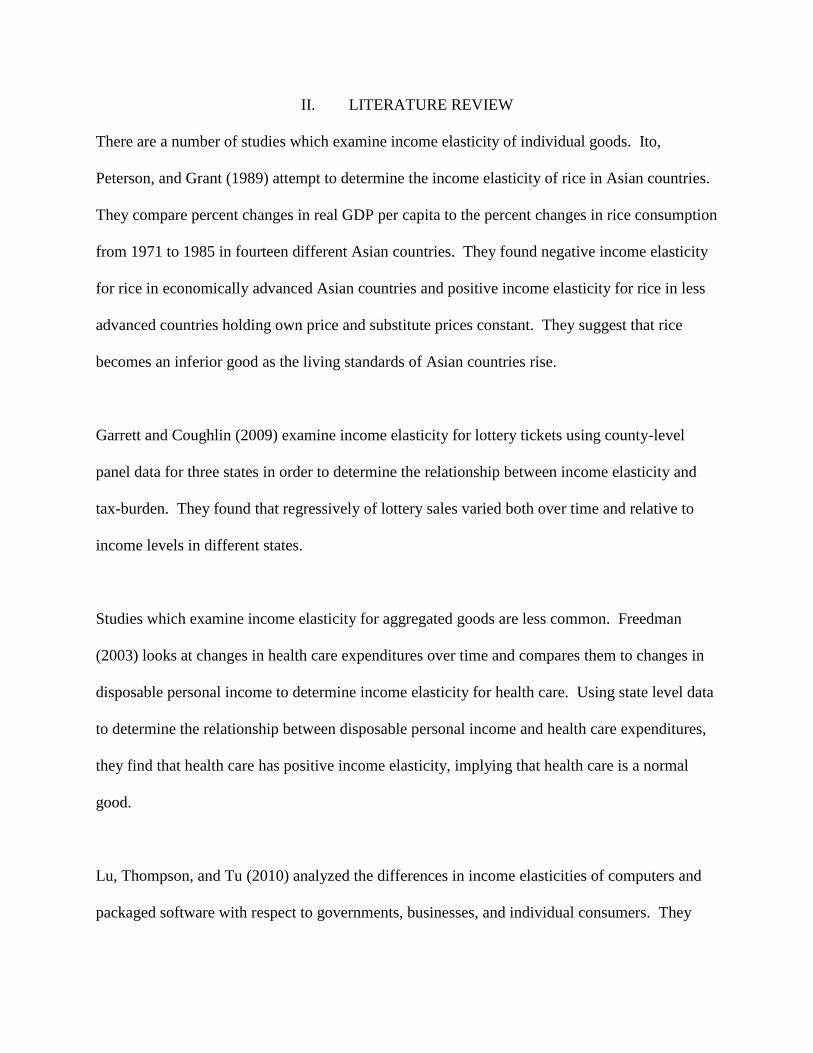
II. LITERATURE REVIEW
There are a number of studies which examine income elasticity of individual goods. Ito,
Peterson, and Grant (1989) attempt to determine the income elasticity of rice in Asian countries.
They compare percent changes in real GDP per capita to the percent changes in rice consumption
from 1971 to 1985 in fourteen different Asian countries. They found negative income elasticity
for rice in economically advanced Asian countries and positive income elasticity for rice in less
advanced countries holding own price and substitute prices constant. They suggest that rice
becomes an inferior good as the living standards of Asian countries rise.
Garrett and Coughlin (2009) examine income elasticity for lottery tickets using county-level
panel data for three states in order to determine the relationship between income elasticity and
tax-burden. They found that regressively of lottery sales varied both over time and relative to
income levels in different states.
Studies which examine income elasticity for aggregated goods are less common. Freedman
(2003) looks at changes in health care expenditures over time and compares them to changes in
disposable personal income to determine income elasticity for health care. Using state level data
to determine the relationship between disposable personal income and health care expenditures,
they find that health care has positive income elasticity, implying that health care is a normal
good.
Lu, Thompson, and Tu (2010) analyzed the differences in income elasticities of computers and
packaged software with respect to governments, businesses, and individual consumers. They
found that computers and packaged software were inferior goods to government agencies,
necessary goods for firms, and luxury goods to households.
Our study has much in common with Basker (2011), who also sought to compare income
elasticity for Walmart and Target. Using data from 1997-2006, Basker used the natural log of
the real aggregate wage income as reported by QCEW and the natural log of real quarterly
revenues per store for Target and Walmart as the measure of changes in consumption.
We perform a similar test to estimate the income elasticities for shopping at Walmart and Target
with several differences. First, we have identified the need to control for changes in the relative
sizes of each the stores. Without this control, expansions of retail space due to building larger
stores during a recession could be mistaken for income inferiority. For example, Walmart and
Target have both introduced superstore versions of their previous retail outlets. If a regular store
is converted to a supercenter, the number of stores does not change but retail space increases.
Second, we exclude revenues from store credit cards from Target’s quarterly revenue data, as
they are not part of purchases, but rather are the proceeds from interest charges and fees. Finally,
we extend the timeframe of the study to include the most recent recession.
III. DATA AND METHODOLOGY
We use quarterly sales revenue data from the first quarter of 1997 through the first quarter of
2010, giving us 53 quarters of data for both companies. Since Walmart and Target sell a variety
of goods, quantity demanded cannot be defined in the typical way as the number of units
purchased. Instead, we use real quarterly revenues, measured in 2010 dollars. Since sales could
increase (decrease) due to an increase (decrease) in either the number or size of stores, we use
the percentage change in revenue per square foot. This way, we are measuring the effect of
changes in consumer demand rather than changes in the scale of the company. All information
about Walmart at Target’s revenues and square footage2 was taken from their quarterly and
annual filings with the Securities and Exchange Commission.
We use two different measures of income: the percentage change in quarterly real GDP per
capita; and disposable income per capita, both from the Bureau of Economic Analysis. We also
include a regression using QCEW to recreate Basker’s work3. To obtain the ceteris paribus
effect of income, we also include several controls. The inclusion quarterly indicators to account
for retail sales patterns is straightforward. Controlling for price, however, is not, as both
Walmart and Target sell a wide variety of goods and services with presumably autonomous price
changes. Since we are looking at goods and services in aggregate, we use the Consumer Price
Index (Bureau of Labor Statistics) to adjust all dollar figures for inflation. We also include a
time trend control. Table 1 provides summary statistics for each of these variables.
2 Prior to 2004, Walmart did not report their square footage on a quarterly basis but only on an annual basis. They
did however; report their stores by store type quarterly. To obtain square footage estimates an average square
footage by store type for each year was applied to the number of stores in each quarter missing square footage data.
For example, in January 2003, Walmart had 1,258 Supercenters with an average of 186,495.23 square feet. This
average was multiplied by the number of Supercenters in the three preceding quarters to obtain the number of total
square feet in Supercenters for that quarter. The same was done with regular Discount Centers and Walmart’s, more
recent, Neighborhood Markets to obtain a total count on Walmart’s square feet per quarter prior to 2004 when actual
data was available by quarter. When applying this methodology to quarters with actual square foot data, we find
that the difference between the simulated square foot information and actual square foot information does not
exceed 2%. Target reports actual information quarterly. 3 The authors would like to thank Basker for providing her original data and do-file.
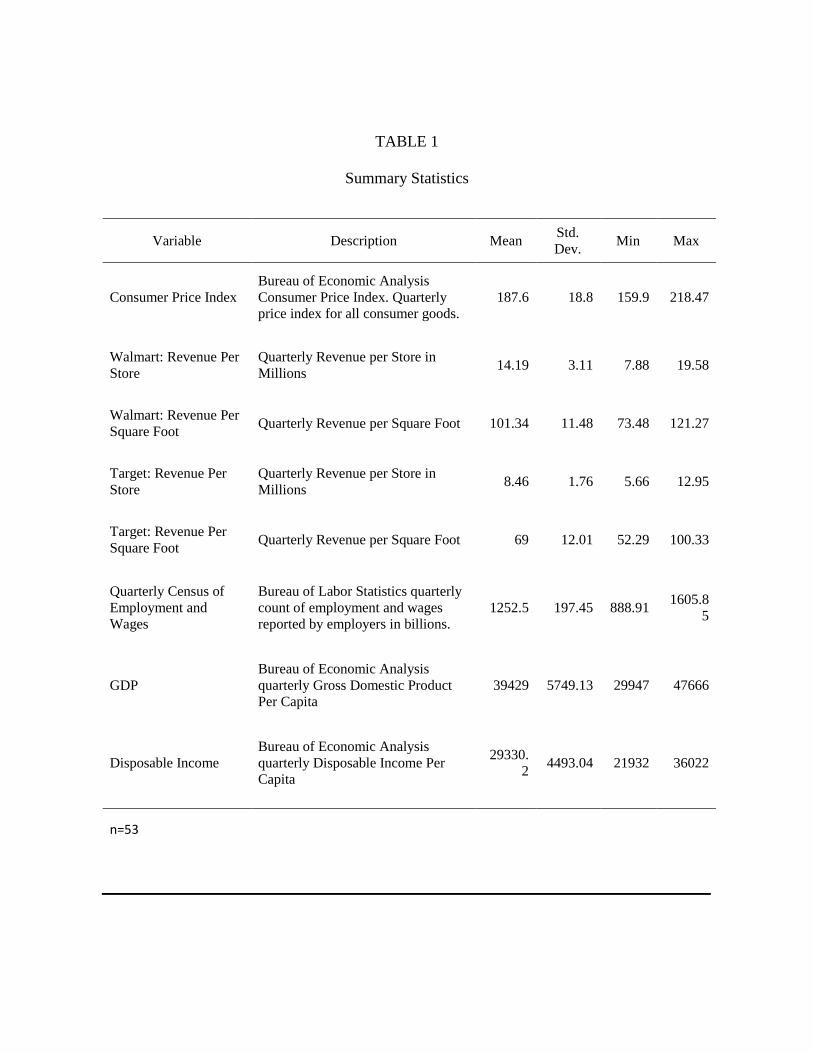
TABLE 1
Summary Statistics
Table 1. Summary Statistics
Variable Description Mean Std.
Dev. Min Max
Consumer Price Index
Bureau of Economic Analysis
Consumer Price Index. Quarterly
price index for all consumer goods.
187.6 18.8 159.9 218.47
Walmart: Revenue Per
Store
Quarterly Revenue per Store in
Millions 14.19 3.11 7.88 19.58
Walmart: Revenue Per
Square Foot Quarterly Revenue per Square Foot 101.34 11.48 73.48 121.27
Target: Revenue Per
Store
Quarterly Revenue per Store in
Millions 8.46 1.76 5.66 12.95
Target: Revenue Per
Square Foot Quarterly Revenue per Square Foot 69 12.01 52.29 100.33
Quarterly Census of
Employment and
Wages
Bureau of Labor Statistics quarterly
count of employment and wages
reported by employers in billions.
1252.5 197.45 888.91 1605.8
5
GDP
Bureau of Economic Analysis
quarterly Gross Domestic Product
Per Capita
39429 5749.13 29947 47666
Disposable Income
Bureau of Economic Analysis
quarterly Disposable Income Per
Capita
29330.
2 4493.04 21932 36022
n=53
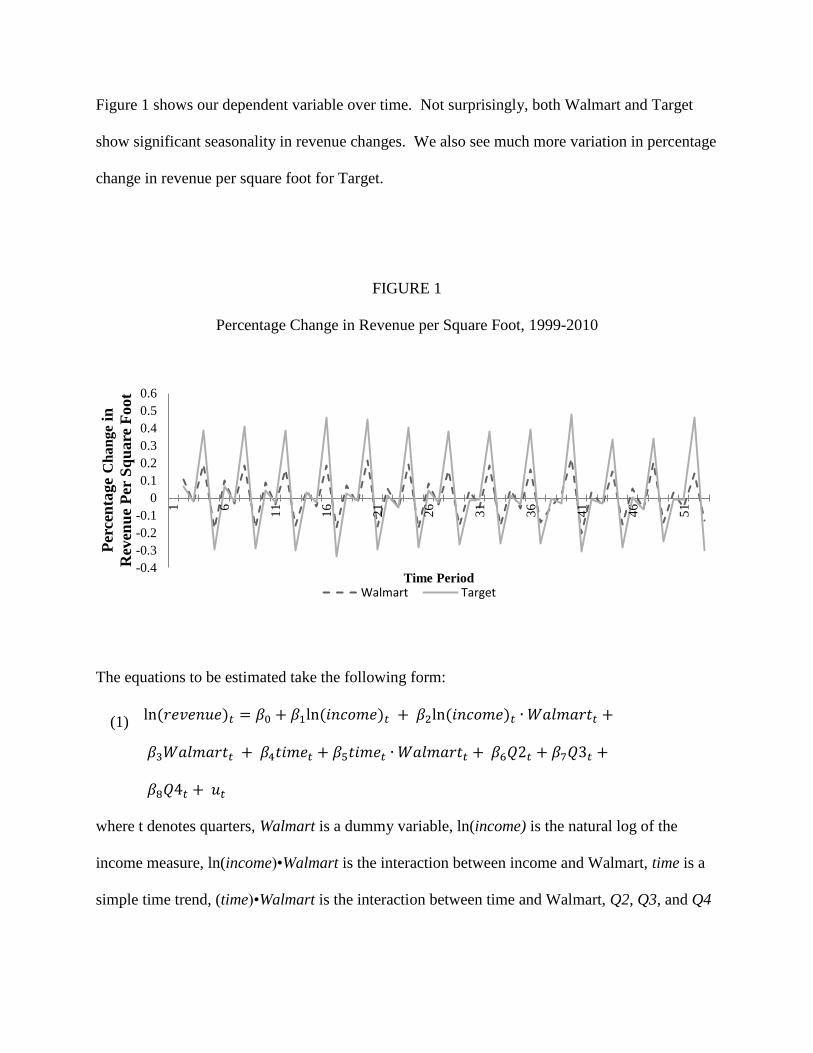
Figure 1 shows our dependent variable over time. Not surprisingly, both Walmart and Target
show significant seasonality in revenue changes. We also see much more variation in percentage
change in revenue per square foot for Target.
FIGURE 1
Percentage Change in Revenue per Square Foot, 1999-2010
The equations to be estimated take the following form:
where t denotes quarters, Walmart is a dummy variable, ln(income) is the natural log of the
income measure, ln(income)•Walmart is the interaction between income and Walmart, time is a
simple time trend, (time)•Walmart is the interaction between time and Walmart, Q2, Q3, and Q4
-0.4
-0.3
-0.2
-0.1
0
0.1
0.2
0.3
0.4
0.5
0.6
1 6
11
16
21
26
31
36
41
46
51
Per
cen
tage
Ch
an
ge
in
Rev
enu
e P
er S
qu
are
Foot
Time Period Walmart Target
(1)
are quarter indicators, and u is the error term. The parameters of interest are β1 and β2 which,
combined, are our estimate of the demand elasticity for the retailer over our sample period.
IV. RESULTS
The results of our estimations using the 1997-2006 data are shown in Table 2 displays the results
of ordinary least squares regression of equation (1). The five specifications include different
combinations of revenue and income. Specifications (1) – (3) use Basker’s definition of
Revenue (log of real revenue per store) as the dependent variable; (4) and (5) use the log of real
revenue per square foot. Specification (1) uses the aggregate quarterly wage as the income
measure, while (2) and (4) use disposable income per capita, and (3) and (5) use GDP per capita.
Walmart’s income elasticity of demand during this period is consistently lower than or equal to
Target’s, but it is not consistently negative. Walmart income elasticity is statistically lower than
Target in the models using GDP per capita [Specifications (3) and (5)] and the aggregate
quarterly wages (in dollars) data from QCEW [Specification (1)]. It is not significantly different
from Target in the two specifications using disposable income per capita [Specifications (2) and
(4)], and Walmart is a normal good in both of these regressions.
The finding that Walmart is an inferior good during this time period is not robust to changes in
the measure of income. There does not appear to be substantial change from correctly omitting
credit card revenue, nor from using revenue per square foot instead of revenue per store. Target
is consistently found to be a normal good, though the magnitude is rather variable, ranging from
.892 to 2.067.
Table 3 shows the same five models found in Table 2, but includes the data from Q1 1997 to Q1
2010. With the inclusion of this extra data, Walmart is a normal good in all specifications
(between 0.337 and 1.855), and is statistically significant. Target remains a normal good, with
estimated elasticities between 1.328 and 2.241. Walmart is generally less elastic than Target,
though the difference is only statistically significant in models (1) and (5).
Specification (4) is our preferred model. This is not based on any particular statistical test, but
simply because we think that disposable income per capita is the most appropriate income
measure, and that revenues per square foot is the most appropriate dependent variable. This
model suggests that Walmart is a normal good over the 1997-2010 period with an elasticity of
1.855. Admittedly, this is the highest of our estimates, but nonetheless we feel it is the most
defensible specification. This same model also finds that Walmart was considered by consumers
to be a normal good, during the 1997-2006 period, with income elasticity equal to 0.919.
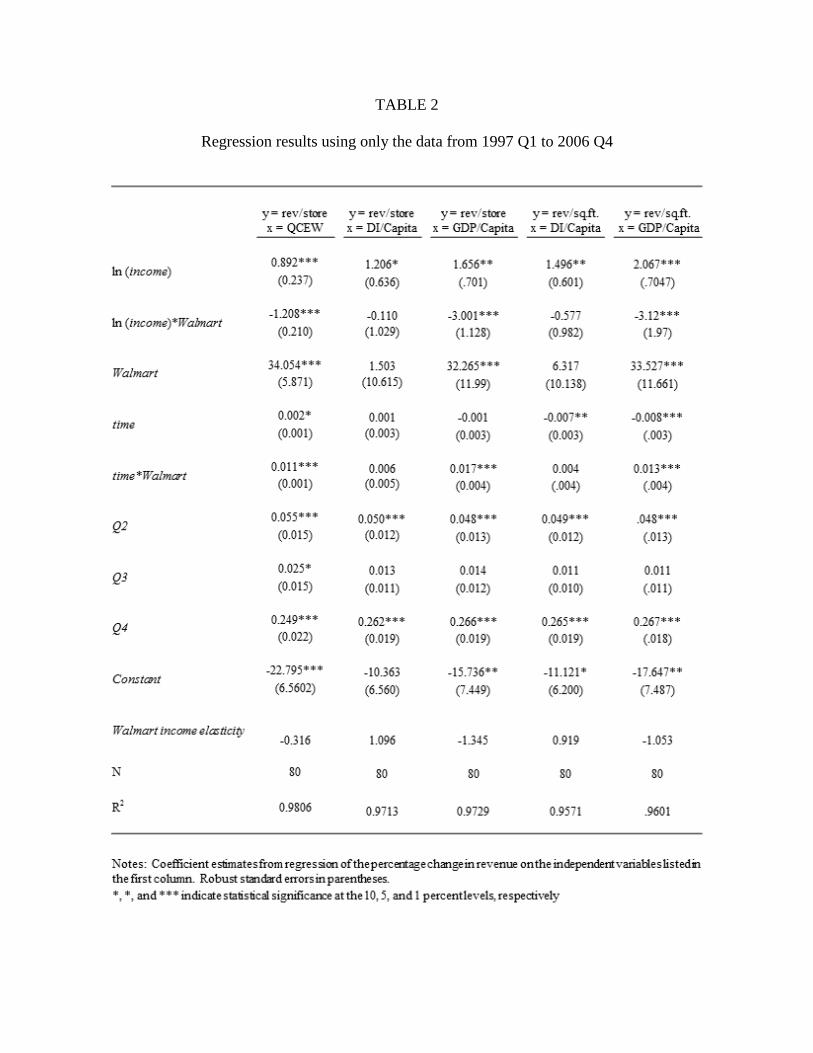
TABLE 2
Regression results using only the data from 1997 Q1 to 2006 Q4
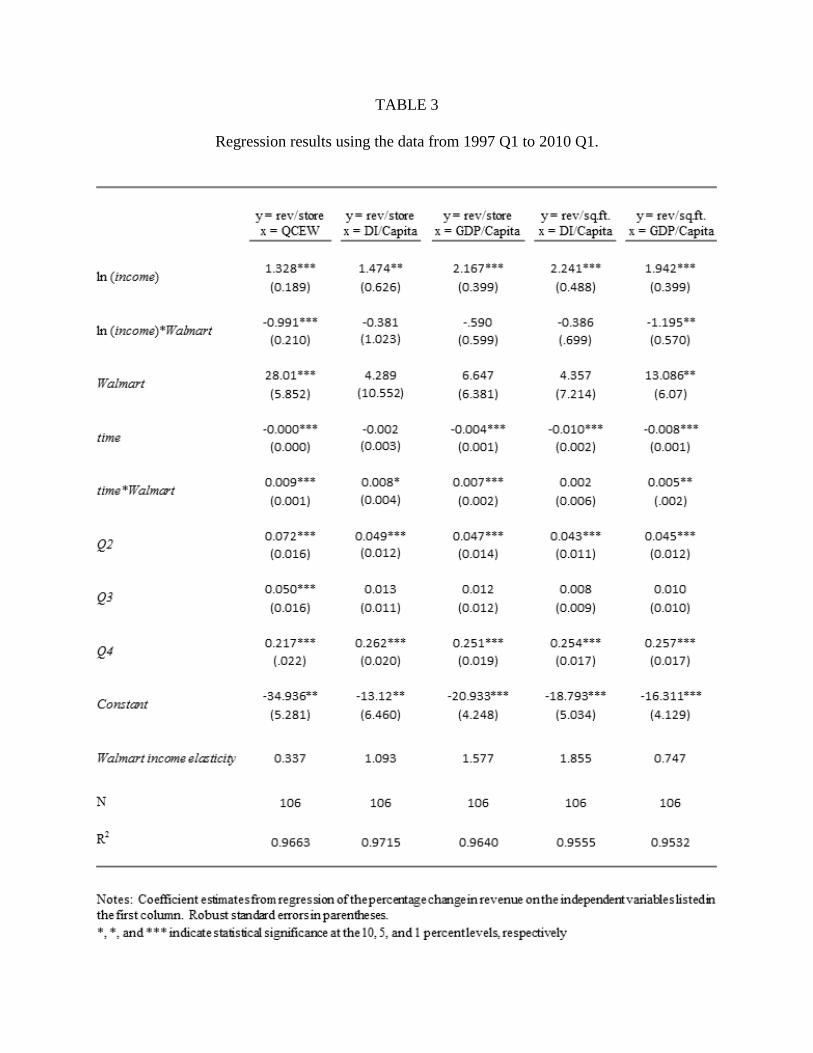
TABLE 3
Regression results using the data from 1997 Q1 to 2010 Q1.
V. CONCLUSIONS
The idea that Walmart is “recession-proof,” as touted in mainstream media during the recent
recession, does not hold in our findings as Walmart has a positive income elasticity of demand.
Our findings did, however, convince us that Walmart is recession proof in relative terms.
Target’s revenues are more sensitive to changes in income levels than Walmart’s as
demonstrated by the income elasiticities found here. In fact, our findings indicated shopping at
Target is a luxury while shopping at Walmart is closer to a necessity. This was not overly
surprising given the image and branding both Walmart and Target strive to uphold; however, it
was very interesting to prove these strategies appear to be effective. Walmart’s strategy is very
beneficial in recessionary times as they experience relatively less negative effect on revenues.
The downside of this is that Walmart’s revenues will not benefit as much from economic booms.
Target’s revenues, on the other hand, will suffer relatively more during recessionary times but
will also profit from economic expansions relatively more than their relatively “inferior”
competition.
REFERENCES
Basker, E. “Does Wal-Mart Sell Inferior Goods?.” Economic Inquiry, 49(4), 2011, 973-981.
Bustillo, M., and A. Zimmerman (2008, November 14). Wal-Mart Flourishes as Economy Turns
Sour. Wall Street Journal. Retrieved from
http://online.wsj.com/article/SB122656558027724083.html#printMode.
Freeman, D. G. “Is Healthcare a Necessity of a Luxury? Pooled Estimates of Income Elasticity
from US State-level Data,” Applied Economics, 35(5), 2003, 495-502.
Garrett, T. & C. Coughlin. “Inter-temporal Differences in the Income Elasticity of Demand for
Lottery Tickets.” National Tax Journal, LXII(1), 2009, 77-99.
Ito, S., et al. "Rice in Asia: Is It Becoming an Inferior Good?" American Journal of Agricultural
Economics 71(1), 1989, 32-42.
Lu, M., S. Thompson, Y. Tu. “Computers and Packaged Software: Necessary or Luxury Goods?
Longitudinate Emperical Analysis and Its Implications.” Journal of Business &
Economic Studies, 16(2), 2010, 32-48.
“Quarterly and Annual Financial Reports.” Target Corporation: Investors. Various Dates,
http://investors.target.com/phoenix.zhtml?c=65828&p=irol-sec.
“Quarterly and annual Financial Reports.” Walmart Stores: Investors. Various Dates,
http://Walmartstores.com/Investors/.
Roy, S. "Are Illegal Drugs Inferior Goods in the US?." Atlantic Economic Journal 35(3), 2007,
303-314.
United States. Department of Commerce. Bureau of Economic Analysis. “Table 7.1: Selected Per
Capita Product and Income Series in Current and Chained (2000) Dollars,”
http://www.bea.gov.
Zwaniecki, A. (2008, December 18). McDonald’s, Walmart Beat Recession, Market Gloom. IIP
Digital. Retrieved from
http://iipdigital.usembassy.gov/st/english/article/2008/12/20081217143125saikceinawz0.
2068903.html#axzz2GHyWMS8I