Embed Size (px)
Citation preview

Is Segregation Bad for Your Health? The Case of Low Birth WeightComments
Ellen, Ingrid Gould, 1965-
Brookings-Wharton Papers on Urban Affairs, 2000, pp. 203-229 (Article)
Published by Brookings Institution PressDOI: 10.1353/urb.2000.0002
For additional information about this article
Access Provided by New York University at 03/08/11 9:53PM GMT
http://muse.jhu.edu/journals/urb/summary/v2000/2000.1ellen.html

Is Segregation Bad for Your Health? The Case of Low Birth Weight
This paper explores the relationship between racial segregation and racialdisparities in the prevalence of low birth weight. The paper has two parallelmotivations. First, the disparities between black and white mothers in birthoutcomes are large and persistent. In 1996, 13 percent of infants born in theUnited States to black mothers weighed less than 2,500 grams (5.5 pounds,or low birth weight), compared with just 6.3 percent of all infants born to whitemothers. And the consequences may be grave. Low birth weight is a majorcause of infant mortality and is associated with greater childhood illness andsuch developmental disorders as cerebral palsy, deafness, blindness, epilepsy,chronic lung disease, learning disabilities, and attention deficit disorder.1 Giventhe strong connection between race and residence in this country, it seemsplausible that residential location may shape these differentials.
Second, while there is a growing literature on the costs of racial segrega-tion, it has largely focused on economic outcomes such as education andemployment. This paper aims to develop a fuller understanding of the costsof racial segregation by considering birth outcomes as well as such behaviorsas tobacco and alcohol use among pregnant mothers. As Glaeser emphasizes(in his paper in this volume), information, ideas, and values are often trans-mitted through face-to-face interaction, and thus their transmission may be
203
I N G R I D G O U L D E L L E NWagner School of Public Service, New York University
The author is grateful to Amy Ellen Schwartz, Mark Schlesinger, Karl Kronebusch, KathyO’Regan, George Galster, Tod Mijanovich, Jeffrey Milyo, and Dalton Conley for their insights;to participants at the first annual meeting of the Brookings-Wharton Conference on UrbanAffairs; and especially to David Cutler, William Dickens, Janet Rothenberg Pack, and WilliamGale for providing excellent comments. This work was undertaken while the author was a RobertWood Johnson Health Policy Scholar at Yale University.
1. Paneth (1995).
*gould ellen 6/14/00 11:24 AM Page 203

blocked by segregation. This includes information related to job openings andmay include information and norms related to behavior and care during preg-nancy.
Adopting in large part the methodology of David Cutler and Edward L.Glaeser, the paper thus examines how levels of racial segregation affect thebirth outcomes of black mothers.2 It examines influences on both black andnonblack mothers in an attempt to identify the differential effect of segrega-tion on black mothers.
Theory and Past Literature
This section summarizes what is known about the costs of segregation fromprior research, discusses several alternative pathways through which segre-gation may influence outcomes, and reviews previous literature on the causesof low birth weight. Given this understanding, the section then explores howsegregation might contribute to the lower birth weights of infants born to blackmothers.
Costs of Racial Segregation
There is a growing body of work demonstrating a negative correlationbetween the degree of racial segregation in a metropolitan area and the eco-nomic success of its African American population.3 Parallel to this work is agrowing literature suggesting a link between racial segregation and the healthof African Americans. In more segregated neighborhoods and metropolitanareas, African Americans have been found to suffer higher rates of homicide,suicide, infant mortality, and overall age-adjusted mortality.4
While these correlations are striking both in magnitude and significance,determining the direction of causality is naturally more difficult. It may bethat greater disparities in economic status lead to greater residential segrega-tion and not the reverse. And the link between segregation and health outcomes
204 Brookings-Wharton Papers on Urban Affairs: 2000
2. Cutler and Glaeser (1997).3. Galster (1987); Galster (1991); O’Regan and Quigley (1996); Cutler and Glaeser (1997).4. Yankauer (1950); Polednak (1991); Potter (1991); LaVeist (1992); Krivo and Peterson
(1993); LaVeist (1993); Shihadeh and Flynn (1996); LeClere, Rogers, and Peters (1997); Poled-nak (1997); Almgren and others (1998); Guest, Almgren, and Hussey (1998); Burr, Hartman,and Matteson (1999); Collins and Williams (1999).
*gould ellen 6/14/00 11:24 AM Page 204
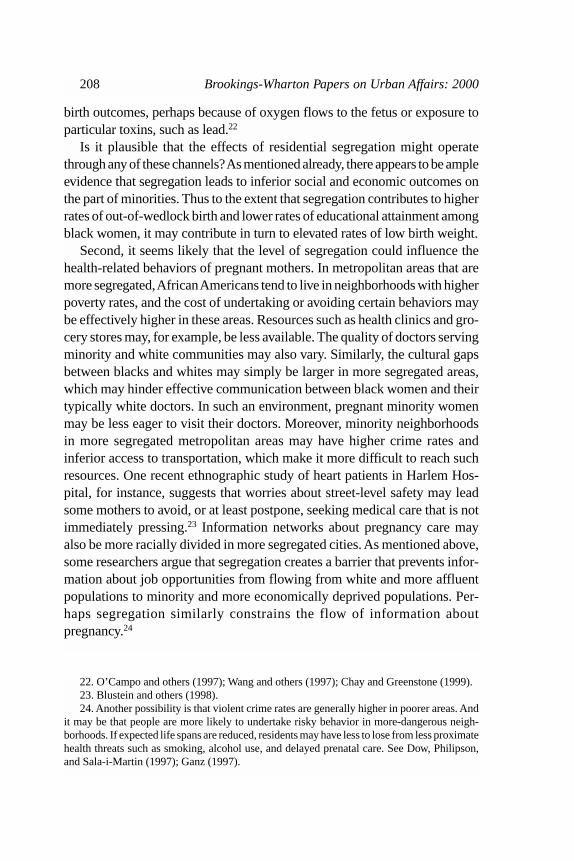
may simply reveal that blacks who are more economically disadvantaged tendboth to be at greater risk of poor health outcomes and to live in more segre-gated areas.
Despite this ambiguity, researchers considering health outcomes and seg-regation have paid scant attention to the issue of causality. They tend to relystrictly on aggregate, cross-sectional correlations, and thus it is difficult to inter-pret their results. The researchers concentrating on employment and educationhave focused a great deal more on causality and have made substantial strides.5
Cutler and Glaeser make the most thorough attempt to discern causality.6
First, they study cross–metropolitan area differences in segregation. Manyprior studies examining the effects of segregation have focused on a particu-lar city or metropolitan area and compared the outcomes of blacks living inneighborhoods of varying racial compositions.7 This approach may overstatethe effects of segregation, however, since the more successful blacks maymigrate to the more integrated neighborhoods. This approach may also leadone to understate the effects of segregation, since the degree of segregation ina metropolitan area may influence all minorities living there, even those liv-ing in largely white communities.8
When measuring segregation at the metropolitan level, such mobility con-cerns are naturally reduced. Moreover, Cutler and Glaeser focus on youth, forwhom mobility should be less of a problem, and also examine the effects ofsegregation in the city of residence five years earlier.9 Finally, to ensure thattheir measure of segregation is exogenous, Cutler and Glaeser use two dif-ferent sets of variables to instrument for segregation across cities. In all cases,and with two different data sets, their results point to the same conclusion:segregation leads to poor outcomes for minorities and not the reverse.
Through What Channels Does Segregation Influence Outcomes?
Although the empirical evidence indicates that racial segregation reducesthe educational attainment, wages, and likelihood of marriage among blacks,there is little evidence about which of several mechanisms is central. Pastresearchers have speculated about the ways in which segregation may under-
Ingrid Gould Ellen 205
5. Galster (1987); O’Regan and Quigley (1996); Cutler and Glaeser (1997).6. Cutler and Glaeser (1997).7. Yankauer (1950); Holzer (1991); Borjas (1995); Krivo and Peterson (1996); LeClere,
Rogers, and Peters (1997); Almgren and others (1998); Guest, Almgren, and Hussey (1998).8. Ellwood (1986); Cutler and Glaeser (1997).9. Cutler and Glaeser (1997).
*gould ellen 6/14/00 11:24 AM Page 205

mine the economic achievement of minorities. As John Kain first noted, seg-regation may result in a “spatial mismatch” between where blacks live andwhere the vast majority of appropriate job opportunities exist.10 KatherineO’Regan and John Quigley instead stress the social isolation produced by seg-regation: the harm of segregation is that it creates a barrier that preventsinformation about job opportunities from flowing from white and more afflu-ent populations to black and more economically deprived populations.11
Douglas S. Massey and Nancy Denton, meanwhile, argue that because ofhigher poverty rates among blacks, racial segregation means that blacks livein neighborhoods with higher poverty.12 And as a growing literature suggests,neighborhoods with higher poverty may have powerful negative effects on thesocial and economic outcomes of residents, due perhaps to peer effects or socialnetworks.13 Others have emphasized the role of differential public services,while still others have emphasized the role that residential segregation mayplay in fueling, or at least maintaining, racial prejudice.14
Segregation might also benefit minorities. For example, it may providegreater political power, as well as improved services, to minority communi-ties as a result. Racial segregation may also mean that black mothers live incommunities where they enjoy stronger social networks and support.15
Birth Outcomes
The causes of low birth weight are surprisingly poorly understood.16 Somemedical risk factors are known—most important are the age and weight of themother, and certain preexisting medical conditions. These are unlikely to be
206 Brookings-Wharton Papers on Urban Affairs: 2000
10. Kain (1968).11. O’Regan and Quigley (1996).12. Massey and Denton (1993). Jargowsky (1997) finds that a one-standard-deviation
increase in the level of segregation increases the average neighborhood poverty rate experi-enced by blacks by about one-fifth of a standard deviation.
13. For review, see Ellen and Turner (1997).14. Galster (1991); Yinger (1995). One possible cause of differential services is discrimi-
nation on the part of public or private actors. Another possibility is that raised by Cutler,Elmendorf, and Zeckhauser (1993), who hypothesize that individuals may favor redistributiononly to those living in their immediate area. If this is true, then separation of the races mayresult in less desire among whites to direct spending toward blacks.
15. Stack (1974).16. Low birth weight is caused either by preterm delivery or by intrauterine growth retar-
dation. Although it would be interesting to study preterm delivery and fetal growth retardationseparately, data on gestational age are not very reliable, so the focus here is on birth weight. Ingeneral, the best evidence suggests that most of the racial disparity in the risk of low birthweight is driven by differences in preterm delivery. See Paneth (1995).
*gould ellen 6/14/00 11:24 AM Page 206

greatly shaped by the urban environment.17 However, there are other knownrisk factors that are likely to be much more vulnerable to environmental threats.I group these into four categories of observed variables: socioeconomic sta-tus; behavior during pregnancy; stress; and exposure to various toxins.
In terms of socioeconomic status, numerous studies have shown that womenwith less education are far more likely to give birth to low-weight infants.18
There is less consensus as to why this is the case. Less-educated women havelower incomes and are therefore less able to afford good pregnancy care.Alternatively, less-educated women may have inferior information about preg-nancy care. Finally, the day-to-day stress of being poor may play a role aswell. As will be discussed further below, there is some evidence that such stressleads to inferior birth outcomes.
Marital status is also strongly correlated with poor birth outcomes, perhapsbecause it too is a proxy for income. But marital status may also reflect socialisolation. Prospective studies, which control for baseline health status, con-sistently show worse health outcomes for people with fewer socialrelationships.19 Finally, marriage may be correlated with more desired, or atleast more expected, pregnancies.
The second set of factors linked to poor birth outcomes are those relatingto health-related behavior during pregnancy. These include tobacco use, alco-hol use, drug use, nutrition, and the utilization of prenatal care. With varyingdegrees of certainty, all of these behaviors have been linked to poor birth out-comes.
The third factor related to poor birth outcomes is stress. Although the impactof stress on physical health is still poorly understood, there is growing evi-dence that psychological stress may place a toll over time on the body’simmune system.20 And there is at least some evidence that stress may specif-ically increase the risk of low birth weight and preterm delivery, and may doso independently of any influences on health-related behaviors.21 Finally, thereis some evidence that certain environmental conditions may contribute to poor
Ingrid Gould Ellen 207
17. Although the age of the mother is potentially influenced by social conditions, the effectsof age on birth weight appear to be nonlinear, and age only seems to matter once a mother getsbeyond thirty or thirty-five years old. It seems less plausible that social norms will influencewhether a mother chooses to have a baby after age thirty-five.
18. Rowley and others (1993).19. House, Landis, and Umberson (1988).20. Geronimus (1992).21. McAnarney and Stevens (1990); Rowley and others (1993); Hoffman and Hatch (1996).
*gould ellen 6/14/00 11:24 AM Page 207
birth outcomes, perhaps because of oxygen flows to the fetus or exposure toparticular toxins, such as lead.22
Is it plausible that the effects of residential segregation might operatethrough any of these channels? As mentioned already, there appears to be ampleevidence that segregation leads to inferior social and economic outcomes onthe part of minorities. Thus to the extent that segregation contributes to higherrates of out-of-wedlock birth and lower rates of educational attainment amongblack women, it may contribute in turn to elevated rates of low birth weight.
Second, it seems likely that the level of segregation could influence thehealth-related behaviors of pregnant mothers. In metropolitan areas that aremore segregated,African Americans tend to live in neighborhoods with higherpoverty rates, and the cost of undertaking or avoiding certain behaviors maybe effectively higher in these areas. Resources such as health clinics and gro-cery stores may, for example, be less available. The quality of doctors servingminority and white communities may also vary. Similarly, the cultural gapsbetween blacks and whites may simply be larger in more segregated areas,which may hinder effective communication between black women and theirtypically white doctors. In such an environment, pregnant minority womenmay be less eager to visit their doctors. Moreover, minority neighborhoodsin more segregated metropolitan areas may have higher crime rates and inferior access to transportation, which make it more difficult to reach suchresources. One recent ethnographic study of heart patients in Harlem Hos-pital, for instance, suggests that worries about street-level safety may leadsome mothers to avoid, or at least postpone, seeking medical care that is notimmediately pressing.23 Information networks about pregnancy care mayalso be more racially divided in more segregated cities. As mentioned above,some researchers argue that segregation creates a barrier that prevents infor-mation about job opportunities from flowing from white and more affluentpopulations to minority and more economically deprived populations. Per-haps segregation similarly constrains the flow of information aboutpregnancy.24
208 Brookings-Wharton Papers on Urban Affairs: 2000
22. O’Campo and others (1997); Wang and others (1997); Chay and Greenstone (1999).23. Blustein and others (1998).24. Another possibility is that violent crime rates are generally higher in poorer areas. And
it may be that people are more likely to undertake risky behavior in more-dangerous neigh-borhoods. If expected life spans are reduced, residents may have less to lose from less proximatehealth threats such as smoking, alcohol use, and delayed prenatal care. See Dow, Philipson,and Sala-i-Martin (1997); Ganz (1997).
*gould ellen 6/14/00 11:24 AM Page 208
Third, the day-to-day stresses experienced by black women in more seg-regated cities may be relatively higher due to crime, unemployment, or overalllevels of racial tension. To cope with such stresses, pregnant women may turnto smoking and other behaviors that are temporarily comforting despite beingunhealthy in the long term. Such stress may also in fact place a direct toll onthe immune system.25
Finally, in more segregated metropolitan areas, blacks may be constrainedto inferior physical environments and cut off from higher-quality public goods.This may occur because some combination of housing market discrimination,white household behavior, and income differences constrains blacks to com-munities that not only have a greater share of blacks but also possess olderhousing, more noxious factories, fewer safe places for outdoor recreation, andso forth.26
Although it is not possible to test all of these hypotheses, the results belowdo shed some light on the relationship between segregation and birth outcomesand provide some suggestive evidence about which of these various mecha-nisms are more plausible than others.
Data and Methods
The paper relies on the 1990 national linked birth and death files, whichcontain information about every infant born in the United States in 1990 andits mother. This data set includes background information about the mother(including race, age, education, and alcohol and tobacco use) and allows oneto examine the individual determinants of birth weight and infant mortality.With the cooperation of the National Center on Health Statistics, this paperuses a unique version of the files that reveals the mother’s metropolitan areaof residence at the time of birth and thus enables measures of segregation andother metropolitan area characteristics to be linked to the file.
The sample is restricted to singleton births and to mothers living in met-ropolitan areas with at least 100,000 residents and at least 5,000 black residents.In total, the sample contains approximately 3 million births taking place in
Ingrid Gould Ellen 209
25. Hoffman and Hatch (1996).26. It is conceivable that black residents tend to choose different packages of public ser-
vices. Few studies have explored this question, but Galster (1979) analyzes preferences forhousing and finds few differences across racial groups.
*gould ellen 6/14/00 11:24 AM Page 209

261 metropolitan areas around the country.27 Table 1 offers a brief summary.Approximately 18.5 percent of the infants are born to black mothers.28 Asshown, black mothers are more than two and one-half times more likely togive birth to low-weight infants. Their infants are also two and one-half timesmore likely to die within the first year. Some of this differential is due to eco-nomic status—black mothers are less educated and less likely to be marriedthan their nonblack counterparts. And some of this difference may be due todifferential utilization of prenatal care. But even after controlling for all of
210 Brookings-Wharton Papers on Urban Affairs: 2000
Table 1. Summary Statistics of the SamplePercent unless otherwise indicated
Variable Black mothers Nonblack mothers
InfantsLow birth weight 12.0 4.7Infant mortality rate 1.5 0.6MothersMean age 24.6 27.1First birth 38.0 42.8With anemia 3.3 1.4With hypertension 2.5 2.4With diabetes 1.8 2.2Not completing high schoola 28.0 18.5College graduates 7.4 23.1Married 33.4 79.4Using tobacco 16.5 17.9Using alcohol 4.0 3.4Receiving inadequate prenatal careb 30.1 14.7N 563,539 2,479,624
Source: National Center on Health Statistics, 1990 Linked Birth and Death files. Sample is restricted to those women living inmetropolitan areas with at least 100,000 total residents and 5,000 black residents. Low birth weight refers to an infant that weighsless than 2,500 grams (5.5 pounds).
a. Educational outcomes defined only for those at least 19 years of age.b. Measured by the Adequacy of Prenatal Care Utilization (APNCU) Index; see footnote 34 for explanation.
27. Of these 261 metropolitan areas, nine are in fact counties in New England. In the caseof mothers residing in New England, the NCHS data set identified the county of mother’s res-idence rather than the metropolitan area. In certain cases, these counties spanned severalmetropolitan areas. In these cases, the share of the county population living in various metro-politan areas was calculated. A weighted mean of the characteristics of all of these metropolitanareas is then used. The mean is weighted by the number of county residents living in each met-ropolitan area.
28. It is important to point out that this paper considers births to black mothers, not blackinfants. Identification of the race of infants has been shown to be inaccurate, and the aim ofthis paper is to explore how mothers of different races are influenced by racial segregation.
*gould ellen 6/14/00 11:24 AM Page 210
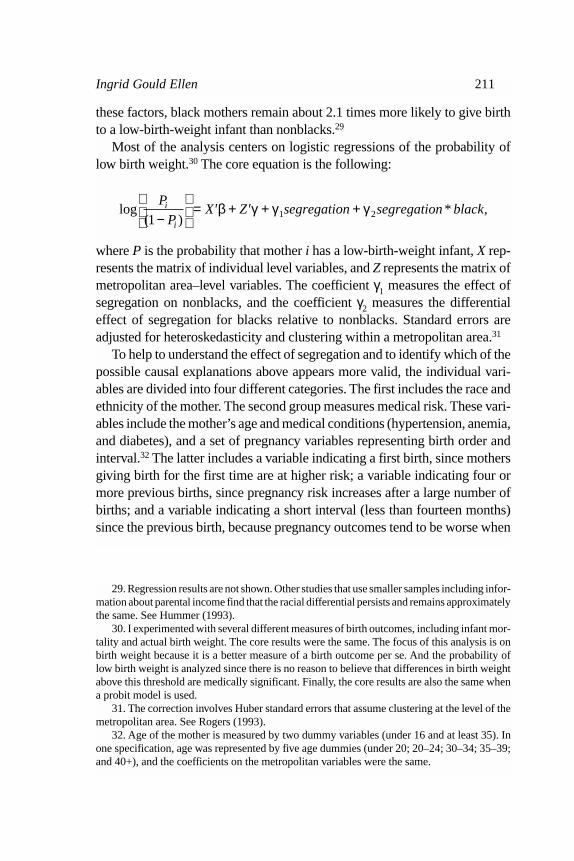
these factors, black mothers remain about 2.1 times more likely to give birthto a low-birth-weight infant than nonblacks.29
Most of the analysis centers on logistic regressions of the probability oflow birth weight.30 The core equation is the following:
where P is the probability that mother i has a low-birth-weight infant, X rep-resents the matrix of individual level variables, and Z represents the matrix ofmetropolitan area–level variables. The coefficient γ1 measures the effect ofsegregation on nonblacks, and the coefficient γ2 measures the differentialeffect of segregation for blacks relative to nonblacks. Standard errors areadjusted for heteroskedasticity and clustering within a metropolitan area.31
To help to understand the effect of segregation and to identify which of thepossible causal explanations above appears more valid, the individual vari-ables are divided into four different categories. The first includes the race andethnicity of the mother. The second group measures medical risk. These vari-ables include the mother’s age and medical conditions (hypertension, anemia,and diabetes), and a set of pregnancy variables representing birth order andinterval.32 The latter includes a variable indicating a first birth, since mothersgiving birth for the first time are at higher risk; a variable indicating four ormore previous births, since pregnancy risk increases after a large number ofbirths; and a variable indicating a short interval (less than fourteen months)since the previous birth, because pregnancy outcomes tend to be worse when
log( )
* ,P
PX Z segregation segregation blacki
i1 1 2−
= ′ + ′ + +β γ γ γ
Ingrid Gould Ellen 211
29. Regression results are not shown. Other studies that use smaller samples including infor-mation about parental income find that the racial differential persists and remains approximatelythe same. See Hummer (1993).
30. I experimented with several different measures of birth outcomes, including infant mor-tality and actual birth weight. The core results were the same. The focus of this analysis is onbirth weight because it is a better measure of a birth outcome per se. And the probability oflow birth weight is analyzed since there is no reason to believe that differences in birth weightabove this threshold are medically significant. Finally, the core results are also the same whena probit model is used.
31. The correction involves Huber standard errors that assume clustering at the level of themetropolitan area. See Rogers (1993).
32. Age of the mother is measured by two dummy variables (under 16 and at least 35). Inone specification, age was represented by five age dummies (under 20; 20–24; 30–34; 35–39;and 40+), and the coefficients on the metropolitan variables were the same.
*gould ellen 6/14/00 11:24 AM Page 211

intervals between births are very short.33 While all of these medical risk vari-ables are potentially influenced by segregation, the link is weaker than thosefor health-related behavior and socioeconomic status.
The third set measures the mother’s social status. These variables includethe mother’s education and marital status at the time of the birth. The final setof variables represents behaviors during pregnancy, including variables indi-cating the adequacy of prenatal care,34 and tobacco and alcohol use duringpregnancy.
The key metropolitan-area characteristic is the degree to which blacks areresidentially segregated in the metropolitan area. I use two measures of hous-ing segregation: the dissimilarity index and the relative centralization index.While often used interchangeably, these indexes examine different aspects ofsegregation and thus may help to clarify the ways in which racial segregationaffects minority birth outcomes.
The dissimilarity index, or D, is the most commonly used measure of seg-regation. Derived from the Lorenz curve, D may be understood as an indicatorof how far the population distribution is from a situation in which every neigh-borhood (or census tract) contains the same proportion of the minority groupat hand—say, blacks. Varying between 0 and 1, the index may be interpretedas the share of blacks (or nonblacks) that would have to move to a differentneighborhood for the city to be completely integrated.35 The dissimilarityindex reflects neighborhood-level separation and may be seen as capturing
212 Brookings-Wharton Papers on Urban Affairs: 2000
33. This may be because a mother’s body needs a chance to recover from the previous birth.Mothers giving birth after short intervals also may not discover that they are pregnant for alonger period of time and may therefore undertake more risky behavior.
34. The Adequacy of Prenatal Care Utilization (APNCU) Index is used, which categorizesthe care received as “inadequate,” “intermediate,” “adequate,” or “adequate plus.” SeeKotelchuck (1994). These categories separate women getting different levels of care accord-ing to guidelines established by the American College of Obstetricians and Gynecologists. Theseguidelines consider both the number and the timing of visits. Women receive “adequate plus”care primarily because of pregnancy complications and maternal health risks. It is thereforeimportant to separate out these women so that prenatal care does not appear to be detrimentalto birth outcomes.
35. This definition holds only if we assume that no majority group members move out oftheir neighborhoods to make room for the minorities. Given the durability of housing, it is morereasonable to consider the number of black and white households that would have to switchhomes in order for a city to be totally integrated. Thus a more accurate (though much less com-mon) interpretation is that D represents the ratio between the number of households that mustmove for the area to be completely integrated and the maximum number that would have tomove, assuming that the population of every tract remains constant. See Winship (1977).
*gould ellen 6/14/00 11:24 AM Page 212

the degree to which blacks and whites are isolated from one another sociallyand the extent to which they face different social and economic environments.
The formula for the index is
where pi represents the proportion of blacks in neighborhood i, P the propor-tion of blacks in the overall metropolitan area, ti the population in neighborhoodi, and T the population of the overall metropolitan area.
The index of relative centralization measures the extent to which a groupis spatially concentrated near the center of an urban area, and thus perhapsexposed to inferior physical environments—older housing, deteriorating infra-structures, and industrial hazards. To the extent that it suggests that minoritiesare located in a central city as opposed to a suburban jurisdiction, this indexmay also capture differing levels of public services.
The relative centralization index varies between 1 and –1, with positive val-ues indicating a tendency for blacks to live in inner-city environments. Moretechnically, the centralization index may be interpreted as indicating the pro-portion of blacks that would have to move to match the degree of centralizationof nonblacks.36 The formula is as follows:
where Blacki and Nonblacki are the respective cumulative proportions ofblacks and nonblacks in tract i, and the n census tracts in the metropolitan areaare ordered by increasing distance from the central business district. 37
Regional dummy variables and additional contextual variables are alsoincluded in all regressions to control for other characteristics of metropolitanareas that may influence birth outcomes: population size, the proportion ofblacks, and median household income. The log of population size and the log
Relative Centralization Index = Nonblack
Nonblack
( * )
( * ),
Black
Black
i i
i i
−
−
∑∑−
1
1
Dissimilarity Index = t p P
TP Pi i| |
( ),
−−
∑2 1
Ingrid Gould Ellen 213
36. Negative values are interpreted in the same way, but in this case blacks are less cen-tralized than nonblacks, and they would have to move to become as centralized as nonblacks.
37. An alternative measure is the isolation index, which measures the extent to which blackstend to live in largely black communities. Specifically, it represents the probability for a blackresident of a given metropolitan area that a randomly picked resident of his or her census tractis also black. The regressions here were also estimated using the isolation index, but the resultswere highly similar to those using the dissimilarity index. Thus only the results for the dis-similarity index and the relative centralization index are shown. (The correlation between thedissimilarity index and the isolation index is 0.79.)
*gould ellen 6/14/00 11:24 AM Page 213
Tab
le 2
. Des
crip
tive
Sta
tist
ics
and
Sim
ple
Cor
rela
tion
Mat
rix:
Met
ropo
litan
-Are
a-L
evel
Var
iabl
es
Dis
sim
ilar
ity
Rel
ativ
e L
og (
MSA
P
ropo
rtio
n L
og (
med
ian
Vari
able
inde
xce
ntra
liza
tion
popu
lati
on)
blac
kin
com
e)
Num
ber
of m
etro
are
as25
222
025
225
225
2M
ean
0.58
40.
358
12.9
60.
123
10.3
1S
tand
ard
devi
atio
n0.
122
0.23
20.
975
0.09
10.
199
Min
imum
0.20
6–0
.274
11.5
80.
009
9.92
Max
imum
0.87
30.
752
16.0
0.45
710
.97
Cor
rela
tion
sD
issi
mil
arit
y in
dex
1.0
Rel
ativ
e ce
ntra
liza
tion
inde
x0.
407
1.0
Log
(M
SA
pop
ulat
ion)
0.31
20.
015
1.0
Pro
port
ion
blac
k0.
062
–0.0
000.
007
1.0
Ln(
med
ian
inco
me)
0.10
4–0
.010
0.42
5–0
.281
1.0
Sou
rce:
For
inde
x of
rel
ativ
e ce
ntra
liza
tion
,Har
riso
n an
d W
einb
erg
(199
2). A
ll o
ther
dat
a,C
utle
r,G
laes
er,a
nd V
igdo
r (1
999)
.
*gould ellen 6/14/00 11:24 AM Page 214
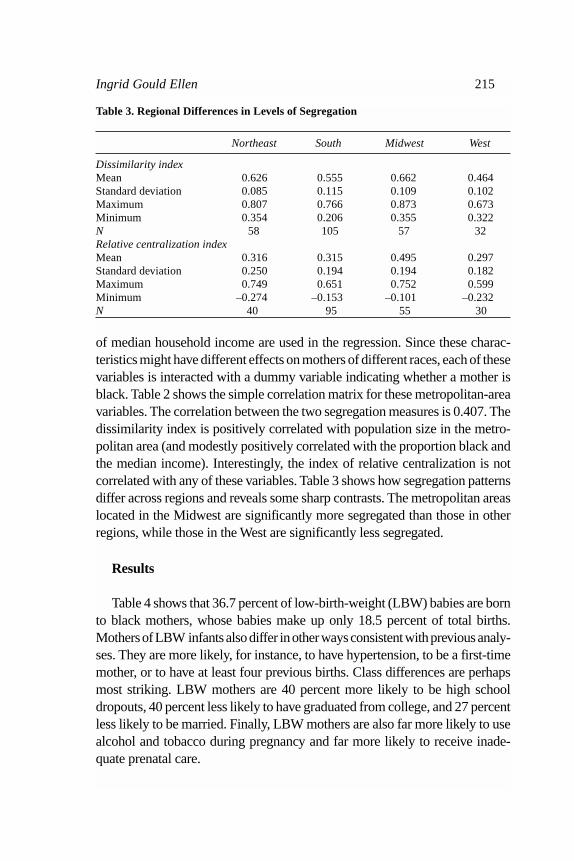
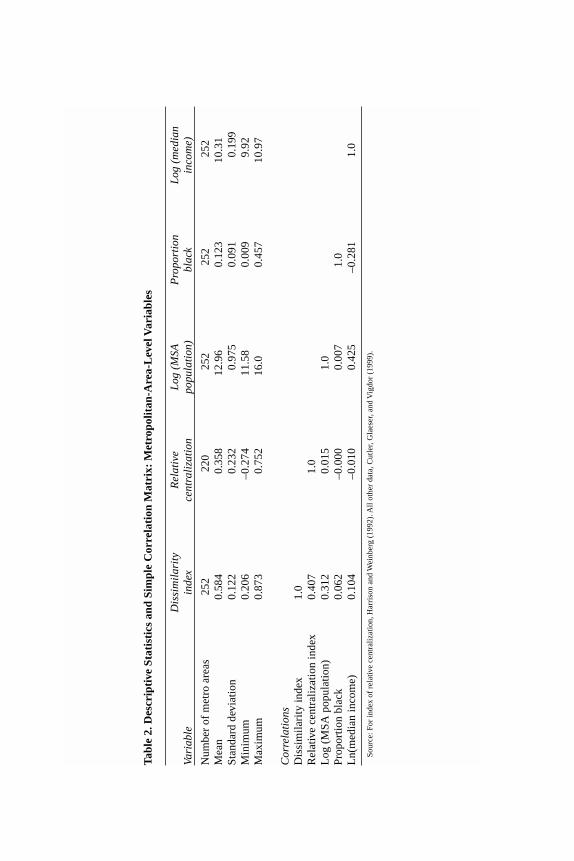
of median household income are used in the regression. Since these charac-teristics might have different effects on mothers of different races, each of thesevariables is interacted with a dummy variable indicating whether a mother isblack. Table 2 shows the simple correlation matrix for these metropolitan-areavariables. The correlation between the two segregation measures is 0.407. Thedissimilarity index is positively correlated with population size in the metro-politan area (and modestly positively correlated with the proportion black andthe median income). Interestingly, the index of relative centralization is notcorrelated with any of these variables. Table 3 shows how segregation patternsdiffer across regions and reveals some sharp contrasts. The metropolitan areaslocated in the Midwest are significantly more segregated than those in otherregions, while those in the West are significantly less segregated.
Results
Table 4 shows that 36.7 percent of low-birth-weight (LBW) babies are bornto black mothers, whose babies make up only 18.5 percent of total births.Mothers of LBW infants also differ in other ways consistent with previous analy-ses. They are more likely, for instance, to have hypertension, to be a first-timemother, or to have at least four previous births. Class differences are perhapsmost striking. LBW mothers are 40 percent more likely to be high schooldropouts, 40 percent less likely to have graduated from college, and 27 percentless likely to be married. Finally, LBW mothers are also far more likely to usealcohol and tobacco during pregnancy and far more likely to receive inade-quate prenatal care.
Ingrid Gould Ellen 215
Table 3. Regional Differences in Levels of Segregation
Northeast South Midwest West
Dissimilarity indexMean 0.626 0.555 0.662 0.464Standard deviation 0.085 0.115 0.109 0.102Maximum 0.807 0.766 0.873 0.673Minimum 0.354 0.206 0.355 0.322N 58 105 57 32Relative centralization indexMean 0.316 0.315 0.495 0.297Standard deviation 0.250 0.194 0.194 0.182Maximum 0.749 0.651 0.752 0.599Minimum –0.274 –0.153 –0.101 –0.232N 40 95 55 30
*gould ellen 6/14/00 11:24 AM Page 215

Basic Regression Results
Table 5 shows the estimated coefficients from some simple logistic regres-sions of low birth weight.38 Two columns show the results when thedissimilarity index is used as a measure of racial segregation, and two columnspresent estimated coefficients from regressions using the index of relative cen-tralization.39 The table also shows predicted probabilities of low birth weightfor black and nonblack mothers living in high- and low-segregation metro-politan areas. (In a high-segregation metropolitan area, the level of segregationis one standard deviation above the mean, while in a low-segregation metro-politan area, the level of segregation is one standard deviation below the mean.)
The probability of low birth weight for black mothers is predicted to besignificantly higher in more segregated metropolitan areas. When the dis-similarity index is used, the probability of low birth weight is predicted to be1 percentage point or 11 percent higher in high-segregation areas. When theindex of relative centralization is used, the probability of low birth weight for
216 Brookings-Wharton Papers on Urban Affairs: 2000
Table 4. Comparison of Mean Characteristics of Mothers Delivering Low-Birth-Weight Infants and Mothers Delivering Normal-Weight InfantsPercent unless otherwise noted
Variable Low-birth-weight infant Normal-weight infant
Black 36.7 17.3Hispanic 14.4 16.8Asian 3.9 4.2
Mother’s age 25.9 26.7First birth 46.1 41.6Four or more births 5.5 3.8Short birth interval 6.5 2.8With hypertension 6.1 2.2With anemia 2.5 1.6With diabetes 2.0 2.1Not completing high school 31.9 23.1College graduates 11.8 19.5Married 52.9 72.0Using tobacco 30.0 16.8Using alcohol 6.1 3.3Receiving inadequate prenatal care 26.0 16.9
38. The results here and in later regressions are highly similar when a probit model is used.39. The fact that the coefficient on the black race dummy variable becomes negative when
metropolitan-area interaction terms are included does not suggest that the model has “explained”the black disadvantage. As shown in the predicted probabilities, over normal ranges, black moth-ers are still at a large disadvantage.
*gould ellen 6/14/00 11:24 AM Page 216

Ingrid Gould Ellen 217
Table 5. Estimated Coefficients and Predicted Probabilities from PreliminaryLogistic Regressions of Low Birth Weighta
Dissimilarity index Relative centralization indexVariableb No controls MSA controls No controls MSA controls
Segregation –0.039 –0.076 –0.091 –0.086(0.086) (0.110) (0.063) (0.044)
Segregation*black 0.514 0.438 0.313 0.313(0.103) (0.094) (0.054) (0.054)
Black 0.675 –3.39 0.891 –3.45(0.062) (0.709) (0.022) (0.590)
Asian 0.279 0.277(0.029) (0.289)
Hispanic 0.140 0.140(0.025) (0.025)
Hispanic origin missing 0.141 0.133(0.051) (0.052)
Northeast 0.029 0.024(0.017) (0.156)
South –0.012 –0.028(0.021) (0.017)
West –0.033 –0.035(0.044) (0.030)
Log population –0.008 –0.006(0.012) (0.009)
Log population*black 0.016 0.021(0.020) (0.012)
Proportion black 0.219 0.196(0.124) (0.122)
Proportion black*black 0.124 0.226(0.153) (0.135)
Log median income –0.404 –0.440(0.043) (0.045)
Log median income*black 0.374 0.387(0.083) (0.064)
Intercept –2.98 1.29 –2.97 1.63(0.052) (0.389) (0.326) (0.420)
N 3,043,163 3,043,163 2,847,986 2,847,986Predicted probability of low
birth weight (percent)Black mothers
Low segregationc 11.0 11.4 11.4 11.5High segregation 12.2* 12.3* 12.5* 12.6*
Nonblack mothersLow segregationc 4.7 4.8 4.8 4.8High segregation 4.7 4.7 4.6 4.6
*Predicted differences between high- and low-segregation metropolitan areas are statistically significant.a. The analysis using the dissimilarity index covers 252 metropolitan areas. The analysis using the index of relative centraliza-
tion covers 220 metropolitan areas. Standard errors are reported in parentheses and, here and throughout the paper, are adjustedfor heteroskedasticity and clustering within a metropolitan area.
b. With the exception of segregation, all variables are evaluated at the sample means.c. A low-segregation metropolitan area is one in which the level of segregation is one standard deviation below the mean. A
high-segregation metropolitan area is one in which the level of segregation is one standard deviation above the mean.
*gould ellen 6/14/00 11:24 AM Page 217
black mothers is predicted to be 1.1 percentage points or 9.6 percent higher.According to these results, if segregation levels fell to zero in all metropoli-tan areas, the model predicts that the probability of low birth weight for blackmothers would fall to 9.1 percent, meaning that black mothers in 1990 wouldhave been 1.9 times more likely to have low-birth-weight infants than wouldwhite mothers. The actual probabilities in the sample show that black moth-ers were in fact 2.6 times more likely to have low-birth-weight infants in 1990(see table 1).
As shown in the second and fourth columns in table 5, these differentialspersist after controlling for the ethnicity of the mother and other metropoli-tan-area characteristics. They shrink somewhat in the case of the dissimilarityindex, but they are unchanged when the index of relative centralization is used.
By contrast, there is little difference between the predicted birth outcomesof infants born to nonblack women in these two types of metropolitan areas.In all four regressions, the coefficient on the racial segregation variable is neg-ative, but in only one regression does it reach statistical significance. In otherwords, there is at most weak evidence that racial segregation affects the birthoutcomes of nonblack mothers, and if anything, segregation is related toimproved birth outcomes among these mothers.
Exploring the Pathways: Controlling for Other Individual Characteristics
Table 6 shows results from three sets of regressions that control for otherindividual characteristics. The first set—the columns marked (1)—includesthe individual factors considered to be relatively independent of racial segre-gation (age, race, and ethnicity of mother; birth order and interval; and medicalconditions).40 The individual-level coefficients (not shown) provide few sur-prises. A woman is more likely to give birth to a low-weight infant if she isblack, Asian, or Hispanic, if she is older, or if she has hypertension or anemia.She is also at greater risk of low birth weight if it is her first birth, if she hasalready had at least four children, or if the interval since her last birth is lessthan fourteen months.
The estimated coefficients for all metropolitan-area variables are shown.When these additional variables are included, the coefficients on the black
218 Brookings-Wharton Papers on Urban Affairs: 2000
40. The three medical conditions were in fact considered as a separate category—one thatmight be more influenced by environmental conditions. However, including these medical vari-ables had virtually no effect on the racial segregation coefficients. Therefore the regression thatincludes age, race, ethnicity, and pregnancy variables (but not medical conditions) as inde-pendent variables is not shown.
*gould ellen 6/14/00 11:24 AM Page 218

Tab
le 6
. Est
imat
ed C
oeff
icie
nts
from
Reg
ress
ion
of L
ow B
irth
Wei
ght
Met
ropo
lita
n ar
eaD
issi
mil
arit
y in
dex
Inde
x of
rel
ativ
e ce
ntra
liza
tion
vari
able
(1)a
(2)b
(3)c
(1)a
(2)b
(3)c
Seg
rega
tion
–0.0
72–0
.081
–0.0
79–0
.088
–0.0
97–0
.051
(0.1
09)
(0.1
12)
(0.1
08)
(0.0
38)
(0.0
39)
(0.0
46)
Seg
rega
tion
*bla
ck0.
364
0.13
0–0
.013
0.30
00.
235
0.10
6(.
099)
(0.0
83)
(0.0
97)
(0.0
55)
(0.0
45)
(0.0
63)
Log
pop
ulat
ion
–0.0
13–0
.013
–0.0
00–0
.011
–0.0
12–0
.004
(0.0
10)
(0.0
10)
(0.0
12)
(0.0
08)
(0.0
09)
(0.0
11)
Log
pop
ulat
ion*
blac
k0.
020
0.03
00.
029
0.02
10.
023
0.02
2(0
.020
)(0
.019
)(0
.022
)(0
.013
)(0
.012
)(0
.019
)P
ropo
rtio
n bl
ack
0.21
40.
303
0.28
70.
189
0.29
00.
241
(0.1
14)
(0.1
15)
(0.1
33)
(0.1
12)
(0.1
13)
(0.1
43)
Pro
port
ion
blac
k*bl
ack
0.17
20.
004
0.20
10.
252
0.03
20.
205
(0.1
50)
(0.1
39)
(0.1
51)
(0.1
27)
(0.1
17)
(0.1
51)
Log
med
ian
inco
me
–0.3
99–0
.282
–0.2
94–0
.427
–0.3
07–0
.284
(0.0
37)
(0.0
40)
(0.0
59)
(0.0
38)
(0.0
42)
(0.0
59)
Log
med
ian
inco
me*
blac
k0.
347
0.32
20.
161
0.36
60.
352
0.16
8(0
.083
)(0
.074
)(0
.077
)(0
.064
)(0
.059
)(0
.075
)N
3,04
3,16
33,
043,
163
3,04
3,16
32,
847,
986
2,84
7,98
62,
847,
986
a. R
egre
ssio
n 1
incl
udes
dem
ogra
phic
info
rmat
ion
abou
t the
mot
her
such
as
age,
ethn
icit
y,an
d ra
ce. I
t als
o in
clud
es in
form
atio
n on
med
ical
con
diti
ons—
spec
ific
ally
,ane
mia
,hyp
erte
nsio
n,an
d di
abet
es,
all o
f whi
ch in
flue
nce
birt
h w
eigh
t—as
wel
l as
vari
able
s to
indi
cate
bir
th o
rder
and
inte
rval
—sp
ecif
ical
ly,w
heth
er th
is is
a m
othe
r’s
firs
t bir
th,w
heth
er s
he h
as a
lrea
dy h
ad a
t lea
st fo
ur c
hild
ren,
and
whe
ther
the
mot
her
gave
bir
th in
the
prev
ious
14
mon
ths.
Fin
ally
,reg
iona
l dum
mie
s ar
e in
clud
ed a
s w
ell.
b. R
egre
ssio
n 2
incl
udes
the
sam
e va
riab
les
in m
odel
1 p
lus
mea
sure
s of
edu
cati
on a
nd m
arit
al s
tatu
s. S
peci
fica
lly,
vari
able
s ar
e ad
ded
that
indi
cate
whe
ther
or
not t
he m
othe
r is
mar
ried
and
whe
ther
or
not s
he h
as c
ompl
eted
hig
h sc
hool
or
coll
ege.
c. R
egre
ssio
n 3
incl
udes
the
sam
e va
riab
les
in m
odel
2 p
lus
mea
sure
s of
beh
avio
r du
ring
pre
gnan
cy. V
aria
bles
are
add
ed th
at in
dica
te w
heth
er th
e m
othe
r us
ed to
bacc
o du
ring
pre
gnan
cy o
r w
heth
er s
heus
ed a
lcoh
ol. I
n ad
diti
on,a
n in
dex
of p
rena
tal c
are
util
izat
ion
is in
clud
ed th
at r
efle
cts
the
num
ber
and
tim
ing
of p
rena
tal v
isit
s. D
umm
y va
riab
les
are
incl
uded
her
e to
not
e if
the
info
rmat
ion
is m
issi
ng. B
oth
the
coef
fici
ents
for
"m
issi
ng to
bacc
o" in
form
atio
n an
d "m
issi
ng p
rena
tal c
are"
info
rmat
ion
are
posi
tive
and
stat
isti
call
y si
gnif
ican
t. T
his
may
ref
lect
the
fact
that
thes
e w
omen
in f
act r
ecei
ved
infe
rior
car
e,or
that
low
er-s
tatu
s w
omen
(w
ho a
re m
ore
like
ly to
hav
e lo
w-b
irth
-wei
ght i
nfan
ts)
have
less
com
plet
e m
edic
al r
ecor
ds.
*gould ellen 6/14/00 11:24 AM Page 219

dummy*racial segregation interaction terms are changed very little and remainhighly significant, suggesting that black mothers living in more segregated met-ropolitan areas are indeed more likely to give birth to low-birth-weight babies,even after controlling for birth order, age, and selected medical conditions.
In the columns marked (2), estimated coefficients are shown for a regres-sion that also controls for the education and marital status of the mother.41 Thecoefficient on the segregation*black term falls substantially when these vari-ables are included. It falls by 64 percent compared with the first specificationwhen the dissimilarity index is used and by 22 percent when the index of rel-ative centralization is used. This suggests that much of the apparent effect ofsegregation operates through the educational attainment and marital status ofthe mother.
In the columns marked (3), estimated coefficients are shown for a regres-sion that also controls for tobacco and alcohol use during pregnancy and theutilization of prenatal care. Including these variables reduces the magnitudeof the coefficient still further. It falls to effectively zero in the case of the dis-similarity index and falls by 55 percent compared with the second specificationwhen the index of relative centralization is used.42 (It remains statistically sig-nificant at the 10 percent level of significance.)
Summarizing these various results, table 7 shows the differences in the pre-dicted probabilities of low birth weight for black and nonblack mothers livingin a high- as compared to a low-segregation metropolitan area. Again, the seg-regation level in a high-segregation area is one standard deviation above themean, and segregation in a low-segregation area is one standard deviation belowthe mean. The table shows the absolute percentage point difference. In per-centage terms, these differences are naturally far larger, since the meanprobability of low birth weight for black and nonblack mothers is 12 and 4.7percent respectively.
In contrast to the results for the segregation*black term, the coefficient onracial segregation is consistently negative, relatively small in magnitude, andin all but two cases, statistically insignificant. Thus there is little reason tobelieve that segregation per se is proxying for some other metropolitan-areaattribute that is related to low birth weight. In the case of centralization, the
220 Brookings-Wharton Papers on Urban Affairs: 2000
41. Again, the coefficients on the individual-level variables are as expected—mothers whoare high-school dropouts are more likely to deliver low-birth-weight infants, while those whoare married and college graduates are less likely to.
42. When including behaviors and not class, the effects of segregation do not disappear.The coefficient on the segregation*black variable suggests an effect very similar in magnitudeto that effect predicted when class variables are included and behavior is omitted.
*gould ellen 6/14/00 11:24 AM Page 220

coefficient on racial segregation is negative and statistically significant in tworegressions, providing some evidence that nonblack women may benefit some-what when blacks are relatively concentrated in the center of the city, and whennonblacks are therefore more concentrated in outlying areas.
With the exception of income, the other metropolitan characteristicsincluded in these six regressions do not seem to have much effect on low birthweight, either for black or nonblack mothers. Income at the metropolitan-arealevel does have an effect, which is not surprising. Wealthier cities are gener-ally likely to have better hospitals, better doctors, and better public services.Yet the coefficients on median income interacted with the black dummy vari-able suggest that these benefits are a great deal smaller for blacks.
In an additional regression (not shown), both measures of racial segrega-tion were included. With both included, the coefficient on the dissimilarityindex falls substantially and is not statistically significant in any of the threeregressions. The coefficient and standard error for the index of relative cen-tralization, meanwhile, are unchanged.
In summary, these regressions suggest that the aspect of segregation mostrelated to birth outcomes is the degree to which black mothers are concen-trated near the central city, and thus perhaps exposed to differing social servicesand physical environments. The importance of the centralization index mayalso reflect the fact that it measures the extent to which blacks are clusterednot only in individual neighborhoods but also in larger geographic areas (thatis, black neighborhoods next to black neighborhoods). A second key result isthat most of the apparent effect of racial segregation on black mothers appearsto operate either through its effects on the social status of the mother or throughinfluences on her behavior during pregnancy.
Ingrid Gould Ellen 221
Table 7. Predicted Difference in Probability of Low-Birth-Weight Babies for Blackand Nonblack Mothers, High- versus Low-Segregation Areasa
Percentage points
Black mothers Nonblack mothersIndex of Index of
Dissimilarity relative Dissimilarity relativeControl variables index centralization index centralizationRace of mother 1.2* 1.1* 0.0 –0.2+ Ethnicity and MSA controls 0.9* 1.1* –0.1 –0.2+ Age, medical conditions, birth order 0.7* 1.0* –0.1 –0.2*+ Education, marital status 0.3 0.7* –0.1 –0.2*+ Tobacco, alcohol, and prenatal care 0.0 0.2 –0.1 –0.2
*Statistically significant difference between high- and low-segregation areas.a. A low-segregation metropolitan area is one in which the level of segregation is exactly one standard deviation below the mean.
A high-segregation metropolitan area is one in which the level of segregation is one standard deviation above the mean.
*gould ellen 6/14/00 11:24 AM Page 221

Instrumental Variables Estimation
There are some potential problems with these estimates. Most fundamen-tal, both segregation and disparities in birth outcomes might be the result ofpoor economic outcomes of minorities. In an attempt to address this issue, aninstrumental variables approach is used. Following Cutler and Glaeser, I instru-ment for segregation using the natural log of the number of local governmentsin the metropolitan area and the share of local revenue that comes from inter-governmental sources.43 Both of these variables measure the extent to whichthe government structure of a metropolitan area encourages residential sort-ing. With more governments and less aid, there is a greater incentive forhouseholds to segregate. In both cases, the 1962 values of these fiscal vari-ables are used to ensure that they are unrelated to birth outcomes in 1990.These figures are available for only a subset of the metropolitan areas, so thesample size falls to 215 in this analysis.
As expected, the dissimilarity index is positively correlated with the num-ber of governments and negatively correlated with the share of revenue thatcomes from intergovernmental sources. Specifically, a regression of the dis-similarity index on these two variables yields the following estimates:
Dissimilarity Index = 0.501 (0.038)
+ 0.047*Log(number of governments) (0.006)
– 0.192*Transfer share,(0.096)
with N = 215, R2 = 0.252.Unfortunately, these fiscal factors explain much less of the variation in the
index of relative centralization (R2 = 0.08), so the instrumental variables esti-mation is performed only in the case of the dissimilarity index. Because ofthe difficulty of performing instrumental variables with a logistic regression,a linear probability model is used here, and the instrumental variables resultsare therefore compared to ordinary-least-squares (OLS) estimates of low birthweight.44 Consistent with Cutler and Glaeser,45 the results are largelyunchanged when instrumenting with these fiscal variables—both the coeffi-
222 Brookings-Wharton Papers on Urban Affairs: 2000
43. Cutler and Glaeser (1997).44. The ordinary-least-squares estimates (not shown) of the effect of segregation on black
birth weight are quite similar to those in table 6, although they suggest a slightly larger effect,at least for regressions (1) and (2).
45. Cutler and Glaeser (1997).
*gould ellen 6/14/00 11:24 AM Page 222

cients and the standard errors of the segregation variables increase somewhat.Naturally, this is not a perfect correction, but this does provide some modestsupport for the hypothesis that greater segregation leads to worse birth out-comes for black mothers.
How Does Segregation Affect Birth Outcomes? Further Evidence
This section explores two ways of further probing the relationship betweensegregation and birth outcomes. First, it examines the relationship betweenour two different measures of racial segregation and various intermediate out-comes. Second, it considers other measures of black-white disparity inmetropolitan areas.
Intermediate Outcomes
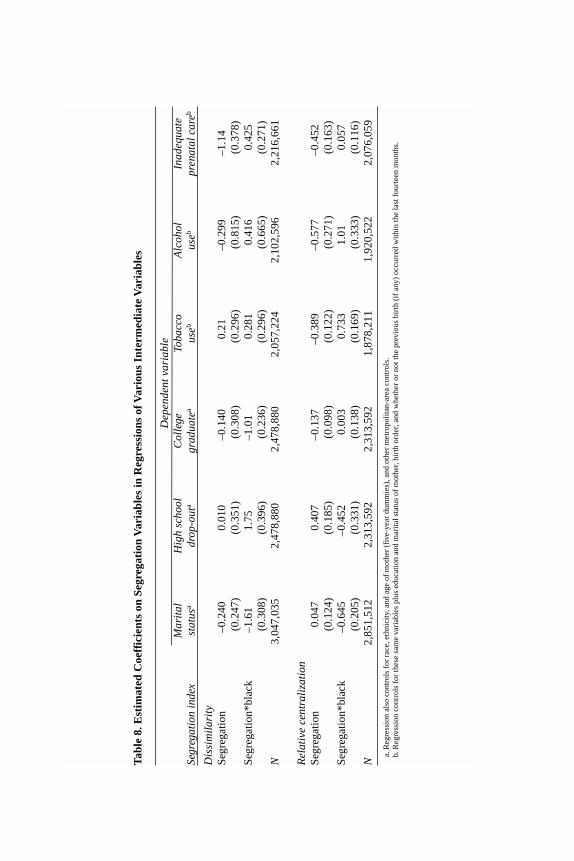
Table 8 examines the relationship between racial segregation and charac-teristics of the mother and her pregnancy (marital status, education, tobaccoand alcohol use during pregnancy, and inadequate prenatal care), controllingfor the same metropolitan-area characteristics used above and for selected indi-vidual variables. Two sets of regressions were estimated, one using thedissimilarity index and the other using the index of relative centralization.
The coefficient on segregation*black is negative and statistically signifi-cant in both regressions of the probability of being married. Black womengiving birth, in other words, are less likely to be married in more segregatedmetropolitan areas. The effect is larger when the dissimilarity index is used.The educational attainment of black mothers appears strongly related to seg-regation, but only when the dissimilarity index is used.
Alcohol and tobacco use during pregnancy are also related to segregation,but here the effect is only apparent when the index of relative centralizationis used. In brief, black mothers are more likely to drink and smoke duringpregnancy when they live in metropolitan areas where blacks are more resi-dentially concentrated in the central city. Perhaps surprisingly, all mothers areless likely to receive inadequate prenatal care in more segregated metropoli-tan areas. Perhaps this is because there are a greater number of doctors in thesemore segregated areas. But this does raise doubts about whether the effect isreally due to segregation as opposed to some other omitted factor.
Causality is of course in question here, but these simple regressions dodemonstrate that segregation is related to a variety of poor outcomes on the
Ingrid Gould Ellen 223
*gould ellen 6/14/00 11:24 AM Page 223
Tab
le 8
. Est
imat
ed C
oeff
icie
nts
on S
egre
gati
on V
aria
bles
in R
egre
ssio
ns o
f Var
ious
Int
erm
edia
te V
aria
bles
Dep
ende
nt v
aria
ble
Mar
ital
H
igh
scho
ol
Col
lege
To
bacc
o A
lcoh
ol
Inad
equa
te
Segr
egat
ion
inde
xst
atus
adr
op-o
uta
grad
uate
aus
ebus
ebpr
enat
al c
areb
Dis
sim
ilar
ity
Seg
rega
tion
–0.2
400.
010
–0.1
400.
21–0
.299
–1.1
4(0
.247
)(0
.351
)(0
.308
)(0
.296
)(0
.815
)(0
.378
)S
egre
gati
on*b
lack
–1.6
11.
75–1
.01
0.28
10.
416
0.42
5(0
.308
)(0
.396
)(0
.236
)(0
.296
)(0
.665
)(0
.271
)N
3,04
7,03
52,
478,
880
2,47
8,88
02,
057,
224
2,10
2,59
62,
216,
661
Rel
ativ
e ce
ntra
liza
tion
Seg
rega
tion
0.04
70.
407
–0.1
37–0
.389
–0.5
77–0
.452
(0.1
24)
(0.1
85)
(0.0
98)
(0.1
22)
(0.2
71)
(0.1
63)
Seg
rega
tion
*bla
ck–0
.645
–0.4
520.
003
0.73
31.
010.
057
(0.2
05)
(0.3
31)
(0.1
38)
(0.1
69)
(0.3
33)
(0.1
16)
N2,
851,
512
2,31
3,59
22,
313,
592
1,87
8,21
11,
920,
522
2,07
6,05
9
a. R
egre
ssio
n al
so c
ontr
ols
for
race
,eth
nici
ty,a
nd a
ge o
f m
othe
r (f
ive-
year
dum
mie
s),a
nd o
ther
met
ropo
lita
n-ar
ea c
ontr
ols.
b. R
egre
ssio
n co
ntro
ls f
or th
ese
sam
e va
riab
les
plus
edu
cati
on a
nd m
arit
al s
tatu
s of
mot
her,
birt
h or
der,
and
whe
ther
or
not t
he p
revi
ous
birt
h (i
f an
y) o
ccur
red
wit
hin
the
last
fou
rtee
n m
onth
s.
*gould ellen 6/14/00 11:24 AM Page 224
part of black mothers that may in turn be detrimental to birth outcomes.46 Theseresults also show that the two measures of segregation capture very differentaspects of residential separation. The neighborhood-level separation measuredby the dissimilarity index may be critical to spillover effects on educationalattainment and out-of-wedlock birth. But differences in physical location—and proximity to the central city—may be critical in determining the extentto which black women engage in unhealthy behaviors during pregnancy. Thisis somewhat of a puzzle. The concentration of blacks in large central areasmay allow for geographically targeted advertising campaigns, or tobacco andalcohol may be more readily available in downtown central-city areas. Alter-natively, peer effects may be stronger when minority neighborhoods are locatednext to other minority neighborhoods.
Controlling for Black Exposure in Metropolitan Areas
A second approach is through constructing variables that actually measurethe extent to which blacks and nonblacks are exposed to different sorts of envi-ronments. Two hypotheses in particular are explored. The first posits thatblack mothers fare worse in more segregated metropolitan areas because theyare exposed to less-educated neighbors and therefore receive less useful infor-mation about prenatal care, appropriate behavior during pregnancy, risks, andso on. To the extent that less-educated mothers also tend to smoke during preg-nancy, exposure to less-educated neighbors may also mean greater exposureto these behavioral influences as well.47 To test this hypothesis, I use an indexconstructed by Cutler and Glaeser that measures the extent to which blacksdisproportionately live in neighborhoods with residents having some amountof college education.48 The formula is as follows:
Ingrid Gould Ellen 225
46. Instrumental variable analysis, again using 1962 fiscal variables as instruments for seg-regation, supports a causal link between segregation and out-of-wedlock birth and worseeducational outcomes on the part of blacks.
47. High-school dropouts are more likely to use alcohol during pregnancy than women whohave completed high school and perhaps attended some college. Interestingly, college gradu-ates are also more likely to use alcohol during pregnancy than are high-school graduates.
48. Cutler and Glaeser (1997).
*gould ellen 6/14/00 11:24 AM Page 225

Note that this index effectively states the average black exposure to college-educated neighbors minus the overall proportion of college-educated residentsin the metropolitan area. Thus the index measures the extent to which blacksdifferentially live in census tracts with college-educated residents.
A similar index is constructed to measure the extent to which blacks aredisproportionately exposed to older housing in a metropolitan area. The for-mula for this index is as follows:
where old housing units are those that were at least forty years old in 1990.The risks of older housing might include lead paint, dust, inadequate ventila-tion, inadequate heating, and older water pipes. Old housing may also serveas a proxy for conditions in older neighborhoods.
Both measures of racial segregation are highly correlated with the old-hous-ing-exposure index. They are also negatively correlated with the education-exposure index, though less so, especially in the case of the index of relativecentralization. In other words, blacks in segregated metropolitan areas doappear to be confined to inferior neighborhoods.
Table 9 shows the results of regressions of low birth weight that includethe black education-exposure index, the black old-housing-exposure index,and each index interacted with a black dummy variable. Again, only the coef-ficients on metropolitan-area variables are shown.49 Since the aim is to explain
Black Old Housing Exposure Index =
Old housing units
Total housing units
Old housing units
Total housing units
i
i
Black
Blacki∑
−
*
,
Black Education Exposure Index =Black
BlackEducated persons
Total persons
Educated persons
Total persons
i
i
i
∑
−
*
.
226 Brookings-Wharton Papers on Urban Affairs: 2000
49. The inclusion of these additional variables generates virtually no change in the indi-vidual-level coefficients.
*gould ellen 6/14/00 11:24 AM Page 226
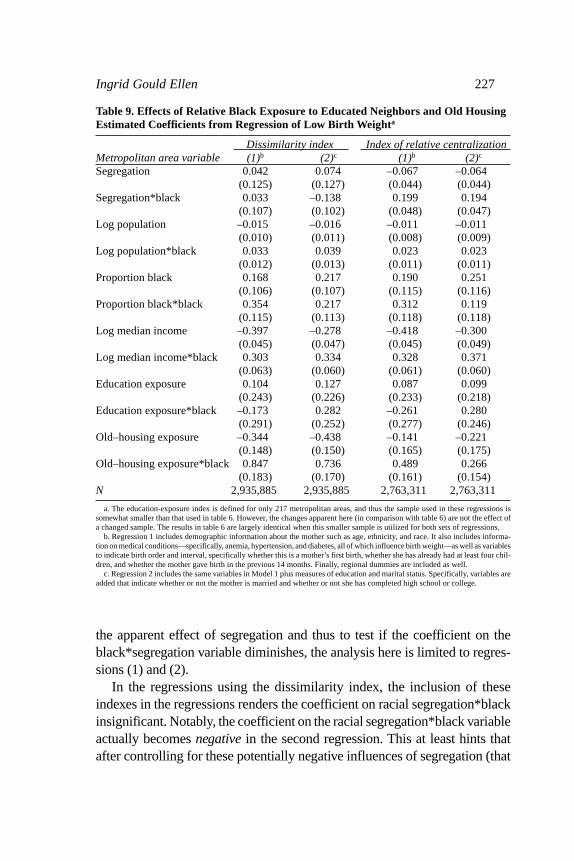
the apparent effect of segregation and thus to test if the coefficient on theblack*segregation variable diminishes, the analysis here is limited to regres-sions (1) and (2).
In the regressions using the dissimilarity index, the inclusion of theseindexes in the regressions renders the coefficient on racial segregation*blackinsignificant. Notably, the coefficient on the racial segregation*black variableactually becomes negative in the second regression. This at least hints thatafter controlling for these potentially negative influences of segregation (that
Ingrid Gould Ellen 227
Table 9. Effects of Relative Black Exposure to Educated Neighbors and Old HousingEstimated Coefficients from Regression of Low Birth Weighta
Dissimilarity index Index of relative centralizationMetropolitan area variable (1)b (2)c (1)b (2)c
Segregation 0.042 0.074 –0.067 –0.064(0.125) (0.127) (0.044) (0.044)
Segregation*black 0.033 –0.138 0.199 0.194(0.107) (0.102) (0.048) (0.047)
Log population –0.015 –0.016 –0.011 –0.011(0.010) (0.011) (0.008) (0.009)
Log population*black 0.033 0.039 0.023 0.023(0.012) (0.013) (0.011) (0.011)
Proportion black 0.168 0.217 0.190 0.251(0.106) (0.107) (0.115) (0.116)
Proportion black*black 0.354 0.217 0.312 0.119(0.115) (0.113) (0.118) (0.118)
Log median income –0.397 –0.278 –0.418 –0.300(0.045) (0.047) (0.045) (0.049)
Log median income*black 0.303 0.334 0.328 0.371(0.063) (0.060) (0.061) (0.060)
Education exposure 0.104 0.127 0.087 0.099(0.243) (0.226) (0.233) (0.218)
Education exposure*black –0.173 0.282 –0.261 0.280(0.291) (0.252) (0.277) (0.246)
Old–housing exposure –0.344 –0.438 –0.141 –0.221(0.148) (0.150) (0.165) (0.175)
Old–housing exposure*black 0.847 0.736 0.489 0.266(0.183) (0.170) (0.161) (0.154)
N 2,935,885 2,935,885 2,763,311 2,763,311
a. The education-exposure index is defined for only 217 metropolitan areas, and thus the sample used in these regressions issomewhat smaller than that used in table 6. However, the changes apparent here (in comparison with table 6) are not the effect ofa changed sample. The results in table 6 are largely identical when this smaller sample is utilized for both sets of regressions.
b. Regression 1 includes demographic information about the mother such as age, ethnicity, and race. It also includes informa-tion on medical conditions—specifically, anemia, hypertension, and diabetes, all of which influence birth weight—as well as variablesto indicate birth order and interval, specifically whether this is a mother’s first birth, whether she has already had at least four chil-dren, and whether the mother gave birth in the previous 14 months. Finally, regional dummies are included as well.
c. Regression 2 includes the same variables in Model 1 plus measures of education and marital status. Specifically, variables areadded that indicate whether or not the mother is married and whether or not she has completed high school or college.
*gould ellen 6/14/00 11:24 AM Page 227

is, greater exposure to older housing and less-educated neighbors), the pres-ence of a greater number of black neighbors may bring some benefits to blackwomen, such as enhanced social networks and political power.50
When the index of relative centralization is used instead, the coefficient onsegregation*black remains statistically significant in all of the models, evenafter the inclusion of these exposure indexes, though the magnitude of thecoefficients is generally diminished. The persistence of the effect of the rela-tive centralization measure suggests that there are other aspects of central-cityresidence, beyond the existence of older housing, that may be detrimental tobirth outcomes. One possibility is inferior city services.
Surprisingly, perhaps, there is little evidence that exposure to educatedneighbors matters in shaping birth outcomes. In terms of older housing, blackwomen are more likely to give birth to a low-weight infant when living in met-ropolitan areas in which blacks disproportionately live in older neighborhoods.Nonblacks in these metropolitan areas are meanwhile less likely to give birthto low-weight infants. In the case of the relative centralization index, the effectof older housing exposure is weaker, perhaps because the proximity to thecentral city is the better measure of environmental risk. Older housing mayindeed simply serve as a proxy for central-city residence.
Conclusion
This analysis yields three main conclusions. First, there does appear to bea link between racial segregation and low-birth-weight outcomes among blackwomen, and there is some evidence here that greater segregation in fact leadsto worse birth outcomes. It still may be true that segregation has positive influ-ences as well, but on net the influence appears to be negative. By contrast,there is little evidence that segregation has an effect on the birth weight ofnonblack infants.
Second, much of the apparently harmful effect of segregation may be tracedto its effect on the long-term social status of the mother as well as on behav-iors during pregnancy.
Third, this study suggests that the concentration of blacks in central-cityenvironments, and to a lesser extent their concentration in neighborhoods witholder housing, is more damaging than the neighborhood-level racial separa-
228 Brookings-Wharton Papers on Urban Affairs: 2000
50. In a regression that includes behavioral variables as well, the coefficient remains neg-ative and becomes marginally significant.
*gould ellen 6/14/00 11:24 AM Page 228

tion that is measured by the dissimilarity index. Generally, these results revealimportant differences between distinct measures of racial segregation, differ-ences that future researchers studying the consequences of segregation shouldbear in mind.
In sum, while further research should be done to define more precisely thenature of the link between segregation and poor birth outcomes, these resultsimply that an increase in residential integration in U.S. metropolitan areaswould help to diminish our troubling and persistent racial disparities in birthoutcomes. More generally, this research also suggests that this country’s stub-bornly high levels of racial segregation—and in particular, the high concentrationof minorities in central-city areas—may have serious consequences far beyondthe economic outcomes that researchers have typically explored.
Ingrid Gould Ellen 229
*gould ellen 6/14/00 11:24 AM Page 229

Comments
David M. Cutler: Ingrid Gould Ellen has written a fascinating paper on theimpact of segregation on birth outcomes. Ellen shows clearly and convincinglythat blacks living in more segregated cities have worse birth outcomes than doblacks living in less segregated cities. This is not true for whites. She also showsthat the causality runs from segregation to outcomes and not the reverse.
The methodology that Ellen uses is similar to the one that Edward Glaeserand I employed in our study of the impact of segregation on economic out-comes for blacks.1 Thus it is no surprise that I find it persuasive. Ellen’s paperexplores a new dimension of outcomes, however, and makes substantial head-way. I take her finding to be true and robust: segregation is harmful to thehealth of black babies.
The central question raised by these results is why this is the case. Thequestion is posed in the paper and speculated about, but it is never reallyresolved. Ellen shows that segregation matters because it is correlated withbehavioral decisions that women make—both socioeconomic behaviors (edu-cation, marital status) and health behaviors (smoking, drinking). This findingechoes that of Ellen Meara, who has shown in a recent paper that less-edu-cated women smoke more than more-educated women, and this explains asignificant share of why low-birth-weight infants are more common amongless educated women.2
But why does segregation matter for these behaviors? The paper is unableto answer this question with the data available. I’d like to raise a few theoriesand discuss how they might be tested.
Income theory. The first theory is that segregation affects health becausehigher-income women can afford better health behaviors. Less-educatedwomen may not be able to buy necessary food, medical care, and other ser-
1. Cutler and Glaeser (1997).2. Meara (1999).
*gould ellen 6/14/00 11:24 AM Page 230

vices, and this may adversely affect fetal development. This theory would notexplain why segregation leads to increased smoking and drinking, but it couldexplain the effect of segregation through changes in educational attainment.
One way to test this theory is to examine the consumption patterns ofwomen by income or education, matched with data on where they live. Thishas not been done, but other evidence suggests that this theory is not the com-plete explanation. National data show that the incidence of low birth weightamong most Hispanic and Asian women is very similar to that of non-His-panic whites, despite much lower income among these groups. In fact, theincidence is slightly lower for Mexican and Chinese mothers.3 Thus it is clearthat income by itself is not the explanatory factor.
Peer effects. A second theory is that segregation matters for birth outcomesbecause in more-segregated areas some women have worse behaviors and thisis imitated by other women in a contagious way. Such peer effects may be bad(smoking, drinking) or good (vitamin intake, prenatal care).
I do not have a strong sense about whether this view is correct. Behaviorscertainly do differ by racial group (although not always negatively—blackwomen smoke less than white women). But whether this results from peereffects or from other factors that similarly influence women from differentracial groups is unknown. I consider this a major research question.
Time allocation. The third theory is that segregation matters for healthbecause women in more segregated areas have to spend more time on basicaspects of living and have less time for appropriate medical or nonmedicalinputs to health. Depictions of life for poor mothers frequently stress the greatcomplications of seemingly simple tasks. Taking the children to day care mayinvolve a half hour or hour each way. Commuting to work or shopping, whichare often not near the home, may involve similar amounts of time. With sucha large time allocation devoted to these activities, it may be difficult for womento find time for doctors’ visits or to ensure adequate rest and nutrition.
This theory would explain why centralization in particular affects health.Women who are isolated in central-city neighborhoods without much link towealthier neighborhoods may find the time costs of good behaviors particu-larly high. The additional hardship of basic life may also lead women toengage in other unhealthy activities, such as smoking and drinking, as com-pensation for an already difficult life.
Ingrid Gould Ellen 231
3. Table 11 in National Center for Health Statistics (1999).
*gould ellen 6/14/00 11:24 AM Page 231

Testing this theory requires two additional pieces of information: timediaries and neighborhood characteristics on the availability of different ser-vices. If supermarkets are less plentiful in segregated areas but fast food ismore plentiful, that may explain different dietary patterns among women liv-ing in segregated environments. I do not know of any data sets that have thisinformation, but I would place a high priority on obtaining it.
Allostatic load. The final theory is that segregation affects health becauseit is associated with greater long-term stress, which has a cumulative adverseimpact on women’s health. This has been termed the theory of “allostatic load.”4
Increased stress may result simply from living in a segregated neighborhood,or may be a consequence of specific time pressures or other constraints facedby women living in these areas. To date, most of the research on allostaticsand health has focused on diseases that occur later in life, such as cardiovas-cular disease, but such theories could be applied to younger women as well.Indeed, research suggests that maternal stress during gestation predicts cer-tain components of fetal development.5
Allostatic load can be measured in one of two ways. Case histories can beused to measure the degree of stress encountered in daily life and in particu-larly difficult circumstances. Allostatic load is often measured clinically bymonitoring levels of cortisol or other hormones. Measurement of both of thesefactors is feasible and could be used to test this theory.
In sum, Ingrid Gould Ellen’s paper makes a striking case for the impor-tance of segregation in influencing birth outcomes. But it leaves open themechanisms through which these effects occur. Understanding such mecha-nisms should be the next step in this very important line of research.
William Dickens: Ingrid Ellen makes a good case for her main thesis—thatsegregation or centralization has negative consequences for black birth out-comes. However, the paper misses several opportunities to make its casestronger and to shed light on the mechanism by which segregation or cen-tralization affects birth outcomes.
Although the paper uses individual data on birth weight, most results aredriven by differences in the independent variables between metropolitan areas.It is very hard to make a convincing case for causality on the basis of cross-section correlations at the metropolitan level. The main reason for this is that
232 Brookings-Wharton Papers on Urban Affairs: 2000
4. McEwen (1998).5. Hobel and others (1999).
*gould ellen 6/14/00 11:24 AM Page 232

Ingrid Gould Ellen 233
one cannot be sure which way causation flows—did A cause B, B cause A,or did some other factor C cause both? The paper’s main strength is in find-ing multiple contrasts across metropolitan areas that strain the credulity ofalternative interpretations of the primary result. In particular, the contrastbetween the coefficient on segregation for whites and for blacks in a logisticregression of low birth weight on individual and metropolitan-area charac-teristics is compelling. If this showed that segregation was associated with badbirth outcomes for both blacks and whites, the interpretation of the result wouldbe highly suspect. It would seem most likely that some other characteristic ofthe city, one not controlled for in the regression, was a common cause of birthoutcomes and segregation. However, segregation is seen to have virtually norelation to birth outcomes for whites, while it has a substantial relation to birthoutcomes for blacks.
This is not the case for some other variables. In table 5, for example, citysize has no relation to birth outcomes for either blacks or whites. If there weremany unobserved city characteristics that were affecting birth outcomes, itwould be surprising that none are correlated with city size (or that their cor-relations with city size lead to effects on those coefficients that are exactlyoffsetting). In cities with higher median incomes, whites do have fewer low-birth-weight babies, but this is not the case for blacks. Were these resultsnonsensical, or if they mimicked the pattern for the two segregation measures,this would raise a question about the meaning of the correlation between seg-regation and birth outcome in the black population. But the results are notnonsensical, and they do not mimic the other patterns, so this lends credenceto the method of contrasting outcomes for blacks and whites.
By this argument, the positive relation between proportion black in a met-ropolitan area and the likelihood of a low-birth-weight baby being born to awhite is troubling. This suggests that there are some ignored metropolitan-area characteristics that are influencing the results. But the size effect is verysmall. A one-standard-deviation increase in proportion black increases theprobability of a low-weight birth to an average white mother by no more than0.13 percentage point. In contrast, the size effect of concentration on the prob-ability of a low-weight birth to a black mother is more than five times as large.Even though the results for whites for this variable are statistically significant,they do not suggest a major problem with unobserved third-factor causes.
Taken together, the results strongly suggest that something about the envi-ronment in segregated cities is leading to a higher probability of low birthweight in black babies. But is segregation the cause, so that integration would
*gould ellen 6/14/00 11:24 AM Page 233
be a cure? There are two ways that we might think about answering this ques-tion. The first would be to try to find city characteristics that lead to segregationbut are not themselves likely to have been caused by some other city charac-teristic that could also be related to poor birth outcomes. We could then lookto see if variation in segregation caused by differences in these antecedentswas related to birth outcomes. If that were the case, we would have strong evi-dence that segregation is the cause. This is the method of instrumental variables.A second approach would be to try to identify the way in which segregationaffects outcomes. If this could be done convincingly, then again we wouldknow whether integration could be a tool for improving black birth outcomes.Further, the process might allow us to identify other ways in which we mightintervene to improve outcomes. The paper tries both approaches.
Following David M. Cutler and Edward L. Glaeser, Ellen relates segrega-tion to two possible antecedents: the number of governments in a metropolitanarea and the share of local revenue that comes from intergovernmental sources.1
Segregation is understandably higher in cities with more governments andlower in those in which a higher percentage of revenue is shared. When thesevariables are used as instruments for the dissimilarity index, the results arelargely the same as in the OLS case. This would add considerably to the cred-ibility of the claim that segregation causes bad birth outcomes were it not forthe author’s selective reporting of results. The regressions are run for the dis-similarity index but not for the centralization index. Worse, these are not themost convincing instruments. It is not inconceivable that preexisting patternsof segregation have affected the number of governments in a region and theextent of revenue sharing within it. Cutler and Glaeser had another instrumentthat they used in their paper—the number of rivers dividing a metropolitanarea. This factor is naturally related to segregation, and it is much more believ-able that this variable is a cause and not a result of segregation. But Ellen doesnot even mention it. If some objective criterion has been used to decide inwhich circumstances to use which instruments, it should be motivated andreported. Without this, the reader cannot help but worry that the results thatare being reported are not representative of all that could be obtained.
There is another problem with the instrumental variables analysis. It is doneusing OLS rather than logit. This makes it hard to compare the results of theIV analysis to the earlier work. This problem could have been avoided if the
234 Brookings-Wharton Papers on Urban Affairs: 2000
1. Cutler and Glaeser (1997).
*gould ellen 6/14/00 11:24 AM Page 234

author had used a continuous measure of birth weight throughout the paper.Ellen never justifies her use of a dichotomous variable for birth weight.
Turning to the second mode of demonstrating causality, the paper missesa golden opportunity to narrow the range of suspects for causal paths. In thediscussion Ellen suggests that centralization is more the cause of the problemthan segregation per se. Although she presents the dissimilarity index and cen-tralization index as measures of the same concept—segregation— it is in factclear from their correlation (.4) that they are measuring different things. There-fore there is no reason that they could not both have been included in allregressions. We would then know whether it is segregation or centralizationthat is causally related to birth outcomes—or whether both are related to theoutcomes.
I find the results presented in table 6 interesting and indicative of the mech-anisms relating segregation to low birth weight. They further confirm thecausal nature of the relation. Here the author introduces, in sequence, controlsfor the mother’s social status and some behaviors during pregnancy. The intro-duction of these controls significantly reduces the impact on blacks of livingin a segregated city, suggesting that either segregation or some other aspectof segregated cities is leading black women to be less educated and less likelyto marry and that these factors influence their birth outcomes. Introducing con-trols for behaviors such as drinking and smoking during pregnancy completelyeliminates the effect of segregation in at least some specifications. Again, thisfits well with the story that the author is telling and adds to its plausibility.
What I find far less interesting is the material contained in tables 7 through10. Here the author attempts to account for difference in marital status and toexplore for other causal routes. The results are disappointing. It seems all tooeasy to read into the findings other explanations than those the author prefers.In particular, the often counterintuitive coefficients on segregation for whitessuggest that many unobserved factors are at work in creating these outcomesand confounding the interpretation of the results.
Ingrid Gould Ellen 235
*gould ellen 6/14/00 11:24 AM Page 235

References
Almgren, Gunnar, and others. 1998. “Joblessness, Family Disruption, and Violent Deathin Chicago, 1970–1990.” Social Forces 76 (June): 1465–93.
Blustein, Jan, and others. 1998. “Treatment of Heart Disease in Harlem: An Ethno-graphic Study.” New York University, Wagner School of Public Service.
Borjas, George. 1995. “Ethnicity, Neighborhoods, and Human Capital Externalities.”American Economic Review 85 (June): 365–90.
Braithwaite, Ronald L., and Ngina Lythcott. 1989. “Community Empowerment as aStrategy for Health Promotion for Black and Other Minority Populations.” Jour-nal of the American Medical Association 261 (January 13): 282–83.
Burr, Jeffrey A., John T. Hartman, and Donald W. Matteson. 1999. “Black Suicide inU.S. Metropolitan Areas:An Examination of the Racial Inequality and Social Inte-gration-Regulation Hypothesis.” Social Forces 77 (March): 1050–80.
Chay, Kenneth, and Michael Greenstone. 1999. “The Impact of Air Pollution on InfantMortality: Evidence from Geographic Variation in Pollution Shocks Induced by aRecession.” University of California, Berkeley, Department of Economics.
Collins, Chiquita, and David Williams. 1999. “Segregation and Mortality: The DeadlyEffects of Racism?” University of Michigan, Department of Sociology and Insti-tute for Social Research.
Cutler, David M., Douglas W. Elmendorf, and Richard J. Zeckhauser. 1993. “Demo-graphic Characteristics and the Public Bundle.” Public Finance 48 (supp.): 178–98.
Cutler, David M., and Edward L. Glaeser. 1997. “Are Ghettos Good or Bad?” Quar-terly Journal of Economics 112 (August): 827–72.
Cutler, David M., Edward L. Glaeser, and Jacob L. Vigdor. 1999. “The Rise andDecline of the American Ghetto.” Journal of Political Economy 107: 455–506.
Dow, William H., T. Philipson, and Xavier Sala-i-Martin. 1997. “Disease Comple-mentarities and the Evaluation of Public Health Interventions.”Working Paper 5216.Cambridge, Mass.: National Bureau of Economic Research.
Ellen, Ingrid Gould, and Margery Austin Turner. 1997. “Does Neighborhood Matter?Assessing Recent Evidence.” Housing Policy Debate 8 (4): 833–66.
Ellwood, David T. 1986. “The Spatial Mismatch Hypothesis:Are There Teenage JobsMissing in the Ghetto?” In The Black Youth Unemployment Crisis, edited by RichardFreeman and Harry Holzer, 147–90. University of Chicago Press.
Galster, George C. 1979. “Interracial Variations in Housing Preferences.” RegionalScience Perspectives 9: 1–17.
———. 1987. “Residential Segregation and Interracial Economic Disparities: ASimultaneous Equations Approach.” Journal of Urban Economics 21 (January):22–44.
———. 1991. “Housing Discrimination and Urban Poverty of African-Americans.”Journal of Housing Research 2 (2): 87–122.
Ganz, Michael. 1997. “Health Threats and Health Practices: Complementaries in theProduction of Health.” Columbia University.
236 Brookings-Wharton Papers on Urban Affairs: 2000
*gould ellen 6/14/00 11:24 AM Page 236
Geronimus, Arlene T. 1992. “The Weathering Hypothesis and the Health of African-American Women and Infants: Evidence and Speculations.” Ethnicity and Disease2 (Summer): 207–21.
Guest, Avery M., Gunnar Almgren, and Jon M. Hussey. 1998. “The Ecology of Raceand Socioeconomic Distress: Infant and Working-Age Mortality in Chicago.”Demography 35 (February): 23–34.
Hobel, C. J., and others. 1999. “Maternal Plasma Corticotropin-Releasing HormoneAssociated with Stress at Twenty Weeks’ Gestation in Pregnancies Ending inPreterm Delivery.” American Journal of Obstetrics and Gynecology 180 (January,part 3): S257–63.
Hoffman, Susie, and Maureen C. Hatch. 1996. “Stress, Social Support, and PregnancyOutcome: A Reassessment Based on Recent Research.” Pediatrics and PerinatalEpidemiology 10: 380–405.
Holzer, Harry. 1991. “The Spatial Mismatch Hypothesis: What Has the EvidenceShown?” Urban Studies 28 (February): 105–22.
House, James S., Karl R. Landis, and Debra Umberson. 1988. “Social Relationshipsand Health.” Science 241: 540–45.
Hummer, Robert A. 1993. “Racial Differentials in Infant Mortality in the U.S.: AnExamination of Social and Health Determinants.” Social Forces 72(2): 529–54.
Jargowsky, Paul A. 1997. Poverty and Place: Ghettos, Barrios, and the American City.New York: Russell Sage Foundation.
Kain, John F. 1968. “Housing Segregation, Negro Unemployment, and MetropolitanDecentralization.” Quarterly Journal of Economics 82 (May): 175–97.
Kotelchuck, Milton. 1994. “An Evaluation of the Kessner Adequacy of Prenatal CareIndex and a Proposed Adequacy of Prenatal Care Utilization Index.” American Jour-nal of Public Health 84 (September): 1414–20.
Krivo, Lauren J., and Ruth D. Peterson. 1996. “Extremely Disadvantaged Neighbor-hoods and Urban Crime.” Social Forces 75 (December): 619–50.
LaVeist, Thomas A. 1992. “The Political Empowerment and Health Status of African-Americans: Mapping a New Territory.” American Journal of Sociology 97 (January):1080–95.
———. 1993. “Segregation, Poverty, and Empowerment: Health Consequences forAfrican Americans.” Milbank Quarterly 71(1): 41–64.
LeClere, Felicia B., Richard G. Rogers, and Kimberley D. Peters. 1997. “Ethnicityand Mortality in the United States: Individual and Community Correlates.” SocialForces 76: 169–98.
Massey, Douglas S., and Nancy Denton. 1993. American Apartheid: Segregation andthe Making of the Underclass. Harvard University Press.
Matteson, Donald W., Jeffrey A. Burr, and James R. Marshall. 1998. “Infant Mortal-ity: A Multilevel Analysis of Individual and Community Risk Factors.” SocialScience and Medicine 47(11): 1841–54.
McAnarney, E. R., and Simon C. Stevens. 1990. “Maternal PsychologicalStress/Depression and Low Birth Weight: Is There a Relationship?” AmericanJournal of Diseases of Children 144 (July): 789–92.
Ingrid Gould Ellen 237
*gould ellen 6/14/00 11:24 AM Page 237

McEwen, Bruce S. 1998. “Protective and Damaging Effects of Stress Mediators.” NewEngland Journal of Medicine 338 (January 15): 171–79.
Meara, Ellen. 1999. “Why Is Socioeconomic Status Related to Health?: The Case ofLow Birth Weight.” Mimeographed. Harvard University.
National Center for Health Statistics. 1999. Health, United States, 1999. Hyattsville,Maryland.
O’Campo, Patricia, and others. 1997. “Neighborhood Risk Factors for Low Birthweightin Baltimore: A Multilevel Analysis.” American Journal of Public Health 87 (July): 1113–18.
O’Regan, Katherine M., and John M. Quigley. 1996. “Teenage Employment and theSpatial Isolation of Minority and Poverty Households.” Journal of Human Resources31 (Summer): 692–702.
Paneth, Nigel S. 1995. “The Problem of Low Birth Weight.” Future of Children 5(Spring): 19–34.
Polednak, Anthony P. 1991. “Black-White Differences in Infant Mortality in Thirty-Eight Standard Metropolitan Statistical Areas.” American Journal of Public Health81 (November): 1480–82.
———. 1997. Segregation, Poverty, and Mortality in Urban African Americans.Oxford University Press.
Potter, Lloyd B. 1991. “Socioeconomic Determinants of White and Black Males’LifeExpectancy Differentials, 1980.” Demography 28 (May): 303–21.
Rogers,William. 1993. “Regression Standard Errors in Clustered Samples.” Stata Tech-nical Bulletin Reprints 3: 88–94.
Rowley, Diane L., and others. 1993. “Preterm Delivery among African-AmericanWomen: A Research Strategy.” American Journal of Preventive Medicine 9 (6, supp.): 1–6.
Shihadeh, Edward S., and Nicole Flynn. 1996. “Segregation and Crime: The Effectof Black Social Isolation on the Rates of Black Urban Violence.” Social Forces 74(June): 1325–52.
Stack, Carol B. 1974. All Our Kin: Strategies for Survival in a Black Community.Harper and Row.
Wang, Xiaobin, and others. 1997. “Association between Air Pollution and Low BirthWeight: A Community-Based Study.” Environmental Health Perspectives 105(May): 514–20.
Winship, Christopher. 1977. “A Revaluation of Indexes of Residential Segregation.”Social Forces 55: 1058–66.
Yankauer, Alfred. 1950. “The Relationship of Fetal and Infant Mortality to Residen-tial Segregation: An Inquiry into Social Epidemiology.” American SociologicalReview 15 (October): 644–48.
Yinger, John. 1995. Closed Doors, Opportunities Lost: The Continuing Cost of Hous-ing Discrimination. New York: Russell Sage Foundation.
238 Brookings-Wharton Papers on Urban Affairs: 2000
*gould ellen 6/14/00 11:24 AM Page 238