Embed Size (px)
Citation preview
Program on Education Policy and Governance Working Papers Series
Is Seeing Believing? How Americans and Germans Think about their Schools1
Michael B. Henderson2, Philipp Lergetporer3, Paul E. Peterson4, Katharina Werner5, Martin R. West6, Ludger Woessmann7
PEPG 15-02
Harvard Kennedy School 79 JFK Street, Taubman 304
Cambridge, MA 02138 Tel: 617-495-7976 Fax: 617-496-4428
www.hks.harvard.edu/pepg/
Abstract What do citizens of the United States and Germany think about their schools and school policies? This paper offers the first broad comparison of public thinking on education in the two countries. We carried out opinion surveys of representative samples of the German and American adult populations in 2014 that included experiments in which we provided additional information to randomly selected subgroups. The paper first describes key characteristics of the U.S. and German education systems and then analyzes how information and institutional context affect public beliefs in the two countries. Results indicate both similarities and differences in the structure of American and German public opinion on schools and school policies.
1 Paper prepared for the conference on Public Opinion and the Political Economy of Education, Munich, May 9, 2015. We would like to thank Stefan Wolter and other conference participants for their constructive comments. Financial support by the Leibniz Association (SAW-2012-ifo-3) is gratefully acknowledged. 2 Louisiana State University; [email protected] 3 Ifo Institute at the University of Munich; [email protected], 4 Department of Government, Harvard University and Harvard Kennedy School; [email protected] 5 Ifo Institute at the University of Munich; [email protected] 6 Harvard Graduate School of Education and National Bureau of Economic Research; [email protected] 7 Ifo Institute at the University of Munich; [email protected]
1
Is Seeing Believing? How Americans and Germans Think about their Schools
Michael B. Henderson, Philipp Lergetporer, Paul E. Peterson,
Katharina Werner, Martin R. West, Ludger Woessmann
“Except I shall see in his hands the print of the nails … I will not believe.”
Thomas, the Disciple of Jesus, John 20:25 (Bible, King James Version)
Opinions about schools held by Germans and Americans are quite readily compared
because the two countries have many things in common. Both enjoy large, advanced
industrialized economies for which productivity growth depends in good part on an enhanced
stock of human capital. Both are complex societies striving to achieve greater social and regional
integration. Both relegate the direction of their educational systems to lower tiers of their
governmental system, leaving the federal government with only a secondary set of
responsibilities. Both face an increasingly competitive, interdependent world economy that is
pulling low-wage jobs elsewhere, thereby limiting work opportunities for those lacking higher-
order skills. In recent years both have launched major, nationwide efforts to improve school
quality.
Still, the educational systems in Germany and the United States differ in their historical
origins, their cultural, linguistic, and religious heritage, their organizational design, the manner in
which their teachers are trained and compensated, and the resources committed to primary and
secondary education. Given these differences, how do citizens of these two countries evaluate
their schools and respond to common issues? In this paper we offer the first broad comparison of
public thinking on education in the two largest industrialized nations in the western world.
2
To carry out this comparison we surveyed representative samples of the German and
American adult populations in the spring of 2014, asking respondents a variety of questions
about schools and school policies (see Appendix for a description of the survey methodology).
As part of the survey we ran a series of “survey experiments” in which we posed questions in
alternative ways to randomly selected subgroups of the sample, thereby allowing us to ascertain
the extent to which opinions change when alternative wording is used or when certain
information is introduced.
We found that specific information often shifts public opinion in similar ways in both
countries. For example, if told the current per pupil expenditure level, both German and
American respondents are less inclined to favor spending more money than if this information is
not supplied. We also found that the public in both nations thinks more highly of schools closer
to them than they do of schools in the country as a whole.
Despite such similarities, some inter-country differences emerge when respondents are
asked about policy questions. These divergences are often associated with contrasting
institutional and policy contexts. In a two-country comparison, it is hard to disentangle the causal
relationships underlying these associations: policies and institutions can follow opinions, and
opinions can follow policies and institutions. However, we will argue below that in many cases it
seems more plausible that institutional differences have shaped current differences in opinion.
What people believe—that is, what they think about school policy—is partly a product of what
they have seen. For example, Germans are more likely to favor a universal pre-school program
for four-year-old children, a policy Germany is closer to already. Meanwhile, Americans are
more likely to support higher pay for more effective teachers, perhaps because that practice is
more frequently found and more widely discussed in the United States.
3
Beliefs about the effectiveness of their nation’s schools are also associated with what the
public in each country has observed. For example, Germans give their schools as a whole higher
marks than Americans do, viewpoints that are reasonable given the higher performance of
German 15-year-old students on the international achievement tests of the Programme for
International Student Assessment (PISA). But Americans rate their teachers more favorably,
perhaps because teachers are better compensated in Germany and therefore held to a higher
standard. Americans are also more likely to favor salary increases for teachers than are Germans,
again consistent with the fact that their teachers earn less. Of course, there may well be other
explanations for these patterns—explanations that our data do not permit us to rule out. But the
differences in opinion we document between the two countries are nonetheless consistent with
salient differences in context.
In other words, opinion differences between the two countries are neither haphazard nor
accidental. Instead they are related to historical, institutional, cultural, and economic differences
that shape and reflect the thought of ordinary citizens in the two lands. Although our data reveal
a few oddities in the structure of public opinion, German and American views on education,
taken as a whole, make sense once one understands the contexts in which these views are
formed. To elaborate this theme, we first discuss selected characteristics of the German and
American educational systems, then turn to an analysis of how both information and institutional
context affect public beliefs.1
1 Within-country heterogeneities are not generally discussed in this paper.
4
The Institutional and Cultural Context
The American and German school systems differ in important respects. While schooling
in the United States is under the control of local school boards, German schools are mostly
controlled by the Länder (states). Secondary schools in Germany are divided among several
tiers, while the typical, comprehensive American high school serves all within the community.
External examinations at the end of high school play a critical role in the evaluation of students
in most German states, while most American students pass through their school career without
being required to pass any external tests other than ones that determine whether they are
minimally competent. Americans expend greater resources on their schools, but German teachers
are paid more, especially if they teach in secondary schools. Finally, German students at age 15
perform at higher levels on international tests in math, reading, and science. Many of these
differences are legacies of the past, but some have also emerged more recently.
Historical Development
The contemporary organization of the school system in the United States is rooted in the
local school-board tradition that settlers brought with them from England and Scotland during
the colonial period (Peterson, 2010). Until 1840 all public primary education was in the hands of
local boards, which used the revenue from property taxes to construct (usually) one-room
schoolhouses for children whose parents could not afford a private tutor or attendance at a
boarding school. Primary schools developed first in New England, but they soon spread to the
middle states and, finally, to states south of the Mason-Dixon line, a region where public schools
lagged, as slavery and racial divisions retarded the education of not only African American
children but most white children as well (Kaestle, 1983).
5
In the 1830s Horace Mann, Secretary to the Board of Education of the State of
Massachusetts, traveled to Germany to study the spread of the Prussian system of education that
was helping to unify the German peoples. Mann applauded the organization of schools by the
state rather than letting schools operate at the whims of local communities. He also admired the
Prussian emphasis on citizenship, compulsory schooling, and instruction in a common language.
That was exactly what was needed in America, Mann thought, as the United States was
experiencing waves of immigrants from varying cultural, religious, and linguistic backgrounds
(Glenn, 2002).
Educators across the country picked up Mann’s baton. Gradually, compulsory schooling
through age 14 was introduced into every state, local tax revenues were supplemented with state
funding, teachers were educated in state-run schools of education, and states scrutinized school
books for sectarian doctrines. Yet local school boards retained responsibility for school
operations. They continued to hire teachers, purchase textbooks, set standards for instruction, and
managed the local schools.
In Germany, the different states that formed Germany retained the main responsibility for
their education systems during the Weimar Republic (Konrad, 2012). Led by the allied forces,
the Kultushoheit of the Länder was reintroduced and strengthened after World War II. While
local authorities are responsible for school buildings, the states set overall funding, the education,
hiring, salaries, and pensions of teachers, as well as school curricula and exit examination
requirements uniformly at the level of each state.
6
Organizational Structure
Publicly supported secondary schooling emerged at scale in both countries during the
early decades of the 20th Century. In Germany, Länder preserved a legacy inherited from pre-
existing public, private, and religious schools by designing a tiered system of secondary
schools—usually Hauptschule, Realschule, and Gymnasium—that provided distinct forms of
preparation (general, technical, and academic). Teachers’ evaluations of students at the end of
primary school played a major role in determining the type of secondary school children would
attend. In the United States local boards eschewed the tiered system in favor of secular,
comprehensive high schools that served all students who wished to continue in school beyond
their primary years.
Probably because the Länder (and not local communities) had principal responsibility for
secondary schools in Germany, curriculum-based, end-of-school examinations continue to play a
central role in the transitions from one level of the educational system to the other. Not only does
student performance at age 10 affect the type of secondary school a child attends, but student
performance on the Abitur and other state exams at the end of the different tiers of high school
determines the advanced educational and work opportunities students will enjoy. Finishing the
Abitur guarantees a place in most subjects in the German higher education system, and those
who enter enjoy a tuition-free education.
In the United States no such system of examinations controlled by an external public
agency exists. While some students take Advanced Placement tests in certain subjects in order to
enhance the opportunity to attend a more selective college, the vast majority of college students
need only a high school diploma to be admitted to either a two-year or four-year higher
educational institution. Access to the higher education system is readily available and a
7
significant percentage of college-going students take remedial courses to compensate for
inadequate high school instruction. However, most U.S. students are expected to pay at least a
portion of their tuition; for those who attend selective colleges this can be very expensive.
Nonetheless, the open, comprehensive structure of the American educational system
produces a more highly educated population when measured by the number of years of
schooling. In 2012 only 31 percent of Germans were expected to graduate with a four-year
degree from a tertiary institution, as compared to 39 percent in the United States (OECD, 2014,
p. 81). However, these comparative figures hide the role played by the German apprenticeship
system: After finishing 9-10 years of secondary school, close to half of each student cohort
obtains a vocational degree. The standard procedure is to obtain a three-year apprenticeship in a
firm that usually includes one or two days per week of education in vocational schools, as well as
firm-based training. Because some apprenticeship degrees may be comparable to lower college
degrees in other countries, it is hard to compare the overall educational attainment of the U.S.
and German populations.
Federalism
While both Germany and the United States are federal systems, the fiscal role of local
government is much larger in the United States. In 2011, no less than 51 percent of funding came
from local taxes (OECD, 2014, p. 259), a legacy from the past when (in 1920) as much as 80
percent of school expenditures were paid for out of local revenues (NCES, 2014). U.S. states
contributed another 35 percent of the funding in 2011, while the remaining 14 percent came from
the federal government. (That percentage has since fallen as the federal share temporarily spiked
upward after the 2008 financial crisis.) In Germany 72 percent of 2011 funding for primary,
secondary and (non-tertiary) post-secondary public schools came from Länder, a sign of the
8
dominant role this tier of government plays in the organization of the German educational
system. Local governments provided just 17 percent of the expenditures, while the federal
government provided 11 percent.
Though the federal tier of government contributes roughly the same share of total
education spending, the policy role of the federal government in the two countries differs
substantially. In Germany the constitution prohibits the federal government even from
cooperating with the states in formulating school policies. At the same time Länder policies are
coordinated to some extent at meetings of the Kultusministerkonferenz, the national gathering of
state secretaries of education. For example, the Länder recently agreed to adopt common
nationwide standards at different levels, although the extent to which this will affect school
operations on the ground remains to be seen.
In the United States the federal government’s role has focused largely on the needs of
disadvantaged population. It funds compensatory education for students from low-income
backgrounds and special education for students with disabilities. However, in recent years it has
also taken on a prominent accountability role. Since 2002 it has required that all students in
grades 3 through 8 and again in high school be tested on state standardized tests in math and
reading (and, in selected grades, in science). Although the tests are not used to evaluate each
student’s performance, average student performances at each school (and for various groups at
each school) are reported annually to the public at large.
Quality and Equality
Since World War II both countries have addressed major challenges, though neither was
entirely successful in resolving them. Immediately after the war West Germans rebuilt and
9
democratized their schools and after the collapse of the Soviet empire in 1990 the schools in the
eastern part of Germany were incorporated into a national framework. German students’
unexpectedly mediocre performance on the international PISA test in 2000 triggered an intense
reaction among the public known as the “PISA shock” that, coupled with evidence of large
performance differences across states, sparked major initiatives to improve learning outcomes in
German schools. In the United States, state-sponsored segregation was banished, and southern
states took special efforts toward leveling the educational playing field. Still, social, cultural, and
regional disparities are extensive in both countries.
As measured by the PISA tests administered by the Organisation for Economic Co-
operation and Development (OECD), Germany has been more successful than the United States
in improving student performance overall while showing rather similar levels of educational
disparities. As can be seen in Figure 1, at the first PISA test in 2000 the performance of German
15-year-olds in math, reading, and science was noticeably lower than that of their American
peers. But between 2000 and 2012 the trend lines in PISA performances shifted steadily upward
in Germany while they remained almost flat in the United States. The reading performance of
German students improved by 24 points, whereas the performance of U.S. students actually
declined by 6 points. (Each point is one percent of a standard deviation in individual
performance across OECD countries.) The math and science scales are not directly comparable
between 2000 and 2012, but they indicate an even larger German-American divergence in math
and science.
By 2012, German 15-year-old students outperformed their U.S. peers by 32 points in
math, 27 points in science, and 10 points in reading. Further, Germany has a much higher
percentage of high performing students in mathematics than does the United States. Seventeen
10
percent of German students perform at or above the advanced level, while only 8 percent of U.S.
students achieve that level.2
The higher average student performance in Germany than in the U.S. is not accompanied
by consistently greater performance disparities. In reading and science the interquartile range in
PISA performance (i.e., the gap between the 75th and 25th percentile of the distribution) was
essentially the same in Germany and the United States in 2012 (Figure 2). The interquartile range
in math is 11 points wider in Germany than in the United States. Nonetheless, the scores of
students at the 25th percentile in Germany are still 29 points higher in Germany than in the
United States.3
One cannot draw the strong conclusion that German schools are clearly better than U.S.
schools, of course. By themselves, PISA data are unable to tell us whether it is the schools in the
two countries—or broader social forces affecting family life and peer culture—that are affecting
the performance of young people at the age of 15. But, arguably, the public in the United States
has more reason to be dissatisfied with its educational performance.
School Finance
U.S. schools also seem to be less efficient than German ones in achieving their academic
objectives. Even though U.S. students perform at lower levels than German ones, expenditures
for all primary education services are 45 percent higher in the United States than in Germany,
and expenditures for secondary education are 24 percent higher. In dollar terms, per pupil
expenditure on primary education in Germany in 2011 came to $7,579, whereas in the United
2 Advanced level as determined by the governing board of the U.S. National Assessment of Educational
Progress (NAEP). OECD equivalents are estimated by Hanushek, Peterson, and Woessmann (2013). 3 Similar differentials exist between students at the top and bottom deciles (90th and 10th percentiles) of the
distribution.
11
States they were $10,958. (OECD reports that private investments in schooling in the two
countries are quite similar.4) For secondary education the numbers totaled up to $10,275 and
$12,731 for the two countries, respectively (OECD, 2014, p. 215). Given fluctuations in
monetary values, these simple dollar comparisons could be misleading, but similar results are
obtained when one looks at the percentage of each country’s Gross Domestic Product (GDP)
allocated to educational expenditure. In 2011, U.S. public expenditure on primary and secondary
education amounted to 3.43 percent of GDP; in Germany, that percentage was just 2.77 percent
(OECD, 2014, p. 224).
Despite Germany’s lower investment in primary and secondary schooling, German
teachers are substantially better paid than U.S. teachers, especially at the secondary level. Newly
hired primary school teachers in the U.S. were paid in 2013 an average of $37,595 annually and,
after 15 years, they received an average of $46,130 (OECD, 2013b). In Germany such salaries, at
$47,488 and $58,662, respectively, were 26 percent higher. At the lower secondary level entry-
level German salaries exceeded those of U.S. teachers, on average, by 41 percent and, after 15
years by 40 percent. For those at the higher secondary level, entry-level German teachers
received 51 percent more in wages, while those with 15 years of experience received 41 percent
more (nearly $70,000 as compared to nearly $50,000 in the United States). The OECD estimate
of the number of pupils per teacher is slightly higher in Germany than in the United States (20.4
as compared to 19.0) but, even so, expenditures per pupil on teacher compensation run 29
percent higher in Germany at the primary level, 58 percent at the lower secondary level, and 64
percent higher at the upper secondary level (OECD, 2014).
4 The figures are 0.38 percent and 0.32 percent of GDP in Germany and the U.S., respectively; see OECD
(2014), p. 224.
12
As mentioned previously, dollar comparisons can be misleading. But if one compares
teacher salaries relative to the wages of other full-time, full-year, college-educated workers,
differences between the two countries persist. In Germany primary school teachers earn, on
average, 88 percent as much as other college-educated workers, while lower-secondary-school
teachers earn 97 percent and upper-secondary-school teachers earn 105 percent of the average
wage for equally educated workers. The relative wages for U.S. teachers are much lower: 67
percent, 68 percent, and 70 percent for the three tiers respectively (OECD, 2014, p. 469).
Notice that the German-American differentials in relative teacher wages are much wider
at the secondary than at the primary level. That is very likely a byproduct of the differential
organization of the teaching force in the two countries. In Germany, teachers at different tiers of
the school system tend to be represented by separate unions. In the United States the collective
bargaining agent for teachers is the same regardless of tier. If one assumes that the skills required
of a secondary school teacher are in shorter supply than those required of an primary-school
teacher, the implications of these fiscal arrangements are substantial—and could help to explain
the fact that German student performance at age 15 is 0.1 to 0.3 standard deviations higher than
U.S. student performance, even though public investment in education is roughly 20 percent less.
Teacher Recruitment, Training, and Retention
Sharp differences in teacher compensation between Germany and the United States are
associated with no less disparate practices when it comes to the recruitment, training, and
retention of the teaching force. Because German teachers are better paid they are more likely to
make teaching a lifetime career. No less than 46 percent of German primary school teachers are
over the age of 50, as compared to just 32 percent in the United States. Meanwhile, only 7
percent of German primary school teachers are under the age of 30, as compared to 15 percent of
13
U.S. teachers at the primary level. Differences in the age distributions for secondary teachers in
the two countries are qualitatively similar (OECD, 2014, p. 493).
In Germany, one must usually pass a state exam (Staatsexamen) to enter the teaching
profession. Standards for teacher education are centralized within each state and there is some
coordination across states. Within each state, teacher education programs must conform to
detailed requirements and are located at state universities. Furthermore, teacher education
graduates have to go through a traineeship (Referendariat) and pass a second, practically
oriented state exam before becoming full teachers. After achieving that status, in most states they
gain the benefit of strong civil service protections (Beamtenstatus) that prevent them from being
dismissed from their positions and ensure eligibility to the state pension system.
Teacher training is far more decentralized in the United States. Each state requires
individuals hired to teach in its K-12 schools to hold a license of certification of some kind,
usually obtained by completing an approved program at an institution of higher education and
passing a licensure exam. State requirements for these programs vary widely in specificity,
however, and oversight is generally lax. Moreover, 45 states have established alternative
certification programs that enable individuals without a standard credential to begin teaching
immediately while obtaining additional training on the side; more than 20 percent of Americans
completing teacher preparation programs annually now do so through an alternative route (U.S.
Department of Education, 2013).
Perhaps due to the fact that teacher wages have fallen relative to those of other
professions requiring a college degree, the U.S. has struggled in recent decades to attract
academically talented individuals into the teaching ranks. Over a third of the teaching force
attended the least selective quintile of the country’s colleges and universities, and less than 5
14
percent attended the most selective quintile (Hoxby, 2003, p. 95). Nonetheless, after between two
and five years in the classroom, new teachers in 49 states become eligible for tenure, making it
all but impossible to remove them from the classroom for performance-related reasons.
Public Opinion in the United States and Germany
Does the design and functioning of the German and American educational systems shape
public thinking in the two countries? In the remainder of this paper, we discuss the state of
German and American public opinion on the following topics: school quality; effectiveness at
serving different types of students; teacher effectiveness; teacher compensation; estimates of
own country’s international standing; importance of student performance for economic
prosperity; school expenditures; class-size reduction; differential teacher compensation; tenure
policy; and pre-school education.5
School Quality
To obtain public estimates of school quality, we asked respondents to grade public
schools on the scale generally used to evaluate students in their country. American subjects were
asked to grade their public schools using the grades A, B, C, D, and F. In Germany, the
corresponding school grades were used: 1, 2, 3, 4, and 5/6. In separate questions we asked
respondents to evaluate schools a) in their nation, b) in their state (Land), and c) in their local
community.
5 Throughout, all reported results refer to raw numbers, weighted by survey weights. We also tested the
statistical significance of all reported between-country differences in a regression specification that controls for respondents’ individual background characteristics, namely gender, relative income (in categories), parental status, employment status, age (in categories), and education (in categories). We refer to results with controls below only in cases where they yield substantively different conclusions than the raw numbers.
15
When asked to grade the nation’s schools, 29 percent of Germans gave them one of the
two highest grades, while only 20 percent of Americans did (Figure 3).6 When asked about the
schools in their state (Land), 38 percent of Germans, but only 33 percent of Americans, gave one
of the two high marks. However, U.S. respondents were more likely to give their local schools
one of the two highest grades (47 percent compared to 42 percent of Germans).
That Germans gave their nation’s schools higher evaluations is consistent with higher
levels of PISA performance among German than American students. In other words, the average
member of the general public in both countries seems to have a realistic assessment of school
quality in their country, perhaps because PISA results are well-publicized in both nations.
In both countries the public holds the schools in their states and local communities in
higher regard on average than the schools in the nation as a whole. This pattern is more
pronounced in the United States: The share of top grades increases from 20 percent to 33 percent
when moving from the national to the state level and upward to 47 percent when asking about
schools in their local community. The corresponding shares in Germany are 29 percent, 38
percent, and 42 percent, only a 13 percent disparity between local and national evaluations (as
compared to a 27 percent disparity in the United States).
The results for the United States are in line with earlier surveys (Peterson, Henderson,
and West, 2014). The sharp difference between judgments about local schools and the nation’s
schools constitutes a puzzle, since the nation’s schools are the sum of schools in local
communities. Peterson and his colleagues argue that this phenomenon might be due to the fact
6 To simplify presentation, we focus throughout on summary indicators of opinion that illustrate the broad
patterns of our results, such as the share giving the two highest grades here. Detailed results for all questions, such as the specific shares assigning each grade, are provided in Table A1 in the appendix.
16
that U.S. respondents, though recognizing problems with the nation’s schools, are reluctant to
admit that they live in a community with low-quality schools.
Given the more favorable assessment of the nation’s schools in Germany, the public may
find it unnecessary to draw sharp distinctions between local schools and the nation’s schools.
Also, Germans may feel less connected to local schools. The share of Germans awarding top
grades increases more when moving from the national to the state level (9 percentage points)
than when moving from the state to the local level (4 percentage points). In contrast, these
differences are approximately equally sized in the United States. This might be due to the fact
that local decision makers in the United States have more control over their schools than do their
counterparts in Germany. In the latter country, education policies differ largely between Länder
(rather than communities), because many important decisions on education policies are made at
that governmental tier.
Effectiveness at Serving Diverse Populations
Much of the discussion about education reform in the United States and Germany focuses
on how well schools attend to the needs of different student groups, especially those from
disadvantaged backgrounds. In order to ascertain public thinking on this question, we
administered a survey experiment. In each country, one randomly selected half of the sample was
first asked to grade their local public schools based on how well they serve the most talented
students and then asked a similar question about the least talented students. The other random
half of the sample was asked a similar set of questions about students from high-income and low-
income families.
17
Figure 4 depicts the share of respondents in each country who give their local schools one
of the top two grades for how well they teach these four groups of students. As many as 69
percent of Americans think their local schools deserve a top grade for teaching the most talented
students. For students from high-income families, this share is almost identical. In contrast, only
29 percent think that local schools do well in teaching the least talented students. For students
from low-income families, this share is significantly higher (37 percent).
Germans are significantly less satisfied than Americans with how public schools teach
advantaged students: Only 44 percent give a top grade for catering to the needs of the most
talented students. The corresponding share for students from high-income families is
significantly higher (58 percent). At the other end of the scale 31 percent of the German
population thinks that public schools deserve one of the top grades for teaching the least talented
students. The percentage was essentially the same (32 percent) when respondents were asked
about students from low-income families. Note that in both countries, most of these specific
evaluations differ markedly from the average evaluation of local schools (top grades for 47
percent in the U.S. and 42 percent in Germany).
When it comes to the less talented and those from low-income families, public opinion is
roughly the same in Germany and the United States.7 In neither country does much more than a
third of the population think the schools deserve high marks for their services to the
educationally and economically disadvantaged. This is in line with evidence that family
background is a powerful predictor of student achievement in both countries (Peterson and
Woessmann, 2007).
7 The assessment for teaching the least talented students does not differ significantly between the two
countries. The same is true for the assessment for teaching students from low-income families once respondents’ individual background characteristics are controlled for.
18
Cross-country differences in responses to questions about the most talented students are
more difficult to interpret. That only 44 percent of German respondents think the highly talented
are being well served (as compared to 69 percent of the American ones) is surprising at first
glance, given the much higher percentage of Germans who perform at the advanced level on
PISA tests. When students from high-income families are considered, cross-country differentials
are smaller but point in the same direction (58 percent as compared to 69 percent). It is
conceivable that the tracked structure of the secondary school system, together with an
increasing share of students aspiring for university education, focus German public opinion on
the performance of the gymnasium, bringing that institution under greater public scrutiny.
Meanwhile, talented students in the United States appear to be doing very well when compared
to others at their comprehensive high schools. It is also possible that decentralization of control
over school operations allows for closer connections between school and community in affluent
areas, though that is hard to square with the comparatively low percentage of Americans
performing at the advanced level on PISA tests. Or it could be a function of a public discourse in
the United States that has paid little critical attention to the education of the most talented,
instead focusing almost exclusively on the low quality of educational services for the
disadvantaged.
Teacher Evaluations and Teacher Compensation
When it comes to ratings of the performance of teachers, differences between Germany
and the United States are sharp and clear. To ascertain public assessment of teacher
effectiveness, respondents were asked to state the share of teachers in their local schools they
thought deserved each of the grades that had been used to rate schools.
19
Surprisingly, Americans appear to be more pleased with the teachers in their local schools
than are Germans. While the publics in the two countries resemble each other in the percentage
of teachers to which they give one of the two lowest grades, the United States gives a
significantly higher percentage of teachers one of the two highest grades. On average, Americans
say that 25 percent of local teachers deserve an A, and another 26 percent are given a B, yielding
a total of 52 percent for those who receive one of the two highest marks (Figure 5). The middling
grade of C is given to 25 percent. One of the two lowest grades is given to close to a quarter of
the teaching force, with a grade of D handed out to 13 percent and a failing grade to 9 percent.
If one converts the German scale to the American one, Germans are shown to be more
critical of their teaching force. Only 14 percent of German teachers are given A’s by the average
member of the public, while 27 percent are given B’s, yielding a total of 41 percent with one of
the two high marks. The two lowest evaluations are given to about a quarter of the teaching force
(16 percent D’s and 10 percent F’s), only slightly more than in the United States. A sizeable 33
percent are awarded a C, generating a distribution of grades that is more nearly symmetric than
in the United States.8
8 Based on the grading of schools discussed above, where no country gave consistently more top grades on
the different questions than the other (Figure 3), this discussion is based on the presumption that the overall grading scales are roughly comparable across the countries. It is conceivable, though, that the public in the two countries has different ideas about the underlying grade distributions on their national scales. This is hard to ascertain given available data. What we know is that among U.S. parents of primary and secondary school students, 45 percent report their children receive “mostly A’s” (average grades in all subjects, average of 2003 and 2007), 36 percent “mostly B’s”, 15 percent “mostly C’s”, and 4 percent “mostly D’s” (U.S. Department of Education, 2014). For Germany, what we know is that only 5.5 percent of students who obtained their Abitur at Gymnasien or Gesamtschulen in 2005 reached an average Abitur grade below 1.5 (A), 36 percent between 1.5 and 2.4 (B), 50 percent between 2.5 and 3.4 (C), and 9 percent below 3.4 (D/F) (Kultusministerkonferenz, 2006). Many differences may be responsible for these differences in distributions—parental reports vs. actual grades, grades in comprehensive schools vs. grades in the top-tier school type, average grades in primary and secondary school vs. final grade on high-school leaving certificate that determines entrance into university, among others. But the general shape of these distributions does resemble the different distributions of teacher grades in Figure 5. Still, this would make the results reported in Figure 3 even more astounding.
20
The difference in evaluations of local teachers may be associated in some way with salary
levels in the two countries. As discussed previously, German teachers are paid 25 percent to 50
percent higher salaries (depending on whether the teacher is at the primary or secondary level). If
teachers are that well paid, then the public may expect them to perform at a high level. If they are
not so well paid, less is expected of them.
Germans are also noticeably less willing to increase teacher compensation—either
because they think salaries are already high enough or because they think many teachers are
barely satisfactory. Both surveys included an experiment to test the effect of information about
actual salaries on support for raising them. Some respondents were randomly assigned to a
version that simply asks whether teacher salaries should increase, decrease, or remain about the
same as current levels. In the United States, 62 percent said that salaries should increase, while
only 29 percent said so in Germany (Figure 6). Other respondents were asked the same question,
but only after being told the actual average teacher salary in their state (in the U.S.) or
nationwide (Germany). In both countries, the share favoring salary increases fell, but Americans
(38 percent) remained more favorable than Germans (17 percent). Information had a larger
impact in reducing support for higher salaries in the U.S. than in Germany, but this may be due
to a “floor effect” given the relatively low level of support for higher salaries in Germany even
when no information was provided.
As a general matter, policies may follow opinions as much as opinions may follow
policies. In this case, however it is hard to argue that lower salary levels in the United States
stem from a greater preference for salary increases. That public opinion responds to differences
in current practice, on the other hand, provides a plausible explanation for differences between
the levels of support for salary increases observed in the two countries.
21
International Standing and Importance for Prosperity
Recent research confirms that the level at which a country’s students perform on
international tests of student achievement is a strong predictor of economic growth (see, for
instance, Hanushek and Woessmann, 2015). The German public’s strong reaction to the release
of the 2000 PISA results suggests that many citizens there consider it important that their
students perform well on these tests. Does the American public place similar weight on
international comparisons? And do citizens in Germany and America know how well their
countries rank internationally? To address these questions, we examined both (i) how well
informed the public is about student performance in their country and (ii) the importance they
place on their students’ achievement.
In the 2012 PISA tests, the math skills of 15-year-olds in the United States ranked 27th
out of 34 industrialized countries, though U.S. scores were statistically indistinguishable from
countries ranked from 22 to 29. German students occupied rank 10, though their scores did not
differ significantly from those in countries ranked 6 to 9 (although they did differ significantly
from those in all lower-ranked countries).
When asked where they thought their students ranked among other developed countries,
Germans gave a pessimistic ranking of 15 and Americans gave a slightly optimistic rank of 20.
Both estimates, while less than perfect, are not hopelessly off the mark. The median estimate
among U.S. respondents was just a couple notches ahead of the country’s highest possible true
ranking. While the German estimate was five ranks below its actual level, the public may not yet
have recognized the full extent of the recent improvements in Germany’s rankings. In the end,
Germans gave their schools a higher international rank than Americans did, and, as we have
seen, Germans gave higher evaluations of their nation’s schools than did Americans. Overall,
22
opinions are internally consistent and do not vary markedly from evidence obtained from official
international student assessments.
We also asked our survey participants to rate the importance of student achievement
levels, with four response options ranging from “not important at all” to “very important.” In
doing so, we randomly split both samples into three groups and administered the following three
questions about this topic:
A) In your opinion, how important is the academic performance of high school students for
America’s [Germany’s] future prosperity?
B) U.S. [German] students regularly participate in international achievement tests. In your
opinion, how important is it that our country performs well on these tests compared to
other countries?
C) U.S. [German] students regularly participate in international achievement tests. In your
opinion, how important is it for America’s [Germany’s] future prosperity that our country
performs well on these tests compared to other countries?
Notice that version A asks about the academic performance of high school students generally.
Versions B and C inquire specifically about student performance on international achievement
tests. Versions B and C differ in that only the latter asks about the importance of international
test performance for future prosperity.
An overwhelming majority of the public in both countries agrees with economic research
highlighting the importance of student achievement. On version A, no less than 97 percent in
each country said that the academic performance of high school students in general was “very”
or “somewhat” important for future prosperity (Figure 7). When student testing is introduced into
23
the question, public assessment of importance is somewhat lower, particularly in Germany. Still,
88 percent of Americans and 79 percent of Germans said that it was either very or somewhat
important that students perform well on international tests (version B). Roughly the same pattern
of responses emerged when respondents were asked version C of the question, which linked test
performance directly to future prosperity.
In sum, Americans, as compared to Germans, place somewhat more weight on
international achievement tests, perhaps because of their inferior performance or because they
lack other good quantitative indicators of student performance. In Germany, the examination
systems at the end of secondary school may provide Germans in most states with alternative
sources of information on the quality of their schools. Note that Germans, when asked about the
importance of academic performance without referring specifically to international tests, are no
less insistent than Americans about its importance for the country’s future prosperity.
Education Spending
Given the overwhelming recognition that schools are critical for a country’s prosperity, it
is worth investigating whether the public knows the cost of public education and whether it is
willing to support increases in public school expenditure. In each country, we direct our inquiry
to the respective level of government most relevant for school spending: the local school district
in the U.S. and the Land in Germany. To explore this topic we first asked respondents to estimate
the average yearly expenditure per student. The expenditure levels were seriously underestimated
in both countries: The median estimate in the United States was $3,000, only 24 percent of actual
spending levels of $12,400; the German median estimate of €1,500 was but 23 percent of actual
expenditure levels of €6,400.
24
Given these misperceptions of expenditure levels, providing the public with information
about actual spending may alter public thinking about the need to spend more (Peterson,
Henderson, and West, 2014; Schueler and West, 2015). To test this hypothesis, we randomly
split our samples into three groups, asking each group a different version of a question about
school expenditures. The first group of respondents was simply asked whether government
funding for public schools in their school district (U.S.) or nationally (Germany) should increase,
decrease, or stay about the same.9 In both countries, large majorities support higher levels of
government funding: 60 percent of Americans and 71 percent of Germans say funding should
increase (Figure 8).
Members of the second group of respondents were informed about current spending
levels per pupil in their school district (U.S.) or nationally (Germany) before answering the same
question as the first group. Providing this information reduced the level of support to 43 percent
in the United States and to 50 percent in Germany. The size of the effect of informing subjects
about current spending levels does not differ significantly across countries.
Even though information on current spending levels is important for deciding whether or
not to favor an increase in spending, it might still fail to highlight the underlying tradeoff that, in
the long run, government spending has to be financed with taxes. Therefore, the third group of
respondents was asked for their support for increasing taxes in order to fund public schools (in
addition to informing them about current spending levels). The effect of this slight change in
wording is large: Support for increasing spending declined to 26 percent in the United States and
to 30 percent in Germany. Again, the estimated treatment effects are homogeneous across
9 Respondents could choose one of the following five answer categories: greatly increase, increase, stay
about the same, decrease, and greatly decrease.
25
countries. Thus, respondents in both countries are less supportive of increasing spending for
schools if they are informed about current spending levels and reminded of the required tax
funding.
Inasmuch as actual spending levels are considerably higher in the United States, it is
surprising that informed Germans, reminded that expenditures require tax payments, are only
slightly more supportive of expenditure increases than are their American counterparts.10 In the
absence of this information and reminder, the proportion supporting expenditure increases is 11
percentage points higher in Germany. But perhaps because initial estimates were particularly
low, the shock of learning actual levels especially dampened support for increments.
Allocating Education Spending
In addition to comparing public support for spending increases, we also inquired about
the purposes for which new spending should be used. In particular, we performed an experiment
to ask respondents to choose between allocating new funds to one of three options: reducing
class sizes, increasing teacher pay, or purchasing new books and technologies for every class on
an annual basis. In one treatment condition, respondents were informed about the approximate
relative cost and return to the spending increase—i.e., that the additional spending would reduce
average class sizes by three students, increase teacher pay by 13 percent, or purchase $10,000 in
10 In the group with tax reference, the U.S.-German difference (30 percent vs. 26 percent) is only
marginally statistically significant at the 10 percent level. The difference captures statistical significance at 5 percent in a specification that controls for respondents’ gender, income, parental status, employment status, age, and education.
26
new books and technologies for each class each year.11 Participants in the other condition
received no additional information.
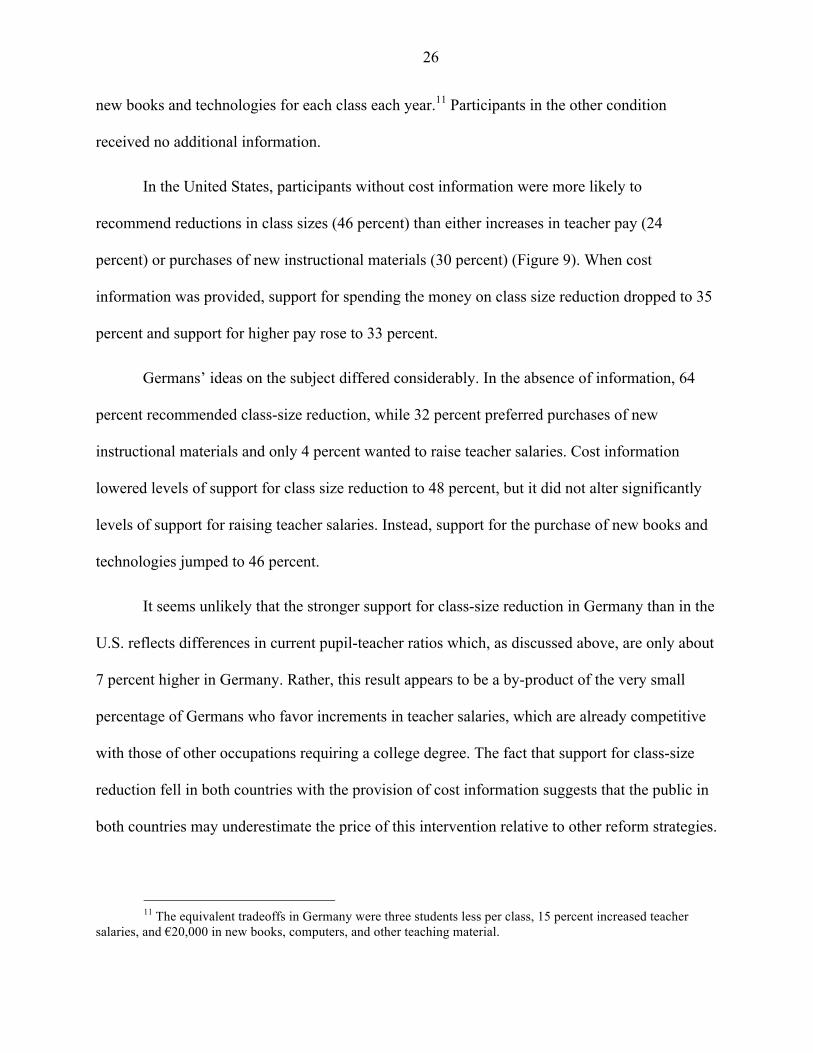
In the United States, participants without cost information were more likely to
recommend reductions in class sizes (46 percent) than either increases in teacher pay (24
percent) or purchases of new instructional materials (30 percent) (Figure 9). When cost
information was provided, support for spending the money on class size reduction dropped to 35
percent and support for higher pay rose to 33 percent.
Germans’ ideas on the subject differed considerably. In the absence of information, 64
percent recommended class-size reduction, while 32 percent preferred purchases of new
instructional materials and only 4 percent wanted to raise teacher salaries. Cost information
lowered levels of support for class size reduction to 48 percent, but it did not alter significantly
levels of support for raising teacher salaries. Instead, support for the purchase of new books and
technologies jumped to 46 percent.
It seems unlikely that the stronger support for class-size reduction in Germany than in the
U.S. reflects differences in current pupil-teacher ratios which, as discussed above, are only about
7 percent higher in Germany. Rather, this result appears to be a by-product of the very small
percentage of Germans who favor increments in teacher salaries, which are already competitive
with those of other occupations requiring a college degree. The fact that support for class-size
reduction fell in both countries with the provision of cost information suggests that the public in
both countries may underestimate the price of this intervention relative to other reform strategies.
11 The equivalent tradeoffs in Germany were three students less per class, 15 percent increased teacher
salaries, and €20,000 in new books, computers, and other teaching material.
27
Differential Pay
As well as being more supportive of increasing teacher pay, Americans—as compared to
Germans—are more favorably inclined toward proposals to pay some teachers more than others.
Both surveys included questions to examine support for making teacher salaries contingent on
how much their students learn, the subject they teach, and the school in which they teach.
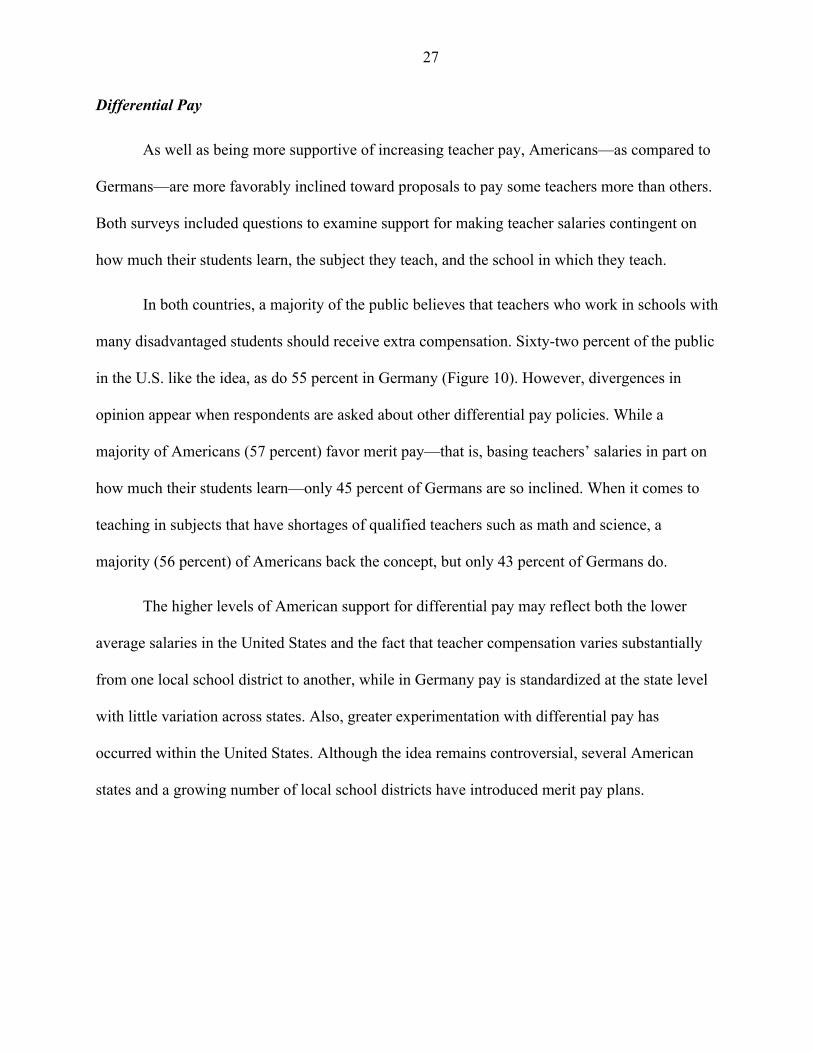
In both countries, a majority of the public believes that teachers who work in schools with
many disadvantaged students should receive extra compensation. Sixty-two percent of the public
in the U.S. like the idea, as do 55 percent in Germany (Figure 10). However, divergences in
opinion appear when respondents are asked about other differential pay policies. While a
majority of Americans (57 percent) favor merit pay—that is, basing teachers’ salaries in part on
how much their students learn—only 45 percent of Germans are so inclined. When it comes to
teaching in subjects that have shortages of qualified teachers such as math and science, a
majority (56 percent) of Americans back the concept, but only 43 percent of Germans do.
The higher levels of American support for differential pay may reflect both the lower
average salaries in the United States and the fact that teacher compensation varies substantially
from one local school district to another, while in Germany pay is standardized at the state level
with little variation across states. Also, greater experimentation with differential pay has
occurred within the United States. Although the idea remains controversial, several American
states and a growing number of local school districts have introduced merit pay plans.
28
Tenure
Both countries afford their teachers protection against dismissal. To assess support for
these protections, the surveys inquired about tenure practices in two different ways.12 After being
informed about current practices, a random half of respondents was simply asked whether they
favor or oppose giving tenure to teachers. Other respondents were asked the same question but
were first provided with an argument in support of tenure and an argument against it: “Some say
that tenure provides teachers with the necessary independence for their work. Others say it
makes it too difficult to replace ineffective teachers.”
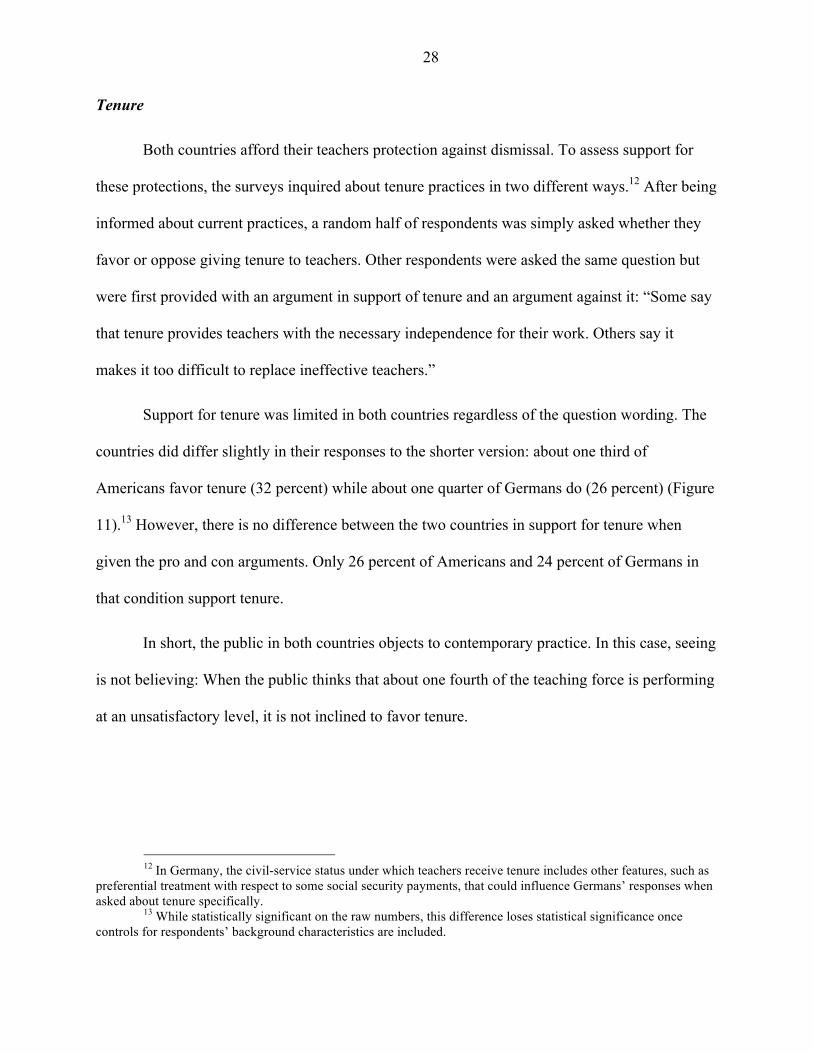
Support for tenure was limited in both countries regardless of the question wording. The
countries did differ slightly in their responses to the shorter version: about one third of
Americans favor tenure (32 percent) while about one quarter of Germans do (26 percent) (Figure
11).13 However, there is no difference between the two countries in support for tenure when
given the pro and con arguments. Only 26 percent of Americans and 24 percent of Germans in
that condition support tenure.
In short, the public in both countries objects to contemporary practice. In this case, seeing
is not believing: When the public thinks that about one fourth of the teaching force is performing
at an unsatisfactory level, it is not inclined to favor tenure.
12 In Germany, the civil-service status under which teachers receive tenure includes other features, such as
preferential treatment with respect to some social security payments, that could influence Germans’ responses when asked about tenure specifically.
13 While statistically significant on the raw numbers, this difference loses statistical significance once controls for respondents’ background characteristics are included.
29
Pre-school Education
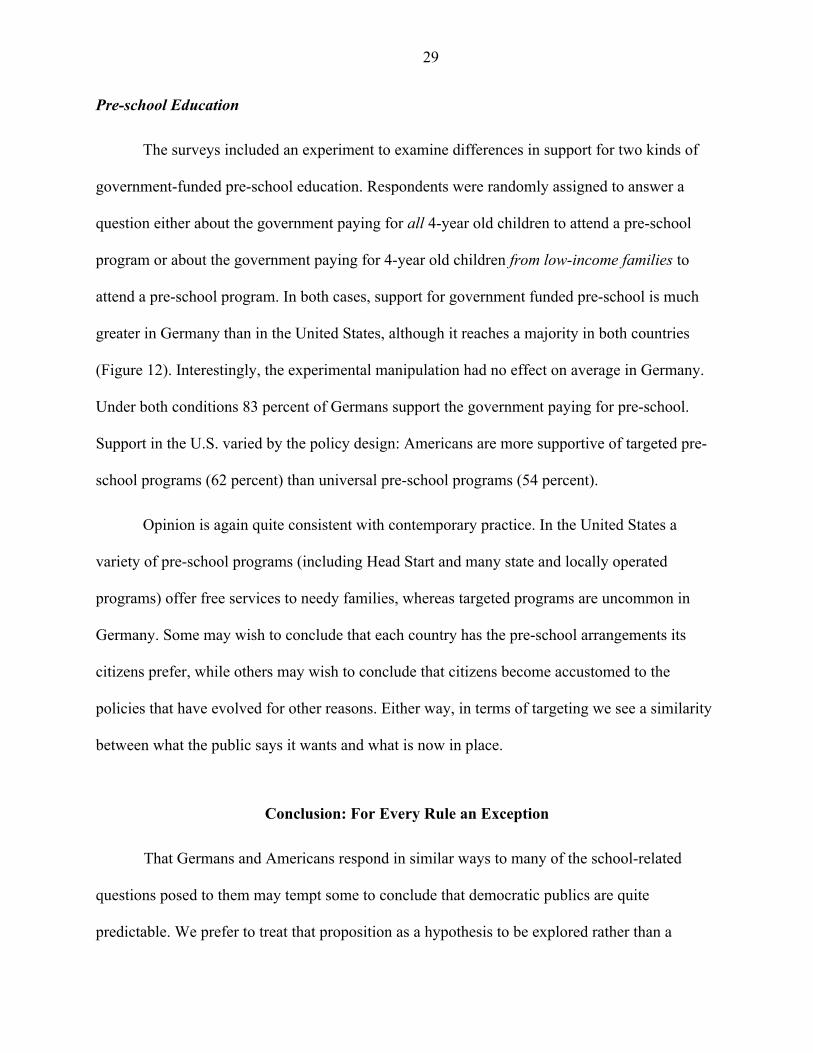
The surveys included an experiment to examine differences in support for two kinds of
government-funded pre-school education. Respondents were randomly assigned to answer a
question either about the government paying for all 4-year old children to attend a pre-school
program or about the government paying for 4-year old children from low-income families to
attend a pre-school program. In both cases, support for government funded pre-school is much
greater in Germany than in the United States, although it reaches a majority in both countries
(Figure 12). Interestingly, the experimental manipulation had no effect on average in Germany.
Under both conditions 83 percent of Germans support the government paying for pre-school.
Support in the U.S. varied by the policy design: Americans are more supportive of targeted pre-
school programs (62 percent) than universal pre-school programs (54 percent).
Opinion is again quite consistent with contemporary practice. In the United States a
variety of pre-school programs (including Head Start and many state and locally operated
programs) offer free services to needy families, whereas targeted programs are uncommon in
Germany. Some may wish to conclude that each country has the pre-school arrangements its
citizens prefer, while others may wish to conclude that citizens become accustomed to the
policies that have evolved for other reasons. Either way, in terms of targeting we see a similarity
between what the public says it wants and what is now in place.
Conclusion: For Every Rule an Exception
That Germans and Americans respond in similar ways to many of the school-related
questions posed to them may tempt some to conclude that democratic publics are quite
predictable. We prefer to treat that proposition as a hypothesis to be explored rather than a
30
conclusion to be reached. Yet it is striking that in the two largest democracies in the western
world the structure of public opinion had many congruencies. Consider the following:
1. Virtually all people believe that well-educated youth are critical for their country’s
future prosperity.
2. The public has a realistic understanding of the international standing of student
performance in its own country.
3. The more local the context in which schools are assessed, the more positive the
public’s evaluation.
4. School spending is estimated to be less than half of its actual level.
5. When told actual school spending—and when reminded that additional expenditure
must be paid for by taxes—the inclination to spend more drops dramatically.
6. When told current teacher salaries, the public’s enthusiasm for raising them
dissipates.
7. Class-size reduction loses its popularity once the public is told its sticker price.
8. Local schools are perceived as doing a better job of educating the more (as compared
to the less) talented, and the children of the more affluent (as compared to those of
low income).
9. A quarter of the teaching force is thought to be performing at an unsatisfactory level.
10. Strong majorities in both countries say that teachers should not be given tenure—that
is, they should not be given strong protections against dismissal.
Despite these broad similarities in the structure of German and American public opinion,
important contrasts have been identified as well, namely:
31
1. Germans think their country’s schools are of higher quality than Americans do, a
perception consistent with the results of international assessments.
2. Germans are less inclined than Americans to pay their teachers higher salaries, a
stance consistent with the better compensation German teachers currently enjoy.
3. Germans are less likely than Americans to give teachers at their local schools high
marks, a stance that is surprising given higher student performance in Germany—but
citizens may expect more from teachers when salaries are high and students must take
external curriculum-based exit examinations.
4. Germans as compared to Americans think schools do less well at teaching talented
students, a surprising finding in light of higher performance among more able
students in Germany—but one that may be understood in light of the country’s multi-
tiered secondary education system and its competitive external exit examinations.
5. Germans are more favorable to universal pre-school programs, while Americans are
more favorably disposed toward differential pay, stances consistent with current
practices in the two countries.
Is there a single overarching model that can hold all these observations together? The
strong effects of information on preferences related to school spending might tempt readers to
conclude that the public tends to lack important policy-relevant knowledge. Yet the way in
which citizens of the two countries evaluate the performance of their schools suggest that they
are quite well informed about educational outcomes, even if they are reluctant to admit that the
schools in their local communities may be less than stellar. Those high ratings assigned to local
schools, combined with their views on certain policy issues, may suggest a bias toward the status
quo—that citizens are inclined to believe that what they see is just fine. Yet the strong opposition
32
to teacher tenure in both countries suggests a pragmatism and openness to reform that may
extend well beyond the limited set of issues we were able to examine in a comparative way (for
additional country-specific results, see Henderson, Peterson, and West, 2015 and Woessmann et
al., 2014). Only as cross-country research on public opinion about education policy deepens in
these two countries and extends to others will we be able to learn which of these observations are
the exceptions and which are the rules.
33
References
Glenn, Charles (2002). Myth of the Common School. Amherst, MA: University of Massachusetts
Press.
Hanushek, Eric A., Paul E. Peterson, Ludger Woessmann (2013). Endangering Prosperity: A
Global View of the American School. Washington, D.C.: Brookings Institution Press.
Hanushek, Eric A., Ludger Woessmann (2015). The Knowledge Capital of Nations: Education
and the Economics of Growth. Cambridge, MA: MIT Press.
Henderson, Michael B., Paul E. Peterson, Martin R. West (2015). No common opinion on the
Common Core. Education Next 15 (1): 8-19.
Hoxby, Caroline M. (2003). What has changed and what has not. In: Our Schools and Our
Future: Are We Still at Risk? Paul E. Peterson, ed. Stanford, CA: Hoover Institution Press.
Kaestle, Carl F. (1983). Pillars of the Republic: Common Schools and American Society, 1780-
1860. New York, NY: Hill and Wang.
Konrad, Franz-Michael (2012). Geschichte der Schule – Von der Antike bis zur Gegenwart. 2.
Auflage. München: C.H. Beck.
Kultusministerkonferenz (2006). Abiturnoten an allgemein bildenden Gymnasien und integrier-
ten Gesamtschulen, Schuljahr 2004/2005. Bonn: Sekretariat der Ständigen Konferenz der
Kultusminister der Länder in der Bundesrepublik Deutschland, IVD/Statistik.
National Center for Education Statistics (2014). Digest of Education Statistics: 2014.
Washington, DC: U.S. Department of Education.
OECD (2013a). PISA 2012 Results: What Students Know and Can Do – Student Performance in
Mathematics, Reading and Science (Volume I). Paris: Organisation for Economic Co-
operation and Development.
34
OECD (2013b). Teachers’ salaries. Education: Key Tables from OECD, No. 1. DOI:
http://dx.doi.org/10.1787/teachsal-table-2013-1-en.
OECD (2014). Education at a Glance 2014: OECD Indicators. Paris: Organisation for Economic
Co-operation and Development.
Peterson, Paul E. (2010). Saving Schools: From Horace Mann to Virtual Learning. Cambridge,
MA: Belknap Press of Harvard University Press.
Peterson, Paul E., Michael Henderson, Martin R. West (2014). Teachers Versus the Public: What
Americans Think about their Schools and How to Fix Them. Washington, D.C.: Brookings
Institution Press.
Peterson, Paul E., Ludger Woessmann (2007). Introduction: Schools and the equal opportunity
problem. In: Schools and the Equal Opportunity Problem. Ludger Woessmann, Paul E.
Peterson, eds. Cambridge, MA: MIT Press, 3-28
Schueler Beth E., Martin R. West (2015). Sticker shock: How information affects citizen support
for public school funding. Public Opinion Quarterly, forthcoming.
U.S. Department of Education (2013). Preparing and Credentialing the Nation’s Teachers: The
Secretary’s Ninth Report on Teacher Quality. Washington, D.C.: Office of Postsecondary
Education.
U.S. Department of Education (2014). Digest of Education Statistics, 2013. Washington, D.C.:
National Center for Education Statistics.
Woessmann, Ludger, Philipp Lergetporer, Franziska Kugler, Katharina Werner (2014). Was die
Deutschen über die Bildungspolitik denken – Ergebnisse des ersten ifo
Bildungsbarometers. ifo Schnelldienst 67 (18): 16-33.
35
Methodological Appendix
The German Survey
The results presented for Germany are based on the responses of 4,171 adults (age 18
years and older). The stratified sample was drawn in order to represent the German general
population. The survey comprised 39 questions on education policy, including 12 questions
which were coordinated between the U.S. and Germany. Within the survey experiments, the
maximum number of different treatment conditions was four. The exact wording of each
question can be found at www.cesifo-group.de/ifo-bildungsbarometer.
The specific number of respondents in each question varies for two reasons: Item non-
response (1 percent, on average) and the fact that, in some questions, subgroups of respondents
were assigned to Germany-specific treatment conditions which are not presented here. Survey
weights were employed to assure representativeness. The margin of error for responses ranges
from roughly 1.5 percentage points for the full German sample to roughly 3 percentage points if
the sample is randomly divided into four equally sized subgroups (for questions on which
opinion is evenly split).
The survey was conducted between April and July 2014 by the polling firm TNS
Infratest. TNS Infratest has access to a nationally representative panel of adults and administered
random sampling in two steps: Persons with internet access at home (75 percent) were selected
from an online panel and polled with an online survey. Persons without internet access at home
(25 percent) were polled at their homes by trained interviewers. These persons were provided
with a tablet computer for completing the survey autonomously. When necessary, the interviewer
36
assisted with handling the device. Information about TNS Infratest is available online at
http://www.tns-infratest.com/SoFo/Expertise_EN.asp.
The U.S. Survey
The results from the American survey are based upon a nationally representative,
stratified sample of adults (age 18 years and older) and representative oversamples of the
following subgroups: public school teachers, African Americans, and Hispanics. Respondents
could elect to complete the survey in English or Spanish. The size of the sample available for
analysis depends on the question examined. Many of the questions discussed here were
embedded within an experiment designed to estimate the impact of information about local
student performance on evaluations of policy issues. In this experiment, respondents were
randomly assigned to one of two conditions: 1) a treatment condition in which information about
local student performance was provided and 2) a control condition in which no student
performance information was provided. For the purposes of this paper, we make use of the
responses from the sample of 2,269 respondents who were not provided information about the
performance of students in their local district. However, if the question was not included within
this experiment, we make use of the responses from the full sample of 5,266 respondents.
Questions in the latter group include the measure for importance of international tests and the
measure of spending preferences in the face of tradeoffs between increasing teacher pay,
reducing class size, and purchasing materials. The specific number of respondents varies from
question to question due to item nonresponse and to the fact that, in the cases of opinion about
school spending and teacher salary, we randomly divided the sample into multiple groups in
order to examine the effect of variations in the way questions were posed.
37
Survey weights were employed to account for nonresponse and the oversampling of
specific groups. The margin of error for responses given by the full sample in this survey is
roughly 1.5 percentage points and 2 percentage points for questions using the smaller sample.
The exact wording of each question is displayed at www.educationnext.org/edfacts.
The survey was conducted in May and June 2014 by the polling firm Knowledge
Networks (KN), a GfK company. KN maintains a nationally representative panel of adults,
obtained via address-based sampling and list-assisted random digit-dialing sampling techniques,
who agree to participate in a limited number of online surveys. Individuals who do not have
internet access are provided access by GfK. Detailed information about the maintenance of the
KN panel, the protocols used to administer surveys, and the comparability of online and
telephone surveys is available online at www.knowledgenetworks.com/quality/.
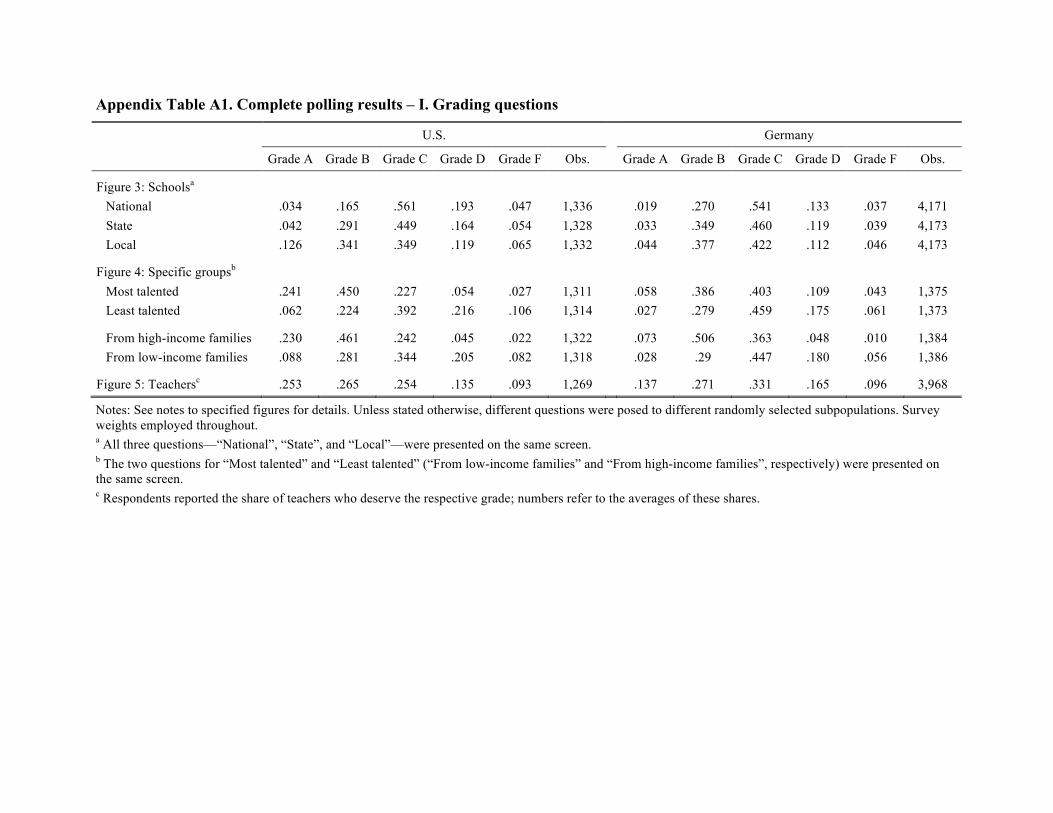
Appendix Table A1. Complete polling results – I. Grading questions
U.S. Germany
Grade A Grade B Grade C Grade D Grade F Obs. Grade A Grade B Grade C Grade D Grade F Obs.
Figure 3: Schoolsa
National .034 .165 .561 .193 .047 1,336 .019 .270 .541 .133 .037 4,171 State .042 .291 .449 .164 .054 1,328 .033 .349 .460 .119 .039 4,173 Local .126 .341 .349 .119 .065 1,332 .044 .377 .422 .112 .046 4,173
Figure 4: Specific groupsb
Most talented .241 .450 .227 .054 .027 1,311 .058 .386 .403 .109 .043 1,375
Least talented .062 .224 .392 .216 .106 1,314 .027 .279 .459 .175 .061 1,373
From high-income families .230 .461 .242 .045 .022 1,322 .073 .506 .363 .048 .010 1,384 From low-income families .088 .281 .344 .205 .082 1,318 .028 .29 .447 .180 .056 1,386
Figure 5: Teachersc .253 .265 .254 .135 .093 1,269 .137 .271 .331 .165 .096 3,968
Notes: See notes to specified figures for details. Unless stated otherwise, different questions were posed to different randomly selected subpopulations. Survey weights employed throughout. a All three questions—“National”, “State”, and “Local”—were presented on the same screen. b The two questions for “Most talented” and “Least talented” (“From low-income families” and “From high-income families”, respectively) were presented on the same screen. c Respondents reported the share of teachers who deserve the respective grade; numbers refer to the averages of these shares.
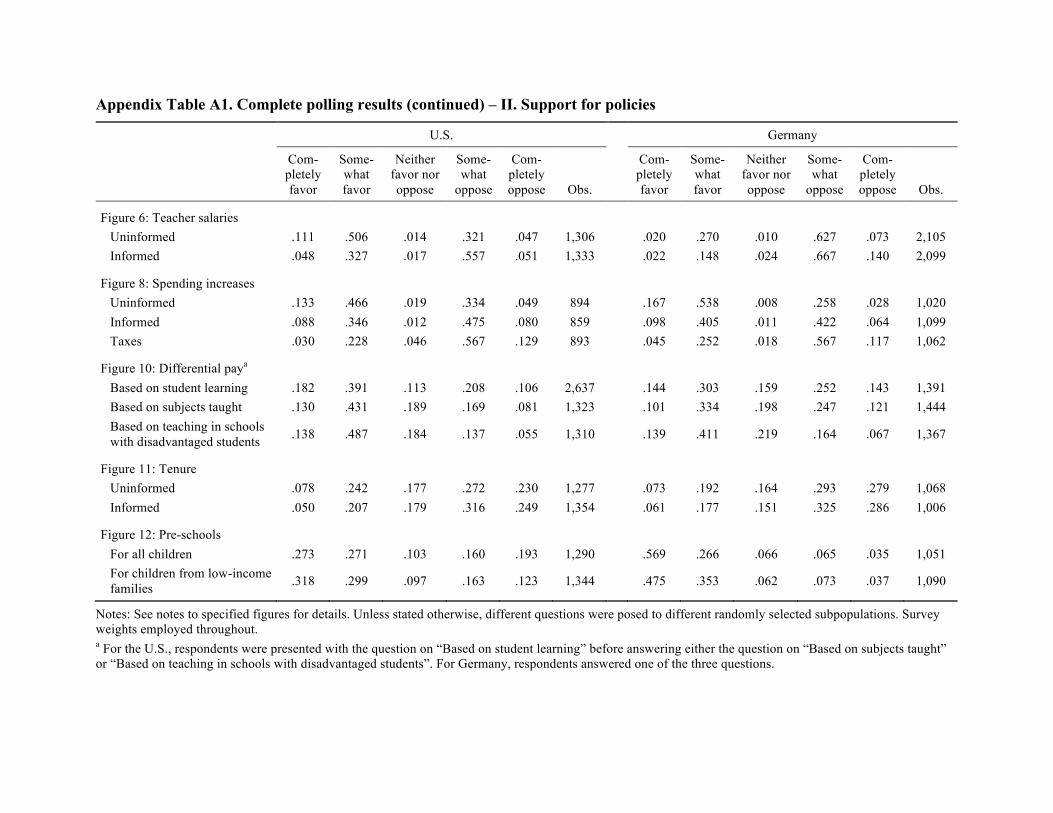
Appendix Table A1. Complete polling results (continued) – II. Support for policies
U.S. Germany
Com-pletely favor
Some-what favor
Neither favor nor oppose
Some-what
oppose
Com-pletely oppose Obs.
Com-pletely favor
Some-what favor
Neither favor nor oppose
Some-what
oppose
Com-pletely oppose Obs.
Figure 6: Teacher salaries
Uninformed .111 .506 .014 .321 .047 1,306 .020 .270 .010 .627 .073 2,105 Informed .048 .327 .017 .557 .051 1,333 .022 .148 .024 .667 .140 2,099
Figure 8: Spending increases
Uninformed .133 .466 .019 .334 .049 894 .167 .538 .008 .258 .028 1,020
Informed .088 .346 .012 .475 .080 859 .098 .405 .011 .422 .064 1,099 Taxes .030 .228 .046 .567 .129 893 .045 .252 .018 .567 .117 1,062
Figure 10: Differential paya Based on student learning .182 .391 .113 .208 .106 2,637 .144 .303 .159 .252 .143 1,391 Based on subjects taught .130 .431 .189 .169 .081 1,323 .101 .334 .198 .247 .121 1,444 Based on teaching in schools with disadvantaged students .138 .487 .184 .137 .055 1,310 .139 .411 .219 .164 .067 1,367
Figure 11: Tenure
Uninformed .078 .242 .177 .272 .230 1,277 .073 .192 .164 .293 .279 1,068
Informed .050 .207 .179 .316 .249 1,354 .061 .177 .151 .325 .286 1,006
Figure 12: Pre-schools
For all children .273 .271 .103 .160 .193 1,290 .569 .266 .066 .065 .035 1,051
For children from low-income families .318 .299 .097 .163 .123 1,344 .475 .353 .062 .073 .037 1,090
Notes: See notes to specified figures for details. Unless stated otherwise, different questions were posed to different randomly selected subpopulations. Survey weights employed throughout. a For the U.S., respondents were presented with the question on “Based on student learning” before answering either the question on “Based on subjects taught” or “Based on teaching in schools with disadvantaged students”. For Germany, respondents answered one of the three questions.
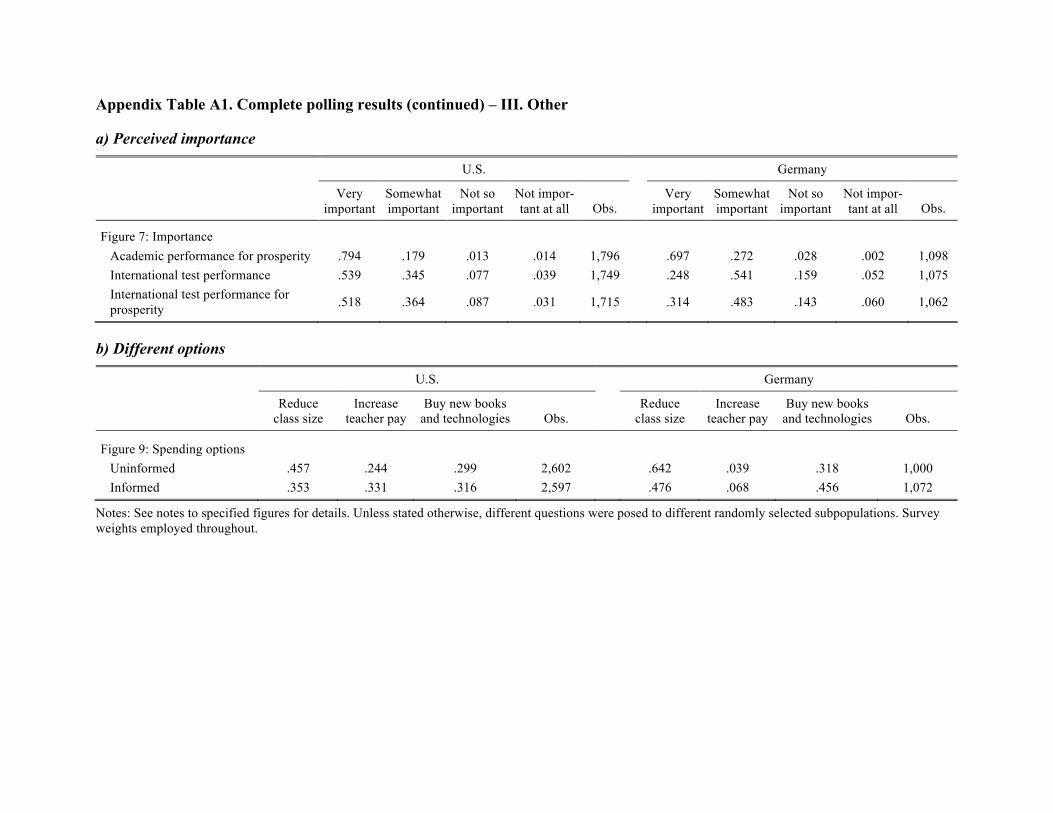
Appendix Table A1. Complete polling results (continued) – III. Other
a) Perceived importance
U.S. Germany
Very
important Somewhat important
Not so important
Not impor-tant at all Obs.
Very important
Somewhat important
Not so important
Not impor-tant at all Obs.
Figure 7: Importance Academic performance for prosperity .794 .179 .013 .014 1,796 .697 .272 .028 .002 1,098 International test performance .539 .345 .077 .039 1,749 .248 .541 .159 .052 1,075 International test performance for prosperity .518 .364 .087 .031 1,715 .314 .483 .143 .060 1,062
b) Different options
U.S. Germany
Reduce class size
Increase teacher pay
Buy new books and technologies Obs.
Reduce class size
Increase teacher pay
Buy new books and technologies Obs.
Figure 9: Spending options Uninformed .457 .244 .299 2,602 .642 .039 .318 1,000 Informed .353 .331 .316 2,597 .476 .068 .456 1,072
Notes: See notes to specified figures for details. Unless stated otherwise, different questions were posed to different randomly selected subpopulations. Survey weights employed throughout.
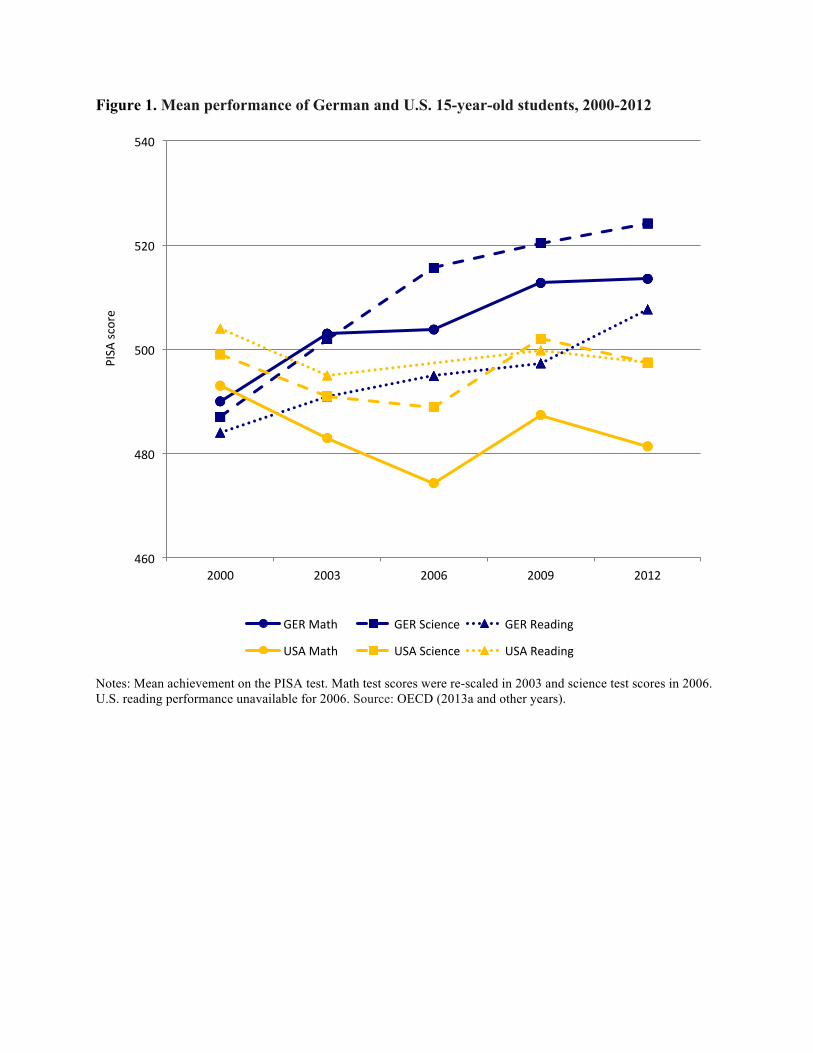
Figure 1. Mean performance of German and U.S. 15-year-old students, 2000-2012
Notes: Mean achievement on the PISA test. Math test scores were re-scaled in 2003 and science test scores in 2006. U.S. reading performance unavailable for 2006. Source: OECD (2013a and other years).
460
480
500
520
540
2000 2003 2006 2009 2012
PISA
score
GER Math GER Science GER Reading
USA Math USA Science USA Reading
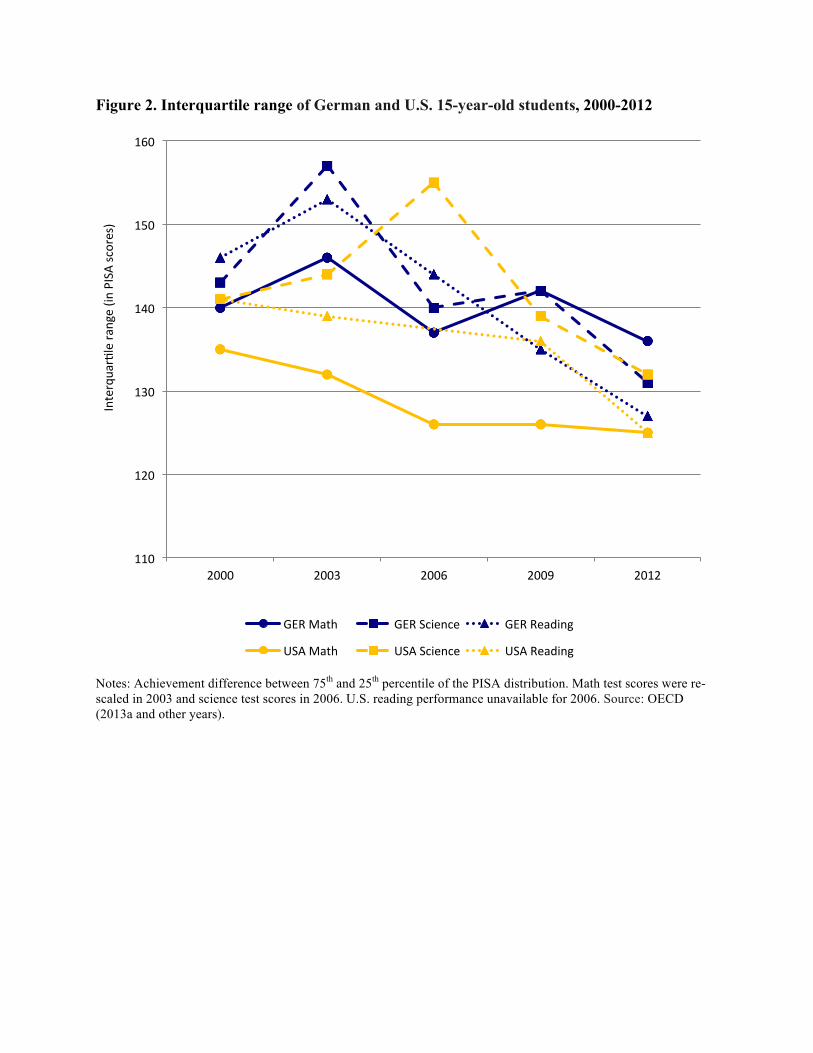
Figure 2. Interquartile range of German and U.S. 15-year-old students, 2000-2012
Notes: Achievement difference between 75th and 25th percentile of the PISA distribution. Math test scores were re-scaled in 2003 and science test scores in 2006. U.S. reading performance unavailable for 2006. Source: OECD (2013a and other years).
110
120
130
140
150
160
2000 2003 2006 2009 2012
InterquarBle ra
nge (in
PISA scores)
GER Math GER Science GER Reading
USA Math USA Science USA Reading
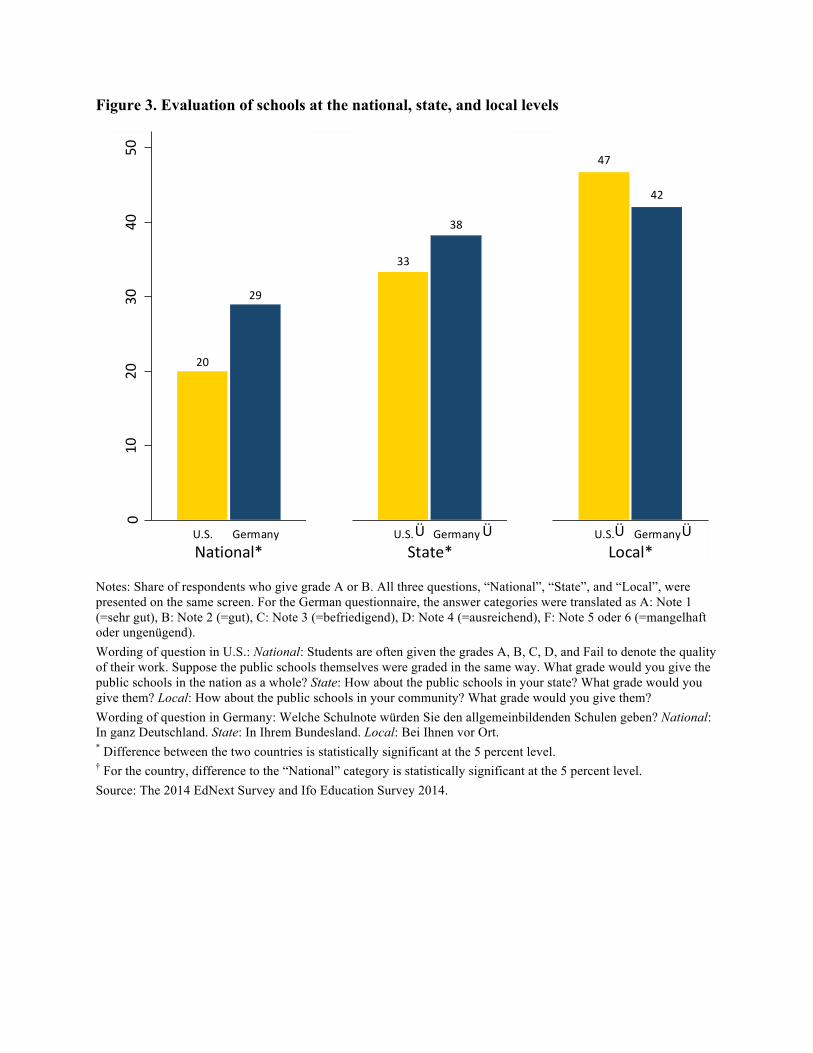
Figure 3. Evaluation of schools at the national, state, and local levels
Notes: Share of respondents who give grade A or B. All three questions, “National”, “State”, and “Local”, were presented on the same screen. For the German questionnaire, the answer categories were translated as A: Note 1 (=sehr gut), B: Note 2 (=gut), C: Note 3 (=befriedigend), D: Note 4 (=ausreichend), F: Note 5 oder 6 (=mangelhaft oder ungenügend). Wording of question in U.S.: National: Students are often given the grades A, B, C, D, and Fail to denote the quality of their work. Suppose the public schools themselves were graded in the same way. What grade would you give the public schools in the nation as a whole? State: How about the public schools in your state? What grade would you give them? Local: How about the public schools in your community? What grade would you give them? Wording of question in Germany: Welche Schulnote würden Sie den allgemeinbildenden Schulen geben? National: In ganz Deutschland. State: In Ihrem Bundesland. Local: Bei Ihnen vor Ort. * Difference between the two countries is statistically significant at the 5 percent level. † For the country, difference to the “National” category is statistically significant at the 5 percent level. Source: The 2014 EdNext Survey and Ifo Education Survey 2014.
20
29
010
2030
4050
Percen
t assigning grade
A or B
U.S. GermanyNational*
33
38
010
2030
4050
U.S. GermanyState*Ü Ü
47
42
010
2030
4050
U.S. GermanyLocal*Ü Ü
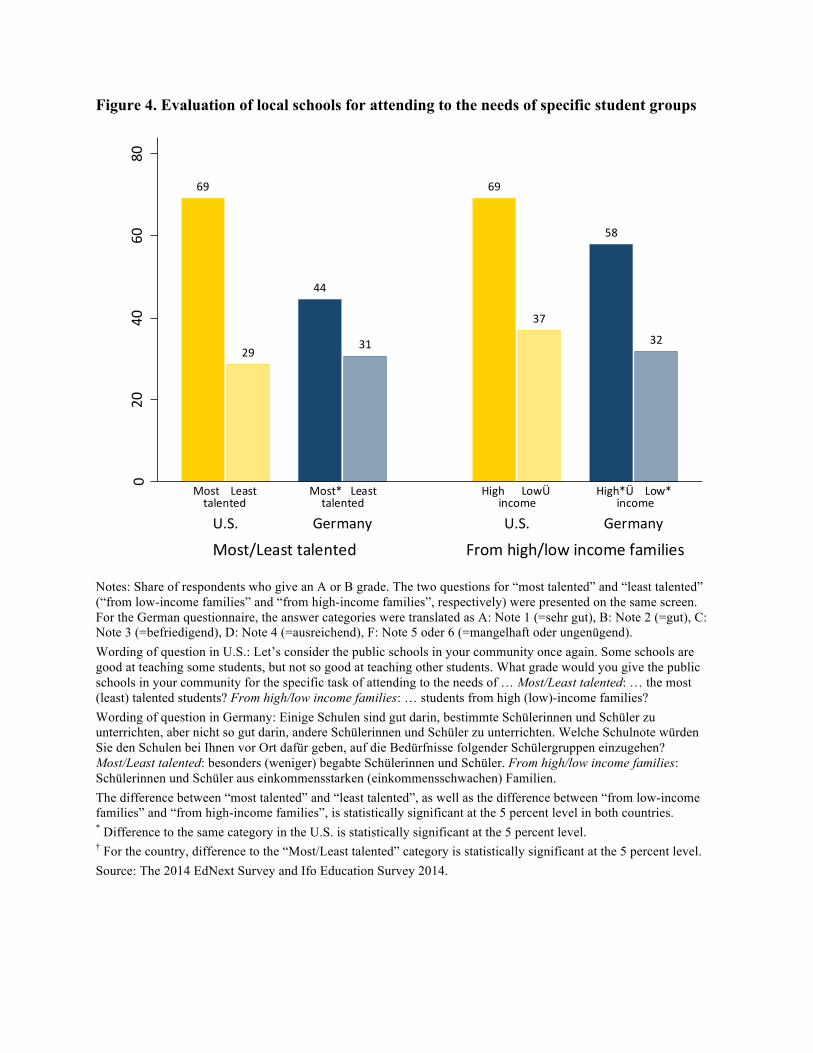
Figure 4. Evaluation of local schools for attending to the needs of specific student groups
Notes: Share of respondents who give an A or B grade. The two questions for “most talented” and “least talented” (“from low-income families” and “from high-income families”, respectively) were presented on the same screen. For the German questionnaire, the answer categories were translated as A: Note 1 (=sehr gut), B: Note 2 (=gut), C: Note 3 (=befriedigend), D: Note 4 (=ausreichend), F: Note 5 oder 6 (=mangelhaft oder ungenügend). Wording of question in U.S.: Let’s consider the public schools in your community once again. Some schools are good at teaching some students, but not so good at teaching other students. What grade would you give the public schools in your community for the specific task of attending to the needs of … Most/Least talented: … the most (least) talented students? From high/low income families: … students from high (low)-income families? Wording of question in Germany: Einige Schulen sind gut darin, bestimmte Schülerinnen und Schüler zu unterrichten, aber nicht so gut darin, andere Schülerinnen und Schüler zu unterrichten. Welche Schulnote würden Sie den Schulen bei Ihnen vor Ort dafür geben, auf die Bedürfnisse folgender Schülergruppen einzugehen? Most/Least talented: besonders (weniger) begabte Schülerinnen und Schüler. From high/low income families: Schülerinnen und Schüler aus einkommensstarken (einkommensschwachen) Familien. The difference between “most talented” and “least talented”, as well as the difference between “from low-income families” and “from high-income families”, is statistically significant at the 5 percent level in both countries. * Difference to the same category in the U.S. is statistically significant at the 5 percent level. † For the country, difference to the “Most/Least talented” category is statistically significant at the 5 percent level. Source: The 2014 EdNext Survey and Ifo Education Survey 2014.
69
29
44
31
69
37
58
32
Most Leasttalented
Most* Leasttalented
High LowÜincome
High*Ü Low*income
020
4060
80
Percen
t assigning grade
A or B
Most/Least talented From high/low income familiesU.S. Germany U.S. Germany
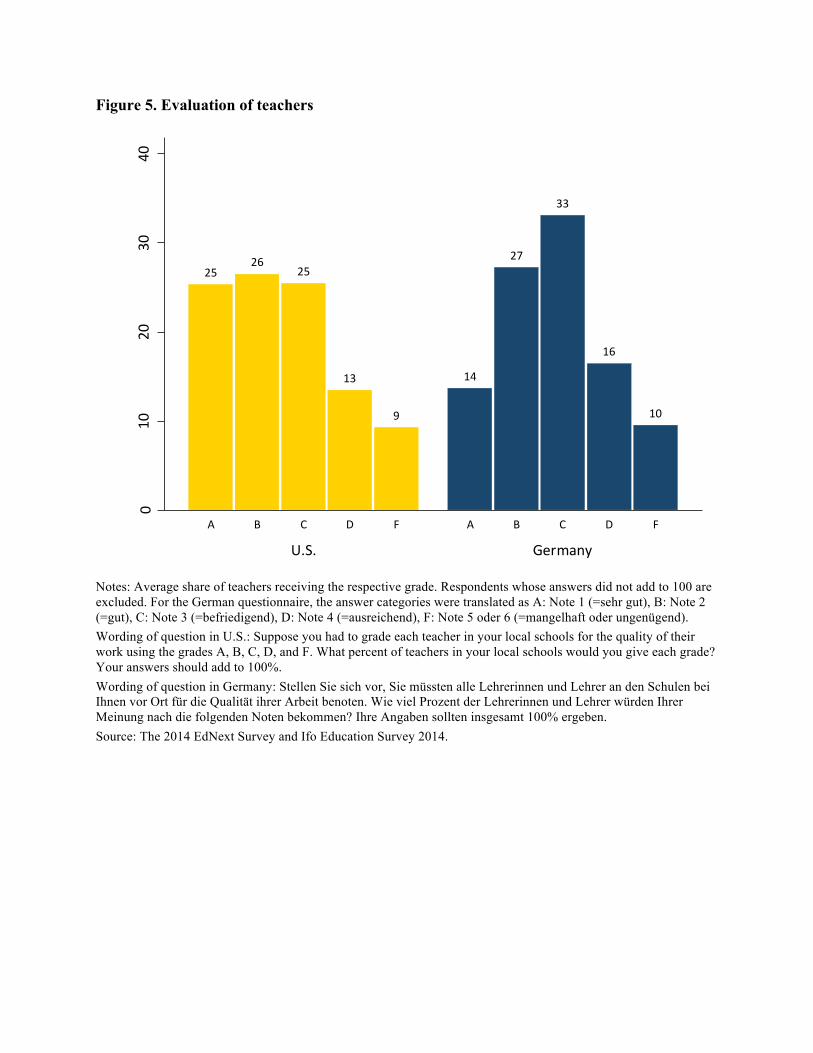
Figure 5. Evaluation of teachers
Notes: Average share of teachers receiving the respective grade. Respondents whose answers did not add to 100 are excluded. For the German questionnaire, the answer categories were translated as A: Note 1 (=sehr gut), B: Note 2 (=gut), C: Note 3 (=befriedigend), D: Note 4 (=ausreichend), F: Note 5 oder 6 (=mangelhaft oder ungenügend). Wording of question in U.S.: Suppose you had to grade each teacher in your local schools for the quality of their work using the grades A, B, C, D, and F. What percent of teachers in your local schools would you give each grade? Your answers should add to 100%. Wording of question in Germany: Stellen Sie sich vor, Sie müssten alle Lehrerinnen und Lehrer an den Schulen bei Ihnen vor Ort für die Qualität ihrer Arbeit benoten. Wie viel Prozent der Lehrerinnen und Lehrer würden Ihrer Meinung nach die folgenden Noten bekommen? Ihre Angaben sollten insgesamt 100% ergeben. Source: The 2014 EdNext Survey and Ifo Education Survey 2014.
2526
25
13
9
14
27
33
16
10
010
2030
40
Mean of sh
are assig
ned each grade
U.S. Germany
A B C D F A B C D F
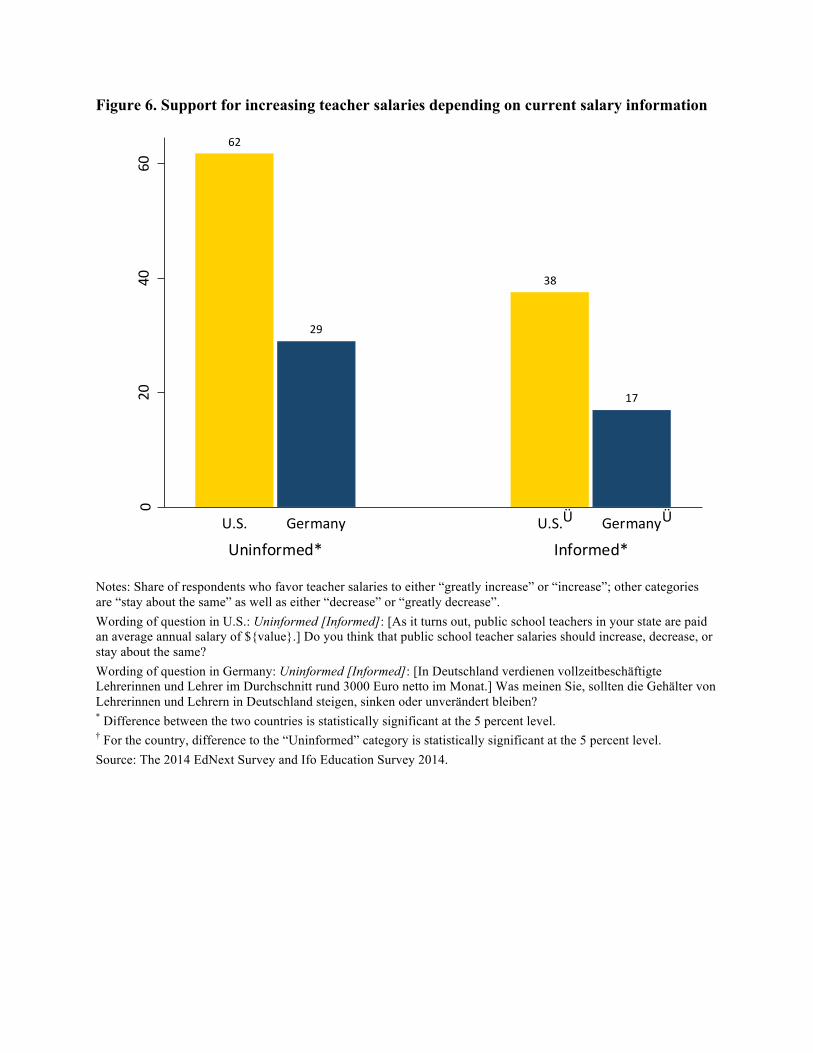
Figure 6. Support for increasing teacher salaries depending on current salary information
Notes: Share of respondents who favor teacher salaries to either “greatly increase” or “increase”; other categories are “stay about the same” as well as either “decrease” or “greatly decrease”. Wording of question in U.S.: Uninformed [Informed]: [As it turns out, public school teachers in your state are paid an average annual salary of ${value}.] Do you think that public school teacher salaries should increase, decrease, or stay about the same? Wording of question in Germany: Uninformed [Informed]: [In Deutschland verdienen vollzeitbeschäftigte Lehrerinnen und Lehrer im Durchschnitt rund 3000 Euro netto im Monat.] Was meinen Sie, sollten die Gehälter von Lehrerinnen und Lehrern in Deutschland steigen, sinken oder unverändert bleiben? * Difference between the two countries is statistically significant at the 5 percent level. † For the country, difference to the “Uninformed” category is statistically significant at the 5 percent level. Source: The 2014 EdNext Survey and Ifo Education Survey 2014.
62
29
38
17
020
4060
Percen
t favoring increase
Uninformed* Informed*U.S. Germany U.S. GermanyÜ Ü
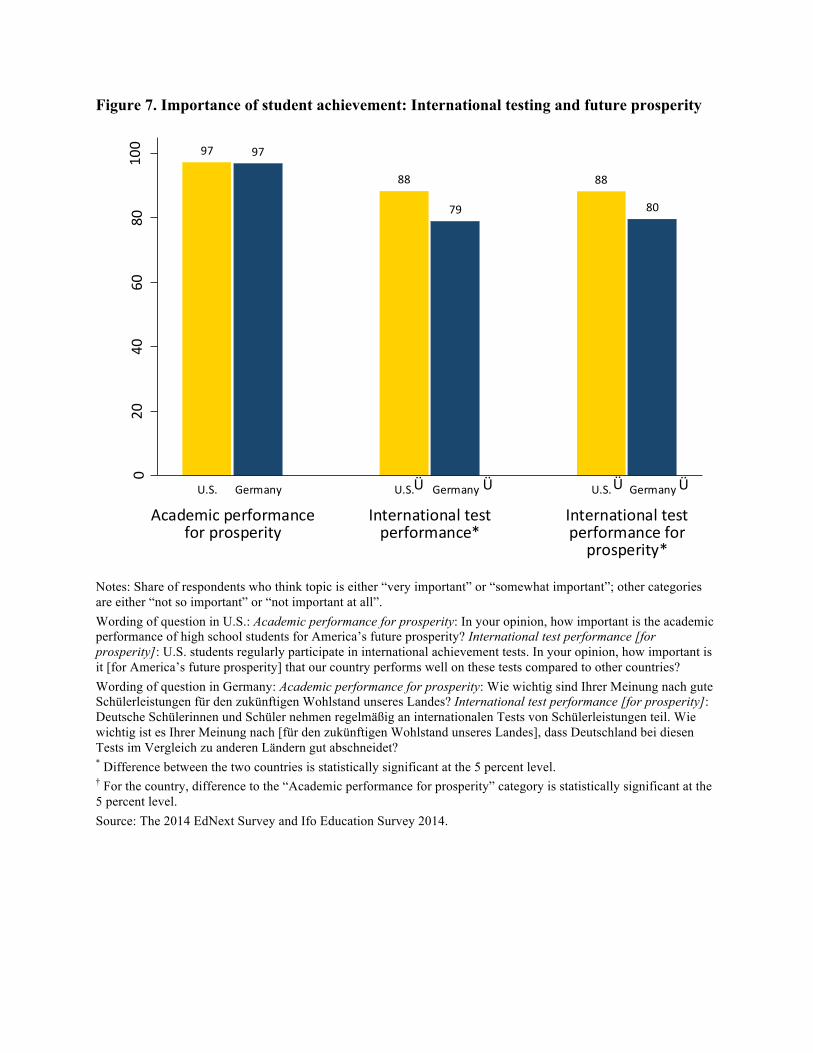
Figure 7. Importance of student achievement: International testing and future prosperity
Notes: Share of respondents who think topic is either “very important” or “somewhat important”; other categories are either “not so important” or “not important at all”. Wording of question in U.S.: Academic performance for prosperity: In your opinion, how important is the academic performance of high school students for America’s future prosperity? International test performance [for prosperity]: U.S. students regularly participate in international achievement tests. In your opinion, how important is it [for America’s future prosperity] that our country performs well on these tests compared to other countries? Wording of question in Germany: Academic performance for prosperity: Wie wichtig sind Ihrer Meinung nach gute Schülerleistungen für den zukünftigen Wohlstand unseres Landes? International test performance [for prosperity]: Deutsche Schülerinnen und Schüler nehmen regelmäßig an internationalen Tests von Schülerleistungen teil. Wie wichtig ist es Ihrer Meinung nach [für den zukünftigen Wohlstand unseres Landes], dass Deutschland bei diesen Tests im Vergleich zu anderen Ländern gut abschneidet? * Difference between the two countries is statistically significant at the 5 percent level. † For the country, difference to the “Academic performance for prosperity” category is statistically significant at the 5 percent level. Source: The 2014 EdNext Survey and Ifo Education Survey 2014.
97 97
88
79
88
80
020
4060
8010
0
Percen
t assigning im
portan
ce
Academic performancefor prosperity
International testperformance*
International testperformance forprosperity*
U.S. Germany U.S. Germany U.S. GermanyÜ Ü Ü Ü
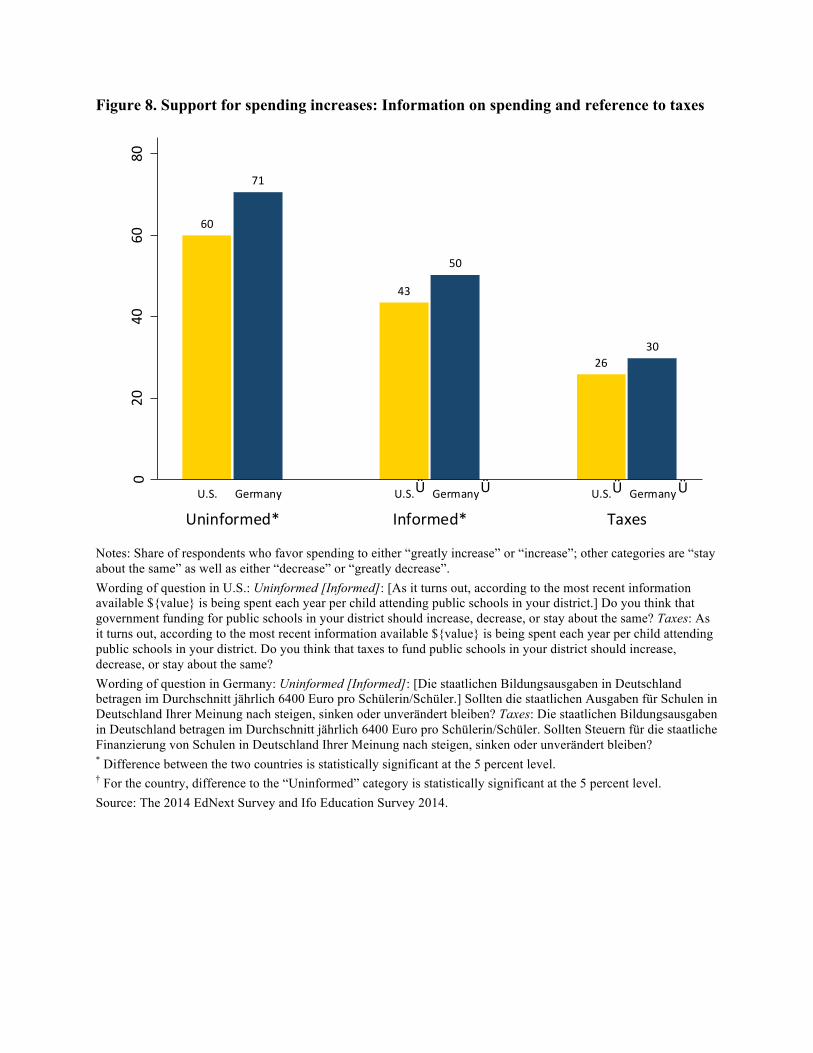
Figure 8. Support for spending increases: Information on spending and reference to taxes
Notes: Share of respondents who favor spending to either “greatly increase” or “increase”; other categories are “stay about the same” as well as either “decrease” or “greatly decrease”. Wording of question in U.S.: Uninformed [Informed]: [As it turns out, according to the most recent information available ${value} is being spent each year per child attending public schools in your district.] Do you think that government funding for public schools in your district should increase, decrease, or stay about the same? Taxes: As it turns out, according to the most recent information available ${value} is being spent each year per child attending public schools in your district. Do you think that taxes to fund public schools in your district should increase, decrease, or stay about the same? Wording of question in Germany: Uninformed [Informed]: [Die staatlichen Bildungsausgaben in Deutschland betragen im Durchschnitt jährlich 6400 Euro pro Schülerin/Schüler.] Sollten die staatlichen Ausgaben für Schulen in Deutschland Ihrer Meinung nach steigen, sinken oder unverändert bleiben? Taxes: Die staatlichen Bildungsausgaben in Deutschland betragen im Durchschnitt jährlich 6400 Euro pro Schülerin/Schüler. Sollten Steuern für die staatliche Finanzierung von Schulen in Deutschland Ihrer Meinung nach steigen, sinken oder unverändert bleiben? * Difference between the two countries is statistically significant at the 5 percent level. † For the country, difference to the “Uninformed” category is statistically significant at the 5 percent level. Source: The 2014 EdNext Survey and Ifo Education Survey 2014.
60
71
43
50
2630
020
4060
80
Percen
t favoring increase
Uninformed* Informed* TaxesU.S. Germany U.S. Germany U.S. Germany
Ü Ü Ü Ü
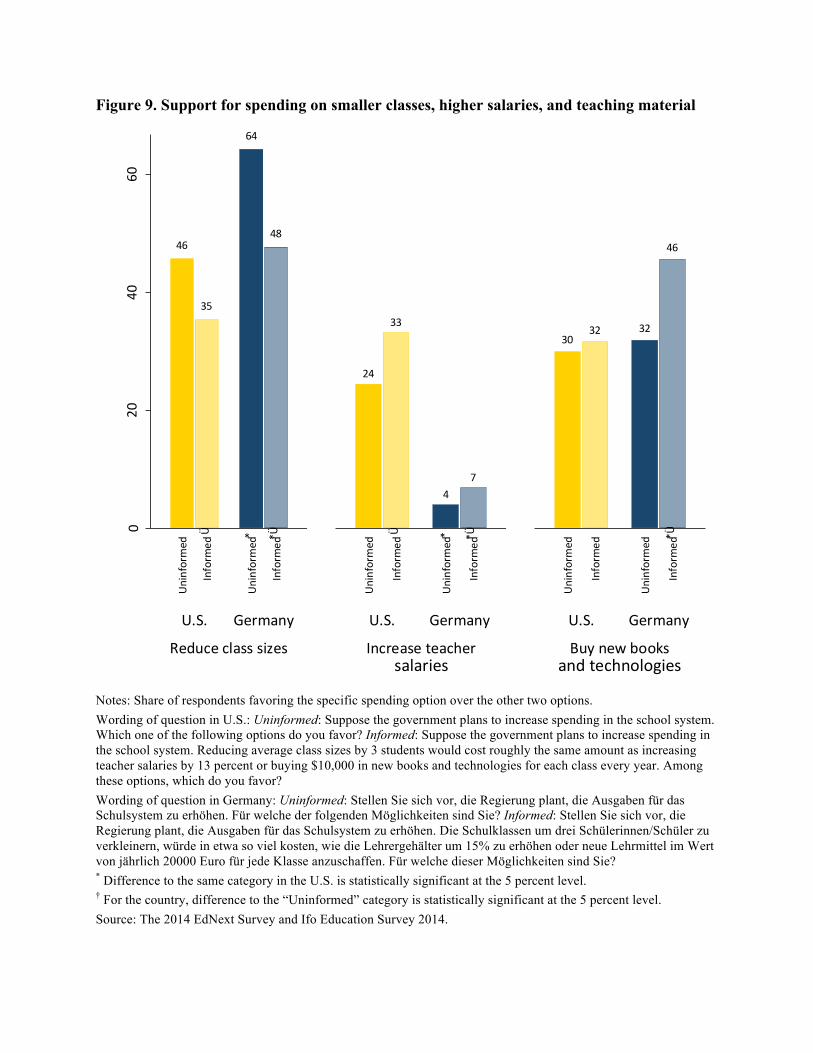
Figure 9. Support for spending on smaller classes, higher salaries, and teaching material
Notes: Share of respondents favoring the specific spending option over the other two options. Wording of question in U.S.: Uninformed: Suppose the government plans to increase spending in the school system. Which one of the following options do you favor? Informed: Suppose the government plans to increase spending in the school system. Reducing average class sizes by 3 students would cost roughly the same amount as increasing teacher salaries by 13 percent or buying $10,000 in new books and technologies for each class every year. Among these options, which do you favor? Wording of question in Germany: Uninformed: Stellen Sie sich vor, die Regierung plant, die Ausgaben für das Schulsystem zu erhöhen. Für welche der folgenden Möglichkeiten sind Sie? Informed: Stellen Sie sich vor, die Regierung plant, die Ausgaben für das Schulsystem zu erhöhen. Die Schulklassen um drei Schülerinnen/Schüler zu verkleinern, würde in etwa so viel kosten, wie die Lehrergehälter um 15% zu erhöhen oder neue Lehrmittel im Wert von jährlich 20000 Euro für jede Klasse anzuschaffen. Für welche dieser Möglichkeiten sind Sie? * Difference to the same category in the U.S. is statistically significant at the 5 percent level. † For the country, difference to the “Uninformed” category is statistically significant at the 5 percent level. Source: The 2014 EdNext Survey and Ifo Education Survey 2014.
46
35
64
48
020
4060
Percen
t in favor
U.S. Germany
Uninformed
Inform
ed
Uninformed
Inform
ed
Reduce class sizes
* *ÜÜ
24
33
47
020
4060
U.S. Germany
Uninformed
Inform
ed
Uninformed
Inform
ed
Increase teachersalaries
* *ÜÜ
3032 32
46
020
4060
U.S. Germany
Uninformed
Inform
ed
Uninformed
Inform
ed
Buy new booksand technologies
*Ü
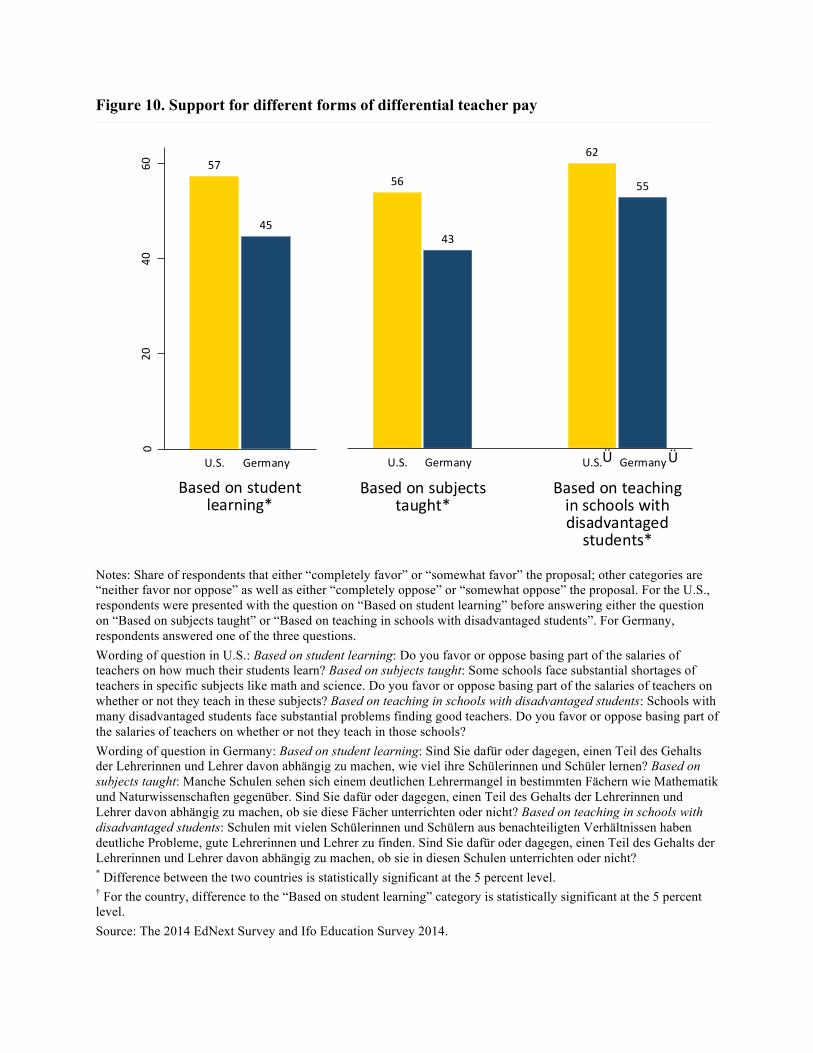
Figure 10. Support for different forms of differential teacher pay
Notes: Share of respondents that either “completely favor” or “somewhat favor” the proposal; other categories are “neither favor nor oppose” as well as either “completely oppose” or “somewhat oppose” the proposal. For the U.S., respondents were presented with the question on “Based on student learning” before answering either the question on “Based on subjects taught” or “Based on teaching in schools with disadvantaged students”. For Germany, respondents answered one of the three questions. Wording of question in U.S.: Based on student learning: Do you favor or oppose basing part of the salaries of teachers on how much their students learn? Based on subjects taught: Some schools face substantial shortages of teachers in specific subjects like math and science. Do you favor or oppose basing part of the salaries of teachers on whether or not they teach in these subjects? Based on teaching in schools with disadvantaged students: Schools with many disadvantaged students face substantial problems finding good teachers. Do you favor or oppose basing part of the salaries of teachers on whether or not they teach in those schools? Wording of question in Germany: Based on student learning: Sind Sie dafür oder dagegen, einen Teil des Gehalts der Lehrerinnen und Lehrer davon abhängig zu machen, wie viel ihre Schülerinnen und Schüler lernen? Based on subjects taught: Manche Schulen sehen sich einem deutlichen Lehrermangel in bestimmten Fächern wie Mathematik und Naturwissenschaften gegenüber. Sind Sie dafür oder dagegen, einen Teil des Gehalts der Lehrerinnen und Lehrer davon abhängig zu machen, ob sie diese Fächer unterrichten oder nicht? Based on teaching in schools with disadvantaged students: Schulen mit vielen Schülerinnen und Schülern aus benachteiligten Verhältnissen haben deutliche Probleme, gute Lehrerinnen und Lehrer zu finden. Sind Sie dafür oder dagegen, einen Teil des Gehalts der Lehrerinnen und Lehrer davon abhängig zu machen, ob sie in diesen Schulen unterrichten oder nicht? * Difference between the two countries is statistically significant at the 5 percent level. † For the country, difference to the “Based on student learning” category is statistically significant at the 5 percent level. Source: The 2014 EdNext Survey and Ifo Education Survey 2014.
57
45
020
4060
Percen
t in favor
U.S. Germany
Based on studentlearning*
56
43
62
55
Based on subjectstaught*
Based on teachingin schools withdisadvantagedstudents*
U.S. Germany U.S. GermanyÜ Ü
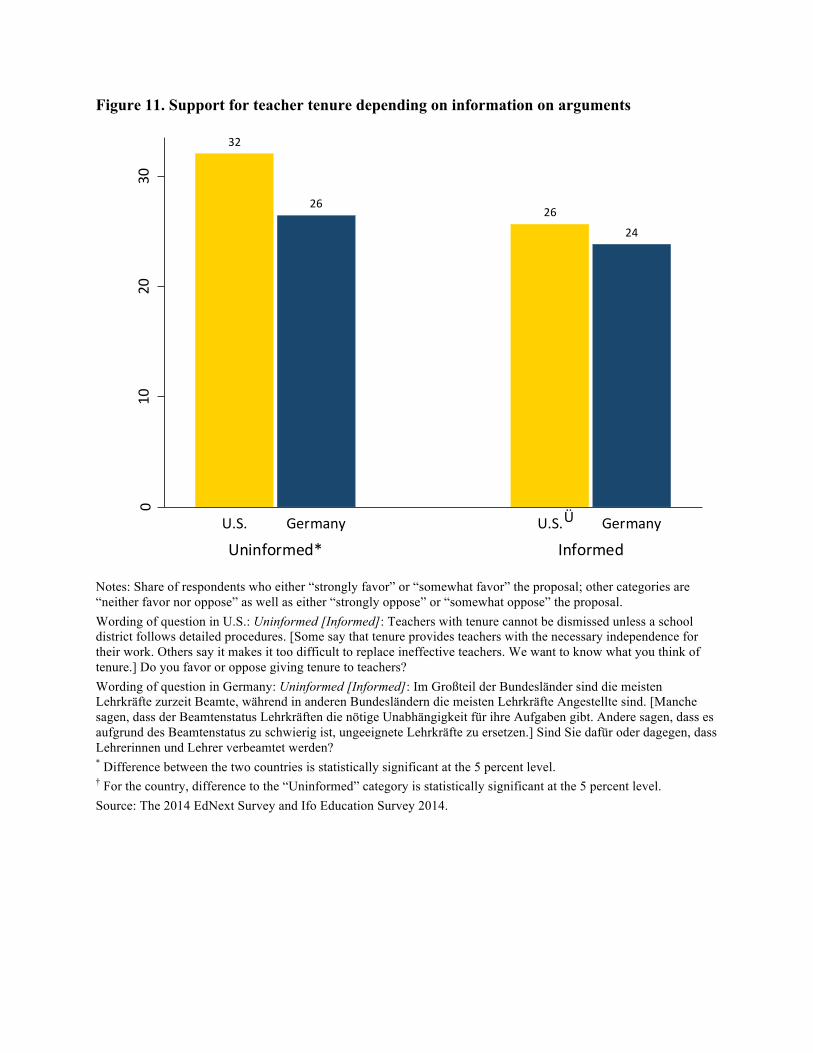
Figure 11. Support for teacher tenure depending on information on arguments
Notes: Share of respondents who either “strongly favor” or “somewhat favor” the proposal; other categories are “neither favor nor oppose” as well as either “strongly oppose” or “somewhat oppose” the proposal. Wording of question in U.S.: Uninformed [Informed]: Teachers with tenure cannot be dismissed unless a school district follows detailed procedures. [Some say that tenure provides teachers with the necessary independence for their work. Others say it makes it too difficult to replace ineffective teachers. We want to know what you think of tenure.] Do you favor or oppose giving tenure to teachers? Wording of question in Germany: Uninformed [Informed]: Im Großteil der Bundesländer sind die meisten Lehrkräfte zurzeit Beamte, während in anderen Bundesländern die meisten Lehrkräfte Angestellte sind. [Manche sagen, dass der Beamtenstatus Lehrkräften die nötige Unabhängigkeit für ihre Aufgaben gibt. Andere sagen, dass es aufgrund des Beamtenstatus zu schwierig ist, ungeeignete Lehrkräfte zu ersetzen.] Sind Sie dafür oder dagegen, dass Lehrerinnen und Lehrer verbeamtet werden? * Difference between the two countries is statistically significant at the 5 percent level. † For the country, difference to the “Uninformed” category is statistically significant at the 5 percent level. Source: The 2014 EdNext Survey and Ifo Education Survey 2014.
32
2626
24
010
2030
Percen
t in favor
Uninformed* InformedU.S. Germany U.S. GermanyÜ
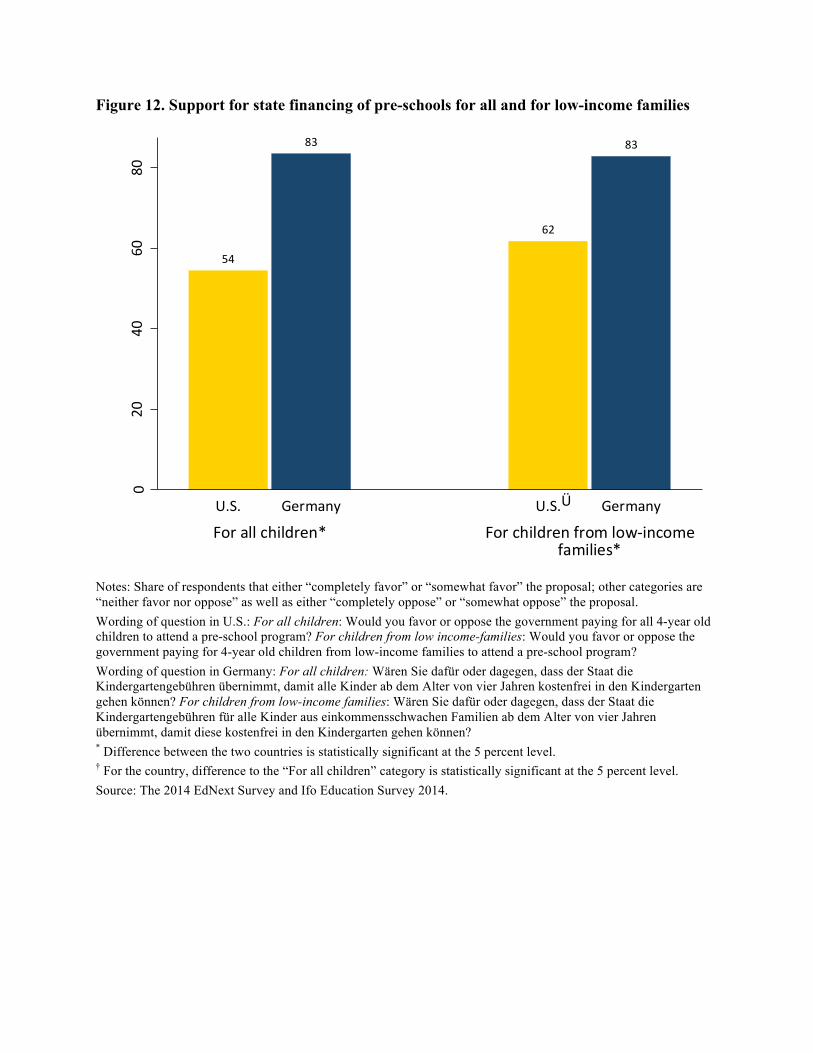
Figure 12. Support for state financing of pre-schools for all and for low-income families
Notes: Share of respondents that either “completely favor” or “somewhat favor” the proposal; other categories are “neither favor nor oppose” as well as either “completely oppose” or “somewhat oppose” the proposal. Wording of question in U.S.: For all children: Would you favor or oppose the government paying for all 4-year old children to attend a pre-school program? For children from low income-families: Would you favor or oppose the government paying for 4-year old children from low-income families to attend a pre-school program? Wording of question in Germany: For all children: Wären Sie dafür oder dagegen, dass der Staat die Kindergartengebühren übernimmt, damit alle Kinder ab dem Alter von vier Jahren kostenfrei in den Kindergarten gehen können? For children from low-income families: Wären Sie dafür oder dagegen, dass der Staat die Kindergartengebühren für alle Kinder aus einkommensschwachen Familien ab dem Alter von vier Jahren übernimmt, damit diese kostenfrei in den Kindergarten gehen können? * Difference between the two countries is statistically significant at the 5 percent level. † For the country, difference to the “For all children” category is statistically significant at the 5 percent level. Source: The 2014 EdNext Survey and Ifo Education Survey 2014.
54
83
62
830
2040
6080
Percen
t in favor
For all children* For children from low-‐incomefamilies*
U.S. Germany U.S. GermanyÜ